
Abstract
Objective:
The objective of the study is to identify predictors of utilization of a type 2 diabetes (T2D) management App over time for insulin users (IUs) and noninsulin users (NIUs).
Research Design and Methods:
We followed over 16 weeks a national sample of unselected T2D adults who independently elected to download and pair a CONTOUR DIABETES App with their CONTOUR NEXT ONE glucose meter. App use and frequency of glucose testing were recorded. Baseline surveys recorded participant demographic, disease status, distress, medication taking, and views of technology to predict utilization.
Results:
Mean age was 51.6 years (108 IUs; 353 NIUs), 48% were female, time with diabetes was 6.9 years, and self-reported HbA1c was 8.1% (36.3 mmol/mol). Mean duration of App use was 85.4 days and 40% stopped using the App before 16 weeks. Continuous users were older and reported higher distress, better medication taking, and more positive attitudes toward technology (all P < .01). IUs tested more frequently than NIUs, but frequency and intensity of testing decreased markedly for both groups over time. More predictors of App use frequency and testing occurred for NIUs than IUs: older age, higher HbA1c, lower distress, more medication taking (all P < .05).
Conclusions:
App use and testing decreased markedly over time. Variations in the predictors of frequency of App use suggest that the utilization of mobile technologies requires a tailored approach that addresses the specific needs of individual users, compared with adopting a one-size-fits-all strategy, and that IUs and NIUs may require very different strategies of customization.
Introduction
In recent years, there has been a dramatic increase in efforts to assist people with diabetes to improve self-management and glycemic outcomes through the use of smart phone technologies and related applications (hereafter “Apps”).1-3 Although many have been shown to be clinically effective in clinical trials, the extant literature also highlights recurring problems:4,5 frequent drop-outs, brief length of use with initial gains lost over time, and adopters tend to be young, educated, female, with high health literacy, high self-efficacy, and who initially report low levels of HbA1c, among others.5-9 Furthermore, most evaluations of App use and effectiveness are undertaken in controlled settings with selected samples that do not reflect actual use in the real world of diabetes care and management. 5 These findings may indicate that these technologies, even if some are efficacious in clinical trials, may have limited usefulness in the real world of diabetes—for example, use maintained for short time periods and only for subsets of the type 2 diabetes (T2D) population.
The Real-World Evidence of Diabetes App Use in Daily Life study (REALL) was designed to address these issues by following over 16 weeks a community-based, national sample of unselected adults with T2D who on their own had elected to download and pair the publicly available CONTOUR DIABETES App with their CONTOUR NEXT ONE glucose meter to assist with glucose monitoring and self-management.
In this report, we ask the following research questions: First, what are the demographic and baseline disease-related characteristics of an unselected group of adults with T2D who elected to use a glucose monitoring App on their own? Second, what is their pattern of App use over time? Third, what are the linkages between demographic and disease-related factors and patterns of App use?
Methods
From March to July 2020, all adults in the United States who paired their CONTOUR NEXT ONE meter with the available CONTOUR DIABETES App were invited to participate. Inclusion criteria were a self-reported diagnosis of T2D for at least 12 months; use of oral medications, noninsulin injectables or insulin; ability to read English; residency in the United States; and age 21 or older. Individuals were excluded if they reported current use of a continuous glucose monitoring device, had experience with the App prior to receiving an invitation to participate in the study, did not log at least one glucose reading, or did not complete the baseline survey.
Participants completed an online informed consent and an online survey at baseline within four weeks after pairing their App. Glucose data recorded on the monitor were then manually uploaded using the App over the succeeding 16 weeks. Participants could then view their glucose data over time through pattern recognition displays and other formats. The App also allowed tracking of a variety of user-entered disease management information that could be combined with their glucose data for review in an integrated form, for example, medication taking, exercise, and carbohydrate consumption. Participants received an electronic gift card or check for $25 at completion of the survey. The study received Human Subjects approval from Advarra Institutional Review Board (IRB).
Measures
Demographic characteristics included age, gender, education (less than high school, high school, some college, four-year college graduate, graduate degree), ethnicity (non-Hispanic white/ nonwhite), years with diabetes, current insulin use (yes/no), employment status (yes/no), and most recent self-reported HbA1c. Also assessed were attitudes toward use of health-related technology with the five-item Diabetes-Specific Attitudes about Technology scale (α = .91). 10 Items were rated on a five-point scale from strongly disagree to strongly agree and summed for a total score.
Three measures of App use and two measures of glucose testing were calculated: duration of App use (number of days from initial to final App use during the 16-week study), frequency of App use (total number of times the App was used during a participant’s use period), intensity of App use (average number of App use per week—that is, total frequency divided by duration, in weeks), frequency of glucose testing (number of glucose tests during a participant’s use period), and intensity of glucose testing (average number of glucose tests per week—frequency divided by duration, in weeks). Note that the App could be used to observe glucose trend lines and to record and follow other management data, as entered manually, without uploading additional glucose data. Hence, although related, App use and glucose testing reflect somewhat different activities.
Also included were the five-item Regimen Distress (RD) (α = .90) and the five-item Emotional Burden (EB) (α = .88) subscales of the Diabetes Distress Scale, 11 and medication taking was assessed by a modification of the seven-item Hill-Bone Medication Adherence Scale (α = .78). Items were scored on a four-point scale from none of the time to all of the time and the total score is the sum of the items, with higher scores reflecting poorer medication taking. 12
Statistical Analyses
Descriptive statistics (N, %, mean, standard deviation [SD]) addressed demographic and diabetes-related characteristics, patterns of App use, and frequency of glucose testing for the total sample and separately for insulin users (IUs) and noninsulin users (NIUs). Independent-sample t tests (for continuous variables) and χ2 (for dichotomous variables) examined differences between IUs and NIUs. Some distributions revealed slight deviations from normality. However, as no substantive differences in findings occurred when nonparametric methods were employed, means and standard deviations are presented for ease of interpretation.
Bivariate correlation analyses examined the associations between demographic and diabetes-related characteristics with patterns of App use and glucose testing. Finally, selected predictors that exhibited consistent bivariate associations with App use and glucose testing were entered into multiple linear regression analyses for IUs and NIUs. Predictors were entered simultaneously as one block. IBM SPSS Statistics 25 was used for all analyses.
Results
A total of 461 (n = 108 IUs, n = 353 NIUs) adults with T2D linked their meter with the App during the invitation period and met inclusion criteria (Table 1). Average age was 51.6 (11.6) years, 48% were female, average time with T2D was 6.9 (7.9) years, and average self-reported HbA1c was 8.1% (2.0) (mmol/mol = 65 [8.9]). IUs had T2D significantly longer, were more likely to be employed for wages, and reported a significantly higher HbA1c than NIUs (all P < .001). When asked how they came to use the App, 46% said they did so because it “came with their meter,” 30% sought it out on their own, 15% had the App recommended to them, and 10% for other reasons.
Participant Characteristics (N = 461).
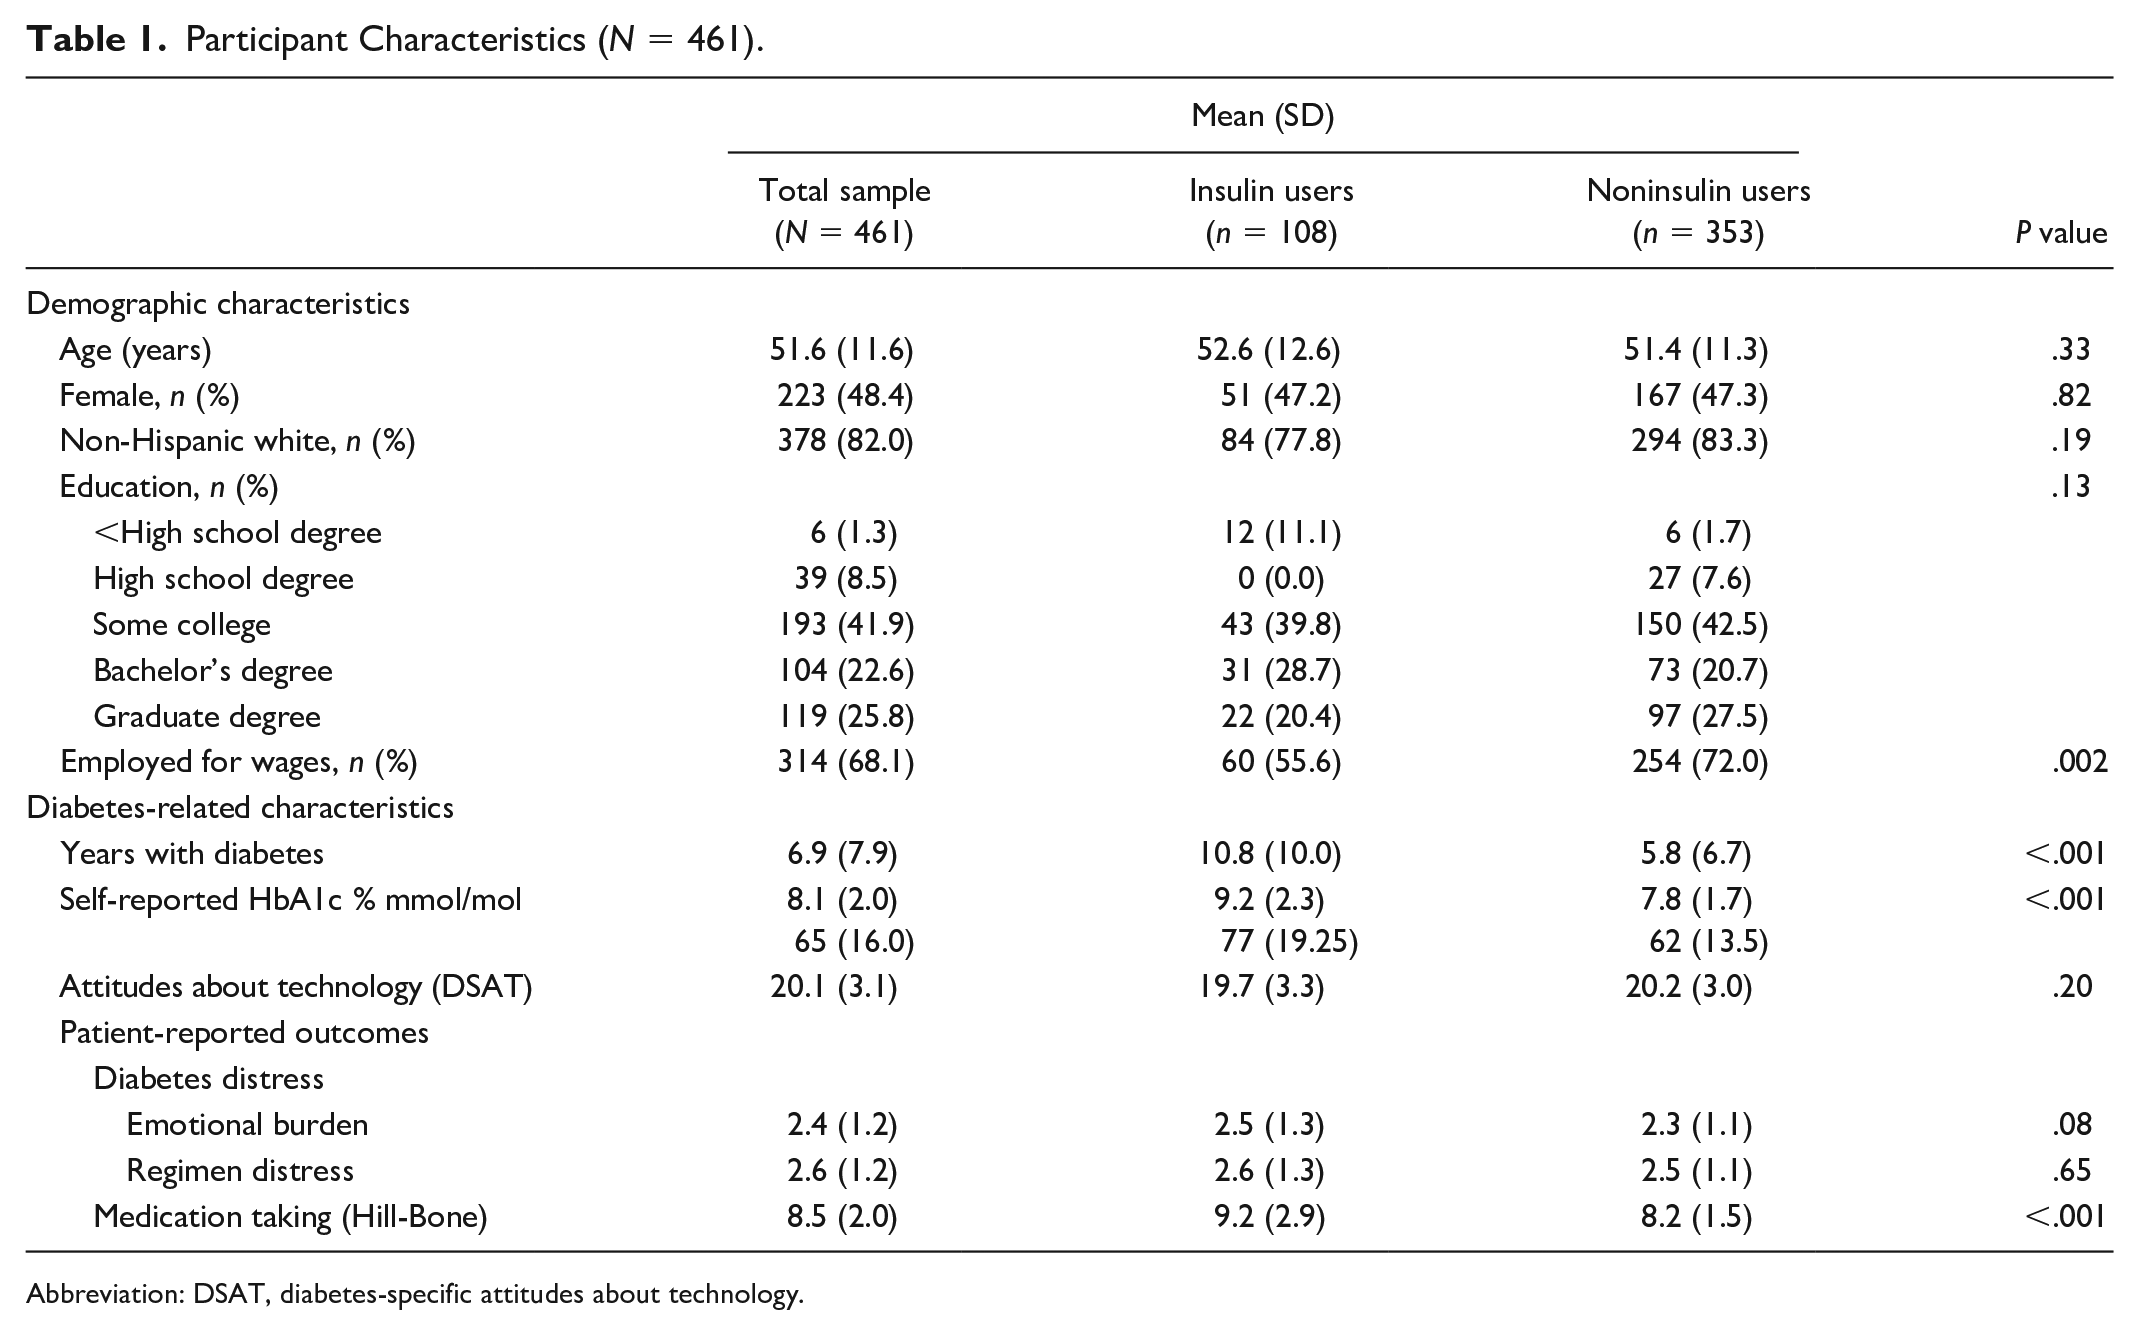
Abbreviation: DSAT, diabetes-specific attitudes about technology.
App Use
The average number of days between first and last App use was 85.4 (38.0) (about 12 weeks), with no significant differences between IUs and NIUs. The majority of participants (59.2%) were still using the App at the conclusion of the study (Table 2). Comparing those who continued to use the App with those who stopped, “continuers” were older (53.6 [11.6] vs 48.8 [1.1] years; P < .001) and reported lower baseline levels of EB (2.3 [1.1] vs 2.5 [1.1]; P = .007) and RD (2.4 [1.1] vs 2.7 [1.2]; P = .012), better medication taking (8.2 [1.9] vs 8.9 [2.1], P < .001), and more positive attitudes toward technology (20.4 [3.0] vs 19.5 [3.2], P = .002).
Patterns of Use (N = 461).
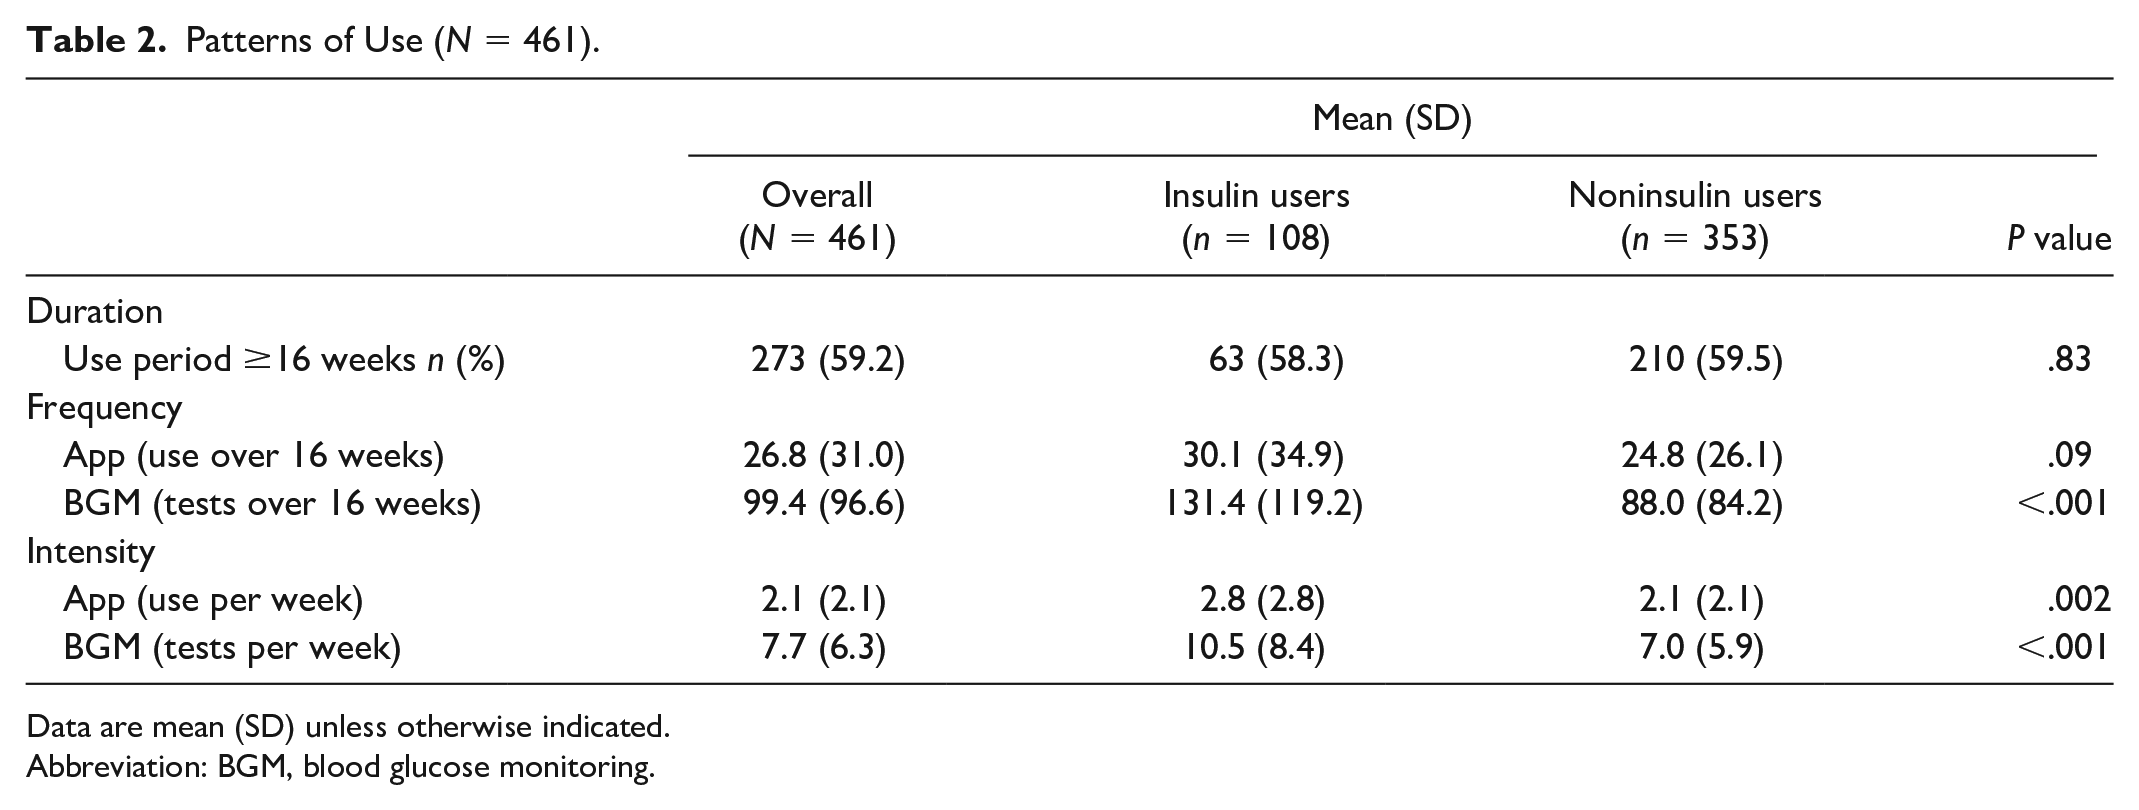
Data are mean (SD) unless otherwise indicated.
Abbreviation: BGM, blood glucose monitoring.
Frequency of App use varied from one to 171 times over the 16 weeks, with an average of 26.8 (31.0), with no significant differences between IUs and NIUs. Intensity of App use ranged from less than once per week to 23.1 times per week, with IUs using the App significantly more frequently than NIUs (P = .002). Overall, there was considerable variation in duration, intensity, and frequency of App use across the study period with differences based on participant characteristics (Table 2).
Glucose Testing
The average number of glucose tests across participants’ use period was 99.4 (96.6), with IUs testing significantly more frequently than NIUs (131 [119.2] vs 88.0 [84.2], P < .001) (Table 2). For both groups, those who used the App more frequently tested more often: the correlation between App use and testing was r = .63 (IUs: r = .67, NIUs: r = .61; all P < .001). Average intensity of testing was 7.7 (6.3) times per week, with IUs (10.5 [8.4]) testing significantly more intensively than NIUs (7.0 [5.9]) (P < .001). Overall, there was considerable variation in the frequency and intensity of glucose testing across the study period among participants.
Behavioral Markings
A majority (67%) of the sample did not record manually any medication taking, physical activity, or dietary intake with the App: only 9% entered this information more than five times during their entire use period. Hence, this feature of the App was infrequently used and was not analyzed further.
Patterns of App Use and Glucose Testing Over Time
The number of participants using the App decreased dramatically over time from baseline to 16 weeks (Figure 1): 100% of participants used the App at least once during the first week, but only about 60% continued using the App at week 16.
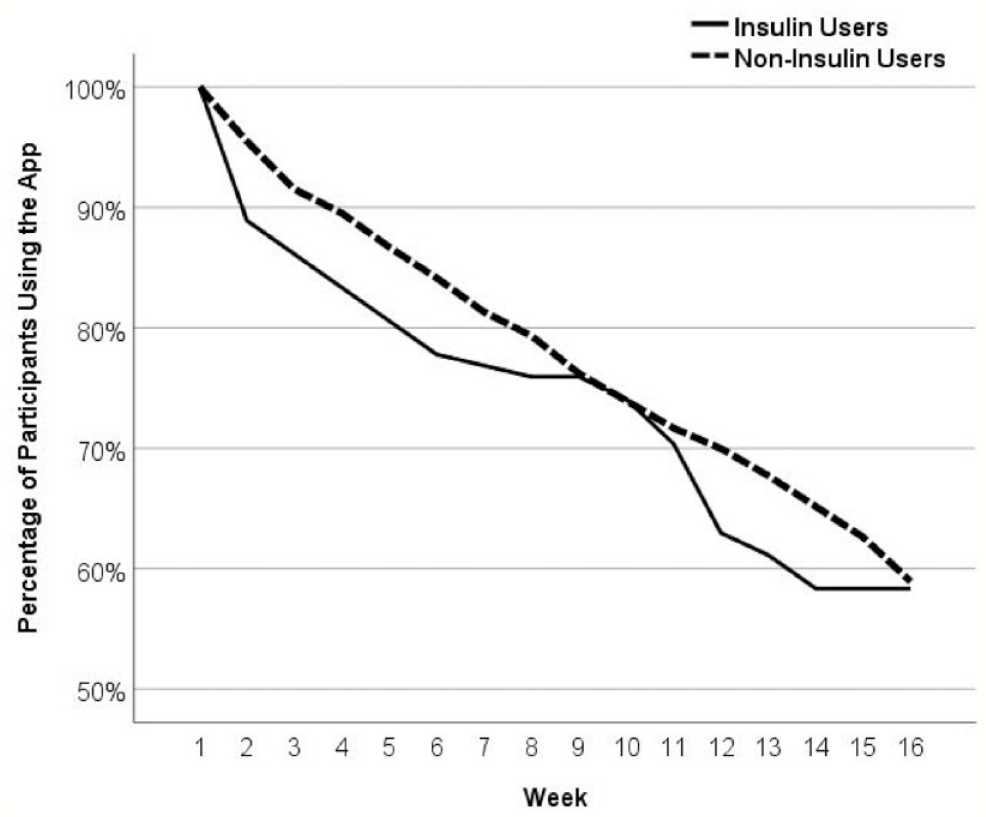
Percentage of continuing app users among insulin (n = 108) and noninsulin using participants (n = 353) over time.
Even among continuing users, average frequency of App use decreased dramatically over time from slightly over four times per week to about one time per week (Figure 2a). Similar dramatic decreases in glucose testing over time occurred. Most of the decline occurred during the first two weeks and then leveled out across the remaining weeks (Figure 2b).
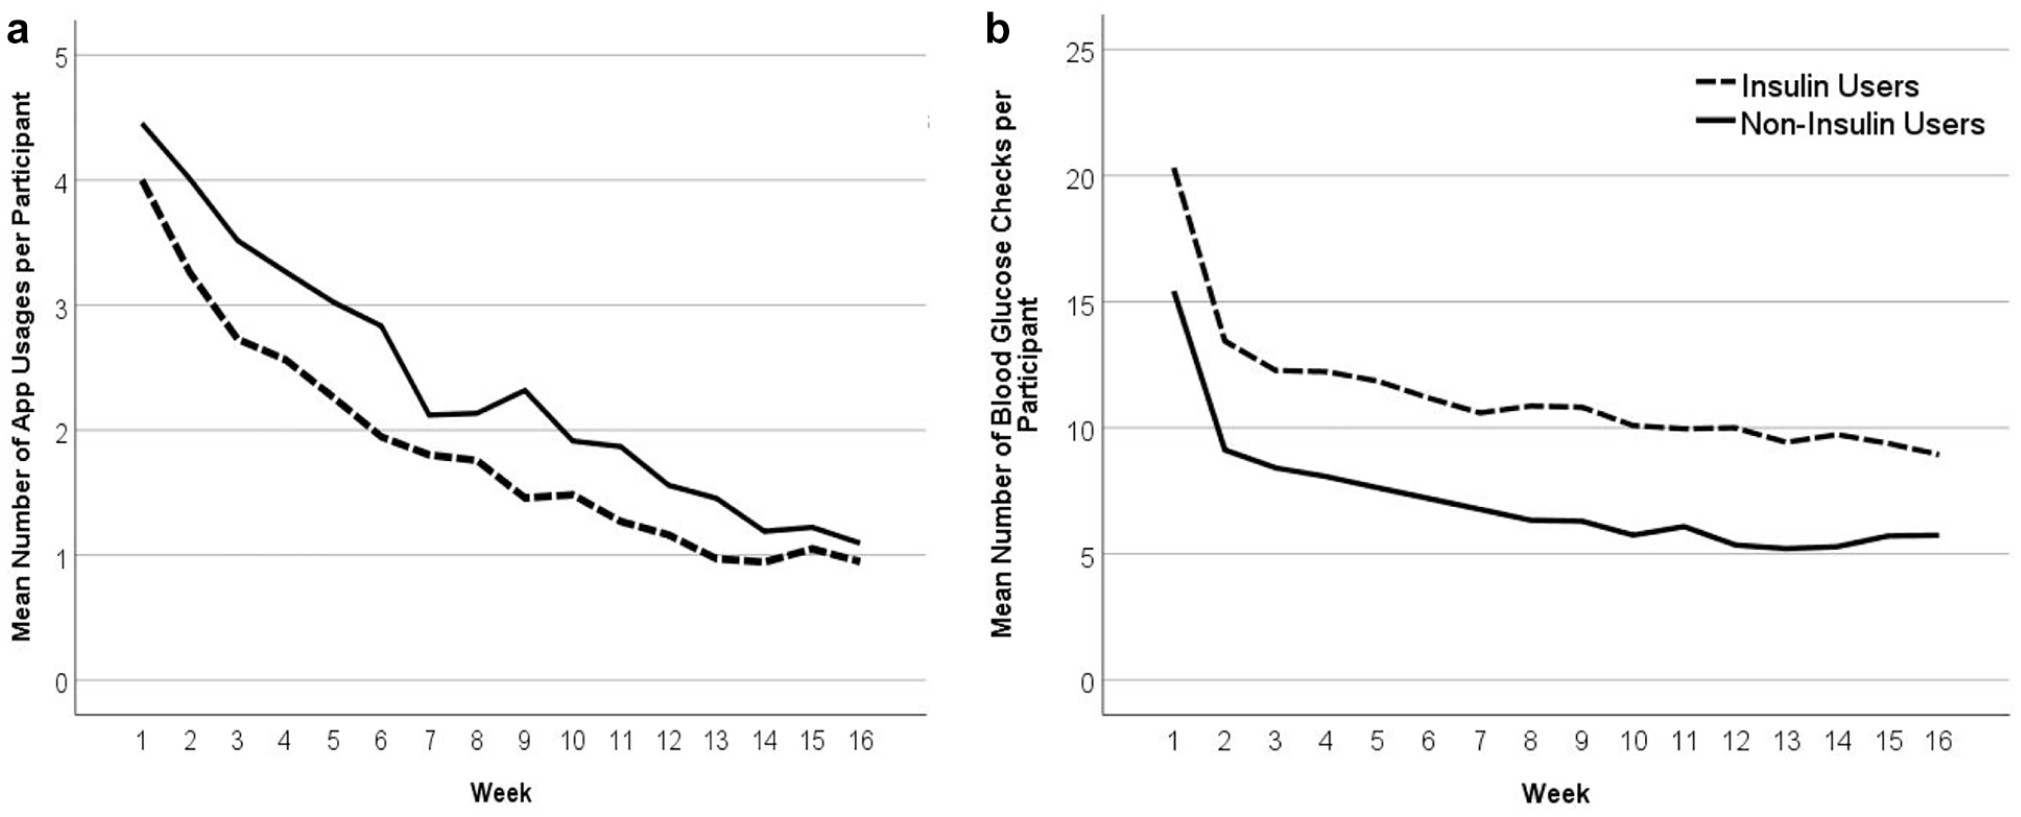
Change in (a) average weekly app use and (b) glucose testing over time, among insulin users (n = 108) and noninsulin users (n = 353).
Predictors of App Use
Bivariate correlation analyses identified those predictors to be included in subsequent regression analyses. Consistent linkages occurred for age, employment status, self-reported HbA1c, attitudes toward technology, diabetes distress (EB and RD), and medication adherence (see Supplementary Table S1). Separate regression models were then employed that included these frequently correlated variables, separately for IUs and NIUs.
Several aspects of the findings are notable (Table 3). First, only older age and better baseline medication taking predicted longer duration of App use for NIUs (both P < .01); no significant predictors of duration of App use were found for IUs.
Linear Regression Models Predicting Patterns of Use Over Time.
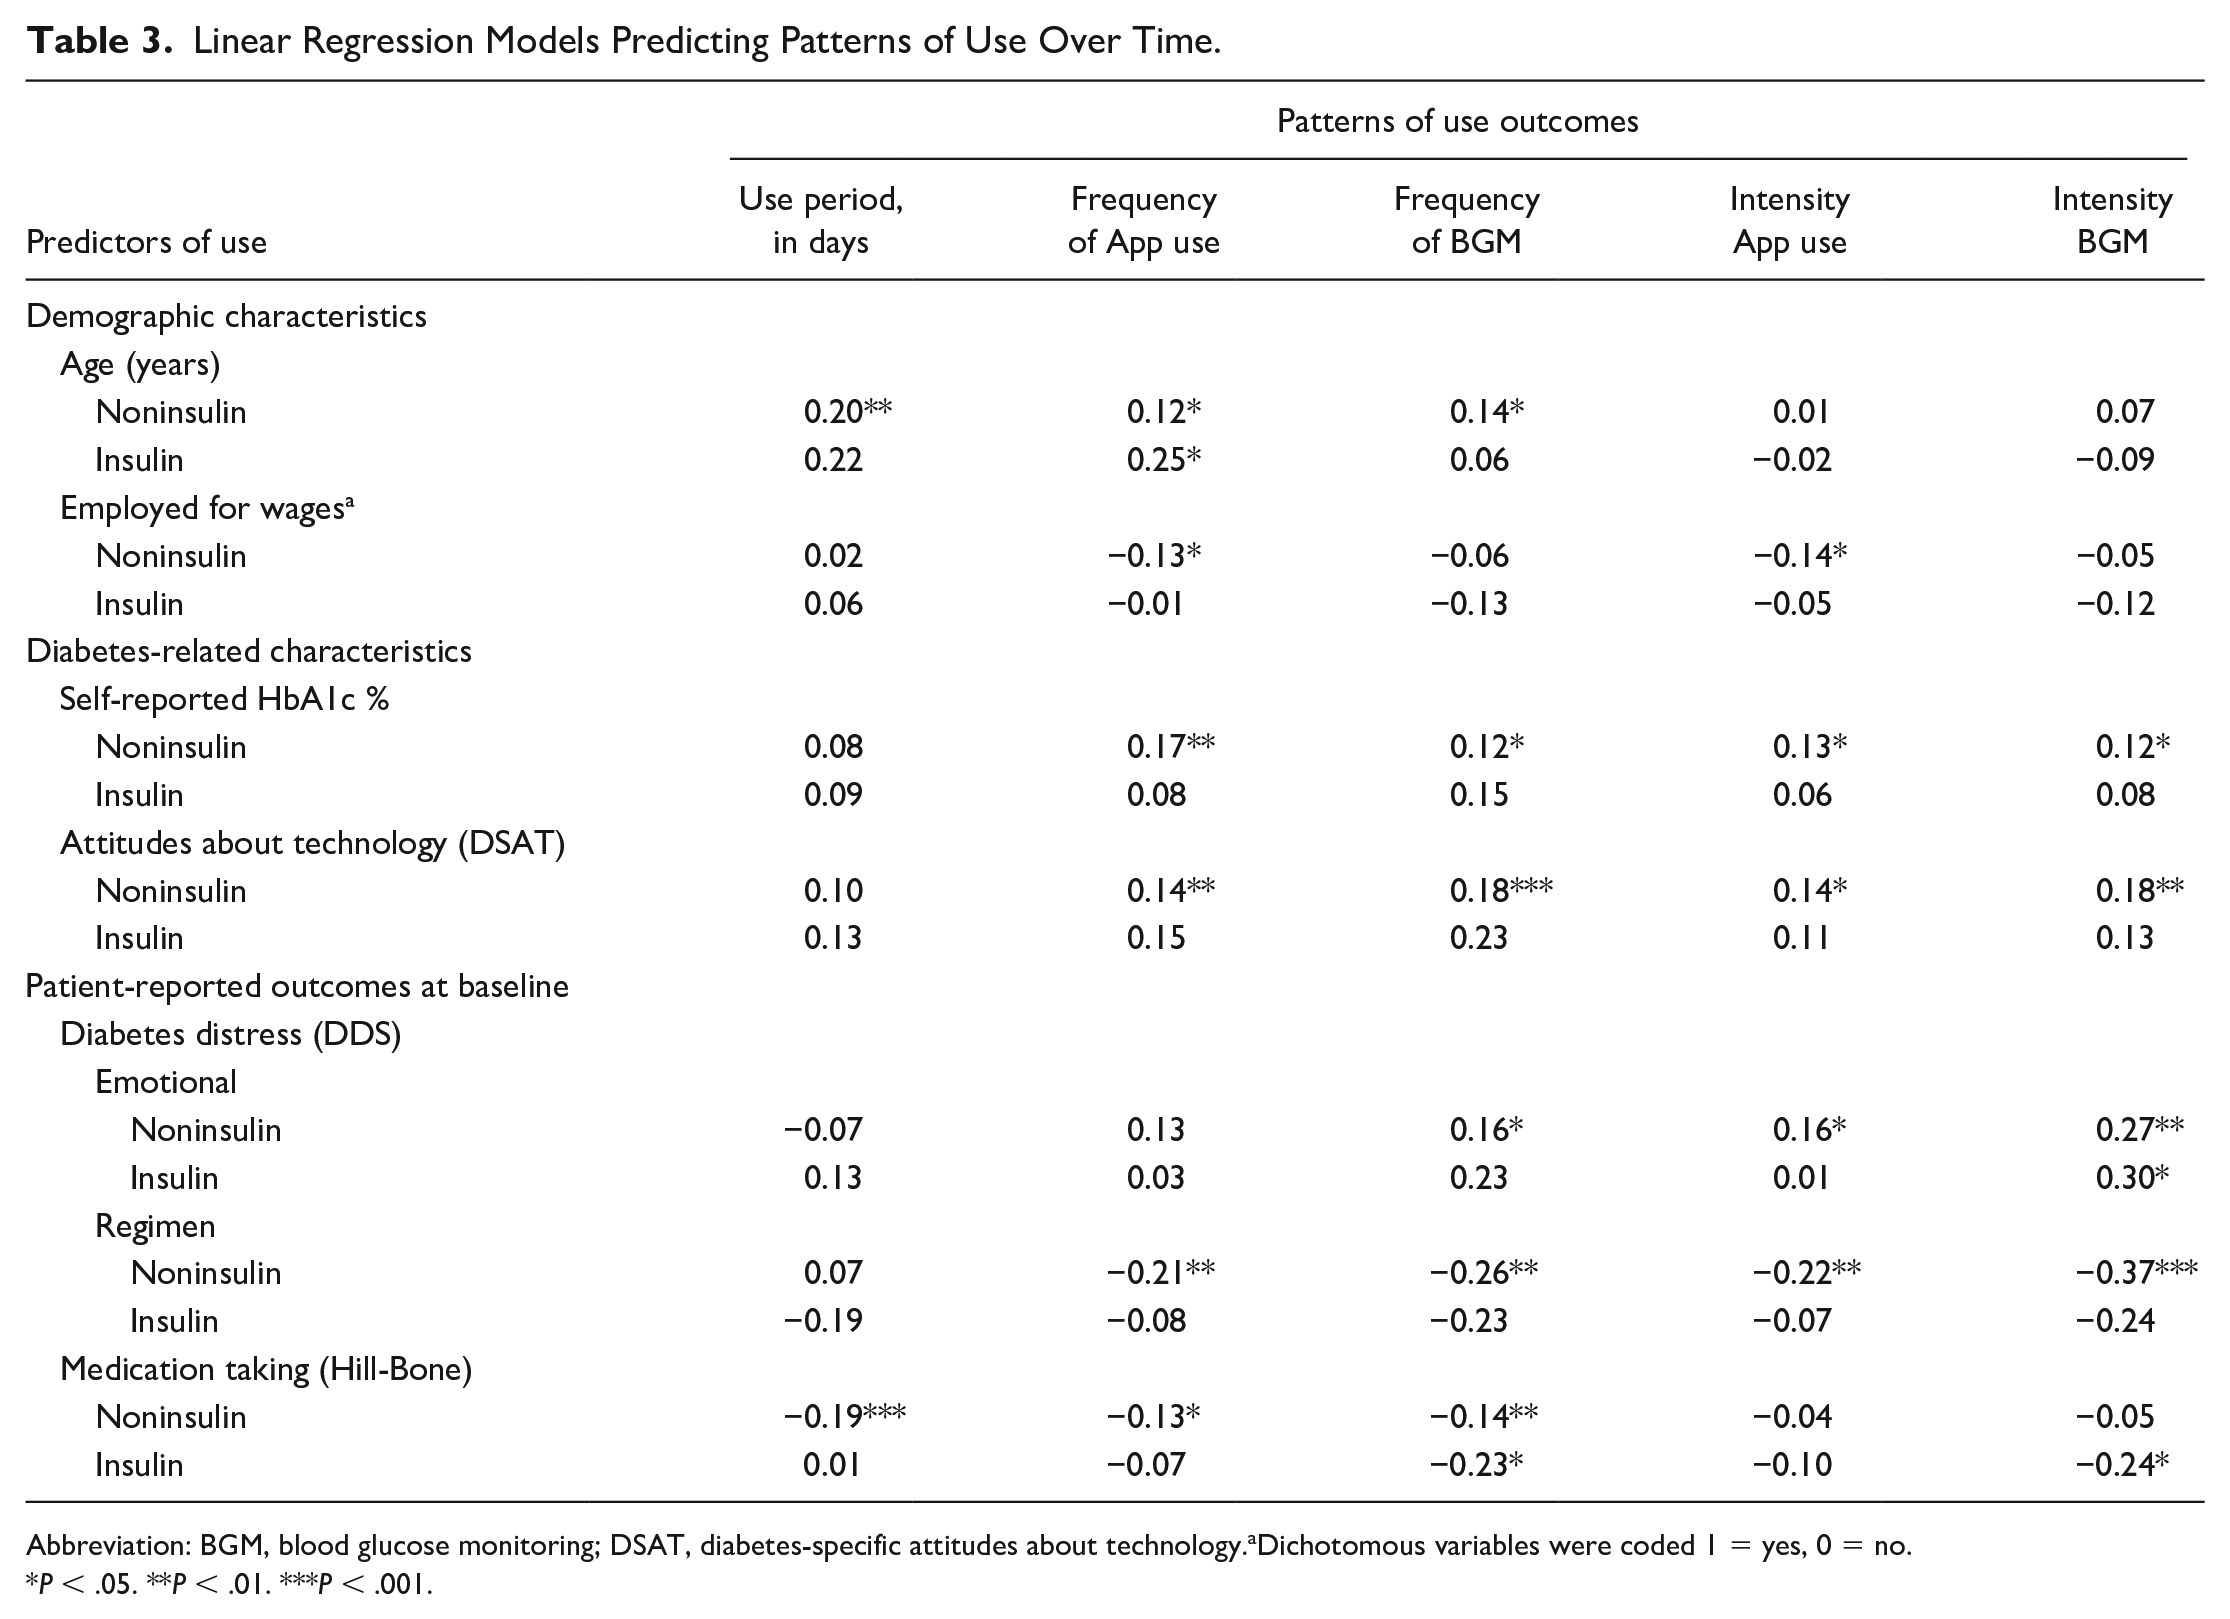
Abbreviation: BGM, blood glucose monitoring; DSAT, diabetes-specific attitudes about technology.aDichotomous variables were coded 1 = yes, 0 = no.
P < .05. **P < .01. ***P < .001.
Second, a far larger number of significant predictors were identified for frequency and intensity of App use than for duration of use. For NIUs, frequency and/or intensity of App use was greater for older adults, those not employed for wages, those with a higher HbA1c, more positive attitudes toward technology, higher EB, lower RD, and better medication taking than for those with the opposite characteristics (all P < .05). Among IUs, however, only older age significantly predicted more frequent App use (P < .05). Third, similar findings occurred for frequency and intensity of glucose testing. A review of the regression analyses was then undertaken to determine whether the notably fewer significant findings for IUs, compared with NIUs, might have been due to the smaller sample size of the IU subgroup. Findings indicated that the standardized effect sizes (βs) were notably attenuated in the IU group. We concluded that the fewer number of significant predictors in the IU subgroup was not the result of the smaller sample size.
Fourth, across all analyses, far more independent predictors of use occurred for NIUs than for IUs: 20 vs 4, respectively. And overall, RD demonstrated the most consistent and strongest associations with patterns of App use and blood group (BG) testing.
Discussion
This study explored the utilization of a diabetes-related management App over time in a diverse sample of adults with T2D who independently elected to use the App on their own. In general, participants are representative of a majority of the T2D population in the United States in terms of age, gender, education, HbA1c level, although they tended not to include less educated or underserved populations that may be at greater risk of poor outcomes.13,14 They also report relatively low levels of medication taking, a problem that App use might address. Consequently, they may view the App as a tool to improve management and they view technology as a potentially helpful medium to reach this goal. Interestingly, they also report elevated levels of diabetes-related distress at baseline, as expressed through high levels of EB and RD, which may have further served as a motivator for change. 15 It is notable that baseline RD displays the highest βs and is the most consistent predictor of App use and glucose testing over time, linking App use to the burdens and frustration of glucose management.
Furthermore, participants used the App primarily to record glucose levels, rarely utilizing the App’s extended features for recording and integrating their glucose data with other management-related behaviors. This implies that features requiring manual user input are far less likely to be used than those that automatically capture data with minimal user effort. Furthermore, this finding may have been due to an inability to easily translate this more complicated information into management changes without clarification or input from a health care team.
We find a dramatic reduction in both App use and glucose testing over time: very few individuals continue to make use of free-standing mobile technologies over time without linkages to a health care provider or other supports. 5 Studies show that the initial clinical gains linked to mobile technology use are rarely sustained over time.16,17 Two reasons are proposed to help explain these findings. First, continued linkages with external supports, like a care team, enhance accountability and provide for ongoing reinforcement, engagement, and encouragement. 5 Without such connections, self-motivation for use may be hard to sustain over time. Second, linkages with other supports, like a care team, provide a vehicle for helping users actually make use of the data they collect. 18 Maximizing App use and glucose testing over time may require both the provision of sustained external support and methods for linking the findings to specific, easily actionable changes in management.19,20
We find far more predictors of App use among NIUs than IUs T2D adults. Specifically, among NIUs T2D adults, users who tend to use the App more frequently tend to be older, not employed for wages, have a higher HbA1c, display more positive attitudes toward technology, have higher EB and lower RD, and report better medication taking than less frequent App users. Older adults and those not currently employed may have more time to devote to App use. Likewise, high perceived EB may encourage use, whereas high RD may discourage use due to ongoing frustration or burnout. Importantly, although high RD is associated with electing to use an App at the outset, it may not be linked to actual App use over time. For noninsulin using T2D adults, these findings suggest that App use may need to be tailored to specific groups of T2D adults and that a one-size-fits-all approach may not yield the best outcomes in terms of use and effectiveness.
In contrast, for IUs, only older age predicted greater App use, with higher EB and more medication taking predicting a higher frequency of glucose testing. Interestingly, although some data suggest that NIUs use mobile technologies more frequently and display better clinical outcomes as a result of use than adults with T1D,21-24 we find no studies that specifically address differences in predictors of use between T2D IUs and T2D NIUs. Drivers of App use and glucose testing among NIUs are different than the drivers for App use for IUs, be they T1D or T2D adults.
What, then, might account for these differences? We suggest three potential explanations. First, the IUs were significantly older, had diabetes longer, had notably higher baseline HbA1c, and reported poorer medication taking than the NIUs. Thus, the context of and motivation for their App use between groups may be considerably different—the reasons and motivations may not be the same, hence the drivers may be different. Second, IUs have more experience with glucose testing and are more dependent on test data than NIUs. Their App use and testing behavior may, therefore, be linked to other drivers not directly assessed in this study, for example, number of complications and frequency of hypoglycemia. Third, IUs may have obtained what they needed from App use earlier and saw no reason to continue after a certain point. In summary, however, our findings suggest the importance of examining predictors of mobile technologies for T2D IUs and NIUs separately, and if confirmed, to tailor Apps to fit the individual needs of these different populations.
This study has a number of strengths: It includes a large and geographically diverse sample of participants, and the data were recorded unobtrusively and automatically. Several potential limitations are noteworthy. First, we are not able to determine how those who participated may have differed from those who declined our invitation to participate. Second, the sample tended to be well educated with a positive opinion of technology for use in disease management. Patterns and predictors of use may be different among more high-risk populations. Third, while this study was far more representative of real-world diabetes management conditions than previous controlled studies, the requirement to provide written informed consent and complete a survey may still have led some to opt out.
Conclusions
We find that the frequency and intensity of App use and glucose testing based on a blood glucose meter in a diverse sample of both IUs and NIUs with T2D decline relatively rapidly over time. Predictors of App use and glucose testing suggest that the effective utilization of mobile technologies requires a more tailored approach that addresses the specific needs and characteristics of individual users compared with adopting a one-size-fits-all strategy and that IUs and NIUs may require very different strategies of customization.
Supplemental Material
sj-docx-1-dst-10.1177_19322968211058766 – Supplemental material for How Frequently and for How Long Do Adults With Type 2 Diabetes Use Management Apps? The REALL Study
Supplemental material, sj-docx-1-dst-10.1177_19322968211058766 for How Frequently and for How Long Do Adults With Type 2 Diabetes Use Management Apps? The REALL Study by Lawrence Fisher, Addie L. Fortmann, Caterina Florissi, Keaton Stoner, Jennifer Knaebel and Andreas Stuhr in Journal of Diabetes Science and Technology
Footnotes
Acknowledgements
Appreciation is expressed to Chester Lu, James Richardson, and Richard Wood for their support throughout this study.
Abbreviations
App, applications; EB, emotional burden; IU, insulin user; NIU, noninsulin user; RD, regimen distress; SD, standard deviation; T1D, type 1 diabetes; T2D, type 2 diabetes.
Authors’ Note
Portions of this study were presented at the American Diabetes Association Meetings, June 2021.
Declaration of Conflicting Interests
The author(s) declared the following potential conflicts of interest with respect to the research, authorship, and/or publication of this article: J.K. and A.S. are full-time employees of Ascensia Diabetes Care.
Funding
The author(s) disclosed receipt of the following financial support for the research, authorship, and/or publication of this article: This study was funded by an unrestricted research grant from Ascensia Diabetes Care.
Supplemental Material
Supplemental material for this article is available online.
References
Supplementary Material
Please find the following supplemental material available below.
For Open Access articles published under a Creative Commons License, all supplemental material carries the same license as the article it is associated with.
For non-Open Access articles published, all supplemental material carries a non-exclusive license, and permission requests for re-use of supplemental material or any part of supplemental material shall be sent directly to the copyright owner as specified in the copyright notice associated with the article.