
Abstract
Introduction:
Insulin pumps and continuous glucose monitors (CGM) have many benefits in the management of type 1 diabetes. Unfortunately disparities in technology access occur in groups with increased risk for adverse effects (eg, low socioeconomic status [SES], public insurance).
Research Design & Methods:
Using 2015 to 2016 data from 4,895 participants from the T1D Exchange Registry, a structural equation model (SEM) was fit to explore the hypothesized direct and indirect relationships between SES, insurance features, access to diabetes technology, and adverse clinical outcomes (diabetic ketoacidosis, hypoglycemia). SEM was estimated using the maximum likelihood method and standardized path coefficients are presented.
Results:
Higher SES and more generous insurance coverage were directly associated with CGM use (β = 1.52, SE = 0.12, P < .0001 and β = 1.21, SE = 0.14, P < .0001, respectively). Though SES displayed a small inverse association with pump use (β = -0.11, SE = 0.04, P = .0097), more generous insurance coverage displayed a stronger direct association with pump use (β = 0.88, SE = 0.10, P < .0001). CGM use and pump use were both directly associated with fewer adverse outcomes (β = -0.23, SE = 0.06, P = .0002 and β = -0.15, SE = 0.04, P = .0002, respectively). Both SES and insurance coverage demonstrated significant indirect effects on adverse outcomes that operated through access to diabetes technology (β = -0.33, SE = 0.09, P = .0002 and β = -0.40, SE = 0.09, P < .0001, respectively).
Conclusions:
The association between SES and insurance coverage and adverse outcomes was primarily mediated through diabetes technology use, suggesting that disparities in diabetes outcomes have the potential to be mitigated by addressing the upstream disparities in technology use.
Keywords
Introduction
Insulin Pump and continuous glucose monitoring have revolutionized diabetes care. Insulin pumps can provide benefits that are unavailable with multiple daily injection such as flexible insulin administration with multiple basal settings and bolus calculators that compute the amount of insulin needed based on carbohydrate content of a meal, current blood glucose, and the amount of insulin already in circulation. Continuous glucose monitors (CGMs), which monitor blood glucose every 5 minutes, have trend arrows, and can alarm for hyperglycemia and hypoglycemia, providing an important safety net for users. These diabetes technologies have been demonstrated in clinical trials and observational studies to have several clinical benefits including improved A1c, less hypoglycemia, reduced diabetic ketoacidosis, 1 and have been associated with improvements in diabetes-related quality of life. 2
Despite the advantages of these technologies and the rising rates of technology use among patients with type 1 diabetes (T1D), 3 there are many barriers to access and inequities in who is ultimately able to use and benefit from these devices. Insurance coverage for diabetes technology has somewhat improved in recent years,4-7 although coverage varies significantly with each insurance plan8,9 and is often associated with high out of pocket costs. 10 Consequently cost is often reported to be a major concern to using diabetes technologies. 11 In addition to financial barriers to access, studies have shown that patients who are racial-ethnic minorities are less likely to be insulin pump and/or CGM users, even after adjusting for confounding factors such as socioeconomic status (SES).12-15
SES and insurance type/coverage have not only been associated with technology access but has also been associated with increased risk for acute complications of diabetes.16-24 While the aforementioned associations are well documented, what is unclear is whether the increased risk of adverse effects in these populations is due to diabetes management strategy and technology access and if so, to what degree. In this study, we aim to perform SEM using data from insured patients with T1D from the T1D Exchange registry, to evaluate direct and indirect associations between SES, insurance features (eg, type and coverage), diabetes technology access, self-monitored blood glucose (SMBG) frequency, and acute adverse diabetes outcomes (DKA and hypoglycemia).
Methods
Patient Population
The T1D Exchange Clinic Network includes 70 U.S. based pediatric and adult endocrinology practices. A registry of individuals with T1D commenced enrollment in September 2010. 25 Each clinic received approval from an institutional review board, and informed consent was obtained according to institutional review board requirements. This study was exempt from institutional review board as existing data were deidentified. Data were collected from the registry’s central database from the participant’s medical record and by having the parent complete a comprehensive questionnaire (if subject is between the ages 13-18 years old parent or participant may respond), as previously described. 25 This report includes data on 4895 insured pediatric and adult participants enrolled that completed supplemental questionnaires in years 2015 and 2016. There were a few questionnaire items that were solicited only in 1 survey (ie, 2015 or 2016) but the majority of questionnaire items were consistent between years.
Construct Measures
The measures of interest in this study are self-reported. Questionnaires are completed by the parent of the participant if the participant is less than 13 years of age. If the participant is greater than age 13 but less than 18 years of age, either the parent or the participant may complete the questionnaire. The construct of SES included measures of highest parental education, employment status, household income, race/ethnicity, sex, and age. The construct of insurance features included insurance type (public, private, etc.), reported generosity of insurance coverage for pump, CGM, test strips/SMBG, and other medical equipment/supplies. We defined private insurance as private/employer sponsored and ACA acquired insurance. Public insurance is defined as Medicaid, Medicare, Medigap, Military, S-CHIP, Other government/state program.
Outcomes
Adverse events were defined as the occurrence of severe hypoglycemia or diabetic ketoacidosis. Severe hypoglycemia was defined as hypoglycemia in the past 3 months that resulted in loss of consciousness, seizure or requiring paramedic assistance, an emergency department visit or hospitalization with at least 1 night spent in the hospital. Diabetes ketoacidosis was defined as DKA diagnosed by a doctor in the past 3 months that required presentation to a hospital, emergency department (ED), or another healthcare facility.
Statistical Analysis
A structural equation model (SEM) was fit as it allows for the exploration of hypothesized direct and indirect relationships between multiple constructs of interest. 26 Specifically, direct relationships are those in which the exposure is thought to directly impact the outcome (eg, insurance features are thought to exert a direct effect on device use), rather than operating through a mediating variable/intermediate step as is the case with indirect effects (eg, insurance features affects diabetes outcomes via someone’s access to diabetes devices). SEM has the distinct advantage over traditional regression methods in that both direct and indirect effects between multiple exposures and multiple outcomes can all be simultaneously modeled, taking into account the interrelated nature of the included variables. In the SEM, we modeled three latent constructs: (1) SES, (2) insurance features, and (3) adverse outcomes, as well as three observed variables: (1) pump use, (2) CGM use, and (3) SMBG frequency. The SES construct was measured by education, employment, income, race/ethnicity, sex and age, with higher values indicating higher SES; for respondents who were missing income or education, multivariate imputation by fully conditional specification methods was used to preserve sample size. Correlations between variables included in the SEM are included in the appendix. SEM was estimated using the maximum likelihood method and standardized path coefficients are presented. SEM path coefficients for direct and indirect effects represent the strength of the relationship between exposure and outcome and can be interpreted exactly as would coefficients from linear regression models (where the coefficient represents the unit change in the outcome associated with a unit change in the exposure); standardized coefficients were used to compare the relative impact of variables irrespective of the measurement scale/units to facilitate comparison of the importance of each relationship relative to all others. We report several model fit indices, including the chi-square fit statistic, the goodness of fit index (GFI), and the root mean square error of approximation (RMSEA); models with GFI greater than 0.9 and RMSEA less than 0.05 are considered to demonstrate good fit. All analyses were conducted in SAS (version 9.4, SAS Institute Inc., Cary, North Carolina) with statistical significance considered at P < .05.
Results
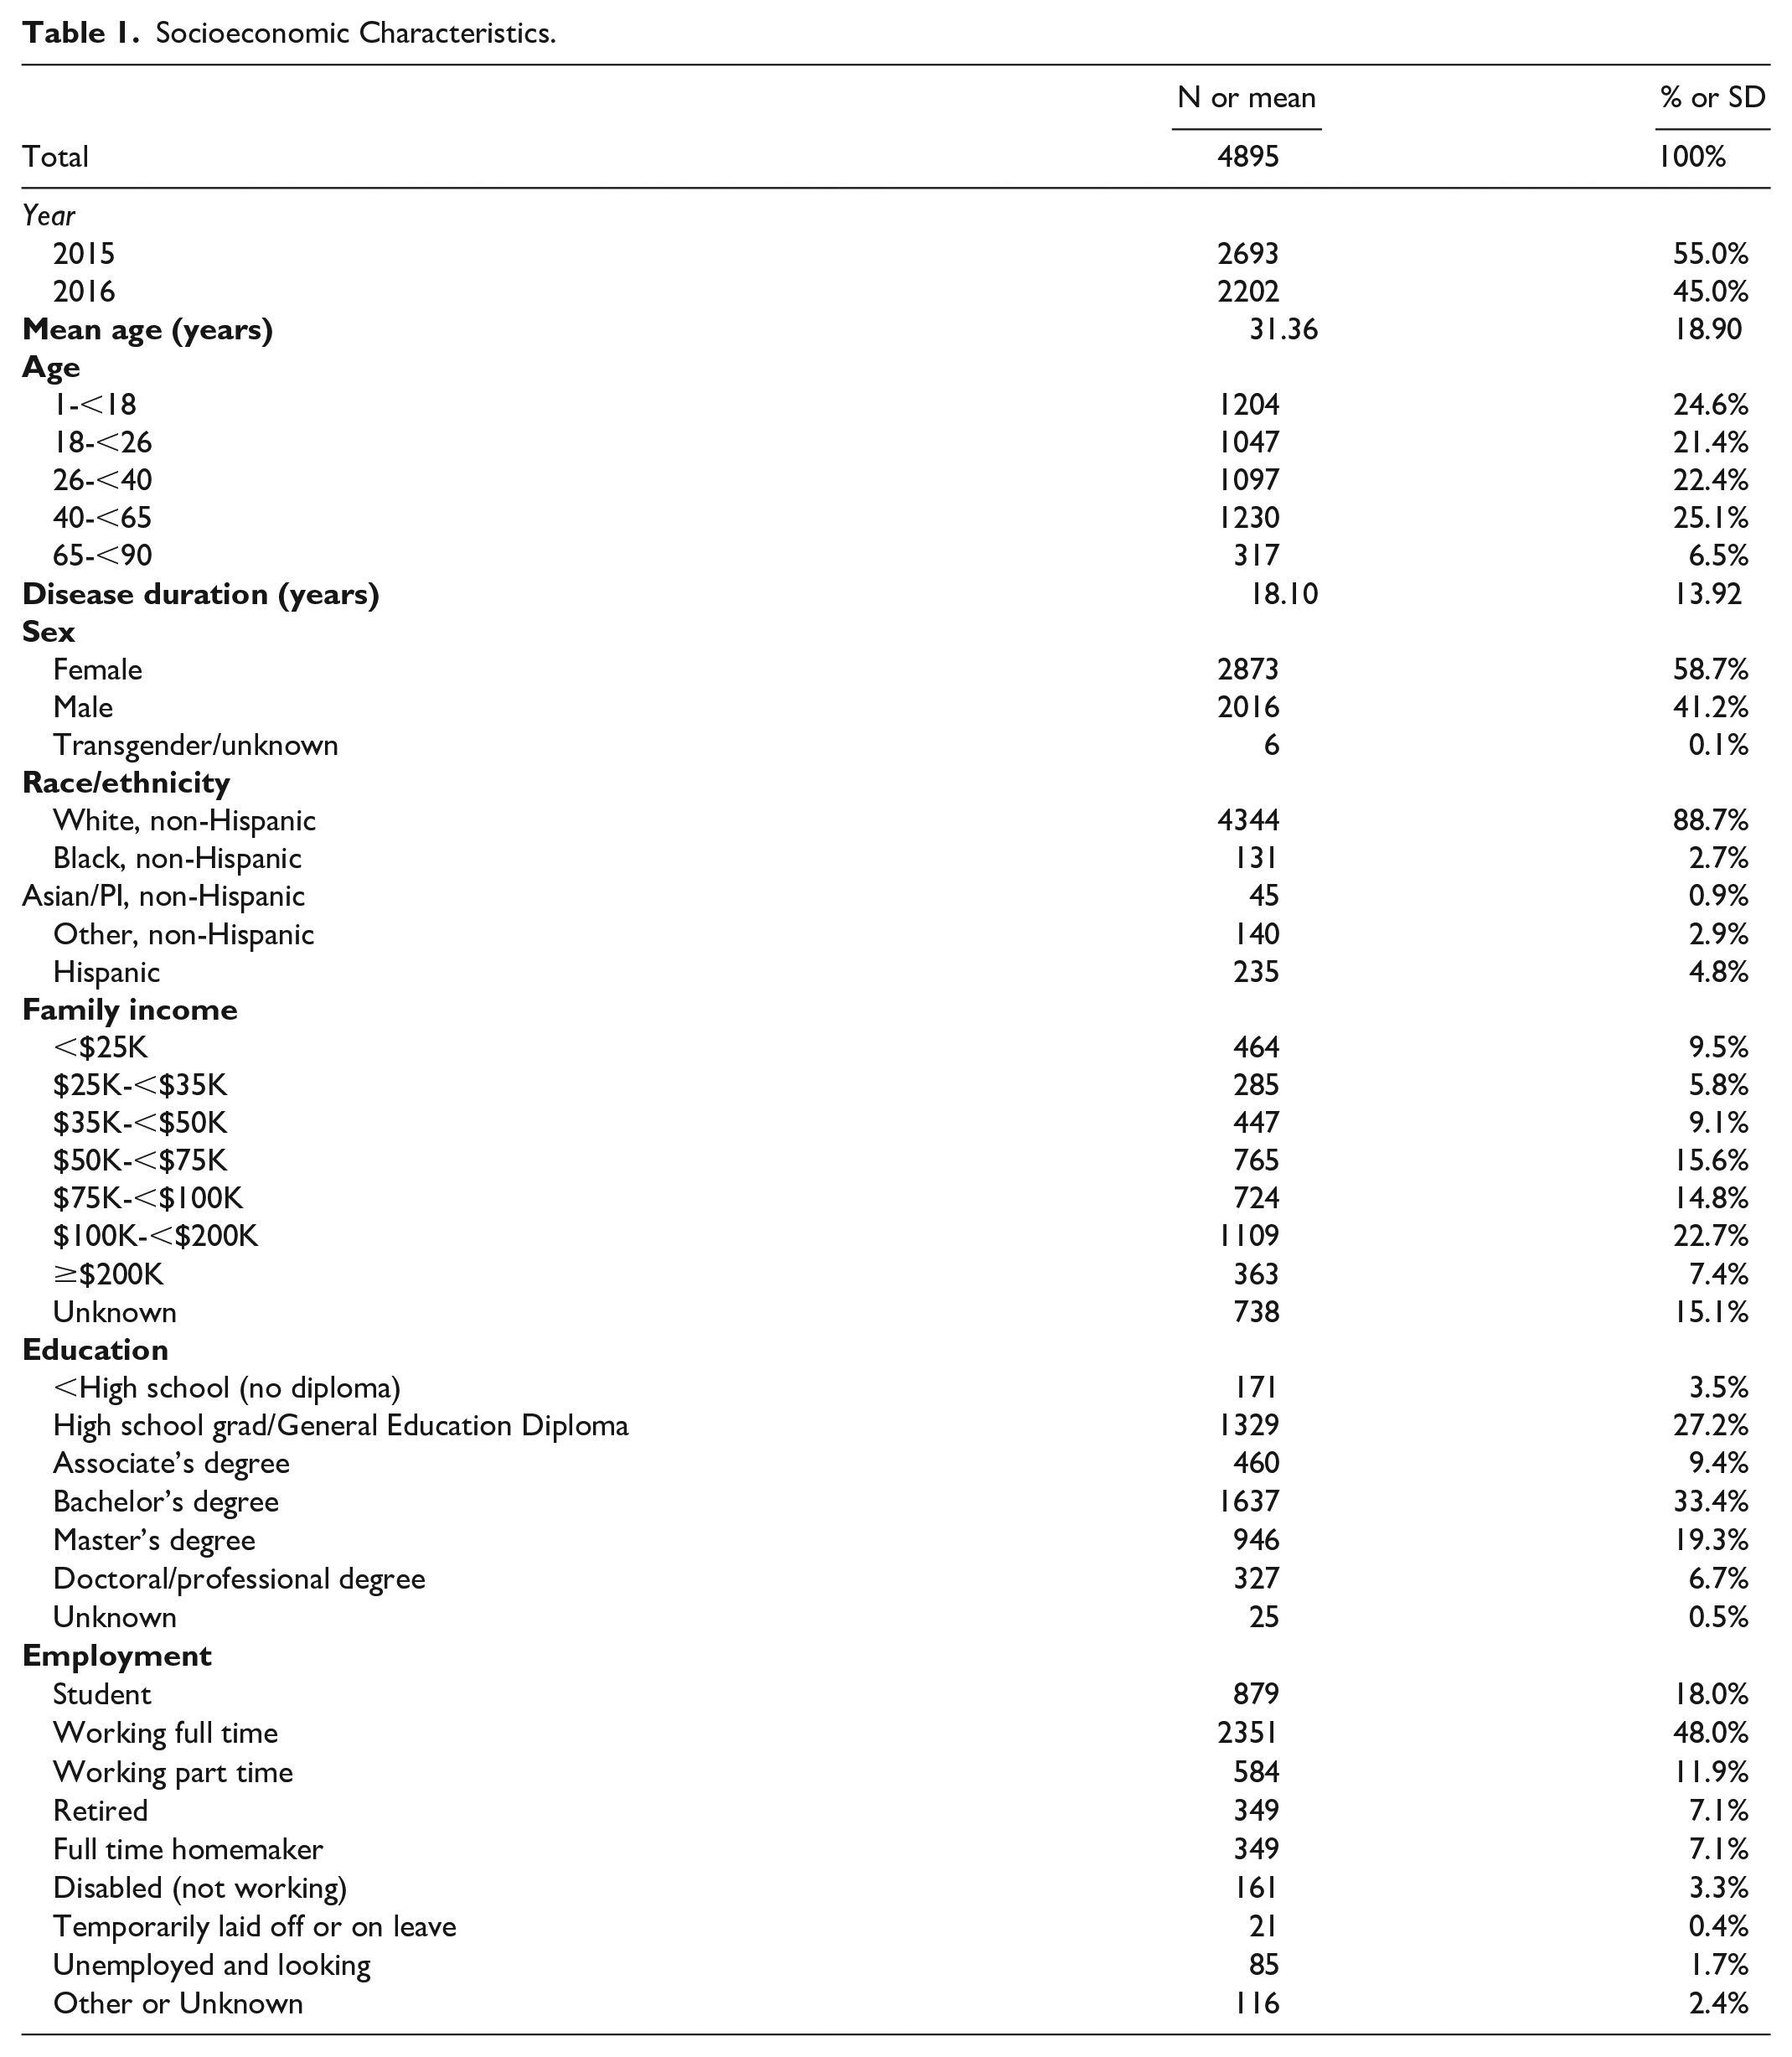
The mean of the participants was 31 years old (Table 1). Participants were predominately female (58.7%), White, non-Hispanic (88.7%). Participants were mostly employed full or part time (59.9%), came from households with income ≥$100,000 (30.1%), and had an education level of a bachelor’s degree or higher (59.4%). The majority of participants had only private insurance (75.0%, Table 2). Approximately 71.8% of participants were insulin pump users and 43.5% were CGM users. Cost/insurance barriers to pump or CGM was reported to be at least somewhat important in 27.1% of respondents. The average number of daily SMBG was 5.42 (SD = 2.65). Cost of test strips was reported a barrier in 17.4% of respondents. Overall, nearly half of participants (45.5%) reported to be burdened by health-related cost/insurance barriers. Overall rates of adverse outcomes were low (Table 3), with 3.0% reporting any diagnosed DKA and 4.7% reporting any severe hypoglycemia with syncope or seizure but participants averaged multiple events (eg, 1.69 ± 1.65 DKA events) among those who experienced any events.
Socioeconomic Characteristics.
Technology Use, Insurance Coverage, and Financial Burden.
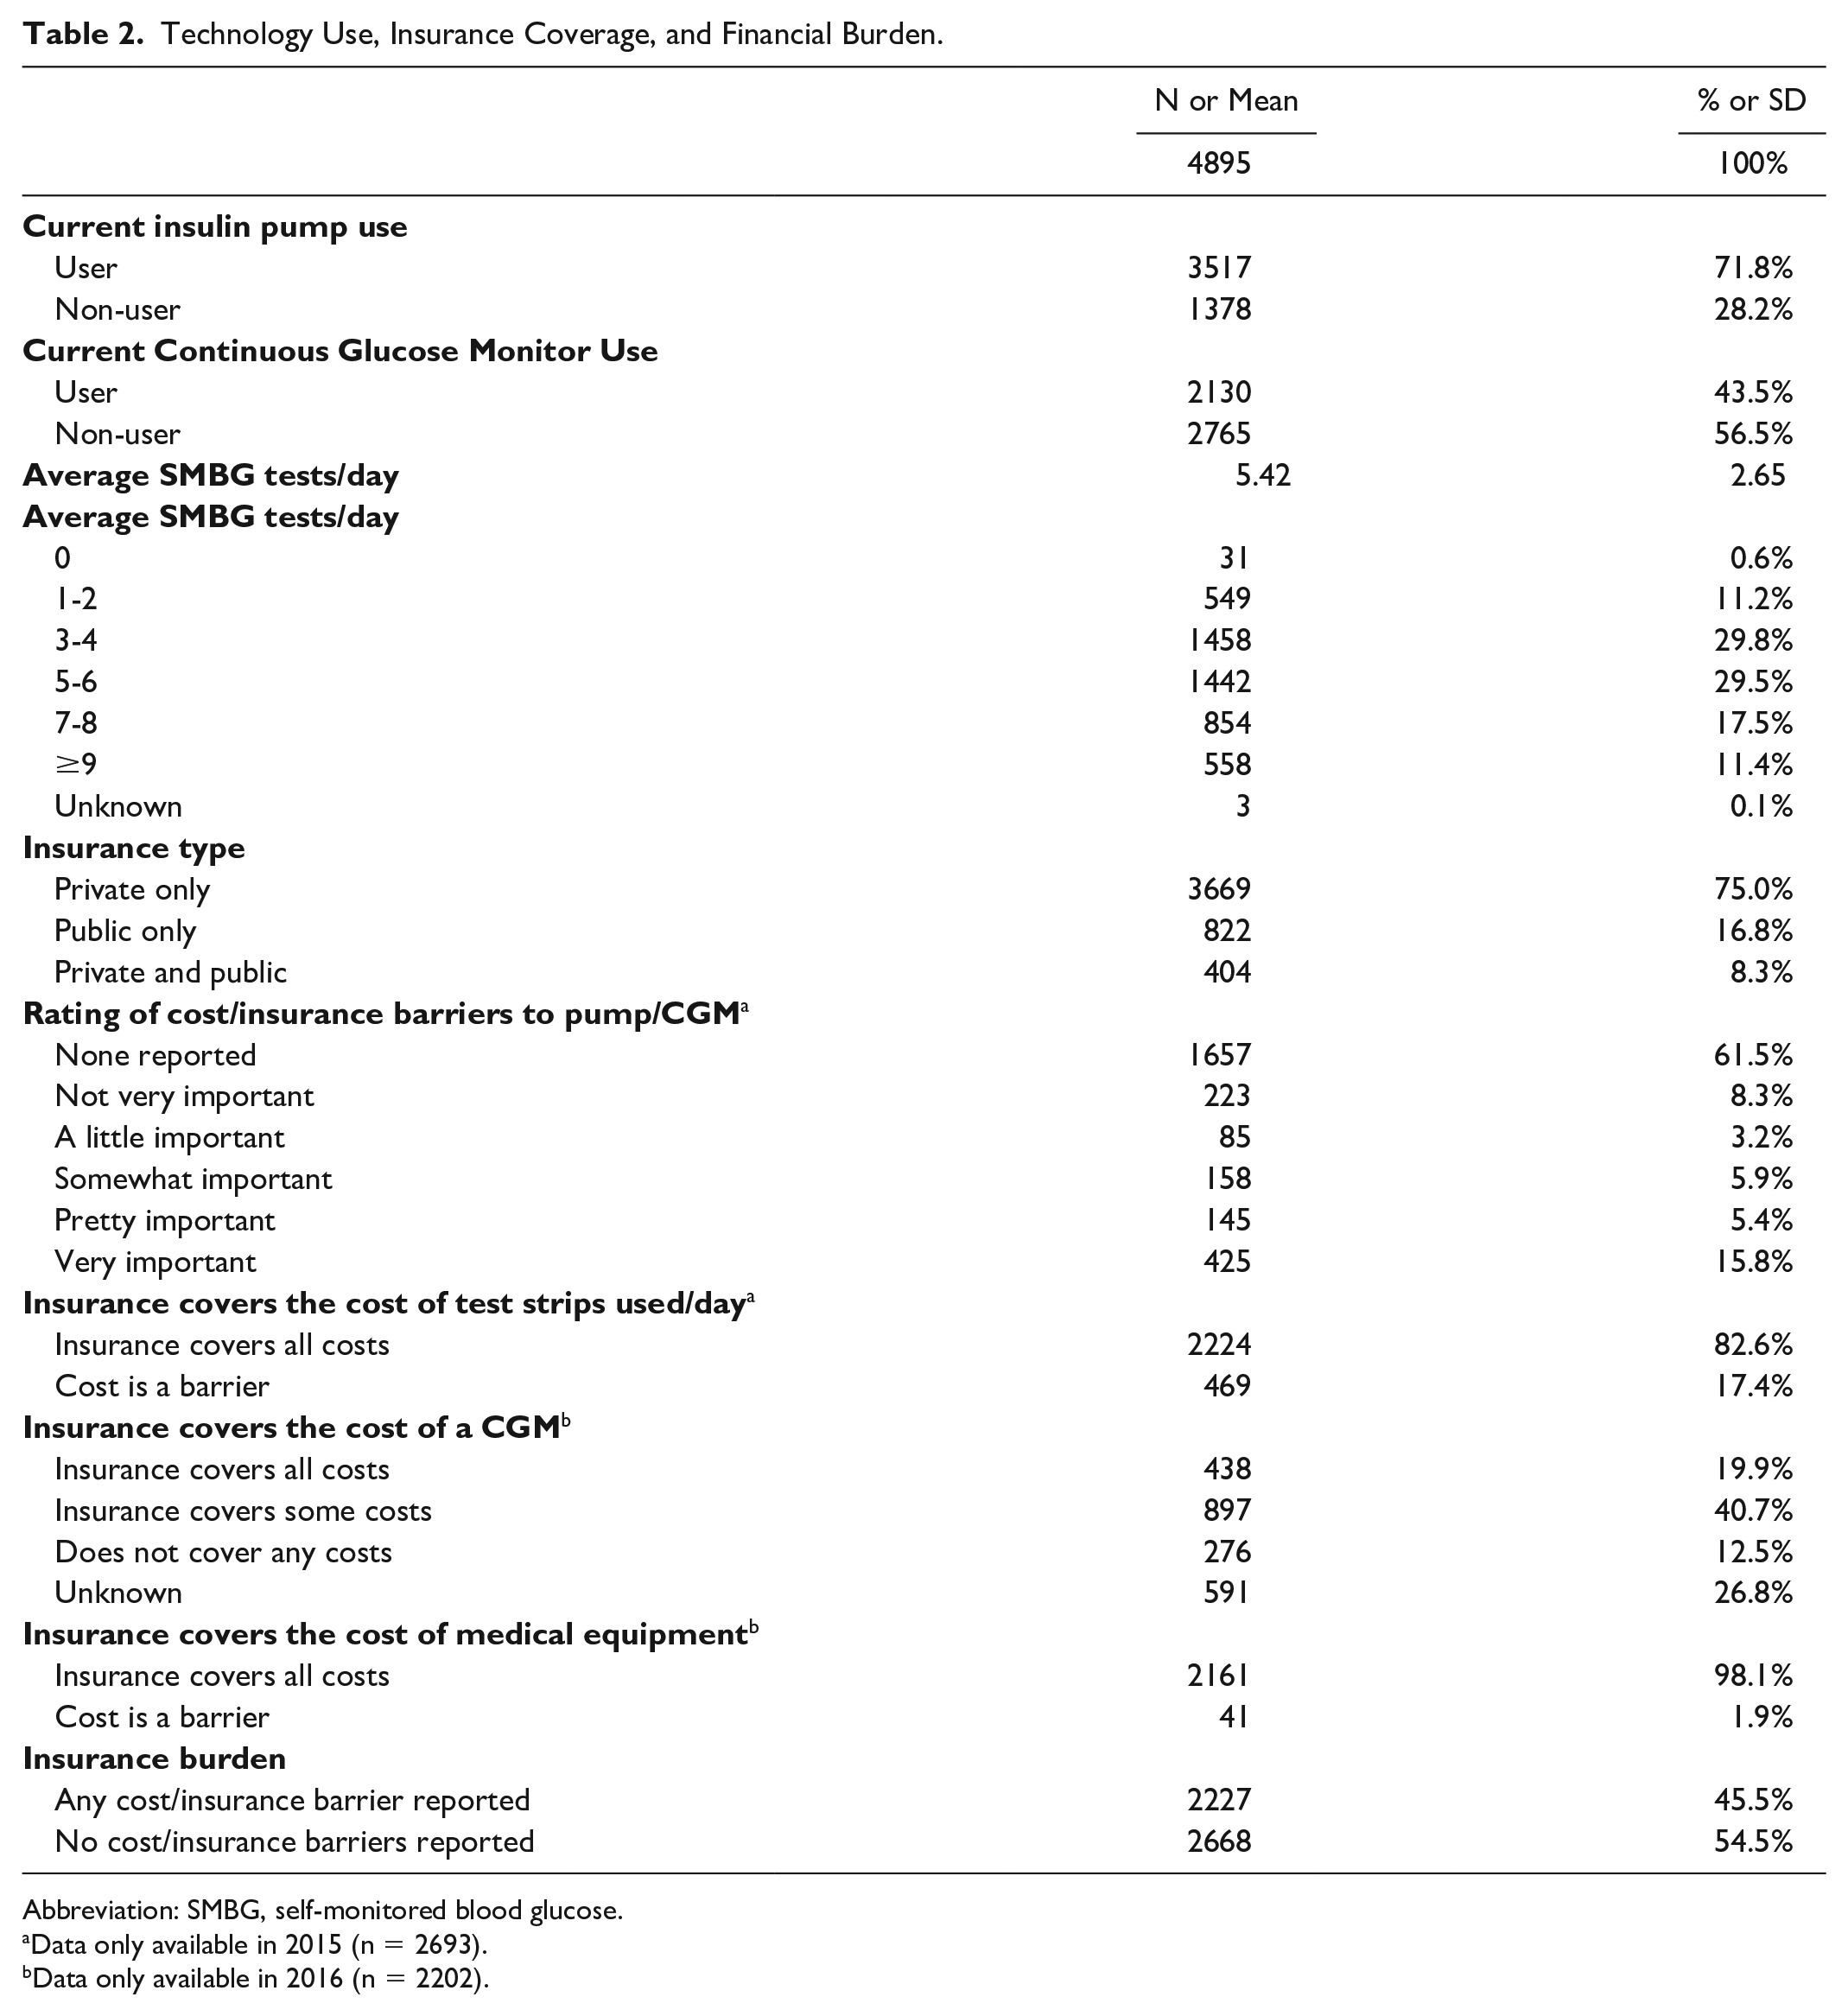
Abbreviation: SMBG, self-monitored blood glucose.
Data only available in 2015 (n = 2693).
Data only available in 2016 (n = 2202).
Adverse Outcomes.
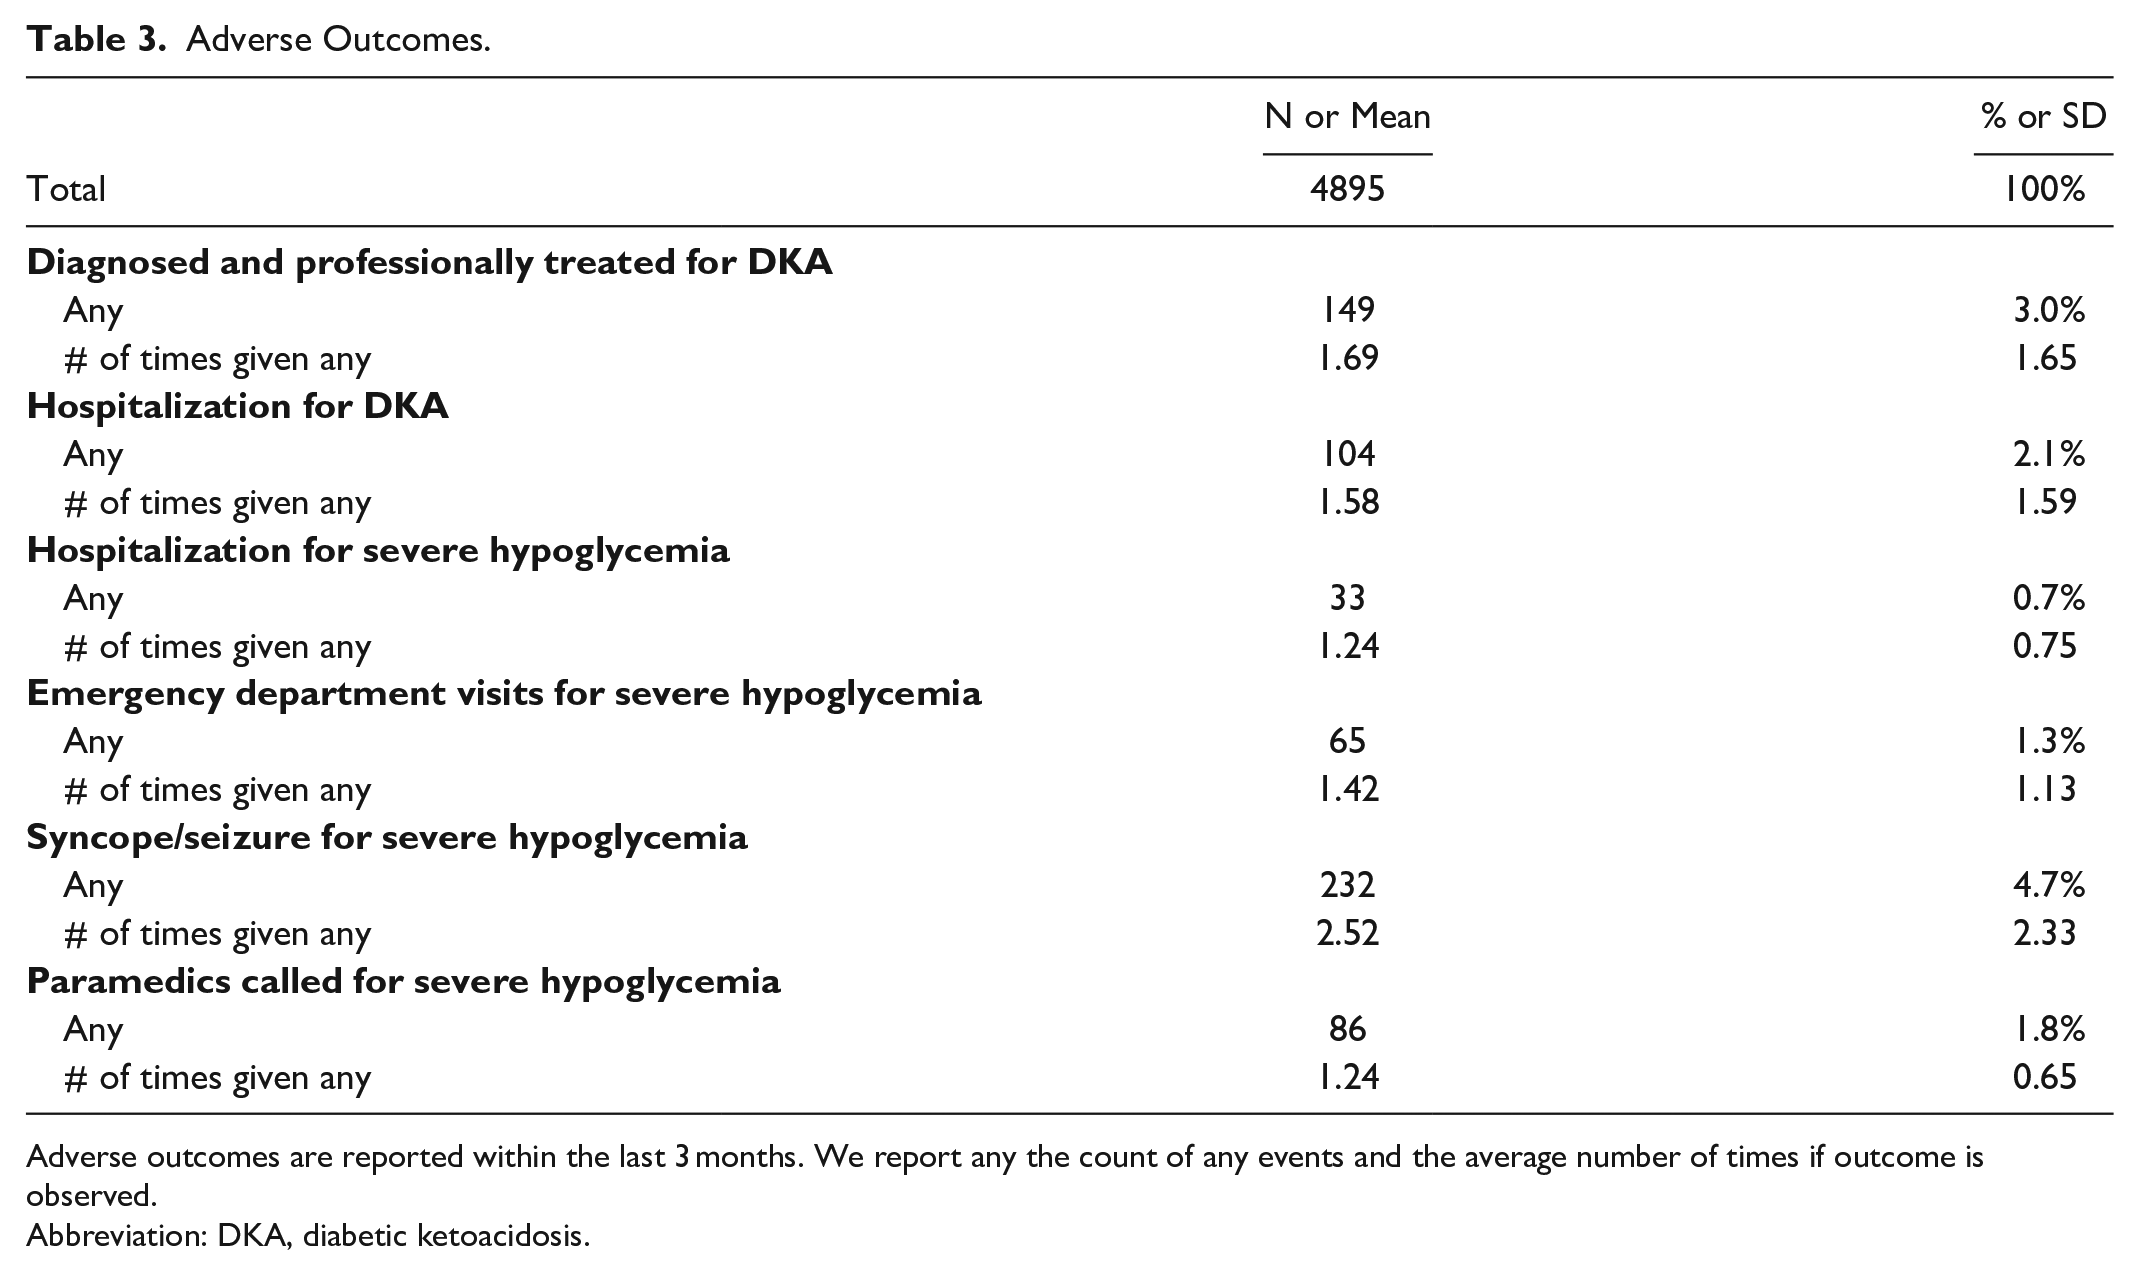
Adverse outcomes are reported within the last 3 months. We report any the count of any events and the average number of times if outcome is observed.
Abbreviation: DKA, diabetic ketoacidosis.
The SEM showed satisfactory model fit, with a GFI of 0.9662 and RMSEA of 0.0484 (Figure 1). All path coefficients from latent constructs to measured variables were statistically significant at P < .0001 (data not shown). Higher SES was significantly associated with CGM use (β = 1.52, SE = 0.12, P < .0001) while it was inversely related to pump use (β = -0.11, SE = 0.04, P = .0097) and SMBG frequency (β = -0.23, SE = 0.02, P < .0001). More generous insurance coverage was significantly associated with CGM use (β = 1.21, SE = 0.14, P < .0001), pump use (β = 0.88, SE = 0.10, P < .0001), and SMBG frequency (β = 0.10, SE = 0.02, P < .0001). CGM use and pump use were both significantly associated with fewer adverse outcomes (β = -0.23, SE = 0.06, P = .0002 and β = -0.15, SE = 0.04, P = .0002, respectively) while increased SMBG frequency was associated with more adverse outcomes (β = 0.04, SE = 0.02, P = .0484). Overall, the impact of SES on adverse outcomes primarily operated as a negative indirect effect through technology use, such that higher SES was indirectly associated with fewer adverse outcomes (β = -0.33, SE = 0.09, P = .0002). More generous insurance coverage demonstrated a positive direct effect on adverse outcomes (β = 0.20, SE = 0.07, P = .0056) but a substantially larger negative indirect effect on adverse outcomes (β = -0.40, SE = 0.09, P < .0001), which operated through technology use, such that the total effect was also negative (more generous insurance coverage was associated with fewer adverse outcomes, β = -0.20, SE = 0.06, P = .0005).
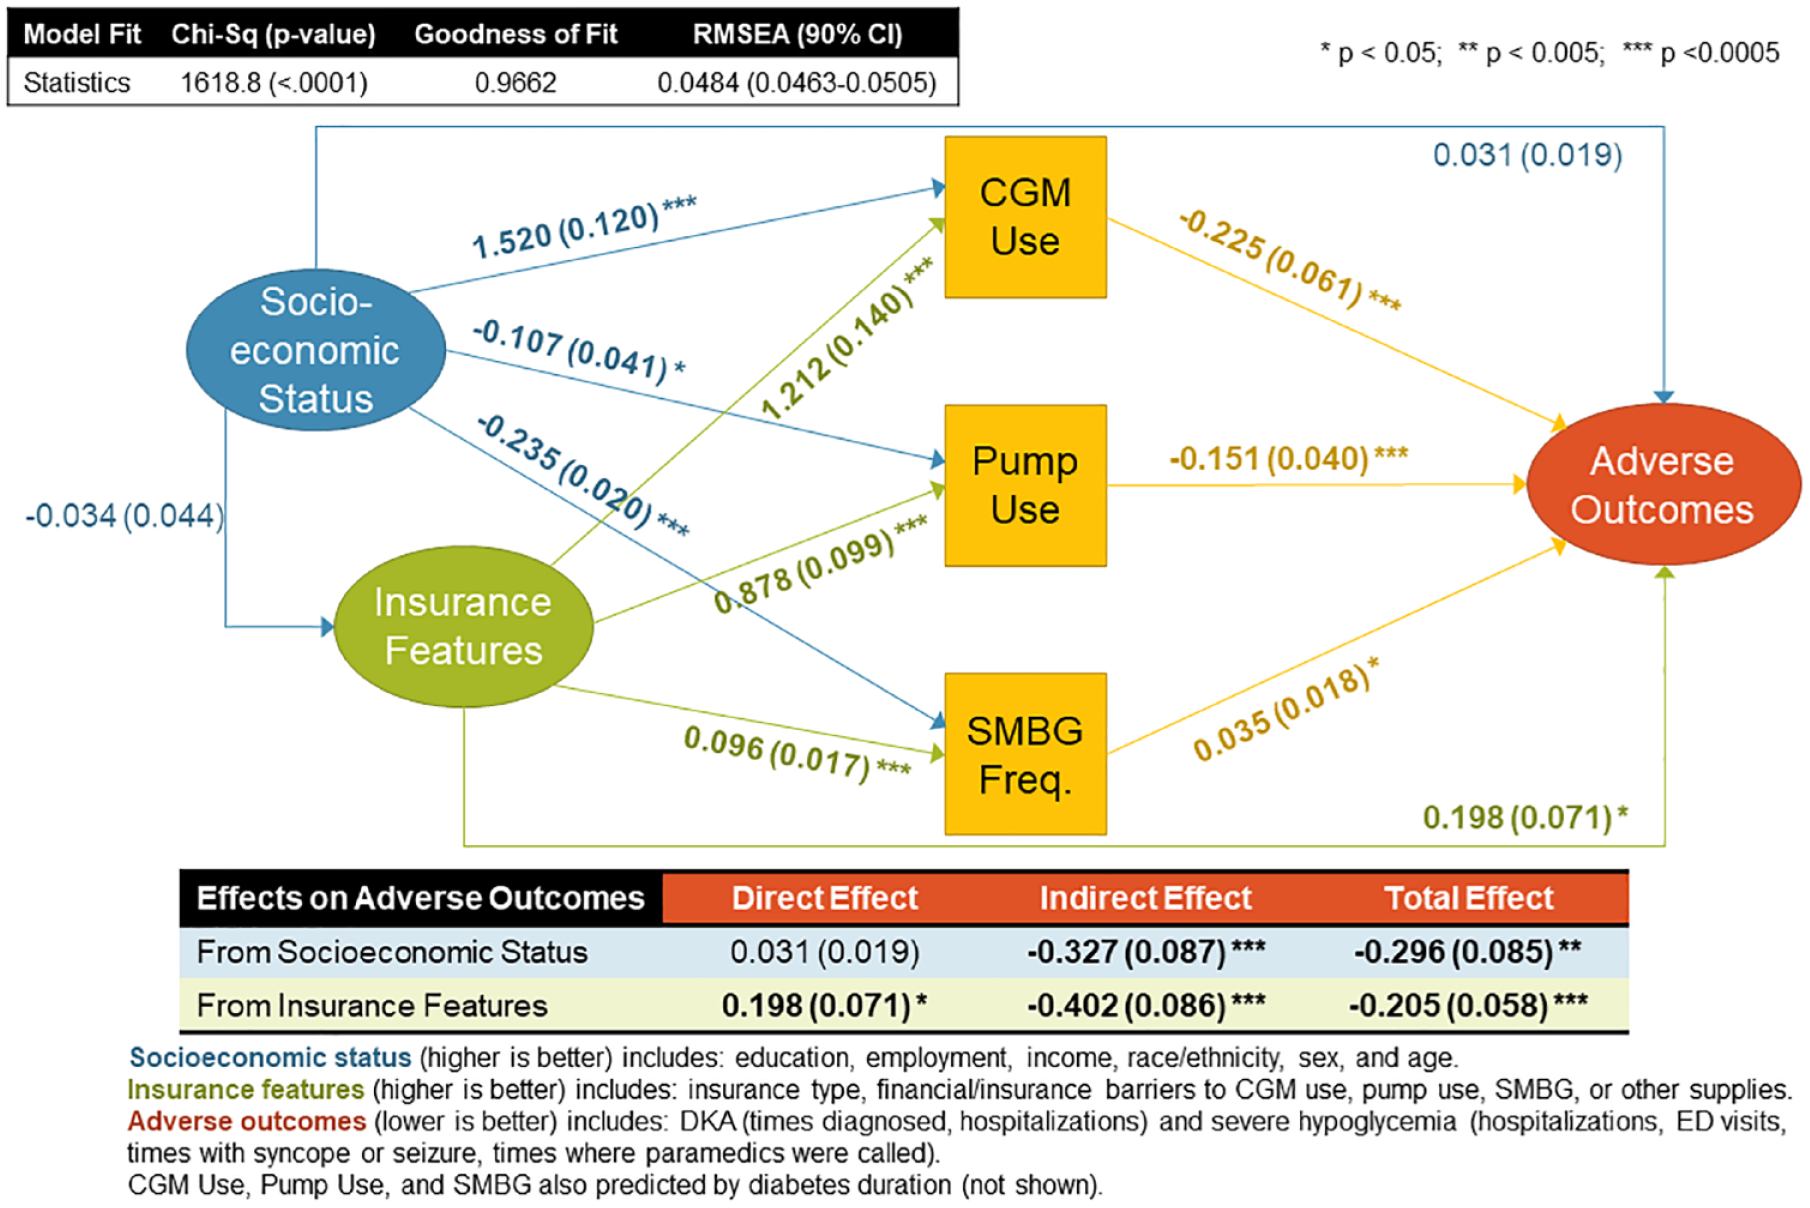
Direct and indirect associations between socioeconomic status, insurance coverage for diabetes technology and adverse outcomes. A structural equation model was fit to explore hypothesized direct and indirect relationships between three latent constructs (ovals): (1) socioeconomic status (SES), (2) insurance features, and (3) adverse outcomes, as well as three observed variables (squares): (1) pump use, (2) continuous glucose monitoring (CGM) use, and (3) self-monitored blood glucose (SMBG) frequency. The SES construct was measured by education, employment, income, race/ethnicity, sex and age; with higher values indicating higher SES. The insurance features construct was measured by insurance type, financial/insurance barriers to CGM user, pump use, SMBG, or other supplies; with higher values indicating more generou coverage. The adverse outcomes construct was measured by diabetic ketoacidosis (times diagnosed and times hospitalized) and severe hypoglycemia (times hospitalizes, ED visits, times with syncope or seizure, and times where paramedics were called); higher values indicate greater numbers of adverse events. Standardized path coefficients and model fit indices are shown.
Discussion
We identified that increasing SES and more generous insurance features are associated with diabetes technology use, and that diabetes technology use is associated with fewer adverse clinical outcomes among this insured sample, consistent with other published research.14,27-30 We additionally identified that overall, the impact of SES and insurance features on adverse outcomes in an insured sample primarily operated as indirect effects through diabetes technology use, suggesting that diabetes technology holds promise to be an equalizer in terms of acute clinical outcomes, but only if disparities in access to technology can first be addressed.
In a traditional regression analysis, the inability to parse our direct and indirect effects may lead analysts to miss important countervailing effects of insurance. Here, we identified that insurance features showed a positive direct effect on adverse outcomes, possibly as those with more complications or anticipating adverse events are more likely to seek out higher quality insurance (ie, adverse selection). Yet we additionally identified that there is a substantial indirect effect of insurance that operates through technology use, suggesting that those with more generous coverage of diabetes technology in fact may yield cost savings by reducing the likelihood of experiencing acute events like hospitalizations for DKA—further evidenced by the fact that the indirect effect of insurance predominated the direct effect. This is notable in the setting of the rising rates of DKA seen on a national level in the United States.21,31 Our previous work in both pediatric 21,23 and adult populations22,23 with T1D have demonstrated that the risk for DKA varied based on insurance type, with those with public insurance bearing the highest risk for DKA. Given the significant disparities seen with diabetes technology use by insurance features, providing more generous insurance coverage may be leveraged to improve equal access to technology, and in part address the escalating rates of DKA admissions in those who are insured. This approach will not address access in patients without insurance coverage (likely reflective of those of low SES) and who represent another vulnerable population that must also be intervened upon.
Interestingly, SES did not display a significant direct effect on adverse outcomes or on insurance features; however, this is likely due to the fact that this is a fully insured and mostly advantaged sample (eg, 59% with a bachelor’s degree or more, 30% with incomes ≥$100K, 89% white non-Hispanic) so a sample with greater variability in terms of socioeconomic context may demonstrate different findings. Additionally, as CGM use and initiatives for improved CGM coverage increase, more recent data may also demonstrate different findings. Despite these limitations, SES was still shown to be a significant predictor of technology use and as such, demonstrated a significant indirect effect on adverse outcomes that operated through access to technology, most notably CGM use. Higher SES is also associated with lower SMBG frequency which may be due in part to the higher use of CGM which reduces the burden of frequent SMBG. The fact that those with higher SMBG frequency are less likely to be CGM users also may account for the higher risk of negative outcomes in those with more frequent SMBG. CGM use is known to be significantly lower in groups of lower SES, 32 and those of low SES at higher risk for adverse outcomes. 24 The associations of CGM with better glycemic control, improvements in aspects of quality of life, and most importantly, its ability to improve the safety of T1D management, has led many to argue that unequal access to CGM results in critical injustices that must be addressed 33 and that current eligibility requirements for CGM coverage are “harmful, costly, and unjustified.” 9 These data suggest that broadening the extent of insurance coverage for patients will not only improve acute adverse outcomes but may act as a driver to diminish the existing disparities in outcomes seen in vulnerable and socioeconomically disadvantaged groups with T1D .
Several additional limitations should be considered. Insurance plans vary significantly in their qualities (copayments, deductibles, coverage, etc.). Although we are limited in the ability to capture the many difference between insurance types, by performing SEM and using an insurance construct that not only includes type of insurance but also generosity of insurance coverage for diabetes supplies, equipment, and technology, we believe this study captures more of this variability than if we used a single variable to stratify insurance type. As noted, this is an advantaged and fully insured sample so results likely do not generalize to the entire population with T1D . However, significant effects of SES and insurance were found despite these advantages, suggesting that these estimates may represent a best-case scenario in terms of their association with both access to diabetes technology and adverse clinical outcomes. Registry data made available and used in this study did not include information on the device manufacturers (with the exception of pumps in the 2015 survey) or other detailed information about how individuals were utilizing specific technology that may have been correlated with SES and outcomes, so influential pathways were potentially excluded from our model. Satisfactory model fit does suggest that pathways were appropriately specified among included variables.
Conclusion
The association between SES and insurance features and adverse outcomes was primarily mediated through diabetes technology use, suggesting that diabetes technology has the potential to mitigate acute clinical outcomes if disparities in access to technology can be addressed. Future work should seek to understand the range of existing barriers to these advantageous diabetes technologies including the nuances in insurance types (not all private insurance is the same regarding costs and coverage) and thus the specific opportunities for policy changes to address coverage-related barriers to optimal digital diabetes care and outcomes.
Supplemental Material
sj-docx-1-dst-10.1177_19322968211050649 – Supplemental material for Relationships Between Socioeconomic Status, Insurance Coverage for Diabetes Technology and Adverse Health in Patients With Type 1 Diabetes
Supplemental material, sj-docx-1-dst-10.1177_19322968211050649 for Relationships Between Socioeconomic Status, Insurance Coverage for Diabetes Technology and Adverse Health in Patients With Type 1 Diabetes by Estelle M. Everett and Lauren E. Wisk in Journal of Diabetes Science and Technology
Footnotes
Abbreviations
CGM, continuous glucose monitor; SEM, structural equal model; SES, socioeconomic status; T1D, type 1 diabetes; SMBG, self monitored blood glucose; ED, emergency department; GFI, goodness of fit index; RMSEA, root mean square error of approximation.
Author Contributions
Estelle M. Everett contributed to study design, interpreted the data, drafted the initial manuscript, and reviewed and revised the manuscript. Lauren E. Wisk conceptualized and designed the study, analyzed and interpreted that data, and reviewed and revised the manuscript. All authors approved the final manuscript as submitted and agree to be accountable for all aspects of the work.
Declaration of Conflicting Interests
The author(s) declared no potential conflicts of interest with respect to the research, authorship, and/or publication of this article.
Funding
The author(s) disclosed receipt of the following financial support for the research, authorship, and/or publication of this article: We wish to acknowledge the generous funding support from the National Institute of Diabetes and Digestive and Kidney Diseases (NIDDK) K01DK116932 (PI: Wisk) and L40DK129996 (PI: Everett).
Role of the Funder/Sponsor
The funders had no role in the design and conduct of the study; collection, management, analysis, and interpretation of the data; preparation, review, or approval of the manuscript, and decision to submit the manuscript for publication.
Supplemental material
Supplemental material for this article is available online.
References
Supplementary Material
Please find the following supplemental material available below.
For Open Access articles published under a Creative Commons License, all supplemental material carries the same license as the article it is associated with.
For non-Open Access articles published, all supplemental material carries a non-exclusive license, and permission requests for re-use of supplemental material or any part of supplemental material shall be sent directly to the copyright owner as specified in the copyright notice associated with the article.