
Abstract
Background:
Providing real-time magnitude and direction of glucose rate-of-change (ROC) via trend arrows represents one of the major strengths of continuous glucose monitoring (CGM) sensors in managing type 1 diabetes (T1D). Several literature methods were proposed to adjust the standard formula (SF) used for insulin bolus calculation by accounting for glucose ROC, but each of them provides different suggestions, making it difficult to understand which should be applied in practice. This work aims at performing an extensive in-silico assessment of their performance and safety.
Methods:
The methods of Buckingham (BU), Scheiner (SC), Pettus/Edelman (PE), Klonoff/Kerr (KL), Aleppo/Laffel (AL), Ziegler (ZI), and Bruttomesso (BR) were evaluated using the UVa/Padova T1D simulator, in single-meal scenarios, where ROC and glucose at mealtime varied between [-2,+2] mg/dL/min and [80,200] mg/dL, respectively. Efficacy of postprandial glucose control was quantitatively assessed by time in, above and below range (TIR, TAR, and TBR, respectively).
Results:
For negative ROCs, all methods proved to increase TIR and decrease TAR and TBR vs SF, with KL, PE, and BR being the most effective. For positive ROCs, a general worsening of the performances is present, only BR improved the glycemic control when mealtime glucose was close to hypoglycemia, while SC resulted the safest in the other conditions.
Conclusions:
Insulin bolus adjustment methods are effective for negative ROCs, but they generally appear to overdose for positive ROCs, calling for safer strategies in such a scenario. These results can be useful in outlining guidelines to identify which adjustment to apply based on the mealtime condition.
Keywords
Introduction
The use of continuous glucose monitoring (CGM) sensors in type 1 diabetes (T1D) therapy has spread considerably in the last decade thanks to their improved accuracy, 1 the demonstrated beneficial impact on patients’ glycemic control,2-4 and the approval for nonadjunctive use that made them a key element in T1D therapy decision-making process.5,6 The advantages offered by the adoption of CGM devices in T1D therapy are remarkable, since they provide not only quasi-continuous readings of glucose, but also display a trend arrow indicating its magnitude and direction, that is, rate-of-change (ROC). Trend arrows grant a rough short-term forecast of future glucose concentration to the user, who could leverage on them to preventively take hypotreatments or correction insulin boluses to mitigate the upcoming hypoglycemic or hyperglycemic episodes, respectively. As a consequence, knowledge of trend arrows opened up the possibility of their integration within the mealtime insulin bolus (IB) calculation, which, so far, is commonly performed through an empirical standard formula (SF) 7 defined as:

where IBSF (U) is the total IB amount, CHO (g) is the meal carbohydrates intake, CR (g/U) is the insulin-to-carbohydrates ratio, 8 Gc (mg/dl) is the current glucose concentration, GT (mg/dl) is the target glucose level, CF (mg/dl/U) is the correction factor, 8 and IOB (U) is the so-called insulin-on-board, that is, an estimate of the amount insulin still acting on the body from previous administrations. 9 As it can be noticed from (1), the SF does not integrate the information on glucose ROC provided by trend arrows, thus potentially leading to a suboptimal dosage. Intuitively, a positive ROC may suggest that IB dose should be increases, while, on the other hand, a negative ROC indicates that the dose should be reduced.
Even if intuitive, providing clear and effective recommendations on how to adjust the IB based on ROC is far from trivial, since under/over dosages could potentially lead to suboptimal glycemic control and, in some cases, to critical glycemic levels. 10 Hence, the need of precise guidelines together with the availability of trend arrows, fostered the development of several methodologies aimed at adjusting the IBSF by considering the ROC. However, a comprehensive comparison of the performance and safety of such methods is still missing.
Designing a trial to answer this question could not be easy, since comparing several methods for IB calculation on the same identical mealtime conditions could be practically impossible. This problem can be circumvented by resorting to in silico clinical trials (ISCTs), which are an important tool to draw preliminary indications.11,12 An ISCT for such a purpose was designed by Cappon et al., 13 where a simulation environment 14 was used to test mealtime insulin dosing strategies accounting for ROC on the same identical scenario. However, in Cappon et al. 13 the evaluation was limited to 3 literature methodologies available at that time, while in the last years several other methods were published.15-21
Hence, the aim of this work is performing a more extensive comparison, including, in addition to the 3 methods originally considered, other 4 recently published methods, reviewed in the following. As described in the methods section, multiple ISCTs, characterized by different prandial status in terms of blood glucose (BG) and ROC values, will be performed using the UVa/Padova T1D simulator in a single-meal scenario. Results will be summarized for positive and negative ROC scenarios. The main outcome is that all methods are overall effective for negative ROCs, but they generally appear to overdose for positive ROCs, calling for the development of safer strategies in such a scenario.
Methods
Literature Methods for IB Adjustment Accounting for ROC
We considered the 3 methods by Buckingham et al. (BU), 15 Scheiner (SC), 16 Pettus and Edelmann (PE), 17 already tested in Cappon et al., 13 and the 4 recent contributions by Klonoff and Kerr (KL), 18 Aleppo et al. (AL), 19 Ziegler et al. (ZI), 20 and Bruttomesso et al. (BR). 21 To summarize the methodologies, we classified them into 3 categories based on the different approaches adopted to adjust SF according to ROC.
Method based on a percent modulation of IBSF
This category contains only BU, which is the first published guideline for mealtime IB adjustment using ROC. The authors suggested to adjust IBSF of Eq. (1) by applying a percent modulation proportional to the ROC value. Of note, it has been shown that such modulation is perceived too modest from the patient perspective, who usually prefer larger adjustments. 22
Methods based on the adjustment of Gc in SF
This category, that includes SC and PE methods, exploits the notion of anticipated glucose, that is, the predicted glucose value in 30-60 minutes given Gc, and ROC. This interval approximately corresponds to the time required by rapid acting insulin analogue to affect the glucose concentration, in addition, the 30-60 minutes timeframe is short enough to assume that the glucose trend will be stable within that interval.
Thus, SC and PE methods followed this rationale to adjust the GC used within the SF in (1) according to ROC magnitude and direction by increasing/decreasing its value. Particularly, SC approach is more conservative compared to PE, since the former proposes adjustments lower in module compared to the latter.
Methods that correct IBSF by a fixed amount
The 3 previous methods could be burdensome for T1D individuals, especially for those who lack numeracy skills, and may experience difficulties in estimating the right dose due to the required calculations. For this reason, KL, AL, ZI, and BR works proposed a simplified approach, which consists in modifying the SF by a fixed insulin amount, both without considering personalized information of the T1D individual, as in KL, or adjusting also based on a personalized therapy parameter, that is, CF, as in AL, ZI, and BR.
We refer the reader to Supplemental Table 1 for more details on these methodologies.
In Silico Clinical Trials for the Assessment of Literature Methods for IB Adjustment
Simulation environment
Each methodology was assessed through ISCT in a simulated environment, being such a framework suitable for this type of analysis, where a virtual cohort of T1D individuals underwent different IB adjustments maintaining on the same identical scenario. The UVA/Padova T1D Simulator 14 was used, which relies on a physiological model of the glucose-insulin regulatory system, able to generate synthetic data of 100 individuals with T1D. The virtual cohort included only adult subjects, which assumed a range of CF values from 26 to 67 mg/dL/U.
Within this framework, each subject underwent multiple single-meal ISCTs, lasting 12 hours, from 7 am to 7 pm. The first timeframe (from 7 am to 1 pm) was exploited to bring the subject to specific prandial conditions. Particularly, we simulated different scenarios in terms of ROC, ranging between -2 and +2 mg/dL/min with a step of 0.5 mg/dL, and BG, taking values of 80, 120, 160, and 200 mg/dL. We did not cover ROC values higher than 2 mg/dL and lower than -2 mg/dL, since those values were not easily obtainable through realistic actions (eg, small CHO intakes or insulin boluses) assumed in the preprandial window. Then, a meal was set at 1 pm, when each virtual subject had a carbohydrate intake composed by different amounts (from 10 to 150 g, with a step of 10 g) and the corresponding IB, computed using the methodologies under assessment (SF, BU, SC, PE, KL, AL, ZI, BR), was tested for each prandial condition. The simulation lasted for a postprandial interval of 6 hours (from 1 pm to 7 pm), in which glucose fluctuations were not affected by any corrective action. Moreover, within the experimental set-up, we did not consider any source of error, that is, BG measurement error, ROC estimation error, CHO counting error, nor variability, that is, insulin sensitivity, to evaluate only the contribution given by the literature methods. Thus, for each prandial status, which is defined by a specific combination of ROC and BG at mealtime, 1500 glycemic traces were generated, resulting from 15 different CHO amounts for every virtual subject.
Evaluation metrics and statistical analysis
For the sake of simplicity, results were grouped into 2 different main scenarios based on prandial ROC value, that is, negative (-2, -1.5, -1 mg/dL) and positive (1, 1.5, 2 mg/dL), to assess the benefit of a decreased and increased IB dose separately. Moreover, we evaluated the literature methods performances within the 6-hour postprandial interval of each simulation, by computing standard metrics that quantify glucose control, such as the BG risk index (BGRI), 23 the percentage of time spent within the target glycemic range (TIR), that is, BG ∈ 70-180 mg/dl, above the range (TAR), that is, BG > 180 mg/dl and below the range (TBR),24,25 that is, BG < 70 mg/dl. 26 To better highlight the possible improvement with respect to SF, we calculated the point differences between each metrics obtained with the literature methods and SF (ΔBGRI, ΔTIR, ΔTAR, ΔTBR). In addition, summary results of each single metric distribution will be presented as median and interquartile range.
The statistical significance was evaluated on the single metric distributions, by applying the Friedman’s test with a 5% significance level. We used this nonparametric test, due to the non-Gaussian metric distributions and the repetition of the subjects within the dataset. Moreover, the P-values resulting from the statistical test were adjusted using the Bonferroni correction to account for multiple comparisons.
Results
Differences between the metric distributions (ΔBGRI, ΔTIR, ΔTAR, ΔTBR) are shown in Figures 1 to 4, for the 2 scenarios, that is, positive and negative ROC, and for each prandial BG value considered in the study, that is, 80 mg/dL, 120 mg/dL/160 mg/dL, 200 mg/dL. In the figures, we highlighted with green/red backgrounds the regions in which the literature methods led to an improvement/worsening of glucose control vs SF, respectively. Moreover, in Tables 1 and 2 the resulting median and interquartile ranges of the single metric distributions for each method are reported. For each scenario, the method leading to the best glucose control was selected and highlighted with bold text within Tables 1 and 2. The selection was performed by looking first at those minimizing BGRI, which is a global metric considering both the risk of hyperglycemia and hypoglycemia, in presence of similar BGRI values, also TAR, TIR, and TBR were taken into account in the selection process.
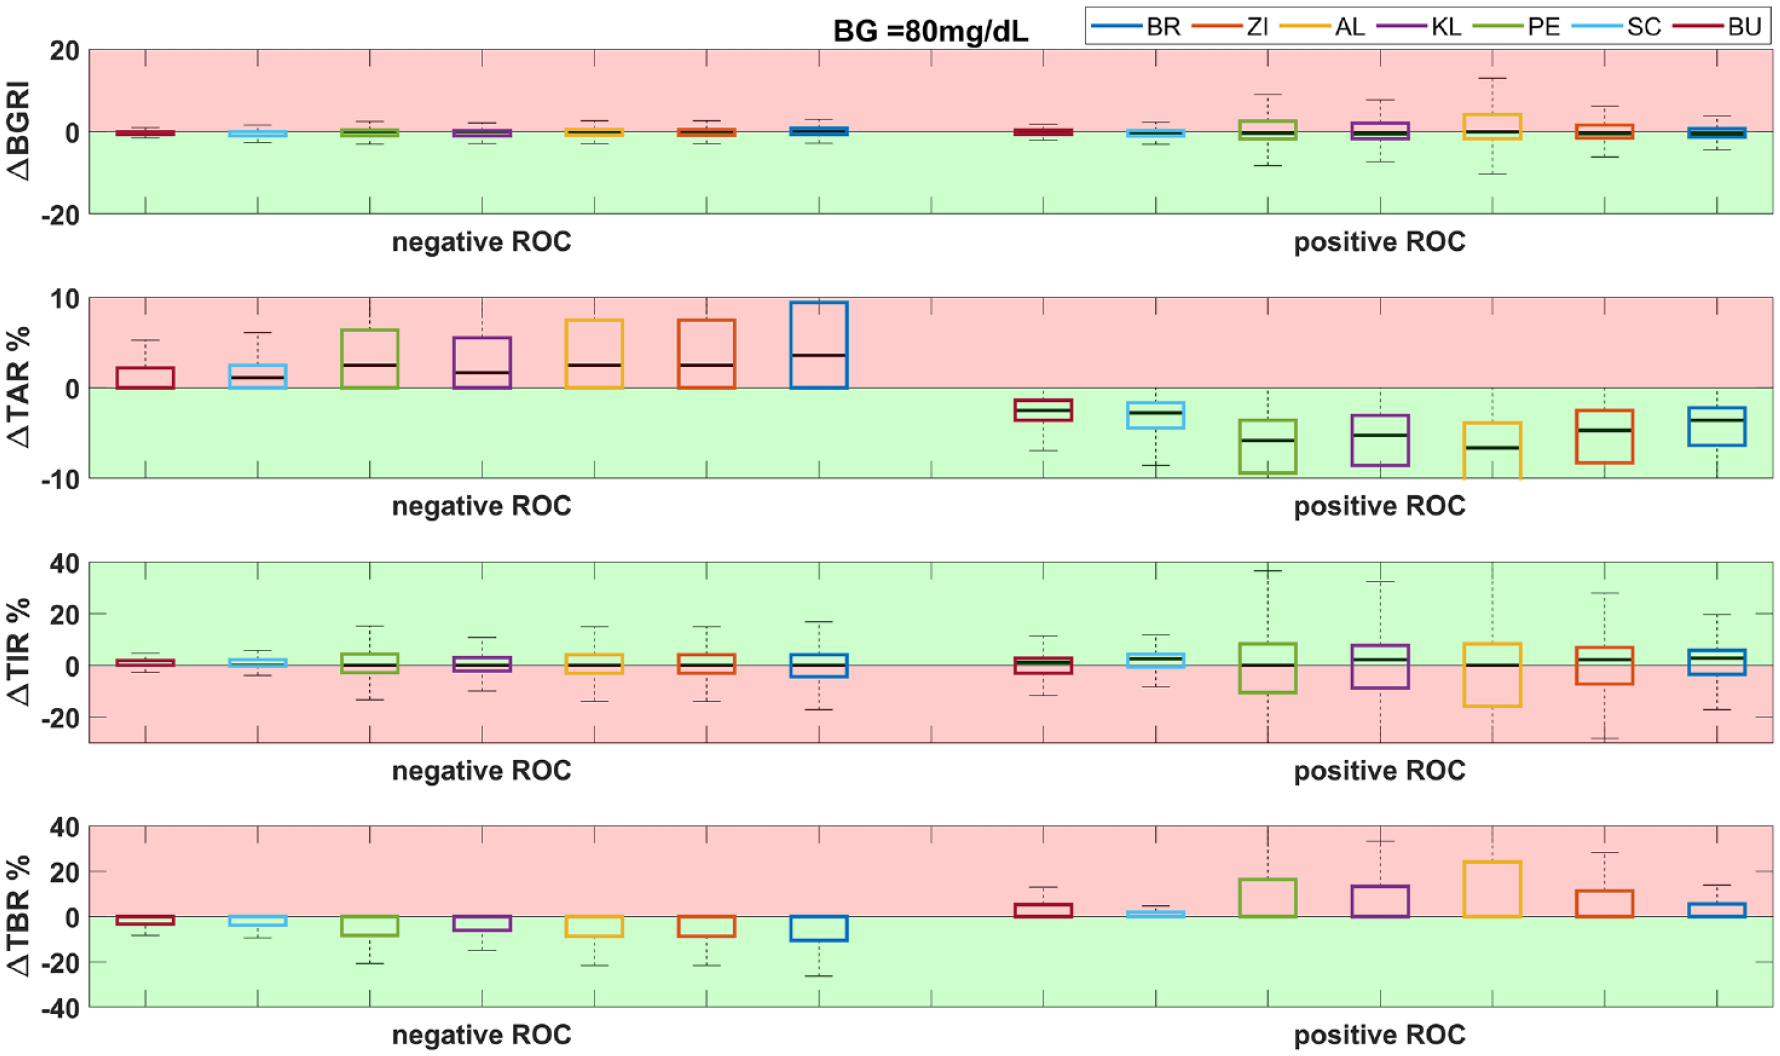
Distribution of ΔBGRI, ΔTAR, ΔTIR, ΔTBR (difference between the literature methods and SF) for negative (left) and positive (right) ROC with a prandial BG of 80 mg/dL. The green background corresponds to an improvement of the method with respect to SF, while the red background corresponds to a worsening.
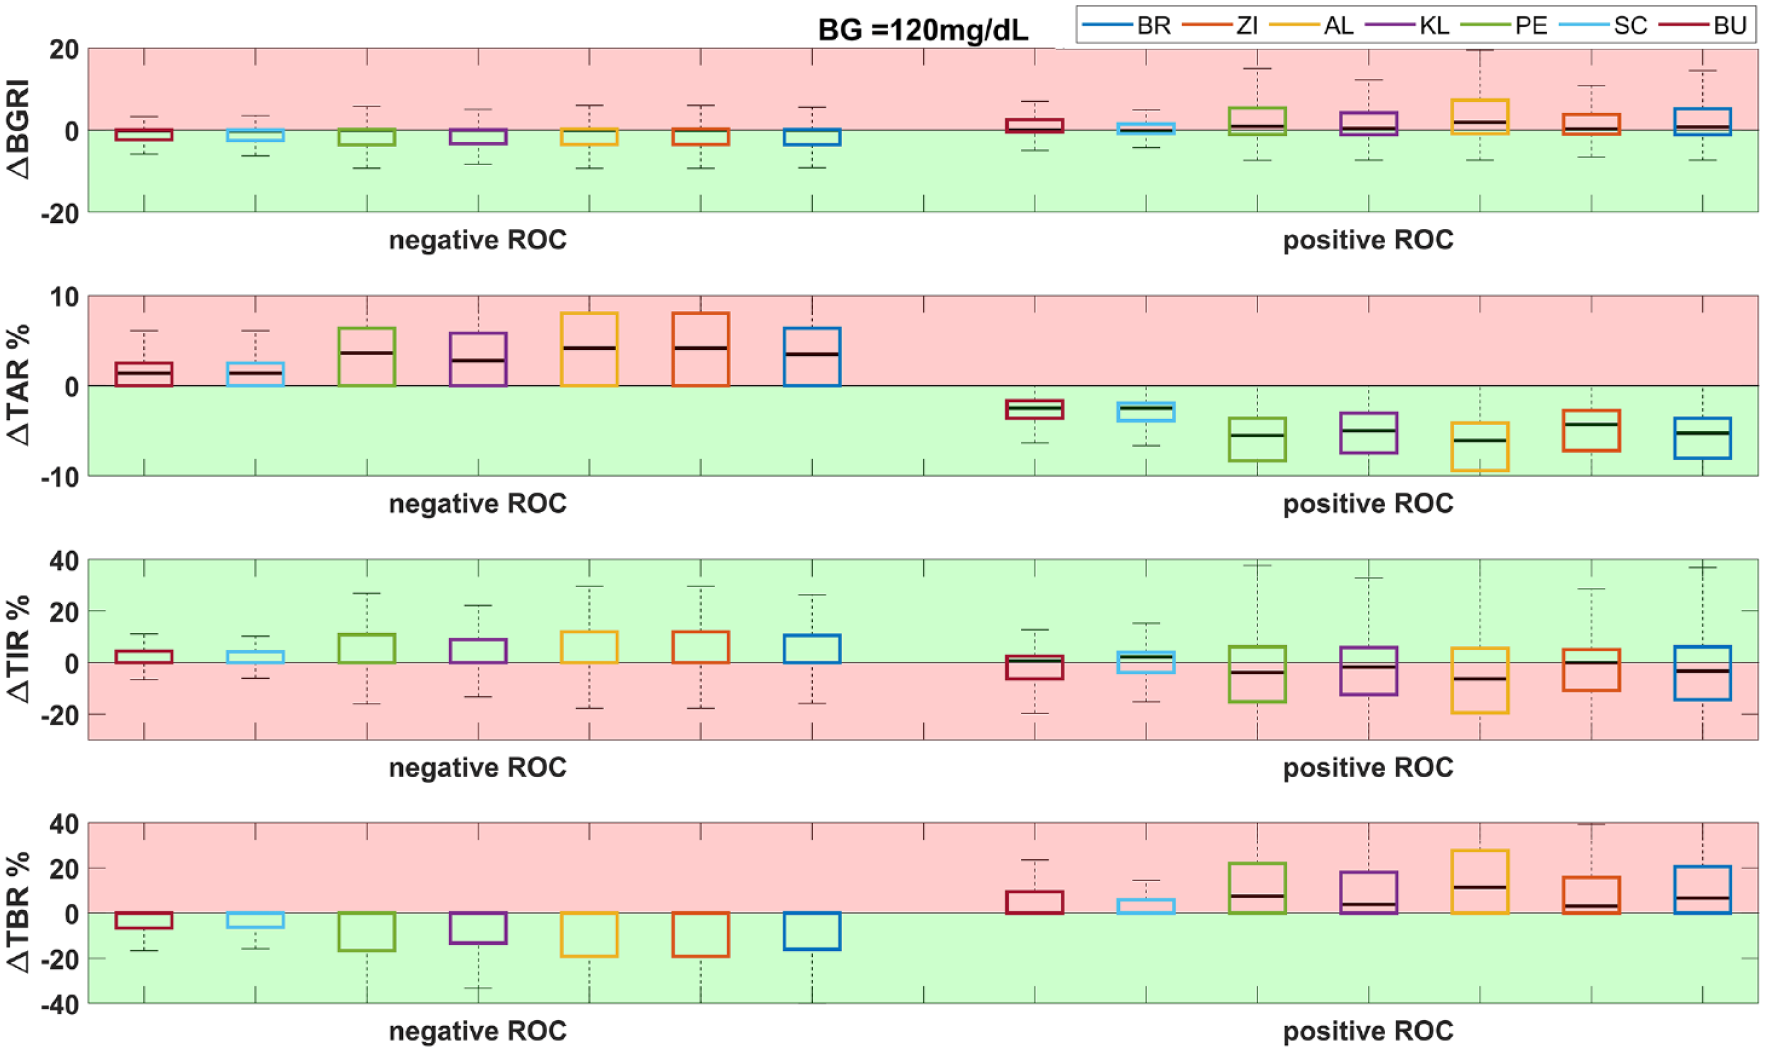
Distribution of ΔBGRI, ΔTAR, ΔTIR, ΔTBR (difference between the literature methods and SF) for negative (left) and positive (right) ROC with a prandial BG of 120 mg/dL. The green background corresponds to an improvement of the method with respect to SF, while the red background corresponds to a worsening.
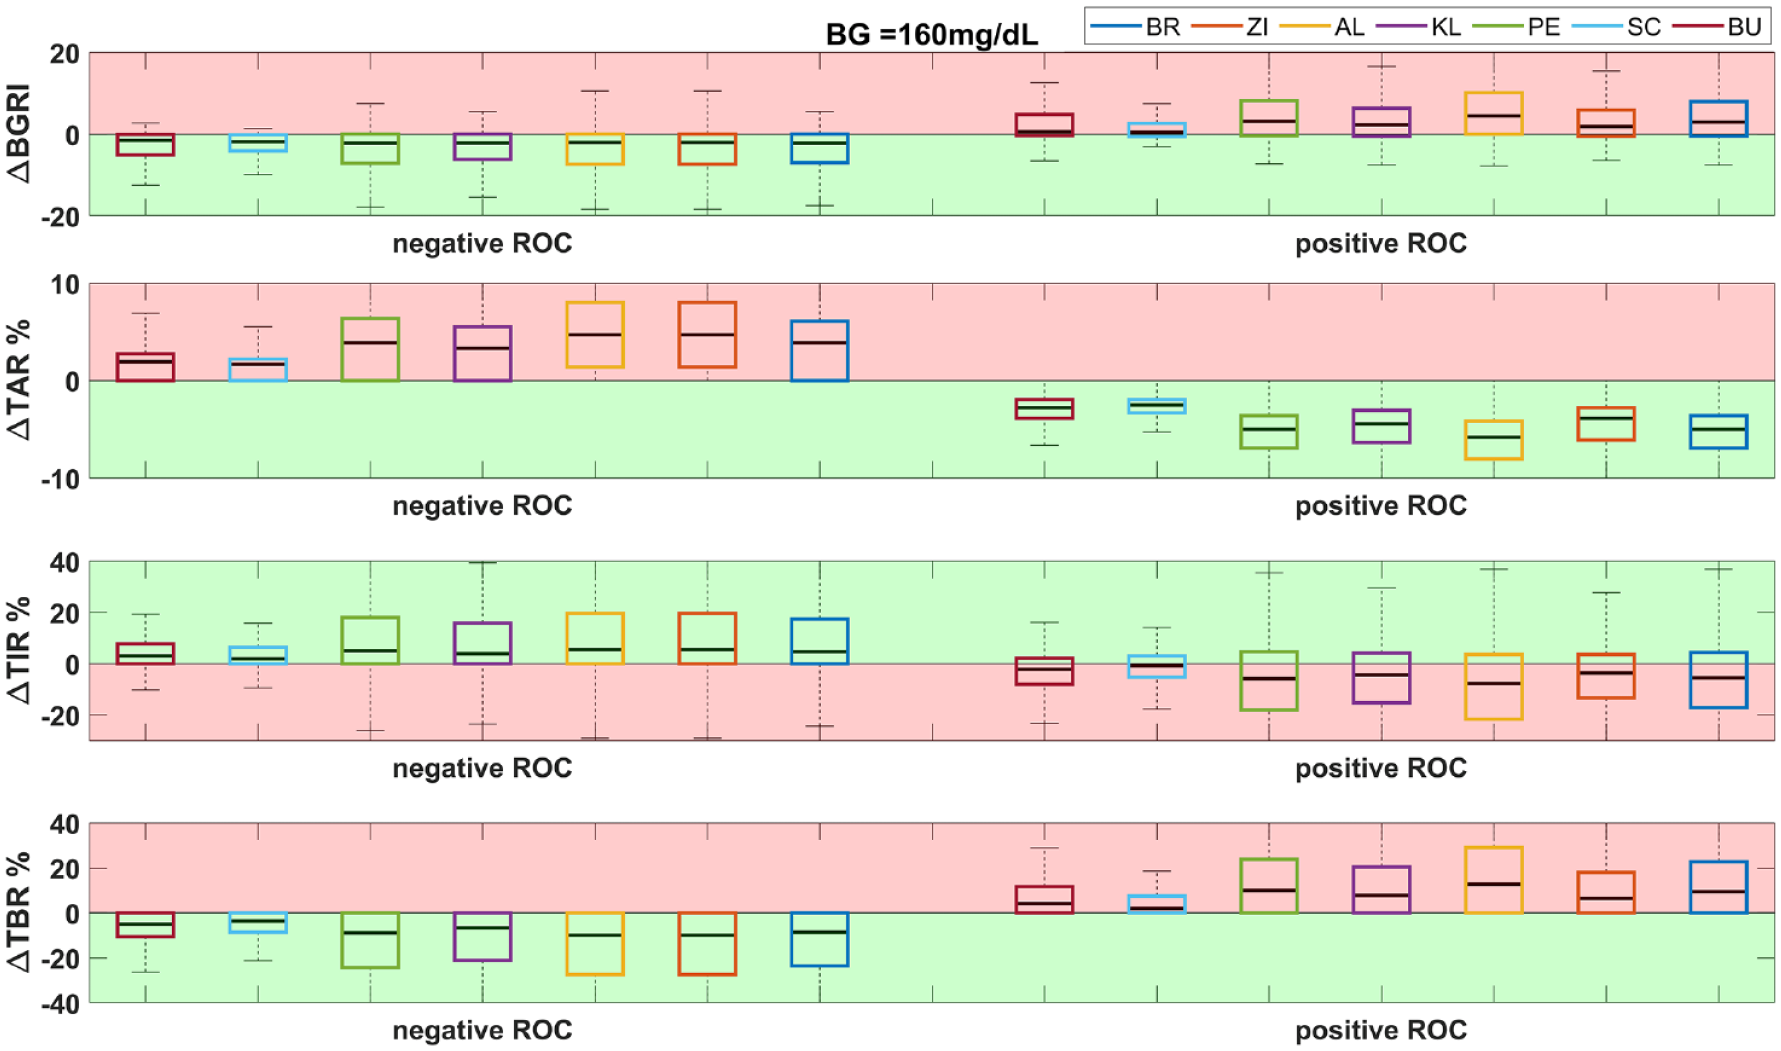
Distribution of ΔBGRI, ΔTAR, ΔTIR, ΔTBR (difference between the literature methods and SF) for negative (left) and positive (right) ROC with a prandial BG of 160 mg/dL. The green background corresponds to an improvement of the method with respect to SF, while the red background corresponds to a worsening.
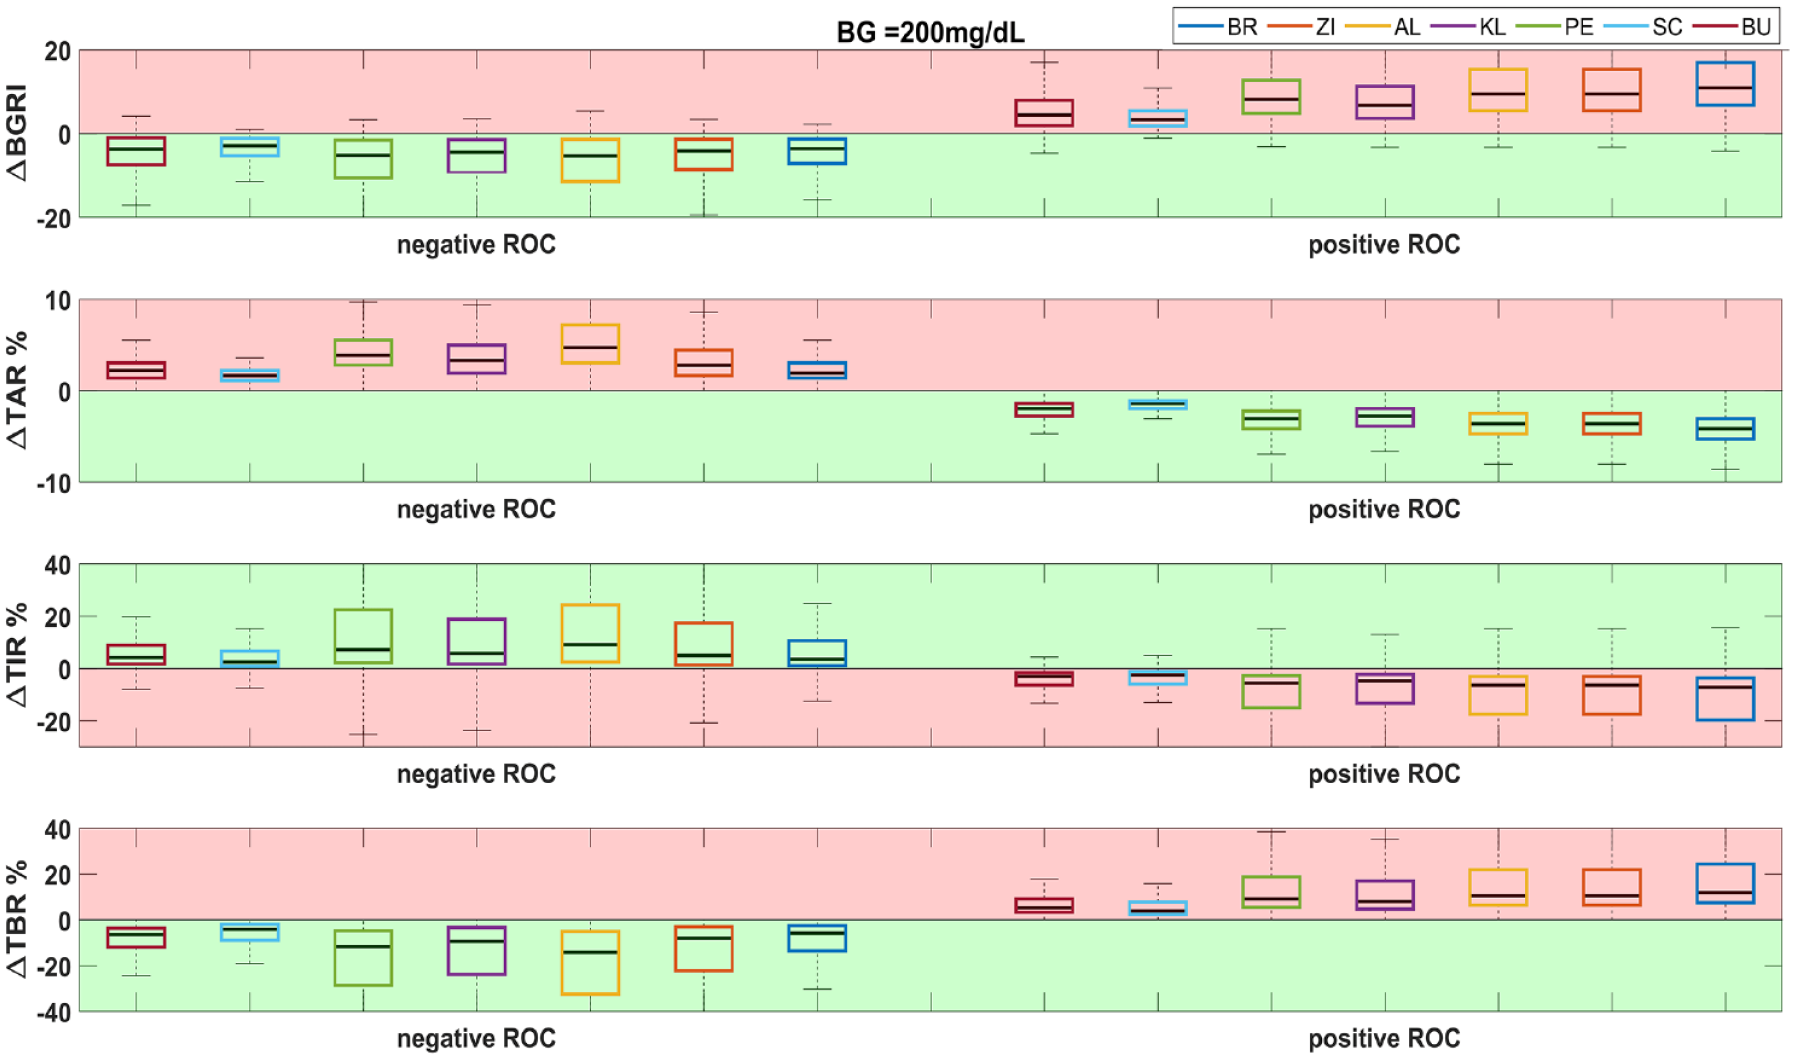
Distribution of ΔBGRI, ΔTAR, ΔTIR, ΔTBR (difference between the literature methods and SF) for negative (left) and positive (right) ROC with a prandial BG of 200 mg/dL. The green background corresponds to an improvement of the method with respect to SF, while the red background corresponds to a worsening.
Quantitative Assessment of Glycemic Control When Prandial ROC Is Negative.
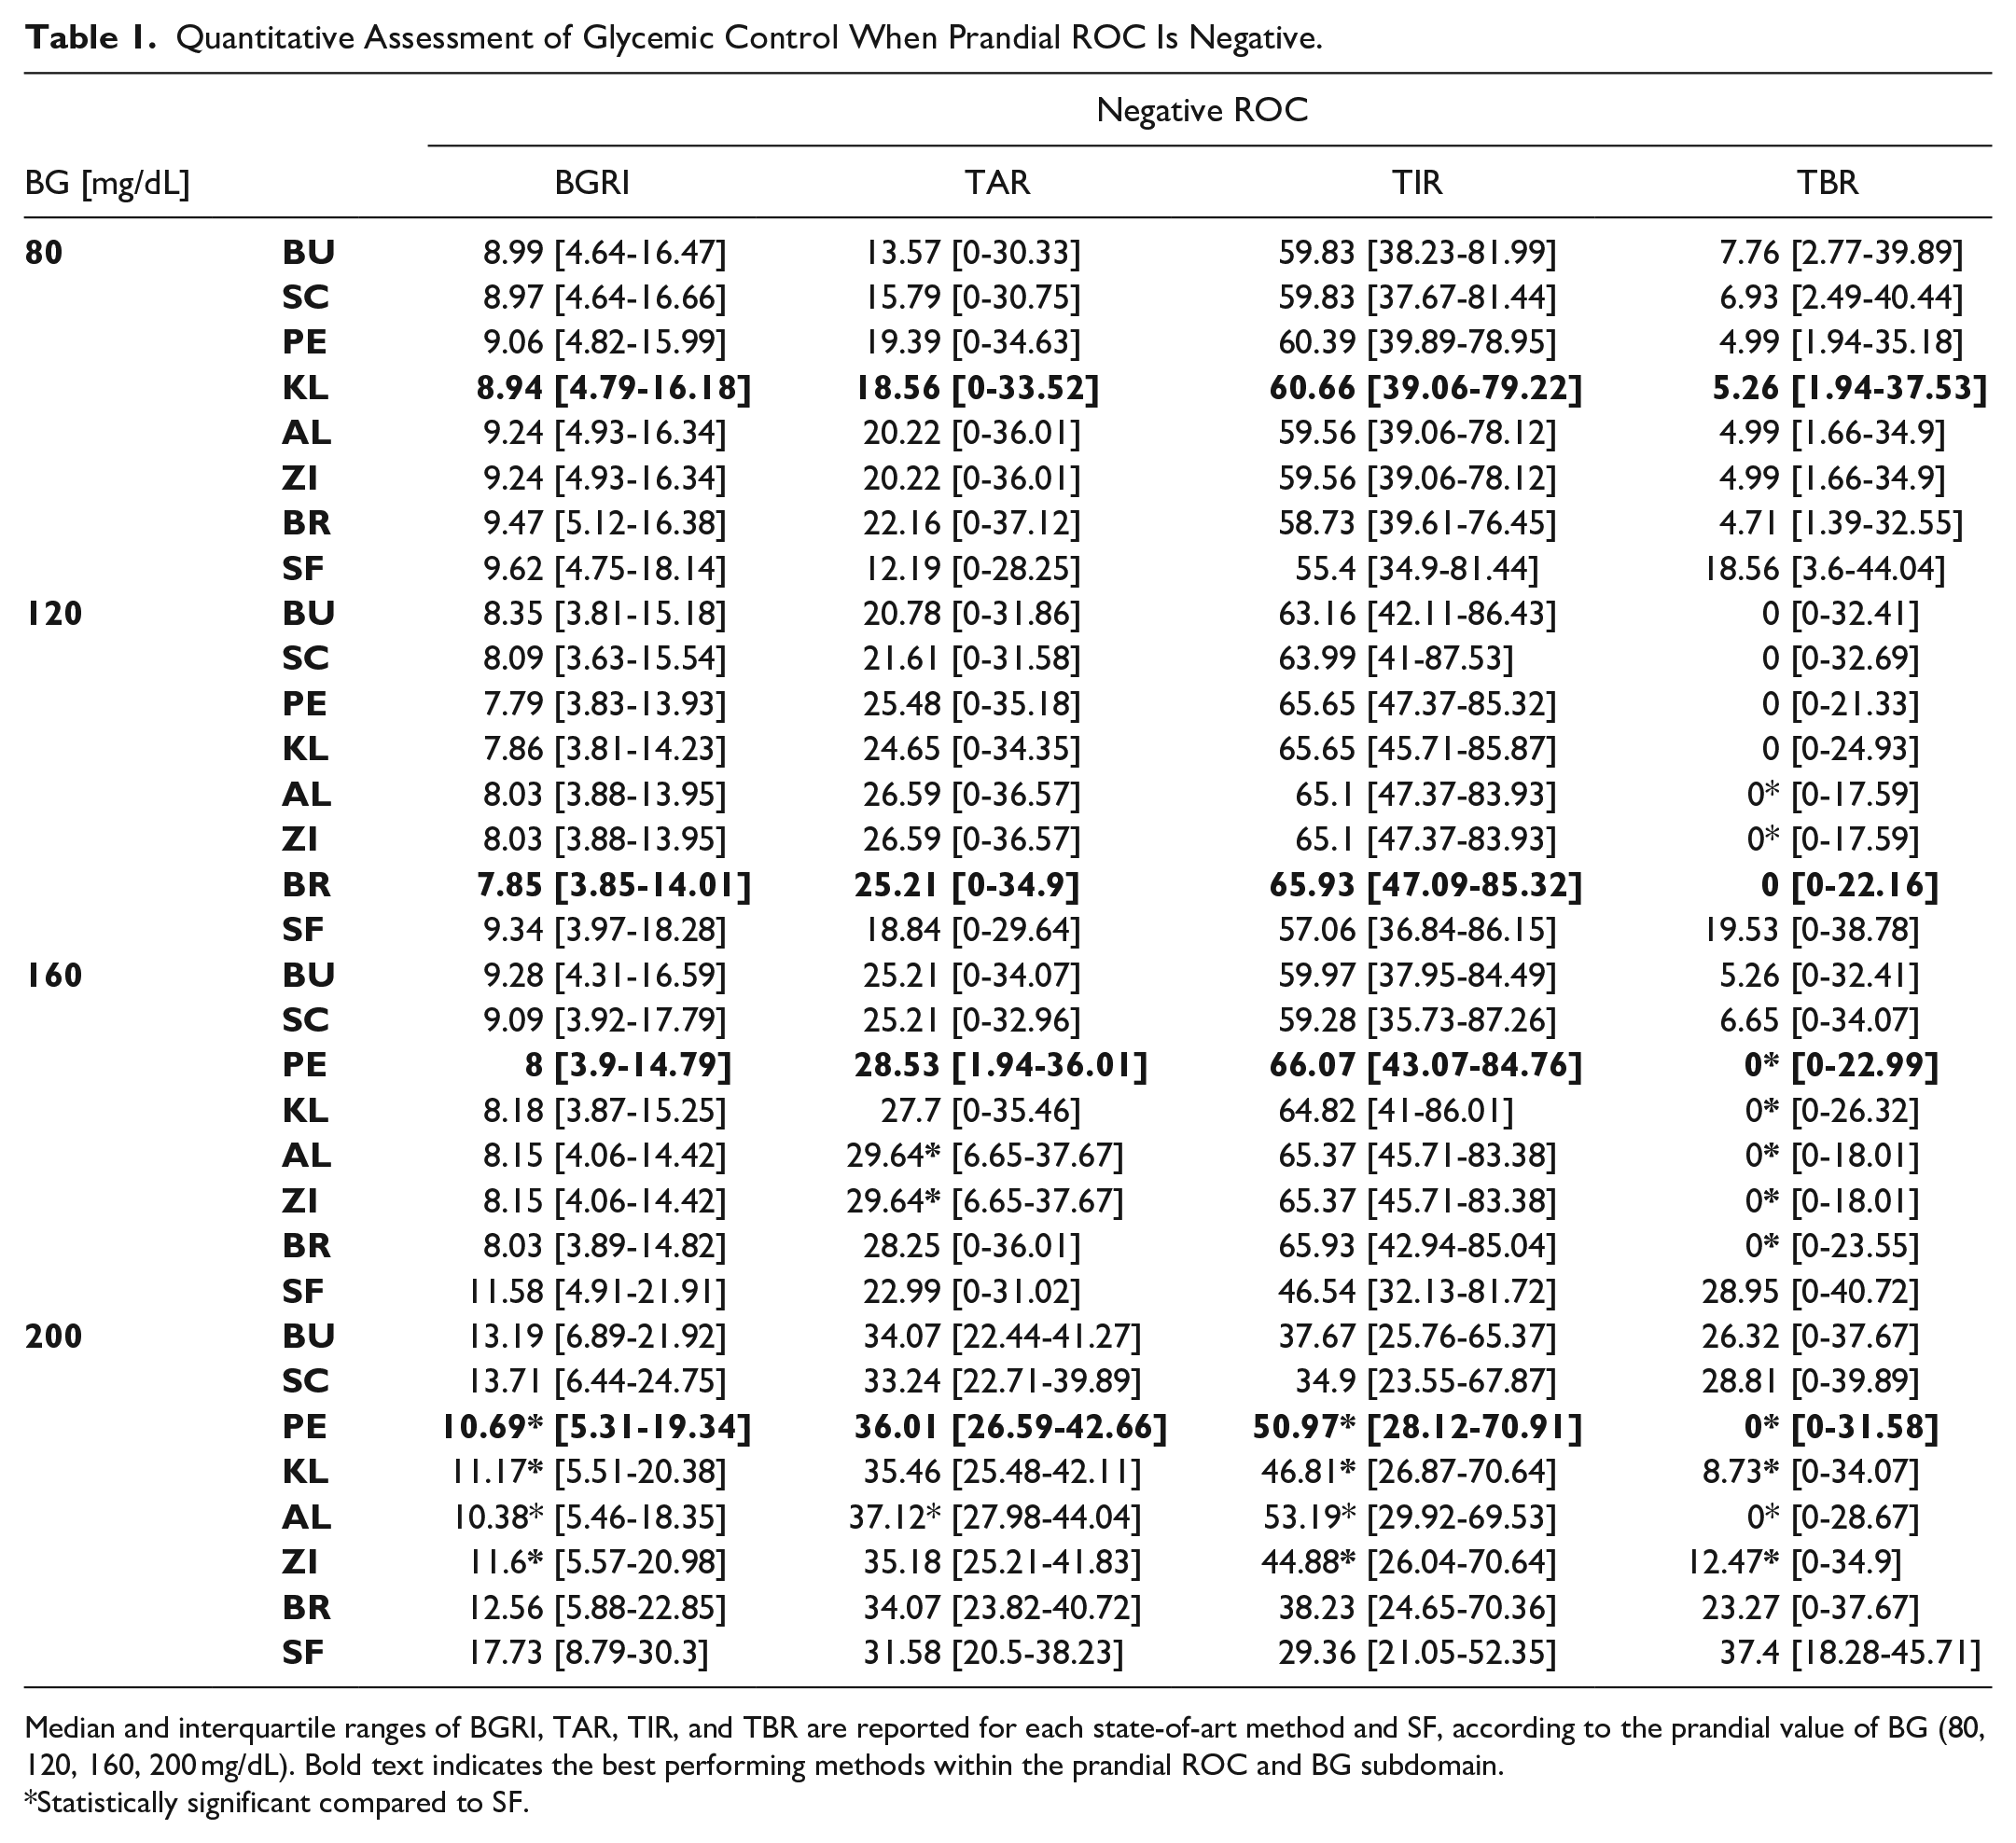
Median and interquartile ranges of BGRI, TAR, TIR, and TBR are reported for each state-of-art method and SF, according to the prandial value of BG (80, 120, 160, 200 mg/dL). Bold text indicates the best performing methods within the prandial ROC and BG subdomain.
Statistically significant compared to SF.
Quantitative Assessment of Glycemic Control When Prandial ROC Is Positive.
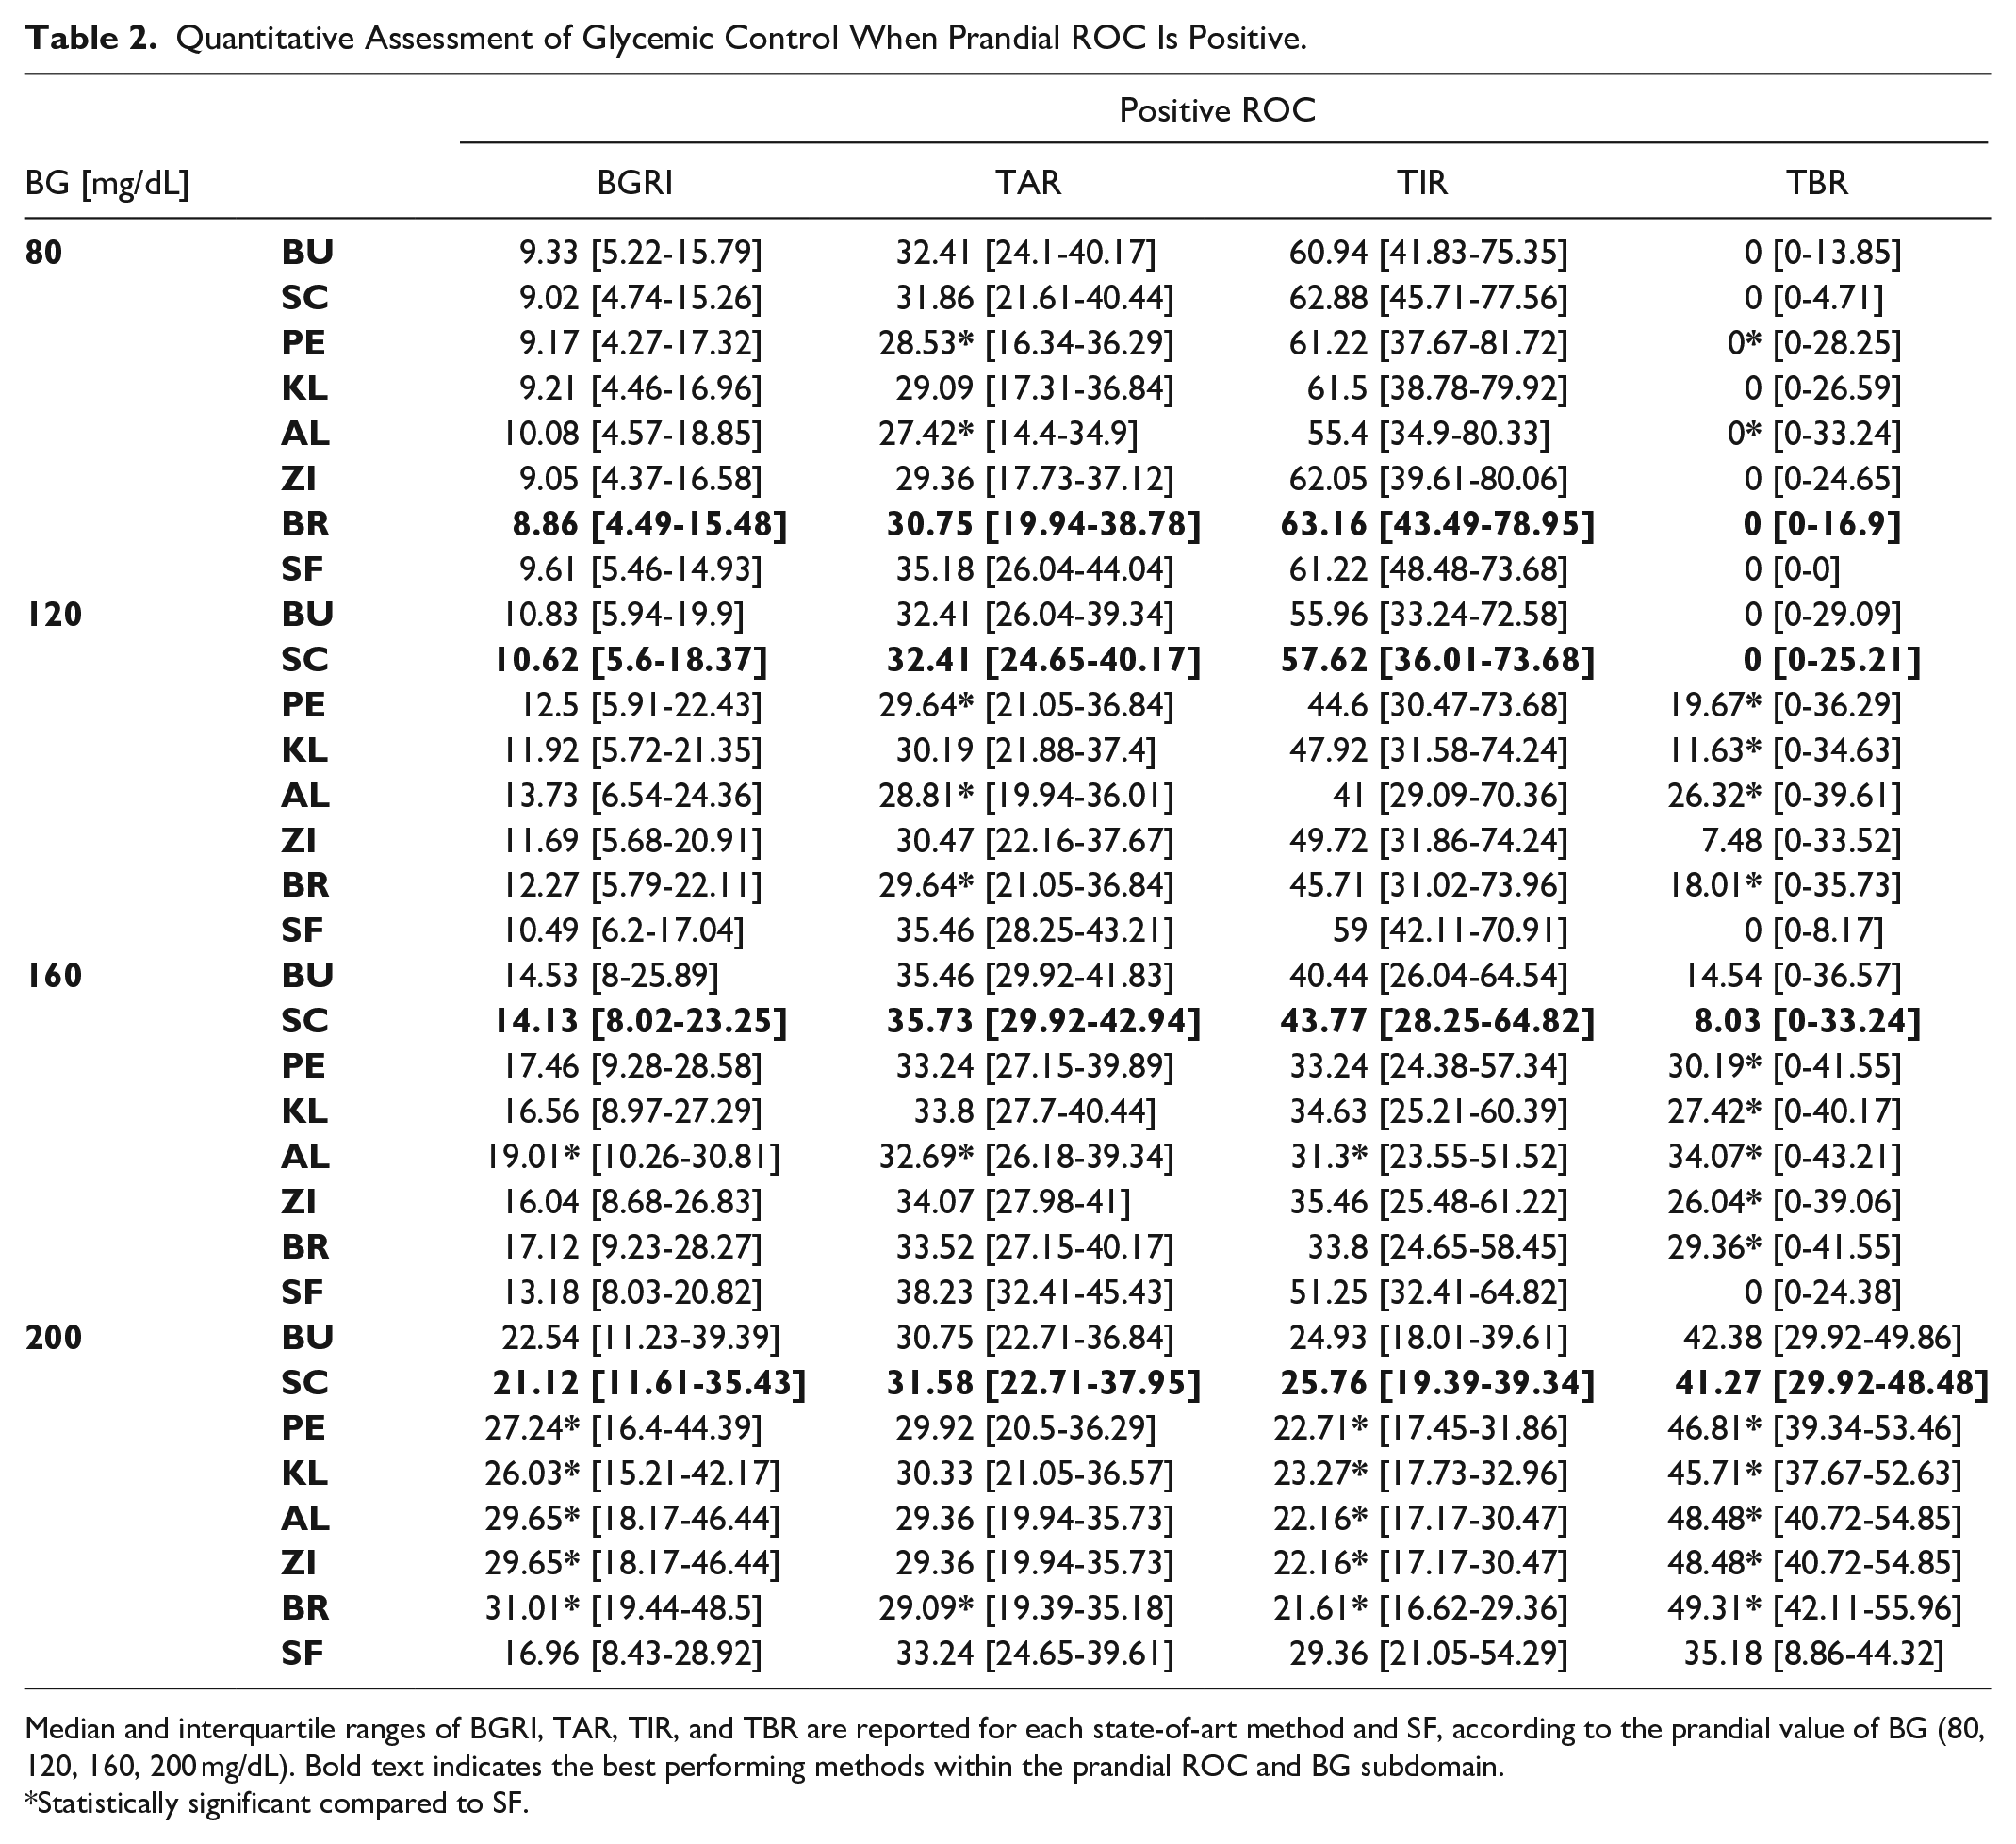
Median and interquartile ranges of BGRI, TAR, TIR, and TBR are reported for each state-of-art method and SF, according to the prandial value of BG (80, 120, 160, 200 mg/dL). Bold text indicates the best performing methods within the prandial ROC and BG subdomain.
Statistically significant compared to SF.
Negative ROC Scenario
As shown in the left side of Figures 1 to 4, similar glycemic control was obtained when the ROC is negative for all considered metrics and all BG values. In particular, it was generally found that ΔTAR < 0 (red zone), indicating an increased TAR compared to SF. On the other hand, ΔTBR was mostly above 0 (green zone), showing an improvement of TBR for all methods vs SF. This result was expected, since a negative ROC drives to a lower IB amount compared to SF, promoting the shortcoming of hyperglycemic episodes. Moreover, ΔTIR and ΔBGRI improved for all the BG values compared to SF. The overall improvement of the latter metric can be explained by the greater risk associated to hypoglycemia with respect to hyperglycemia within the BGRI. Finally, it can be noticed that the more the starting BG is higher, the more the improvement in terms of ΔBGRI, ΔTBR, and ΔTIR is evident.
Analyzing the results of the single metrics reported in Table 1, the following considerations can be made:
Positive ROC Scenario
By observing the right side of Figures 1 to 4, similar, specular, considerations to the previous scenario can be made for all BG values while considering positive ROC values. As expected, since in such a scenario all methods led to a higher IB dosage, the ΔTAR improved (green zone), while the ΔTBR generally showed positive distributions (red zone), indicating an increased number of hypoglycemic episodes induced by the considered methods with respect to SF. The medians ΔBGRI and ΔTIR resulted mostly above and below zero (red zones), respectively, suggesting a general worsening of the overall glycemic control, especially when high mealtime BG values were considered.
By analyzing Table 2, the following considerations can be made:
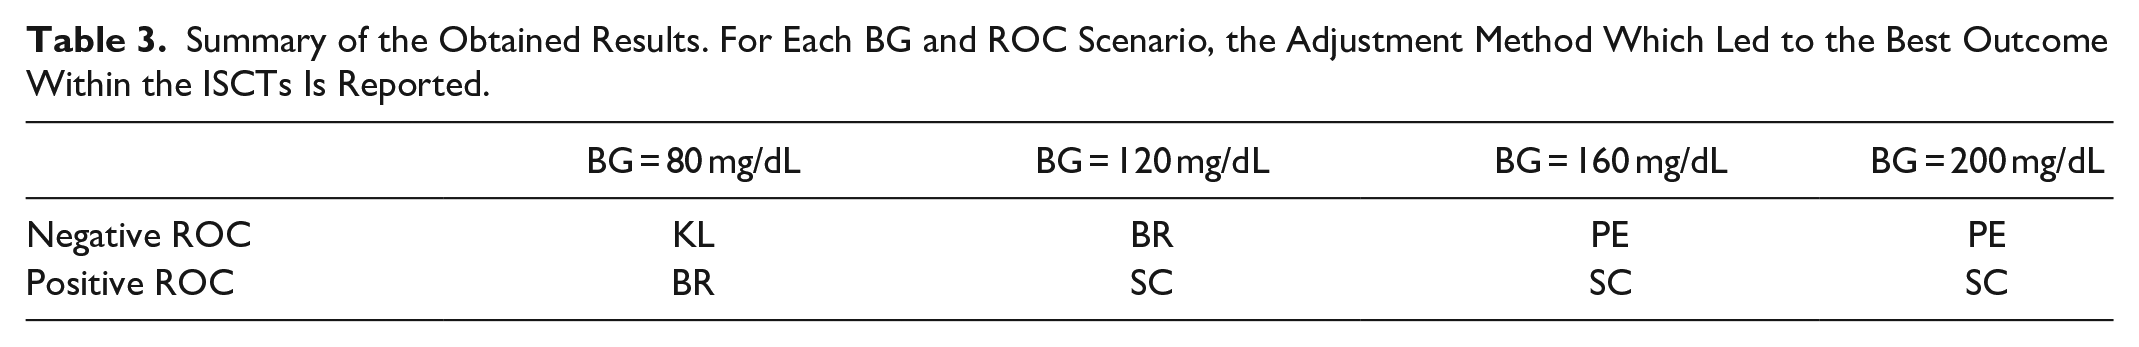
Table 3 reports a summary of the results obtained with the simulations, which allows better identifying the most effective correction method for each prandial BG and ROC scenario we tested.
Summary of the Obtained Results. For Each BG and ROC Scenario, the Adjustment Method Which Led to the Best Outcome Within the ISCTs Is Reported.
Discussion and Conclusion
In this work, we evaluated through ad-hoc ISCTs, 7 literature methods for IB adjustment based on CGM trend arrows, by considering different mealtime scenarios in terms of starting BG and ROC. The analysis pointed out that there is no method that is globally the most effective. However, by investigating the results grouped by BG and ROC subdomains, we noticed that some methods are more effective and safer than others. In general, when negative ROCs are considered, the resulting reduction of IB dosage suggested by all the methodologies proved to be beneficial in terms of glucose control, increasing BGRI and TIR, and decreasing TBR, with a modest increase in TAR. In this scenario, BU and SC were found to be systematically too conservative, leading to a minor improvement compared to the other methods. In contrast, the benefits provided by PE, KL, AL, ZI, and BR are more evident. We selected KL as best performing method for a low starting BG value (80 mg/dL), BR for a BG value of 120 mg/dL, and PE for both BG approaching the hyperglycemic range (160 mg/dL) and BG in hyperglycemia (200 mg/dL).
On the other hand, when the prandial ROC is positive, our results showed the potential risk introduced by the increase of the IB dose. In general, TIR, BGRI, and TBR worsened with respect to SF. For a low prandial BG (80 mg/dL) BR resulted the best performing recommendation, while for higher starting BG values, the most conservative methods SC and BU proved to be safer.
Limitations of the study are represented by the investigated ROC range considered for the analysis, which did not include ROC higher than 2 mg/dL and lower than −2 mg/dL, together with the limited CF parameter subdomain of the virtual population. Future works will address these limitations, by extending the ROC and CF domain. Moreover, possible extensions of this study are represented by the application of the literature recommendations to a virtual cohort of adolescents and children; the inclusion of higher/lower prandial glucose levels, thus testing the methods in more critical and challenging scenarios; and the investigation of the benefits provided by the methods with respect to a delayed or anticipated mealtime IB administration.
In our opinion, the results presented in this paper should be used more qualitatively than quantitatively, knowing that ad-hoc clinical trials to further validate the effectiveness of the methods are required. However, the indications are clear and solid, suggesting that, in general, decreasing IB for negative trend arrows is safe, while increasing IB when the trend arrow is positive could not be. The analysis showed that there is no method that is the best performing in all scenarios, and allowed identifying, for each prandial glucose and trend arrow, which are the methods that could provide more benefits in terms of glucose control. Therefore, being the ROC adjustment a function of prandial glucose and trend arrow, a hybrid solution such that proposed in Table 3, which combines the best performing methods for each prandial condition, is the one that in our opinion should be suggested. From a practical perspective, asking to the T1D individual to apply different rules based on prandial conditions can be not straightforward. However, the adoption of a hybrid method can be made easy for example, using mobile apps able to get real-time data from CGM sensors an automatically provide to the user the correct adjusted dose, without requiring any user intervention (see eg, the work of Cappon et al. 27 ).
In conclusion, the analysis conducted represents a step forward to close the gap present in the literature, by providing more information about the practical use of methods to adjust IB accounting for trend arrows, thus helping to define clear and safe guidelines to people with T1D for insulin dosing adjustments.
Supplemental Material
sj-pdf-1-dst-10.1177_19322968211043162 – Supplemental material for Methods for Insulin Bolus Adjustment Based on the Continuous Glucose Monitoring Trend Arrows in Type 1 Diabetes: Performance and Safety Assessment in an In Silico Clinical Trial
Supplemental material, sj-pdf-1-dst-10.1177_19322968211043162 for Methods for Insulin Bolus Adjustment Based on the Continuous Glucose Monitoring Trend Arrows in Type 1 Diabetes: Performance and Safety Assessment in an In Silico Clinical Trial by Giulia Noaro, Giacomo Cappon, Giovanni Sparacino, Federico Boscari, Daniela Bruttomesso and Andrea Facchinetti in Journal of Diabetes Science and Technology
Footnotes
Acknowledgements
This work was partially supported by MIUR, Italian Ministry for Education, under the initiatives “Departments of Excellence” (Law 232/2016)
Abbreviations
(T1D) type 1 diabetes, (FDA) Food and Drug Administration, (SF) standard formula, (IB) insulin bolus, (BG) blood glucose, (ROC) rate-of-change, (CGM) continuous glucose monitoring, (ISCT) in-silico clinical trials, (BGRI) blood glucose risk index, (TIR) time in range, (TAR) time above range, (TBR) time below range, (BU) Buckingham et al., (SC) Scheiner, (PE) Pettus/Edelman et al., (KL) Klonoff/Kerr, (AL) Aleppo et al., (ZI) Ziegler et al., (BR) Bruttomesso et al.
Declaration of Conflicting Interests
The author(s) declared the following potential conflicts of interest with respect to the research, authorship, and/or publication of this article: Daniela Bruttomesso, and Federico Boscari have received lecture fees from Abbott and Roche.
Funding
The author(s) disclosed receipt of the following financial support for the research, authorship, and/or publication of this article: Part of this work was supported by MIUR (Italian Minister for Education) under the initiative “Departments of Excellence” (Law 232/2016).
Supplemental Material
Supplemental material for this article is available online.
References
Supplementary Material
Please find the following supplemental material available below.
For Open Access articles published under a Creative Commons License, all supplemental material carries the same license as the article it is associated with.
For non-Open Access articles published, all supplemental material carries a non-exclusive license, and permission requests for re-use of supplemental material or any part of supplemental material shall be sent directly to the copyright owner as specified in the copyright notice associated with the article.