
Abstract
The assessment and characterization of trend accuracy, that is, the ability of a continuous glucose monitoring (CGM) system to correctly indicate the direction and rate of change (RoC) of glucose levels, has received comparatively little attention in the overall evaluation of CGM performance. As such, only few approaches that examine the trend accuracy have been put forward. In this article, we review existing approaches and propose the clinical trend concurrence analysis (CTCA) which is an adaptation of the conventional trend concurrence analysis. The CTCA is intended to directly evaluate the trend arrows displayed by the CGM systems by characterizing their agreement to suitably categorized comparator RoCs. Here, we call on manufactures of CGM systems to provide the displayed trend arrows for retrospective analysis. The CTCA classifies any deviations between the CGM trend and comparator RoC according to their risk for an adverse clinical event arising from a possibly erroneous treatment decision. For that, the existing rate error grid analysis and a specific set of trend arrow-based insulin dosing recommendations were used. The results of the CTCA are presented in an accessible graphical display and exemplified on data from three CGM systems. With this article, we hope to increase the awareness for the importance and challenges of assessing the accuracy of trend information displayed by CGM systems.
Introduction
The evaluation of continuous glucose monitoring (CGM) system performance is a prerequisite for the safe and effective application of CGM in modern diabetes therapy. As discussed in a recent review article, 1 CGM system performance, as determined in a clinical study, encompasses aspects such as accuracy, stability as well as alert and technical reliability. Here, the aspect of accuracy is considered to be of the highest importance and a distinction between point and trend accuracy can be made. According to the POCT05 guideline published by the Clinical and Laboratory Standards Institute (CLSI), the term point accuracy is defined as “closeness in agreement between a glucose test result and an accepted reference value at single points in time,” whereas the term trend accuracy is defined as “the ability of the continuous glucose monitoring system to correctly measure the rate and direction of changes in glucose concentration over time.” 2 As such, point and trend accuracy can characterize the reliability of the two types of information displayed by CGM systems at any given time: a glucose level reading and a trend arrow. In most current-generation CGM systems, the trend arrow is a representation of the direction and magnitude of current changes in glucose levels. However, unlike the CGM readings, which are presented on a quasi-continuous scale, the trend arrow categorizes the rate of change (RoC) of glucose levels determined by the CGM system in five to seven different arrow displays. An overview of the trend arrow displays used by the current-generation CGM systems of Abbott, Dexcom, and Medtronic is provided in Table 1.
Overview of Trend Arrow Displays in the Current-Generation Continuous Glucose Monitoring Systems of Abbott, Dexcom, and Medtronic.
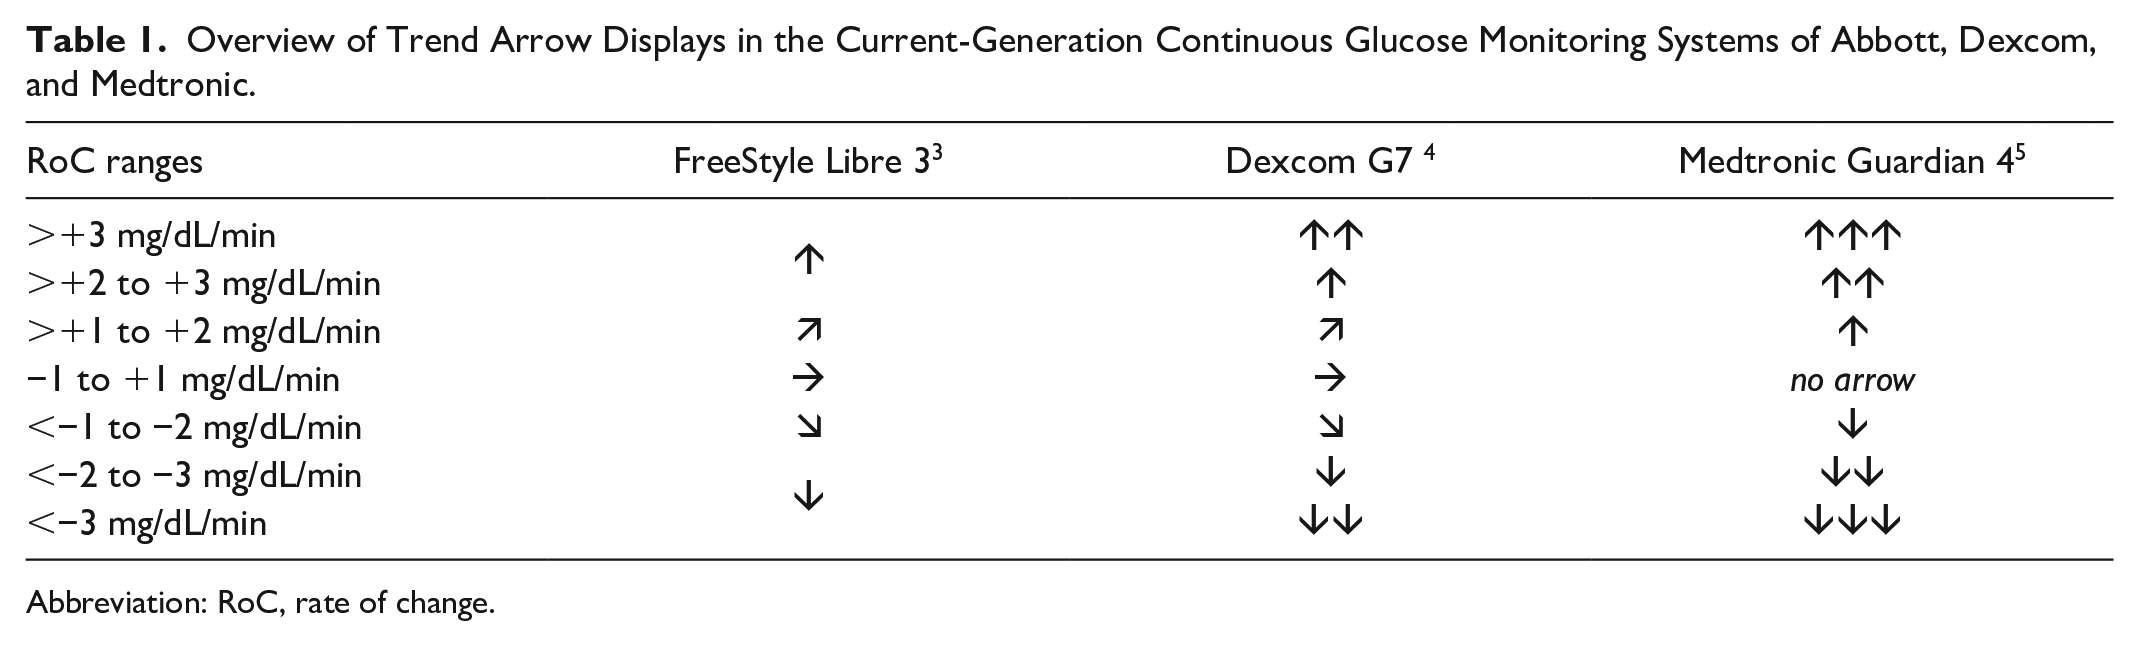
Abbreviation: RoC, rate of change.
While CGM performance studies universally report point accuracy results, a recent review found that only approximately 20% of CGM performance studies published between 2002 and 2022 contained a characterization of trend accuracy. 1 This is reflected by the fact that several articles discussing methodologies for point accuracy assessment have been published,1,6-9 while the topic of trend accuracy has received far less attention. 10 However, due to the fact that users of CGM systems routinely combine CGM readings with trend arrows for their glucose level management and there exist specific guidelines for including trend arrows when making treatment decisions,11,12 the assessment of trend information should receive more consideration. This particularly applies to adjunctive CGM systems, whose users might rely on the trend arrows more than on the actual CGM readings.
To facilitate the assessment of trend accuracy, this article reviews and discusses existing approaches and propose a simple method referred to as clinical trend concurrence analysis (CTCA) which is intended to characterize the trend arrows displayed by the CGM systems. We thereby hope to increase the awareness for the importance and challenges of CGM trend accuracy assessment in the context of clinical performance evaluations.
Background
Any assessment of trend accuracy is based on the comparison between a “true” RoC as determined by frequent comparator measurements and the trend information provided by the CGM systems. Here, it has been recommended that the comparator RoC should be calculated from subsequent comparator measurements obtained at least every 10 to 20 minutes2,13 and assigned to the time of the latter measurement. For a more detailed discussion on the existing approaches to obtain comparator measurements, we refer the reader to previously published articles.1,9,14
In principle, there are two fundamental approaches to the assessment of trend accuracy which will be discussed in the following sections: treating the CGM and comparator RoCs as continuous or as categorical variables.
RoC as Continuous Variable
Treating the RoCs as continuous variables allows the application of conventional analytical accuracy approaches, in particular the analysis of numerical deviations between comparator and CGM RoCs, analogous to the characterization of point accuracy. The previously mentioned literature review found the mean absolute difference between CGM and comparator RoCs to be the most common metric. 1 Here, results such as 0.66 ± 0.96 mg/dL/min or 0.86 ± 1.26 mg/dL/min have been reported for two different CGM systems tested in the same study. 15 While these results can identify differences between CGM systems, it is questionable whether these metrics offer a useful interpretation in practice, in particular when reported on their own.
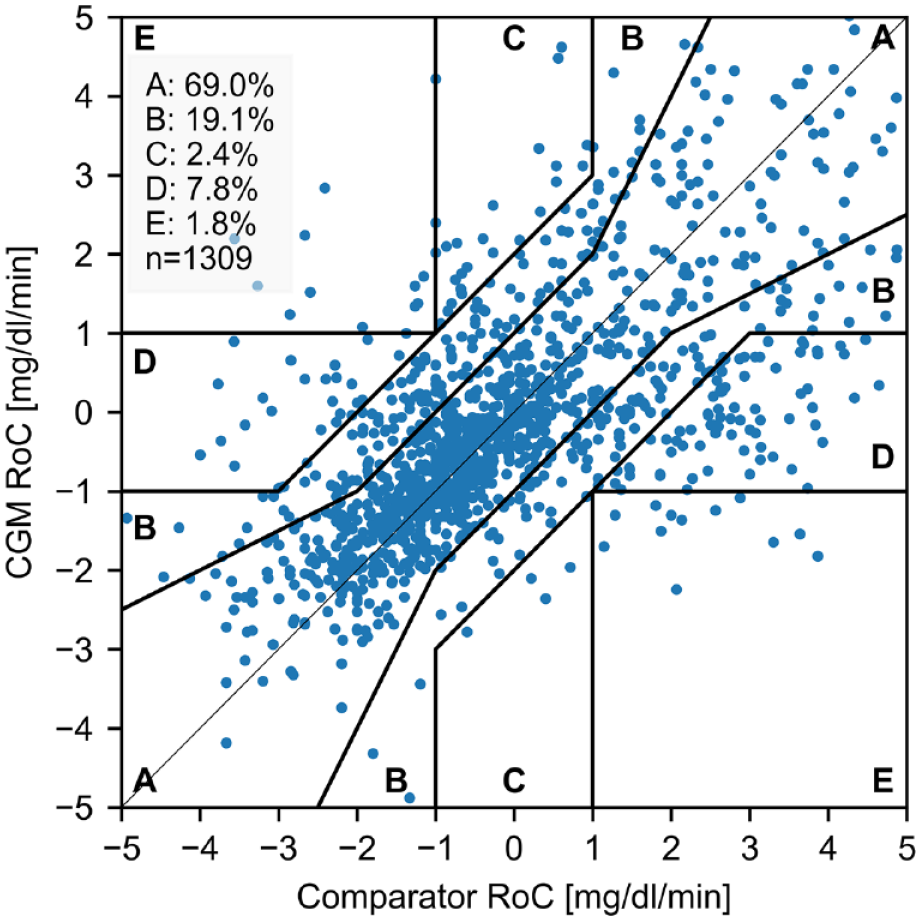
Another approach that treats the RoCs as continuous variables is the rate error grid analysis (R-EGA), which was found to be the most common approach to report trend accuracy in the previously mentioned review. 1 An example is shown in Figure 1. The R-EGA is part of the continuous glucose error grid analysis, 13 and follows the same idea as the point error grids such as the Clarke Error Grid 16 by assigning each comparator-CGM RoC pair to one of five risk zones (A-E), depending on their difference. Zones A and B of the R-EGA indicate very small or benign errors. Zone C indicates rapid CGM RoCs but slow comparator RoCs, which could lead to overcorrection in insulin dosing or food intake; zone D indicates rapid comparator RoCs that are not detected by the CGM system; and zone E indicates CGM RoCs that are opposite to the comparator RoC. As a result of the R-EGA, a scatter plot of comparator-CGM RoC pairs and the percentage of pairs in each of the zones can be reported. The R-EGA has the benefit of providing a clinical interpretation to possible RoC deviations. However, it also displays and evaluates the CGM and comparator RoCs with a high resolution and in much greater detail than it is presented to users of CGM systems who only see their glucose level RoCs in the form of discrete trend arrows (Table 1). For example, it can be argued that differentiating RoCs within the range from −1 to +1 mg/dL/min is not required as CGM systems typically only use a single trend display for RoCs in this range. It can therefore be questioned whether the level of detail provided by the R-EGA is truly required.
The last method to be mentioned in this context is the trend compass proposed in 2014. 18 It utilizes a fairly complex graphical display based on polar coordinates to show the deviation between comparator and CGM RoCs dependent on the BG levels. Its use has however been limited.
CGM RoC as Categorical Variable
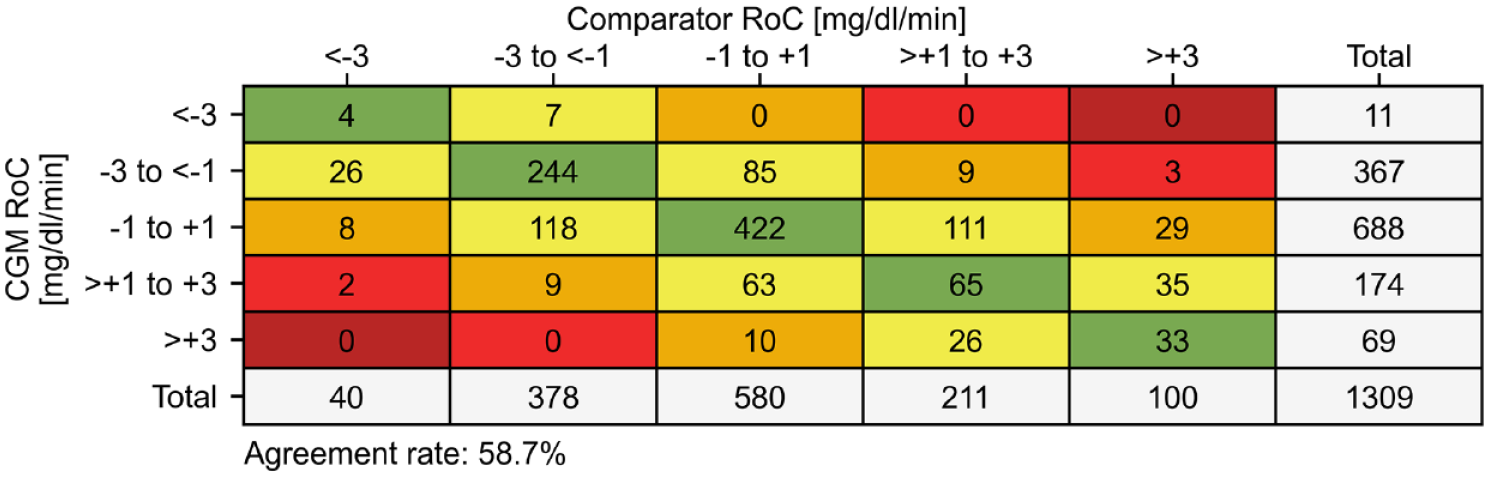
Based on the concept of categorizing the CGM RoC in the form of trend arrows, a very straightforward approach is to use a concurrence matrix to report the agreement between the categorized CGM and comparator RoCs. It was used in 18.5% of CGM performance studies published between 2002 and 2022 that assessed trend accuracy. 1 An example of a traditional concurrence matrix as recommended in the POCT05 guideline is shown in Figure 2. Its main benefit is that it allows the direct assessment of the trend arrows displayed by the CGM systems. Therefore, the CTCA presented in this article will be based on this approach. However, concurrence matrices, when displayed as exemplified in Figure 2, have several drawbacks that the CTCA will address. First, by only printing the number of pairs in each matrix cell it can be difficult to appreciate the relative frequency of entries and thus identify relevant inaccuracies. Second, the RoC categorization as proposed by the POCT05 guideline does not agree with the RoC categorizations used for the trend arrow display of current-generation CGM systems shown in Table 1. Third, the deviations between CGM and comparator RoCs are characterized only analytically without any interpretation of the potential clinical consequences.
CGM RoC vs Trend Arrow
Before the CTCA can be introduced, the differences between the displayed trend arrows and the calculated CGM RoC should be discussed. In general, it would be ideal to directly examine the trend arrows displayed by the CGM systems during clinical studies using the CTCA or a traditional concurrence matrix. However, in practice there is a problem that, at least for the CGM systems named in Table 1 and their predecessor devices, only the CGM readings and not the trend arrows can be accessed and exported retrospectively. This would create the need to document the displayed trend arrows manually during performance testing, which can be very cumbersome. To the authors’ knowledge, only one study has been published by Freckmann et al in which the trend arrows have been documented manually. 17
As an alternative, it is possible to use the automatically stored CGM readings to calculate the CGM RoCs retrospectively and convert them into trend arrows according to the labeling of the device. The downside of this approach is that the calculated trend arrows might not always agree with the actually displayed trend arrows. In fact, a reanalysis of the data from the previously mentioned study by Freckmann et al, 17 found that the displayed and calculated trend arrows only agree in 90.7% of cases (n = 6378) for the Dexcom G5 system which has a data recording interval of 5 minutes. To calculate the trend arrow, exactly four CGM readings recorded within 15 to 20 minutes before the time of trend arrow documentation were selected. Subsequently, the CGM RoC was determined as the slope of a least-squares linear regression analysis and categorized accordingly. This procedure to determine the CGM RoC is recommended in the POCT05 guideline, but other approaches are conceivable. Applying the same idea to the simultaneously tested, intermittently scanned FreeStyle Libre 1, which has a data recording interval of 15 minutes (and thus using exactly two CGM readings to calculate the RoC), leads to an even lower agreement between displayed and calculated trend arrows of 77.9% (n = 4421).
These results indicate the fundamental problem that, at least for Dexcom G5 and FreeStyle Libre 1 in the context of a specific study, the displayed trend arrows cannot be reliably reconstructed based on the stored CGM readings and the above-mentioned straightforward linear regression approach. To some extent, this is not surprising as the CGM manufacturers likely use the raw CGM sensor signal and complex methods to determine the displayed trend arrow. It would therefore be advantageous if manufacturers would also allow access to the displayed trend arrows for retrospective analysis.
Clinical Trend Concurrence Analysis
As mentioned before, the CTCA is an adaptation of the traditional concurrence analysis as recommended in the POCT05 guideline. 2 Its main goal is to directly assess the reliability of the glucose trends as shown by the CGM system to the user and provide a clinical interpretation of the deviations between trend arrows and comparator RoCs. In addition, the CTCA aims to present the results in an easily accessible graphical display and allow the assessment of CGM systems that use the same RoC categorization as FreeStyle Libre 3 with five arrows and Dexcom G7 and Medtronic Guardian 4 with seven trend arrow categories (Table 1). For that, the CTCA proposes to categorize the comparator RoC in seven different ranges, whereas the CGM RoC should be categorized according to the number of arrows and ranges implemented by the CGM systems. This leads to a mismatch in the number of comparator and CGM RoC categories for five-arrow CGM systems but was chosen as it preserves the larger resolution of comparator RoCs which is useful when determining the risk associated with different trend category deviations. In addition, it increases the comparability between seven- and five-arrow CGM systems.
To develop a clinical interpretation of trend arrow deviations, we employed the previously introduced R-EGA, 13 as well as the simplified trend arrow-based insulin dosing recommendations proposed by Klonoff and Kerr in 2017, 12 where it is recommended to increase/reduce the calculated insulin dose by 1 unit if the trend arrow indicates a rise/fall between 1 and 2 mg/dL/min, 1.5 units if the trend arrow indicates a rise/fall between 2 and 3 mg/dL/min, and 2 units if the trend arrow indicates a rise/fall >3 mg/dL/min. This insulin adjustment plan and the RoC categorization agrees with a CGM system displaying seven trend arrows such as the Dexcom G7 or Medtronic Guardian 4. For a five-arrow CGM system like the FreeStyle Libre 3 and its predecessors, Klonoff and Kerr make no specific recommendations. We therefore assumed that the same rules apply, that is, an increase/reduce in the calculated insulin dose by 1 unit if the trend arrow indicates a rise/fall between 1 and 2 mg/dL/min, and 1.5 units if the trend arrow indicates a rise/fall >2 mg/dL/min. Using these rules, it is possible to calculate an insulin dosing error for each combination of a “true” trend arrow (based on the comparator RoC) and a displayed trend arrow, where negative and positive values indicate under- and overdosing, respectively. Combining this information with the R-EGA yields the display in Figure 3 for seven- (panel a) and five-arrow (panel b) CGM systems. Here, it should be mentioned that this display is not part of the proposed CTCA and is only shown to facilitate the derivation and justification of the proposed risk zones described below.
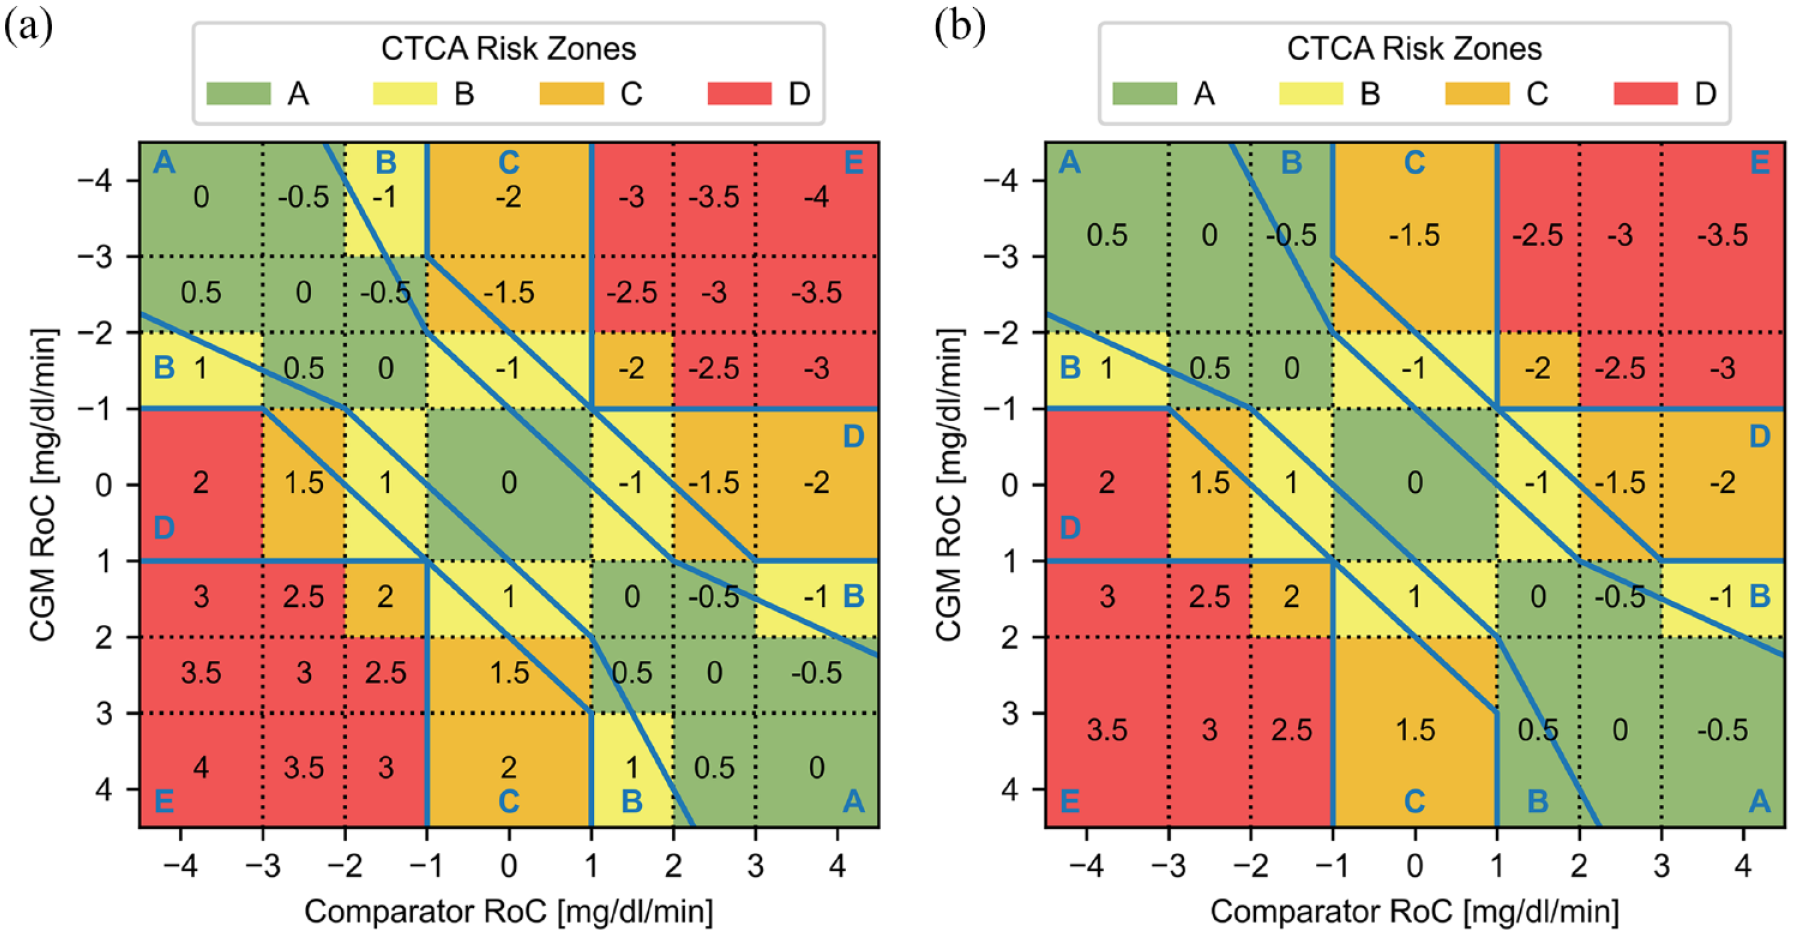
Combination of the rate error grid 13 (blue lines and letters) with the insulin dosing errors (black numbers) based on the recommendations by Klonoff and Kerr 12 for a CGM systems with seven (a) and five (b) trend arrow categories, where negative and positive numbers indicate under- and overdosing, respectively. The black dotted lines display the categorization of glucose rate of changes (RoCs), and the colored areas indicate zones A (green), B (yellow), C (orange), and D (red) of the proposed clinical trend concurrence analysis (CTCA). Note that the axis displaying the CGM RoC was reversed (negative on top) in comparison to the R-EGA display to align with the traditional concurrence matrix display, where it is common to align the main diagonal from the top left to the bottom right.
The proposed CTCA has four different risk zones (A-D, colored green, yellow, orange and red) which indicates the proposed risk classification for a potential adverse event caused by an erroneous treatment decision based on deviations between displayed trend arrow and actual glucose RoC. Here, it should be pointed out that this is one zone less than the R-EGA which has five risk zones (A-E). The green areas, encompassing zone A of the CTCA, largely overlap with zone A of the R-EGA and include insulin dosing errors of up to ±0.5 units. Zone A can therefore be associated with no or very low clinical risk. The yellow areas, or zone B of the CTCA, mainly overlap with zone B of the R-EGA and is associated with dosing errors of ±1 unit which conveys a low clinical risk. The orange areas encompass zone C of the CTCA and are associated with insulin dosing errors between ±1.5 and ±2 units, thus carrying a moderate clinical risk. Zone C of the CTCA combines zones C and D of the R-EGA and thus assumes that potential adverse events arising from treatment decisions based on the combination of a slow CGM trend and high true RoC (zone D of the R-EGA) as well as a fast CGM trend and slow true RoC (zone C of the R-EGA) carry an approximately equivalent clinical risk. The exception to that is the combination of rapidly declining true glucose levels (RoC <−3 mg/dL/min) and a flat CGM trend arrow, which carries a higher risk than other deviations in zone C of the CTCA as there is the potential for immediate, severe hypoglycemia due to a delayed intervention. It was therefore included in zone D of the CTCA, despite this combination only resulting in a dosing error of 2 units. The remaining red areas comprising zone D of the CTCA largely overlap with zone E of the R-EGA and include dosing errors of ±2.5 units or larger. In this zone, CGM trend arrows and true RoCs are of opposite direction, which is associated with a high clinical risk. Zone D of the CTCA also contains, but is not limited to, the trend concurrence criteria defined in the requirements for “integrated” CGM systems published by the U.S. Food and Drug Administration (CGM RoC >+1 mg/dL/min with comparator RoC <−2 mg/dL/min and CGM RoC <−1 mg/dL/min with comparator RoC >+2 mg/dL/min). 19
Based on this RoC categorization and risk classification, we can introduce the results display of the CTCA which is exemplified in Figure 4. Here we show three examples of CTCA results for the older-generation, seven-arrow Dexcom G5 (based on the previously mentioned study by Freckmann et al 17 and calculated CGM RoCs), the newer-generation, seven-arrow Dexcom G6 (study not published, CGM RoCs were calculated analogous to the Dexcom G5) and the current-generation, five-arrow FreeStyle Libre 3 (based on a study by Pleus et al, 14 CGM RoCs were calculated analogous to the Dexcom G5). For that, we used the calculated trend arrows based on the CGM RoC (as explained above) because the actually displayed trend arrows were retrospectively not available in all example data sets.
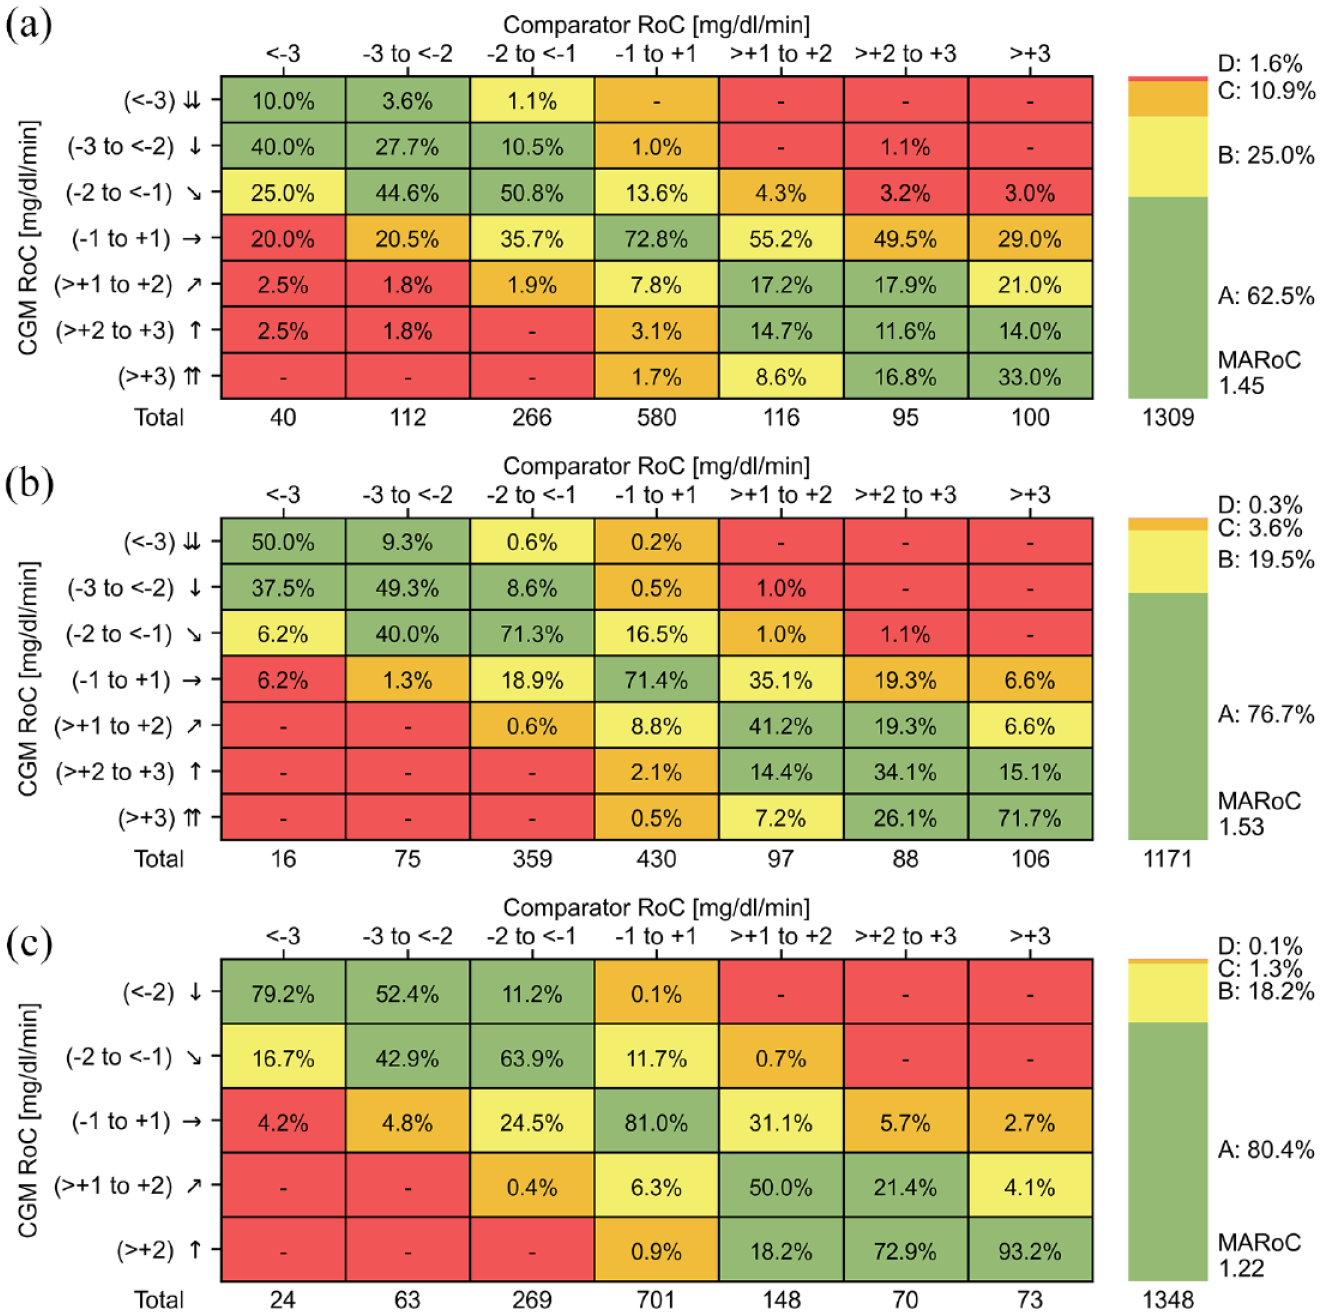
Proposed clinical trend concurrence analysis for the Dexcom G5 (a), Dexcom G6 (b), and FreeStyle Libre 3 (c) CGM systems. The numbers in the matrix cells show the percentage of comparator-CGM rate of change (RoC) pairs with respect to the total number of pairs in each column printed at the bottom. The coloring indicates no (green, zone A), low (yellow, zone B), moderate (orange, zone C), and high (red, zone D) clinical risk of an adverse event. The stacked bars on the right show the percentage of pairs in risk zones A to D with respect to the total number of pairs and the mean absolute comparator rate of change (MARoC) in mg/dL/min.
The design of the CTCA display was based on the concurrence matrices recommended in the POCT05 guideline. However, we added the stacked bar on the right, similar to the common “Time in Range” display, which shows the main results of CTCA by summarizing the percentage of pairs in risk zones A to D with respect to the total number of pairs. These results could also be reported in the text only. Here, the goal for any CGM system is to maximize the percentage in zones A and B indicating a high accuracy and low clinical risk, while minimizing the percentages in the other zones. Due to the fact that the results of the CTCA are highly dependent on the comparator RoCs, we also show the mean absolute comparator rate of change (MARoC), which is a metric that can indicate the extent of fast glucose changes, both positive and negative, that occurred during the study. 1 For a more detailed assessment of trend agreement, the actual concurrence matrix can be inspected. Here, the numbers in the cells show the percentage of comparator-CGM RoC pairs with respect to the total number of pairs in each column printed at the bottom.
The examples in Figure 4 show that the stacked bar display of the CTCA allows the immediate identification of the differences between the CGM systems, in particular the technological improvements from older- to newer-generation CGM systems. For example, the percentage of pairs in zone A has increased from 62.5% in Dexcom G5 to 76.7% in Dexcom G6, while the percentage in zone D has decreased from 1.6% to 0.3%, respectively. However, as with all CGM performance results, their comparability is limited unless the CGM systems were tested in the same study or under similar conditions.
Discussion and Conclusion
In this article, we reviewed existing approaches for the characterization of trend accuracy in the context of CGM performance studies and proposed the CTCA which is an adaption of the conventional trend concurrence analysis. The CTCA is intended to assess the accuracy of the trend information as displayed by CGM systems. For that, we have argued that it would be advantageous if the CGM systems could provide the displayed trend arrow for retrospective analysis, which is not the case for the current-generation CGM systems of Abbott, Dexcom and Medtronic. We therefore call on CGM manufacturers to make the displayed trend arrows available for this purpose.
The CTCA was developed for CGM systems displaying five and seven different trend arrow categories according to the limits used in the current-generation systems of Abbott, Dexcom, and Medtronic. However, adaptations for CGM systems with a different number of trend arrows or category limits are possible. In any case, an important prerequisite for the assessment of trend accuracy is the availability of a wide range of comparator RoCs, which can be assured by complying with the recently proposed data characteristics and testing procedures for CGM performance evaluations. 20
The main contribution of the CTCA is that it attributes a clinical risk to potential deviations between displayed and “true” glucose trends. Here, it should be emphasized that this is currently only a proposal based on the R-EGA and one specific set of insulin dosing rules and that no opinions among the diabetes technology community have been gathered. Furthermore, the CTCA does not incorporate any information about the glucose levels at which the RoCs occur, which could allow a more fine-grained assessment of the clinical risk associated with trend inaccuracies. However, such approaches typically require more complex, multidimensional analyses and displays such as the trend compass, which are difficult to be accepted by practitioners. We nevertheless intend for this article to stimulate a discussion on the importance and need to assess the trend information displayed by CGM systems, as the trend arrows will remain an important tool for people with diabetes in the management of their glucose levels, even in conjunction with systems for automated insulin delivery.
To facilitate the adoption and application of the CTCA a respective software implementation is freely available (https://github.com/IfDTUlm/CGM_Performance_Assessment).
Footnotes
Acknowledgements
The authors would like to thank Dr. Delia Waldenmaier, Dr. Stephanie Wehrstedt and Dr. Cornelia Haug for their valuable feedback.
Abbreviations
CGM, continuous glucose monitoring; CLSI, Clinical and Laboratory Standards Institute; CTCA, clinical trend concurrence analysis; R-EGA, rate error grid analysis; RoC, rate of change.
Declaration of Conflicting Interests
The author(s) declared the following potential conflicts of interest with respect to the research, authorship, and/or publication of this article: GF is general manager and medical director of the Institute for Diabetes Technology (Institut für Diabetes-Technologie Forschungs- und Entwicklungsgesellschaft mbH an der Universität Ulm, Ulm, Germany), which carries out clinical studies, for example, with medical devices for diabetes therapy on its own initiative and on behalf of various companies. GF has received research support, speakers’ honoraria or consulting fees in the last 3 years from Abbott, Ascensia, Berlin Chemie, Boydsense, Dexcom, Lilly, Metronom, Medtronic, Menarini, MySugr, Novo Nordisk, PharmaSens, Roche, Sanofi, and Terumo. ME and SP are employees of IfDT.
Funding
The author(s) received no financial support for the research, authorship, and/or publication of this article.