
Abstract
It is just over 10 years since the first published randomized controlled trial demonstrated a clinically meaningful reduction in HbA1C levels using real-time continuous glucose monitoring (RT-CGM) in individuals with type 1 diabetes. 1 Since then use of RT-CGM has continued to gain popularity based on solid evidence of meaningful benefit for both adults and children who regularly use the technology. 2 However, there remains a paucity of practical guidance to help both people with diabetes and nonexpert clinicians respond to the real-time trend data for future “anticipated” glucose levels.
Introduction to Rate of Change Trend Arrows
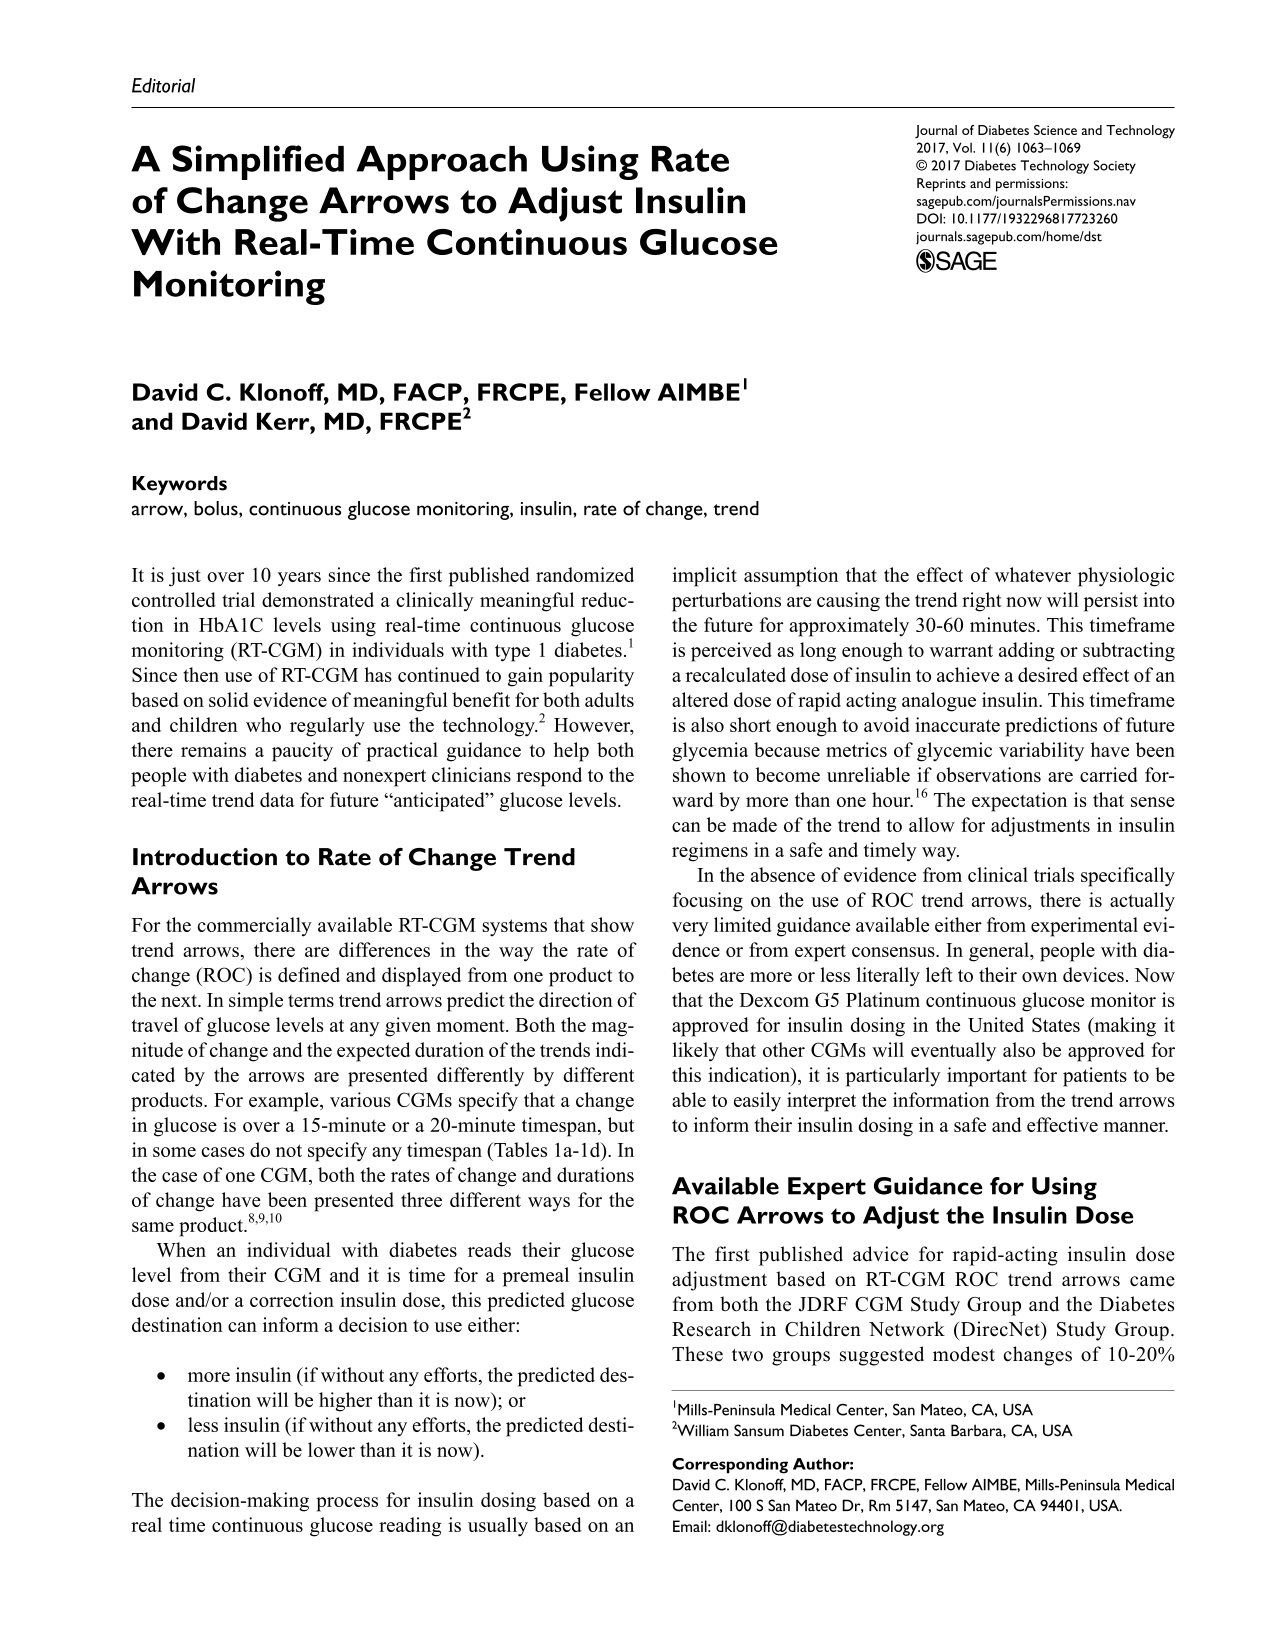
For the commercially available RT-CGM systems that show trend arrows, there are differences in the way the rate of change (ROC) is defined and displayed from one product to the next. In simple terms trend arrows predict the direction of travel of glucose levels at any given moment. Both the magnitude of change and the expected duration of the trends indicated by the arrows are presented differently by different products. For example, various CGMs specify that a change in glucose is over a 15-minute or a 20-minute timespan, but in some cases do not specify any timespan (Tables 1a-1d). In the case of one CGM, both the rates of change and durations of change have been presented three different ways for the same product.8,9,10
Examples of manufacturer’s (Abbott) descriptions of rate of change arrows for their real-time continuous glucose monitoring devices according to each product’s user’s manual.
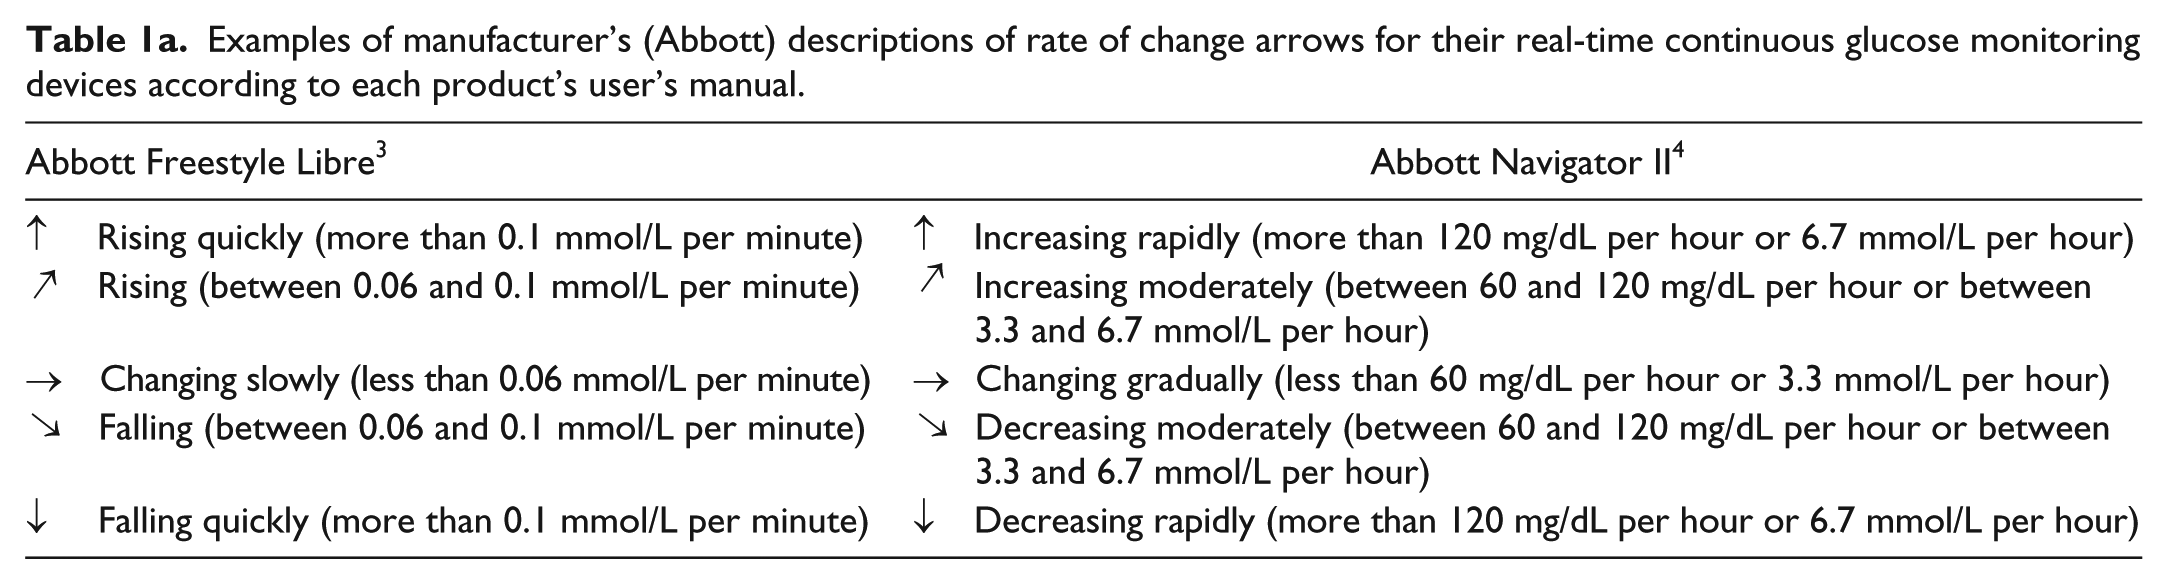
Examples of manufacturer’s (Dexcom) descriptions of rate of change arrows for their real-time continuous glucose monitoring devices according to each product’s user’s guide.
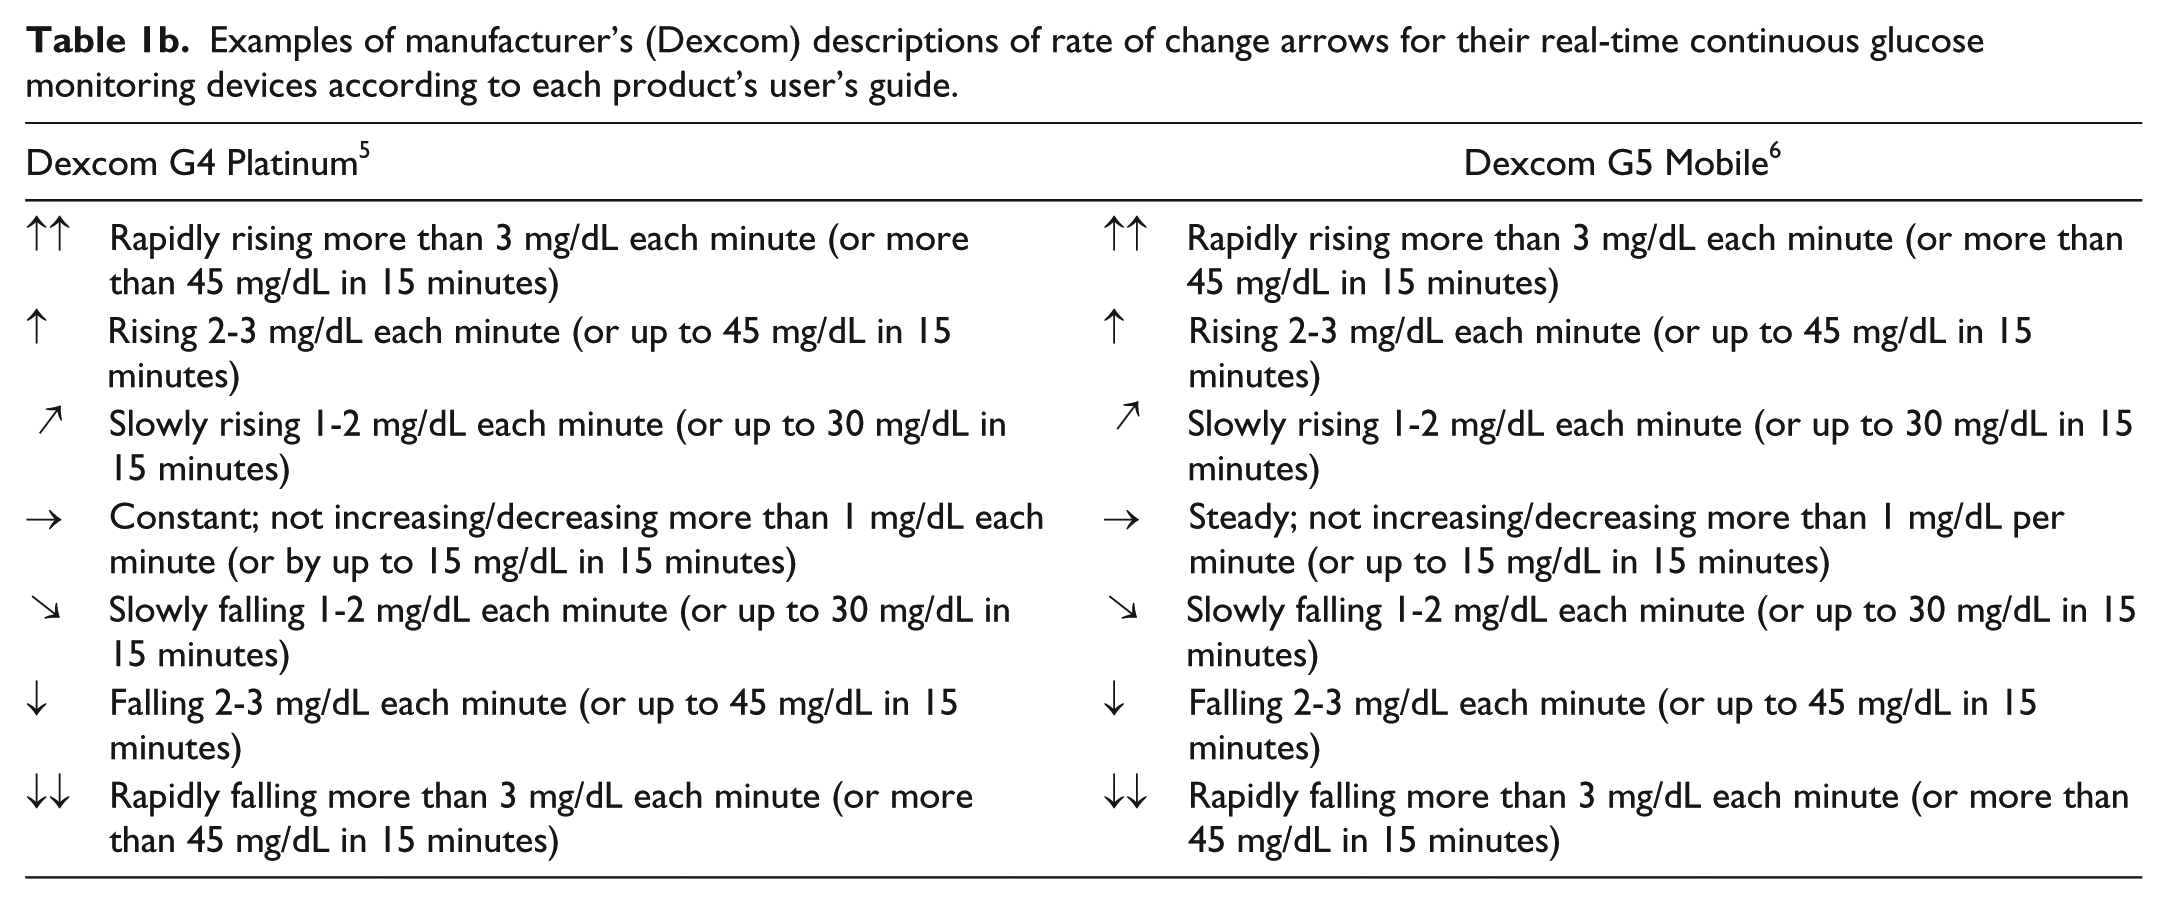
Examples of manufacturer’s (Medtronic) descriptions of rate of change arrows for their real-time continuous glucose monitoring devices, according to each product’s user’s guide.
Examples of manufacturer’s (Senseonics) descriptions of rate of change arrows for their real-time continuous glucose monitoring device, according to the product’s user’s guide.
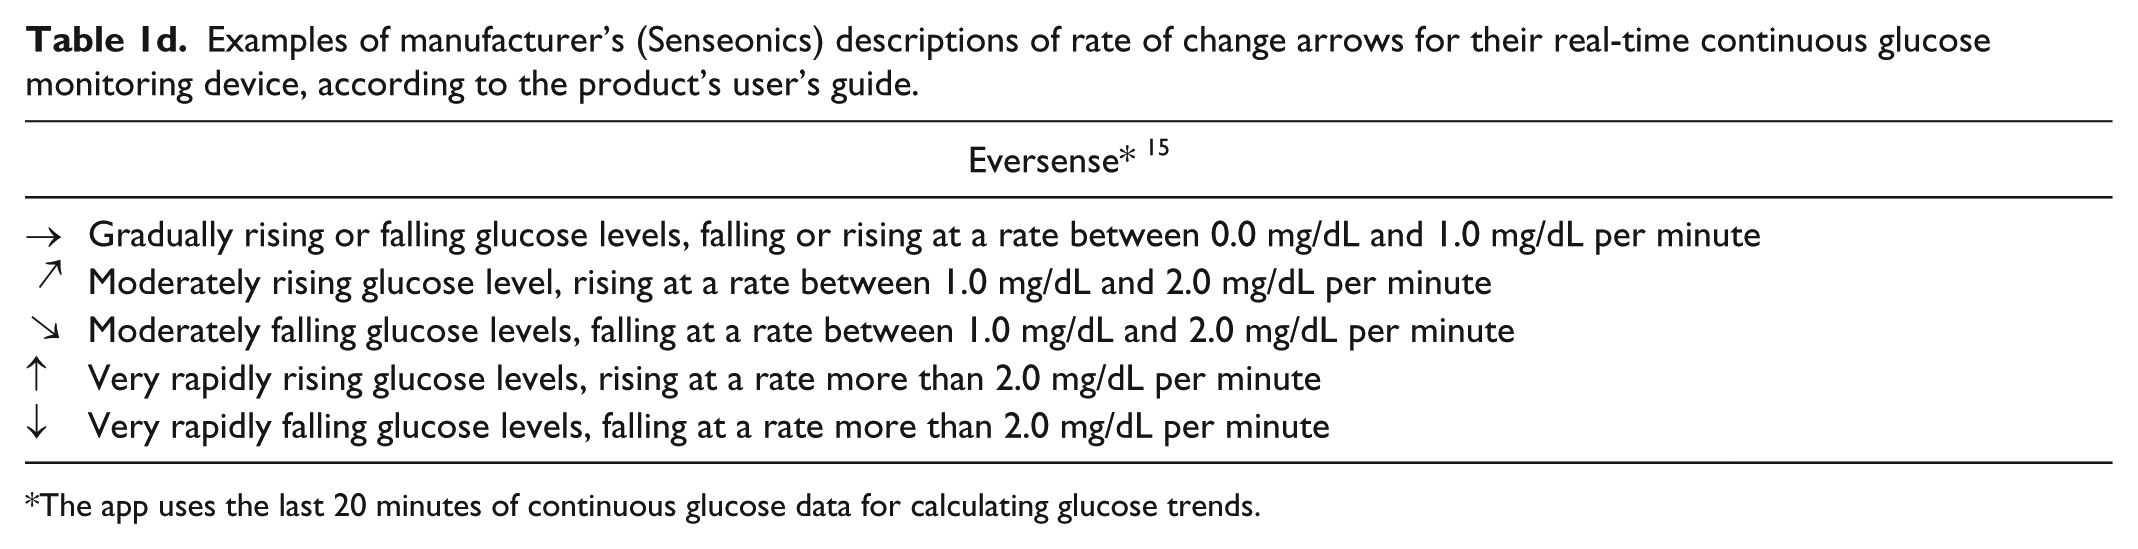
The app uses the last 20 minutes of continuous glucose data for calculating glucose trends.
When an individual with diabetes reads their glucose level from their CGM and it is time for a premeal insulin dose and/or a correction insulin dose, this predicted glucose destination can inform a decision to use either:
more insulin (if without any efforts, the predicted destination will be higher than it is now); or
less insulin (if without any efforts, the predicted destination will be lower than it is now).
The decision-making process for insulin dosing based on a real time continuous glucose reading is usually based on an implicit assumption that the effect of whatever physiologic perturbations are causing the trend right now will persist into the future for approximately 30-60 minutes. This timeframe is perceived as long enough to warrant adding or subtracting a recalculated dose of insulin to achieve a desired effect of an altered dose of rapid acting analogue insulin. This timeframe is also short enough to avoid inaccurate predictions of future glycemia because metrics of glycemic variability have been shown to become unreliable if observations are carried forward by more than one hour. 16 The expectation is that sense can be made of the trend to allow for adjustments in insulin regimens in a safe and timely way.
In the absence of evidence from clinical trials specifically focusing on the use of ROC trend arrows, there is actually very limited guidance available either from experimental evidence or from expert consensus. In general, people with diabetes are more or less literally left to their own devices. Now that the Dexcom G5 Platinum continuous glucose monitor is approved for insulin dosing in the United States (making it likely that other CGMs will eventually also be approved for this indication), it is particularly important for patients to be able to easily interpret the information from the trend arrows to inform their insulin dosing in a safe and effective manner.
Available Expert Guidance for Using ROC Arrows to Adjust the Insulin Dose
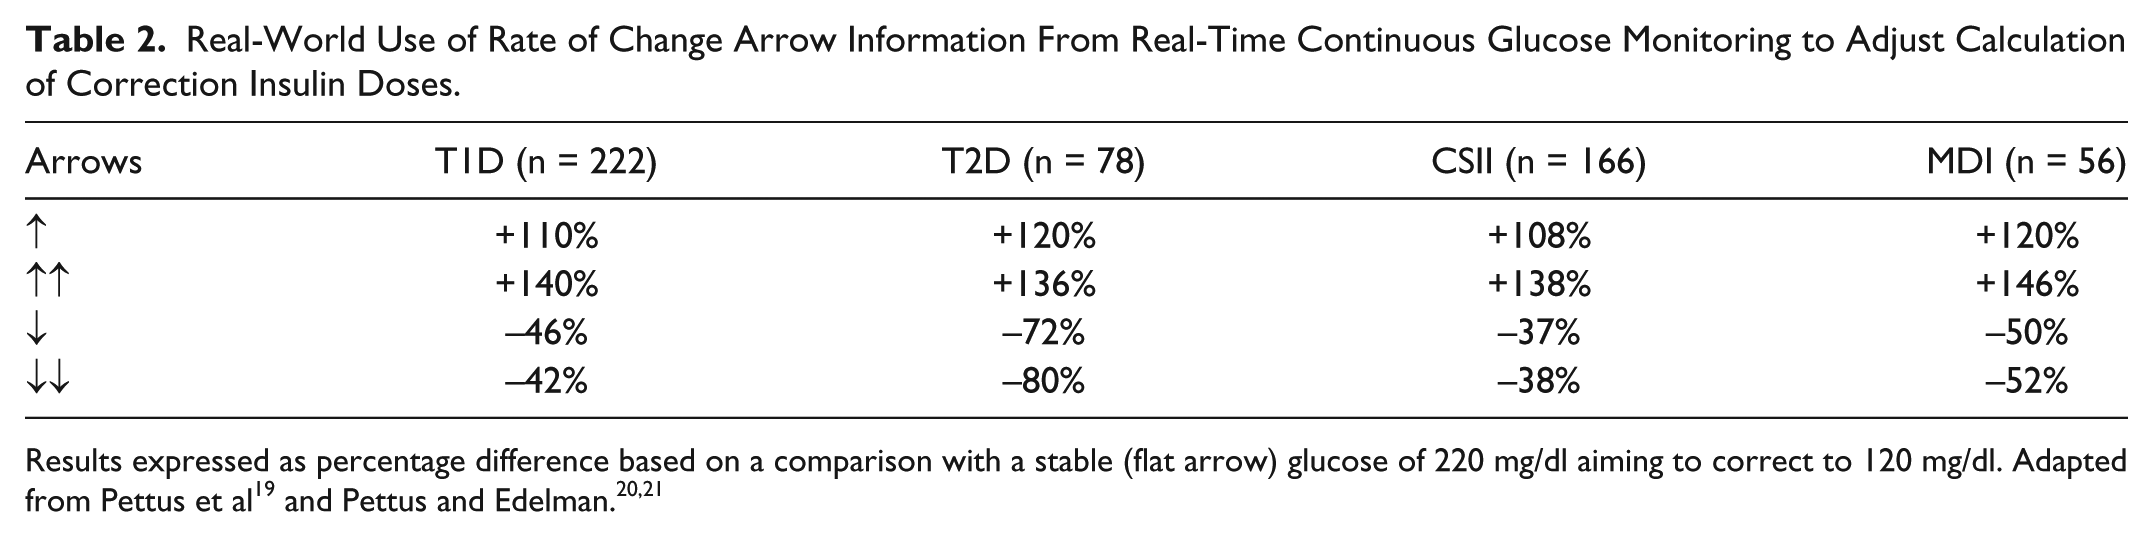
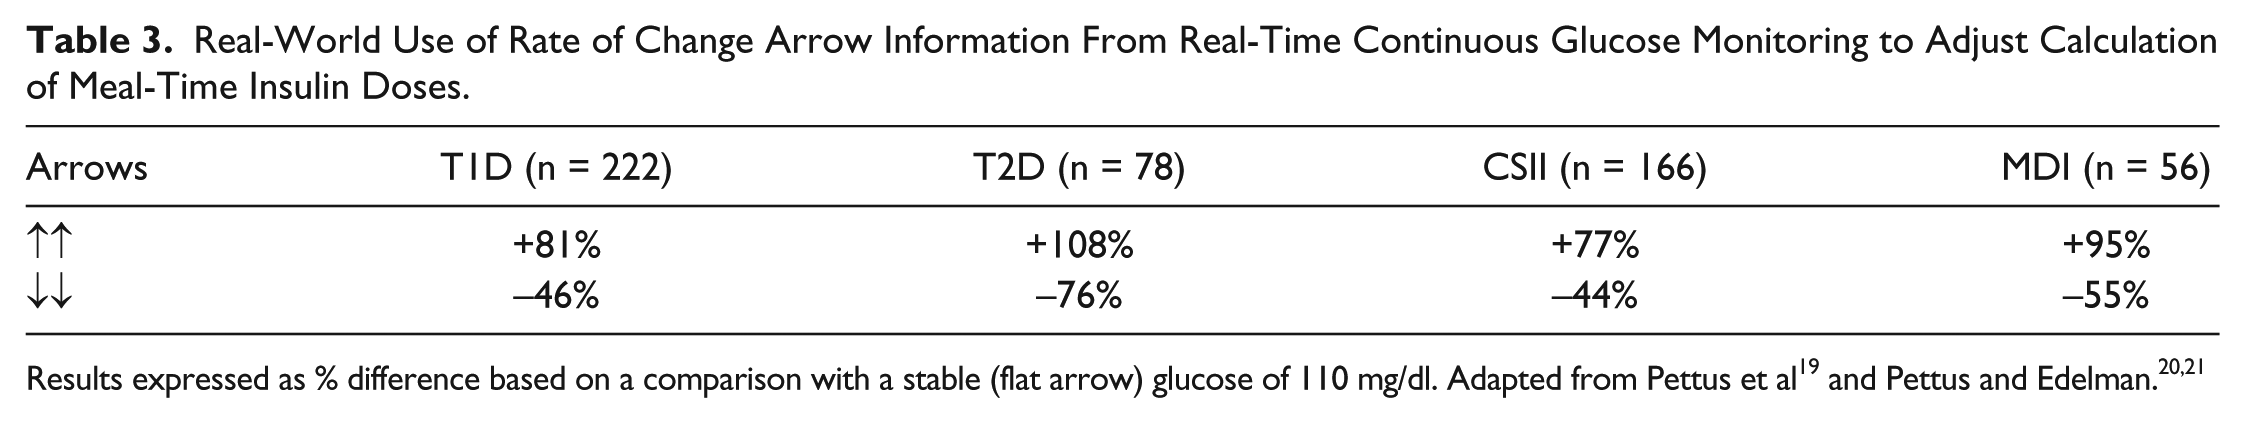
The first published advice for rapid-acting insulin dose adjustment based on RT-CGM ROC trend arrows came from both the JDRF CGM Study Group and the Diabetes Research in Children Network (DirecNet) Study Group. These two groups suggested modest changes of 10-20% up or down according to the arrow direction.17,18 However, a recent survey of 300 individuals with type 1 and type 2 diabetes using RT-CGM found that those initial recommendations of 10-20% adjustments in doses are viewed as too conservative (Table 2 and Table 3).19-21 From that survey it is clear that for extreme trends people with diabetes are inclined to take more drastic action than were initially recommended, and that individuals using multiple daily injections of insulin make even larger changes (correction and mealtime) compared to pump users. An adjustment in the timing of mealtime insulin relative to the meal based on the ROC was reported by most (58%) of the type 1 respondents including MDI-treated (61%) and CSII-treated (58%) and most of the type 2 respondents (67%). Respondents also reported delaying their meals following mealtime insulin administration when arrows indicated increasing glucose levels. Based on these survey findings, it is clear that users of RT-CGM place a significant amount of importance on trend arrows, perhaps more than has been appreciated until now.
Real-World Use of Rate of Change Arrow Information From Real-Time Continuous Glucose Monitoring to Adjust Calculation of Correction Insulin Doses.
Real-World Use of Rate of Change Arrow Information From Real-Time Continuous Glucose Monitoring to Adjust Calculation of Meal-Time Insulin Doses.
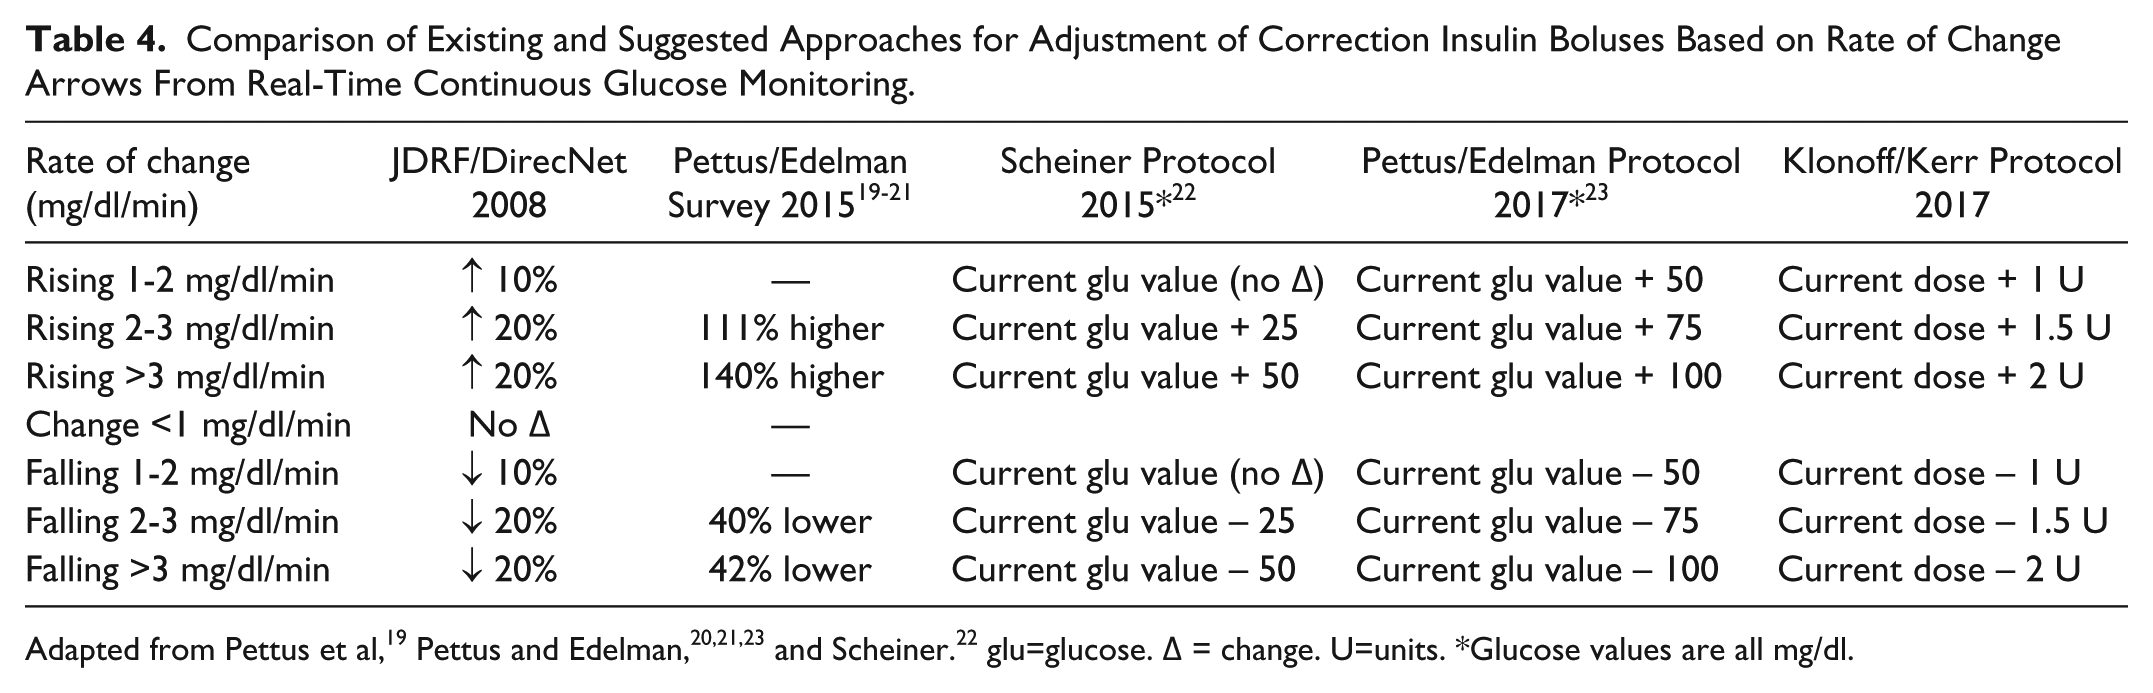
Recently, adjustments in insulin bolus correction and mealtime dosing based on the magnitude and direction of the RT-CGM trend arrows have been proposed by Scheiner 22 and by Pettus and Edelman. 23 With these recommendations the logic behind the dose adjustments is to use “anticipation information” about future glucose levels (in addition to prevailing and personal target glucose levels, insulin to carbohydrate ratios, and correction factors based on insulin sensitivity). Overall, this approach will result in additions or subtractions of 25-100 mg/dl for adjusted glucose levels. For example, the approach suggested by Scheiner will increase the current glucose value for rising glucose levels of 1-2 mg/dl/min, 2-3 mg/dl/min and >3 mg/dl/min by 0 mg/dl, 25 mg/dl, and 50 mg/dl, respectively. The approach by Pettus and Edelman raises the current glucose value by 50 mg/dl more than every increase specified by Scheiner (Table 4). For falling glucose values of 1-2 mg/dl/min, 2-3 mg/dl/min, and >3 mg/dl/min both these approaches suggest an identical decrease in the insulin dose as for rising glucose levels.22,23 For all these arrow-mediated dose adjustments, an increased insulin dose is assigned for a predicted rise of glucose over the next 30-60 minutes even though rapid acting insulin will not have its peak effect until at least 60 minutes later, because it is assumed that the current trend of a rising glucose concentration will result in a higher glucose level by the time peak insulin action occurs than could be predicted by only accounting for normal sensitivity to insulin, diet, and exercise.
Comparison of Existing and Suggested Approaches for Adjustment of Correction Insulin Boluses Based on Rate of Change Arrows From Real-Time Continuous Glucose Monitoring.
At mealtimes, Pettus and Edelman 23 also recommended that if the glucose is rising by at least 2 mg/dl/minute, then the person with diabetes should administer their mealtime insulin dose, but wait to eat until the ROC arrows start to level off, which would indicate a falling rate of change of glucose. This time point corresponds to a negative second derivative of the slope of the glucose concentration curve plotted against time. They referred to this strategy as “waiting for the bend” on the CGM display, which indicates that a bolus of insulin is acting. Likewise, at mealtime when the glucose level is falling by at least 2 mg/dl/min they recommended that the individual should: (1) eat; (2) wait for the glucose to stabilize; and then (3) administer insulin only if the glucose level begins to rise or if it stabilizes (evidenced by a horizontal ROC arrow) at a higher than desired level. For falling glucose levels, Scheiner also recommended adjusting the amount of carbohydrate intake. For a fall in glucose levels of 1-3 mg/dl/minute, he recommended increasing the usual amount of carbohydrates by 25% and for a fall of >3 mg/dl/minute increasing the usual amount by 50-100%. Scheiner also suggested that adjusting an insulin bolus by a fixed number of units is more practical than by making a percentage adjustment, unless the insulin sensitivity is known to be different than usual. 22
Drawbacks to Current ROC Dose Adjustment Protocols
One challenge however related to widespread adoption of this particular type of anticipated glucose dosage adjustment is the additional burden of time needed to spend on calculations for an insulin treated individual. Time burden is regularly reported as a barrier to achieving optimal glucose control by individuals with type 1 diabetes and a reduction in this specific burden is one of the anticipated purported benefits of closed-loop artificial pancreas systems. 24 For type 2 diabetes, physicians have previously reported concerns about individuals being able to make self-adjustments to optimize insulin therapy. 25 Furthermore, the arithmetic required may be problematic for the many with numeracy and literacy challenges. It is already established that there is an inverse relationship between numeracy and achieved HbA1c levels for type 1 adults. 26 Although the recent dose-adjustment suggestions outlined above are clearly valuable (although not supported by much empiric or modeling data), there is also a need to consider providing a simpler approach which may be of interest to the wider insulin-treated community, where time burden and literacy/numeracy barriers may be especially relevant.
A Simplified Proposal for the Use of ROC Arrows to Adjust Insulin Dose and Timing
For using rate of change trend arrows provided by RT CGM devices, we would like to propose a simpler method for utilizing the “anticipation” information over the next 30-60 minutes. Our recommendation is intended for three types of trends that indicate rising or falling glucose levels. The arrows can indicate a range of change of either 1-2 mg/dl/min, 2-3 mg/dl/min, or >3 mg/dl/min.
We propose first simplifying the estimated rate of change by assuming that the above three rates of change actually correspond, respectively, to the midpoint within their range of change, that is, an average rise or fall of 1.5 mg/dl/minute, 2.5 mg/dl/minute, or at least 3 mg/dl/minute. We also propose assuming that for each of these three ranges the glucose level will be changing over a 45-minute period (the midpoint between the 30- and 60-minute window usually attributed to a ROC arrow). Therefore, combining these two assumptions and for the three ranges of ROC specified by the arrows, glucose levels will rise or fall, respectively, by 67 mg/dl, 112 mg/dl, or at least 135 m/dl over the subsequent 45 minutes. With this method, a greater or lesser supplemental dose of short-acting insulin can be assigned to each of these three ranges of change, intended to correct the glucose level back to baseline.
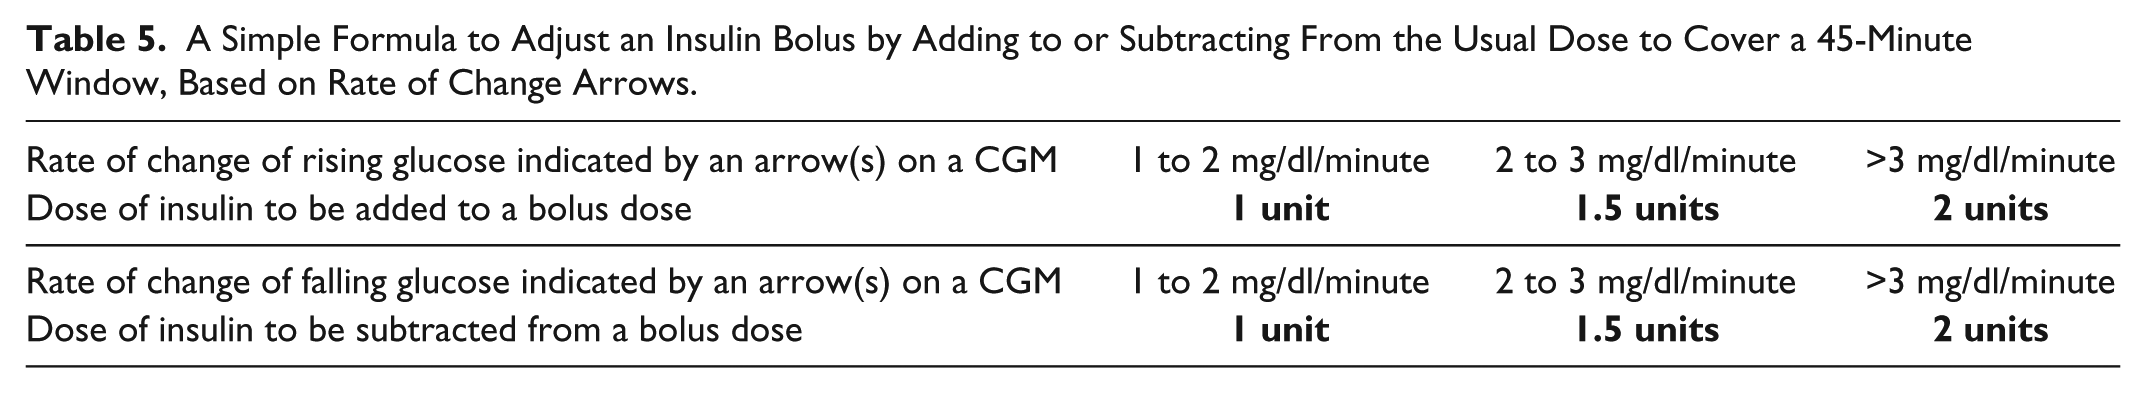
Finally, we suggest that a simple formula for adding to or subtracting from an insulin bolus for an average rise or fall, respectively, of 1.5 mg/dl/minute, 2.5 mg/dl/minute, or at least 3 mg/dl/minute over a 45-minute window is a bolus adjustment of 1 unit, 1.5 units, or 2 units (Table 5). These supplemental adjustments should return a rising or falling glucose level to target if the additional short-acting dose for these three anticipated glucose perturbations (announced by ROC arrows) corresponds to a maximum insulin sensitivity (correction factor) of 67 mg/dl per unit, 75 mg/dl per unit, or <67 mg/dl per unit.
A Simple Formula to Adjust an Insulin Bolus by Adding to or Subtracting From the Usual Dose to Cover a 45-Minute Window, Based on Rate of Change Arrows.
This formula tends to avoid overcorrection for most adults. Walsh and colleagues found that for a population the mean and mode correction factor for insulin pump settings is 40 mg/dl per 1 unit of insulin. 27 Using our proposed formula, if a patient’s insulin sensitivity is less than 67, 75, or <67 mg/dl per 1 unit, then the dose correction will be relatively safe (in terms of avoiding hypoglycemia from overcorrection).
We have calculated the minimum total daily insulin dose for which our formula is expected to avoid overcorrection by applying the Rule of 1500 28 and the Rule of 1960. 27 These two rules have been proposed as formulae to link total daily insulin doses to insulin sensitivity. These rules call for dividing 1500 or 1960 by the total daily dose of insulin to calculate the insulin sensitivity or the correction factor. Although other numbers besides these 1500 and 1960 have also been proposed, 1500 is at the low end and 1960 is at the high end of the range of commonly recommended dividend figures. 29 A corollary of these two formulae is that if one divides 1500 or 1960 by the insulin sensitivity, then the result is the total daily dose of insulin that is needed for that level of sensitivity.
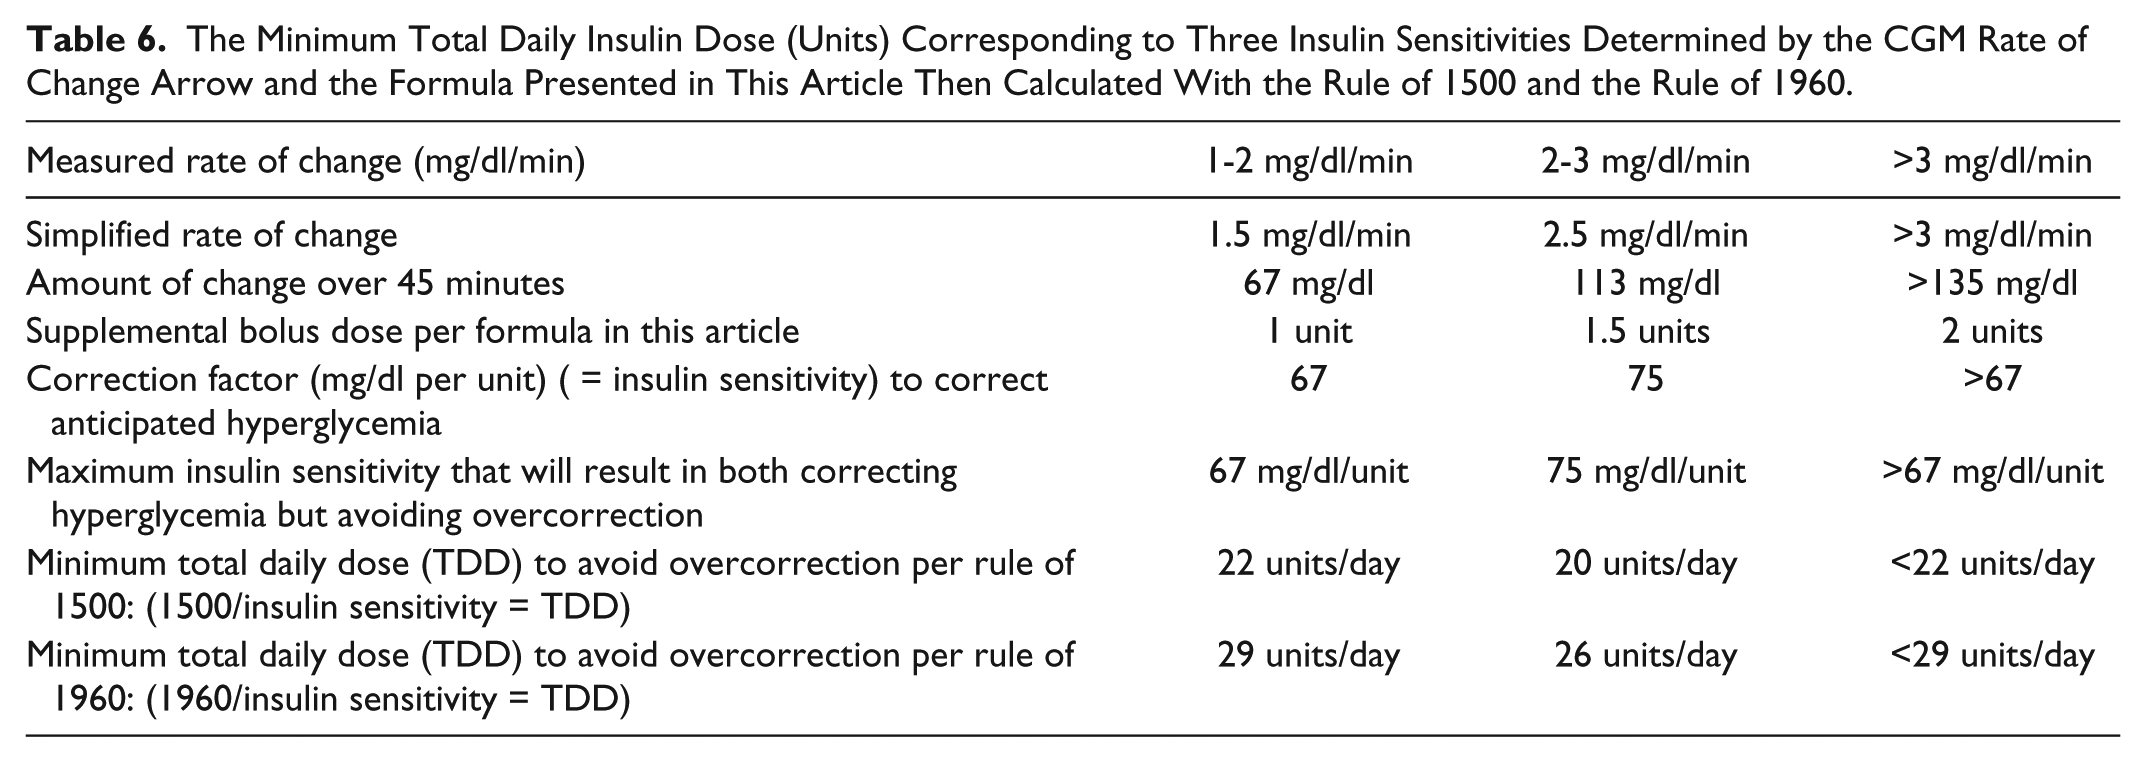
Table 6 illustrates how to calculate the minimum total daily insulin dose for which our formula is expected to avoid overcorrection. By beginning with the measured ranges of rate of change of glucose, this can be used to generate an estimated or simplified rate of change of glucose. At this simplified rate of change, the change in glucose concentration after 45 minutes can be estimated. When a formula-specified supplemental bolus dose of short-acting insulin (1, 1.5, or 2 units) is administered, then a correction factor (expressed as mg/dl decrease per unit of insulin) can be calculated to correct anticipated hyperglycemia, and this correction factor is the same as the insulin sensitivity. This correction factor also represents the maximum insulin dose that will result in correcting hyperglycemia but avoiding overcorrection. Those with greater insulin sensitivity will be at risk of overcorrection from a formula-specified supplemental dose, and for lesser sensitivity there will be undercorrection. For a given level of insulin sensitivity, applying the Rules of 1500 or 1960, a minimum total daily dose of insulin can be calculated for which overcorrection can be avoided. With all three arrow-specified CGM rates and with both assumed relationships between total daily dosed and insulin sensitivity (1500 and 1960), using our formula a minimum total daily insulin dose of 20-29 units of insulin should not be associated with increasing the risk of hypoglycemia. However, for a child or for an adult who is either unusually sensitive to insulin or using less than 29 units total of insulin per day, then these proposed dose corrections could be potentially too great and this formula (Table 5) should not be used.
The Minimum Total Daily Insulin Dose (Units) Corresponding to Three Insulin Sensitivities Determined by the CGM Rate of Change Arrow and the Formula Presented in This Article Then Calculated With the Rule of 1500 and the Rule of 1960.
Conclusion
In summary, ROC arrows can assist individuals using real time CGM to fine tune their glycemic control. Our proposed method based on the simple method of adding or subtracting small doses of insulin combined with adjustments in meal timing and in correction carbohydrates could be helpful as the use of RT-CGM expands in both type 1 and type 2 diabetes. We believe this approach is simpler for those who lack good numeracy skills or perceive a time burden in calculating changes to their insulin regimen due to altered insulin sensitivity. We call on the medical community to perform empiric assessments and engineering community to develop models to test various dosing adjustments that can be made based on rate of change arrows from real time continuous glucose monitors.
Footnotes
Acknowledgements
Allen King, MD and Darrell Willson, MD provided helpful advice. Annamarie Sucher provided expert editorial assistance.
Abbreviations
CGM, continuous glucose monitoring; glu, glucose; min, minute; ROC, rate of change; RT, real time; U, units.
Declaration of Conflicting Interests
The author(s) declared the following potential conflicts of interest with respect to the research, authorship, and/or publication of this article: DCK is a consultant to Ascensia, Lifecare, Novo, Onduo, Trividia, Voluntis. DK is a medical advisor to Glooko and Vicentra. He has received research funding from Dexcom and Abbott Diabetes Care.
Funding
The author(s) received no financial support for the research, authorship, and/or publication of this article.