
Abstract
Background:
The objective of this research is to show the effectiveness of individualized hypoglycemia predictive alerts (IHPAs) based on patient-tailored glucose-insulin models (PTMs) for different subjects. Interpatient variability calls for PTMs that have been identified from data collected in free-living conditions during a one-month trial.
Methods:
A new impulse-response (IR) identification technique has been applied to free-living data in order to identify PTMs that are able to predict the future glucose trends and prevent hypoglycemia events. Impulse response has been applied to seven patients with type 1 diabetes (T1D) of the University of Amsterdam Medical Centre. Individualized hypoglycemia predictive alert has been designed for each patient thanks to the good prediction capabilities of PTMs.
Results:
The PTMs performance is evaluated in terms of index of fitting (FIT), coefficient of determination, and Pearson’s correlation coefficient with a population FIT of 63.74%. The IHPAs are evaluated on seven patients with T1D with the aim of predicting in advance (between 45 and 10 minutes) the unavoidable hypoglycemia events; these systems show better performance in terms of sensitivity, precision, and accuracy with respect to previously published results.
Conclusion:
The proposed work shows the successful results obtained applying the IR to an entire set of patients, participants of a one-month trial. Individualized hypoglycemia predictive alerts are evaluated in terms of hypoglycemia prevention: the use of a PTM allows to detect 84.67% of the hypoglycemia events occurred during a one-month trial on average with less than 0.4% of false alarms. The promising prediction capabilities of PTMs can be a key ingredient for new generations of individualized model predictive control for artificial pancreas.
Introduction
Patients with type 1 diabetes (T1D) have to face the problem of the optimal management of diabetes every day. In particular, hypoglycemia avoidance is one of the main barriers to the glucose control, so in the last years several alarm systems were designed to detect hypoglycemia risks and, eventually, prevent them.1-5
The so-called artificial pancreas (AP)6-8 accelerated the development of these alarm systems since the long trials in free-living conditions9-13 needed for AP testing, and requires safety or alarm systems to prevent hypoglycemia events or at least to detect them in advance.
The alarm systems can be divided in two categories on the basis of the method used for the alarm generation: low-threshold detection and prediction. The first notifies the crossing of a critical blood glucose (BG) level, 14 while the second tries to foresee the hypoglycemia risk to allow the user to act in advance in order to avoid this event.15-18 The latter typically requires the use of patient models to perform glucose trend predictions.
Different glucose-insulin models can be used in the alarm systems: for example, minimal, maximal, or black-box linear models. The first class is accepted both as clinical tool and as an approach to understand the composite effects of insulin on glucose tolerance19,20; the second is able to better represent the significant interpatient variability that characterizes T1D population, eg, the one included in the UVA/Padova simulator21,22 equipped with 100 vectors of model parameters, called “virtual patients.” The third class includes models typically identified from real-life data.
Recently, new identification techniques have been investigated23-33; for a comprehensive literature review, we refer the reader to Zarkogianni et al 34 and Oviedo et al 35 Promising results have been obtained on this topic by our group.36-41 The main goal of this paper is to use the algorithm described in Wang et al 32 and Soru et al 36 to identify individualized models from free-living data for seven patients studied at the University of Amsterdam Medical Centre (AMC) and to validate individualized hypoglycemia predictive alerts (IHPAs) on a rather long period (one month) 9 for all these patients.
It is worth noting that the identification of reliable models on real data is particularly difficult. In fact, free-living conditions are much more challenging than the highly controlled experimental conditions of in-hospital studies, due to many confounding factors affecting BG in real life. Each patient can experience different problems during the trial and all possible factors of uncertainty have to be taken into account. Some examples are the physical exercise or differences in daily activities, human errors in patient-provided information or technical issues affecting the AP prototype adopted during the trial. All these aspects require adaptations of the identification techniques, originally developed for in silico data to deal with them.
The identification technique adopted in this paper is the impulse-response (IR) identification technique introduced in Soru et al 36 and extended in Toffanin et al 40 to cope with free-living data. Given the promising results obtained on a single patient, 40 the technique has been applied here to seven patients with T1D studied at AMC to show its effectiveness in front of interpatient variability.
The performance achieved on real-life data by patient-tailored glucose-insulin models (PTMs) are reported for each single patient and as mean of the entire cohort. The quality of an IHPA to detect in advance hypoglycemia phenomena based on PTMs is evaluated in terms of sensitivity, accuracy, and false positive rate. The new alarm system shows better results in hypoglycemia detection in terms of both true and false positive with respect to the previously published results.
Given the prediction capabilities of PTMs used in the IHPAs, they have the potential to be used to synthesize a new generation of individualized model predictive control (MPC) for AP.
Methods
In this section, the IR approach 40 is summarized together with the technique used to develop the IHPAs based on PTMs.
Impulse Response Identification
Fluctuations in glucose concentration can mainly be attributed to insulin infusions,

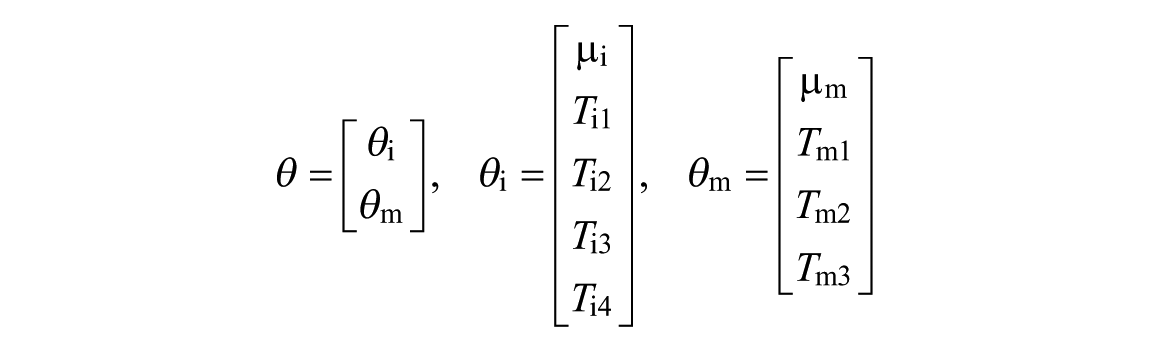
where
In order to overcome this limitation, the identification procedure is divided into two steps. In the first step, the average in silico patient (Av) of the UVA/Padova simulator
22
is used to identify the transfer functions parameters by performing experiments with a sufficient excitation to the overall system, and therefore, dangerous for a human subject. The first step provides the transfer functions
Step 1: linear average model
The goal of step 1 is the identification of the parameters of the transfer functions


where the orders of
The value of
The optimization problem is based on the minimization of the sum of squared residuals (SSR) formulated as follows:

where
A stability constraint is introduced in the optimization problem to guarantee non-negative values of the time constants. The SSR function is nonlinear in the parameters, so a nonlinear least-squared method is applied. A critical point is the algorithm initialization since the initial conditions can highly affect the final result. In this paper, a reasonable initialization is required for the gains and the slow time constants of the transfer functions, the other unknown parameters are initialized to 1.
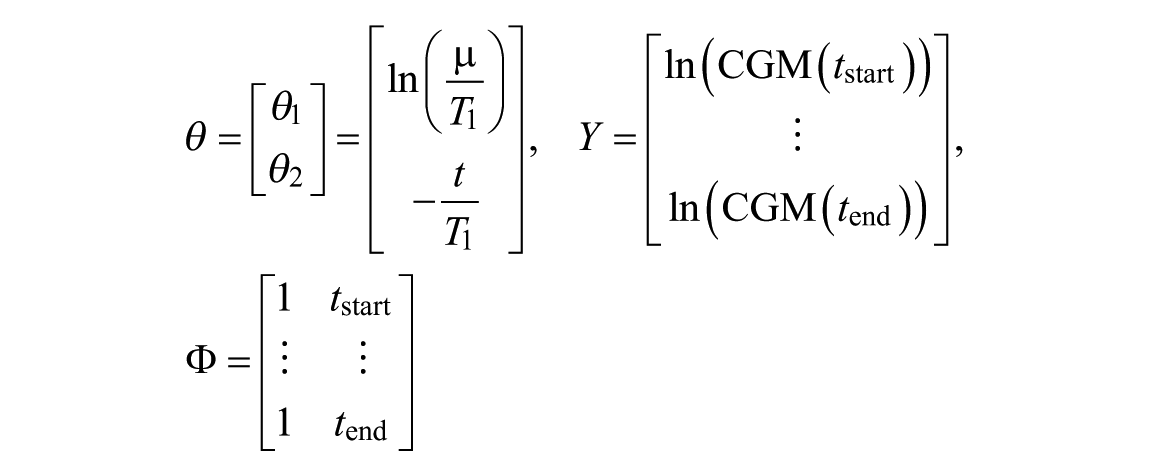
The gains are set equal to the area under the curves (AUC) of the impulse response data, while the slow time constant (T1) is estimated from the final part of these data,

Applying a log transformation to the signals, the model can be rewritten as

where
and
The linear minimal mean squared error (MMSE) estimator is used to identify the time constant

and the solution can be expressed in closed form without compromising stability constraints:

with
Step 2: linear individualized model
The first step provides the model parameters that describe the glucose dynamic of the Av patient, which is the starting point for step 2. The second step exploits the patient data to personalize the identified Av model. This step is mainly based on the hypothesis that the acquired knowledge on glucose dynamic is mostly reliable. Specifically, the patient-tailored parameters are identified by minimizing the SSR with respect to the patient data.
A delay term (

In this paper, the parameter
In order to provide a reliable initial condition for the optimization, the gains µi and µm are initialized using some available clinical parameters, 40 such as correction factor (CF) and the carbohydrate-to-insulin ratio (CR), in particular:

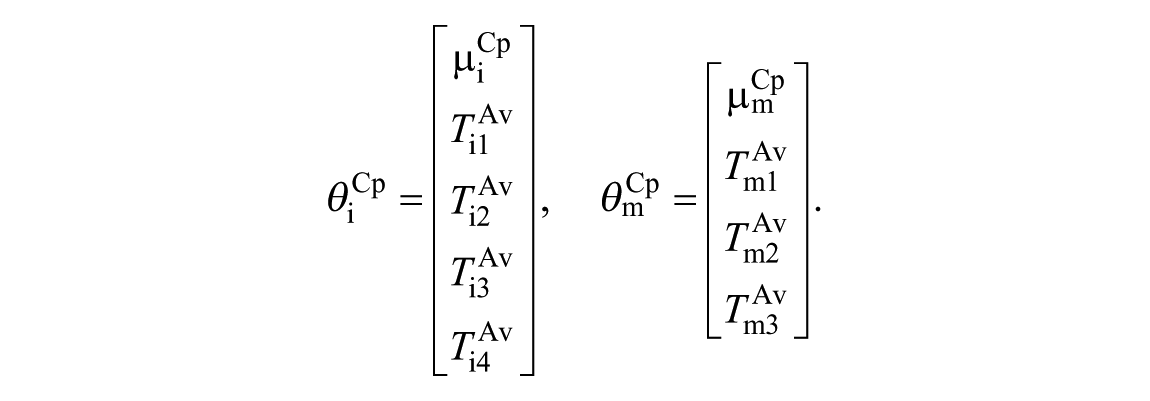
while the time constants are initialized to the estimated time constants of the Av model:
Then, the optimization problem is split in two parts to identify separately the effect of insulin and meals on glycemia. This choice is due to the higher variability of the insulin parameters with respect to meal ones. So, the parameter

with
Then, the estimated

with
The optimal parameters of PTM will be
Discrete-time model
The continuous-time model identified in the previous section is discretized via zero-order hold method obtaining
So, the final model has the following structure:

and involves a stochastic part that describes the residual error,

with
Performance metrics for identification
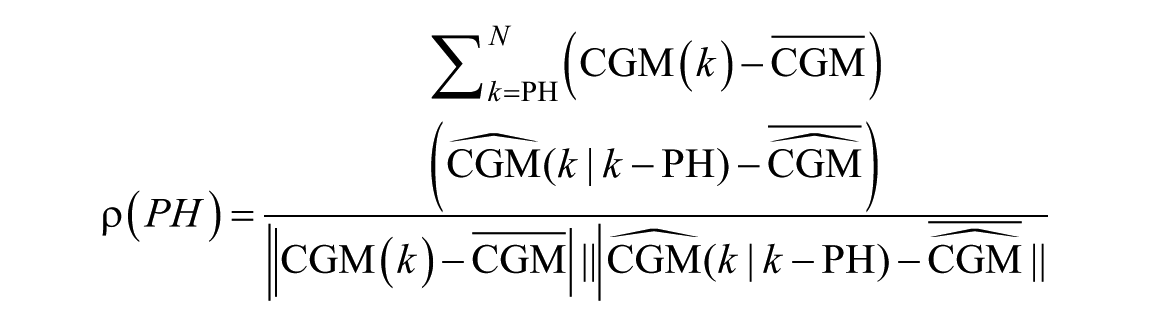
The prediction performance is assessed comparing the prediction of the future glucose (
The FIT is defined as
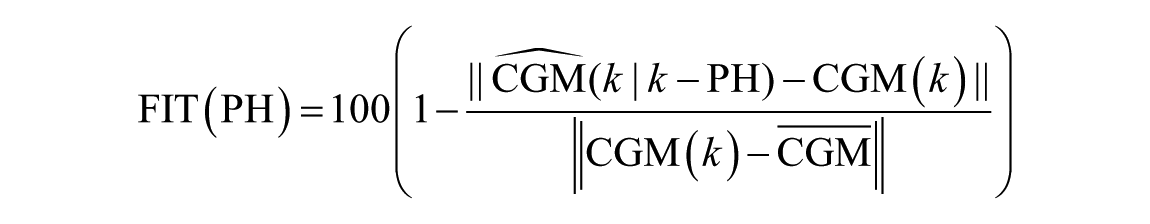
with the mean of the glucose signal referred as
The COD is defined as
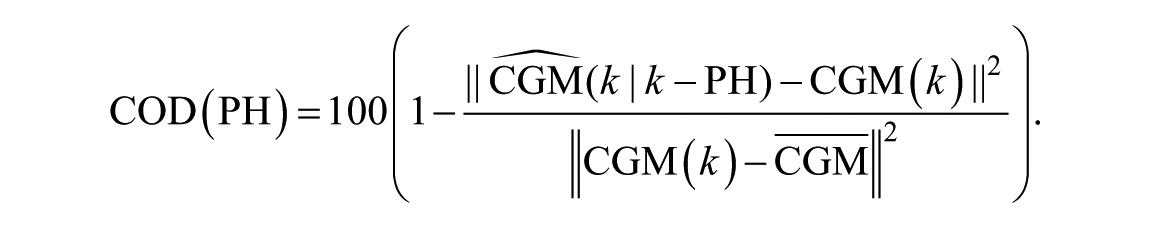
Both FIT and COD are equal to 100% if and only if
with
All these metrics are functions of PH, so the primary outcome to evaluate the quality of the models has been defined as the average value of each metric (
For each index, the mean (±standard deviation, SD) for normally distributed data or the median [25th-75th percentiles] for the non-Gaussian case has been computed over the patient cohort as cumulative index of the entire population.
Individualized hypoglycemia predictive alert
In this section, we introduce the algorithm for predictive hypoglycemia alarms: the main goal is to forewarn the patient of these potentially dangerous events ahead in time in order to prevent them. The IHPA algorithm has been introduced in Toffanin et al 40 and its core is a PTM used for the glucose prediction.
The main steps performed by IHPA algorithm are reported here in order to understand this procedure in detail. At each sample time k*, IHPA uses the PTM to predict the trend of the future glycemia
The parameters that characterize the algorithm have been set in this work as follows: PW = 8 (ie, 40 minutes), Ghypo = 70 mg/dL, and
Performance metrics for alarm system evaluation
In order to introduce the performance metrics, some indices have to be clearly defined:
- Hypoglycemia event (HE): It starts when the glycemia of the patient falls below the threshold Ghypo and it ends when the glycemia remains above the threshold for more than trec minutes
- True positive (TP): It indicates that an HE really occurred at time kh and an alarm is activated by the algorithm in the detection window (DW) defined as [kh − DWs, kh − DWe] (see Figure 1(a)). Note that HE has to be notified at least DWe minutes before its occurrence and not too far in the past (too far defined by DWs), so that the alarm is clearly related to that event.
- True negative (TN): It occurs at
- False positive (FP): It occurs when an alarm is activated at k* and no HE occurred in the window [k*, k* + DWs] (see Figure 1(c)). An episode is not counted as a FP if a meal or a hypo treatment is administrated in the window [k*, k* + DWs]. In fact, the alarm has to inform the patient about an unavoidable hypoglycemia, where unavoidable means that without the administration of carbohydrate by the patient this HE cannot be avoided. If a carbohydrate treatment is administrated, the alarm is not easily assessable. Note also that “late” alarms, ie, alarms occurring after DWe, are not associated with a FP event even if they do not count as TP.
- False negative (FN): It indicates that a HE occurred without an alarm issued in the DW interval. An example is reported in Figure 1(d) where DW does not contain any alarm. In fact, the alarm system turns on the alarm too late, just after DWe, resulting in a FN.
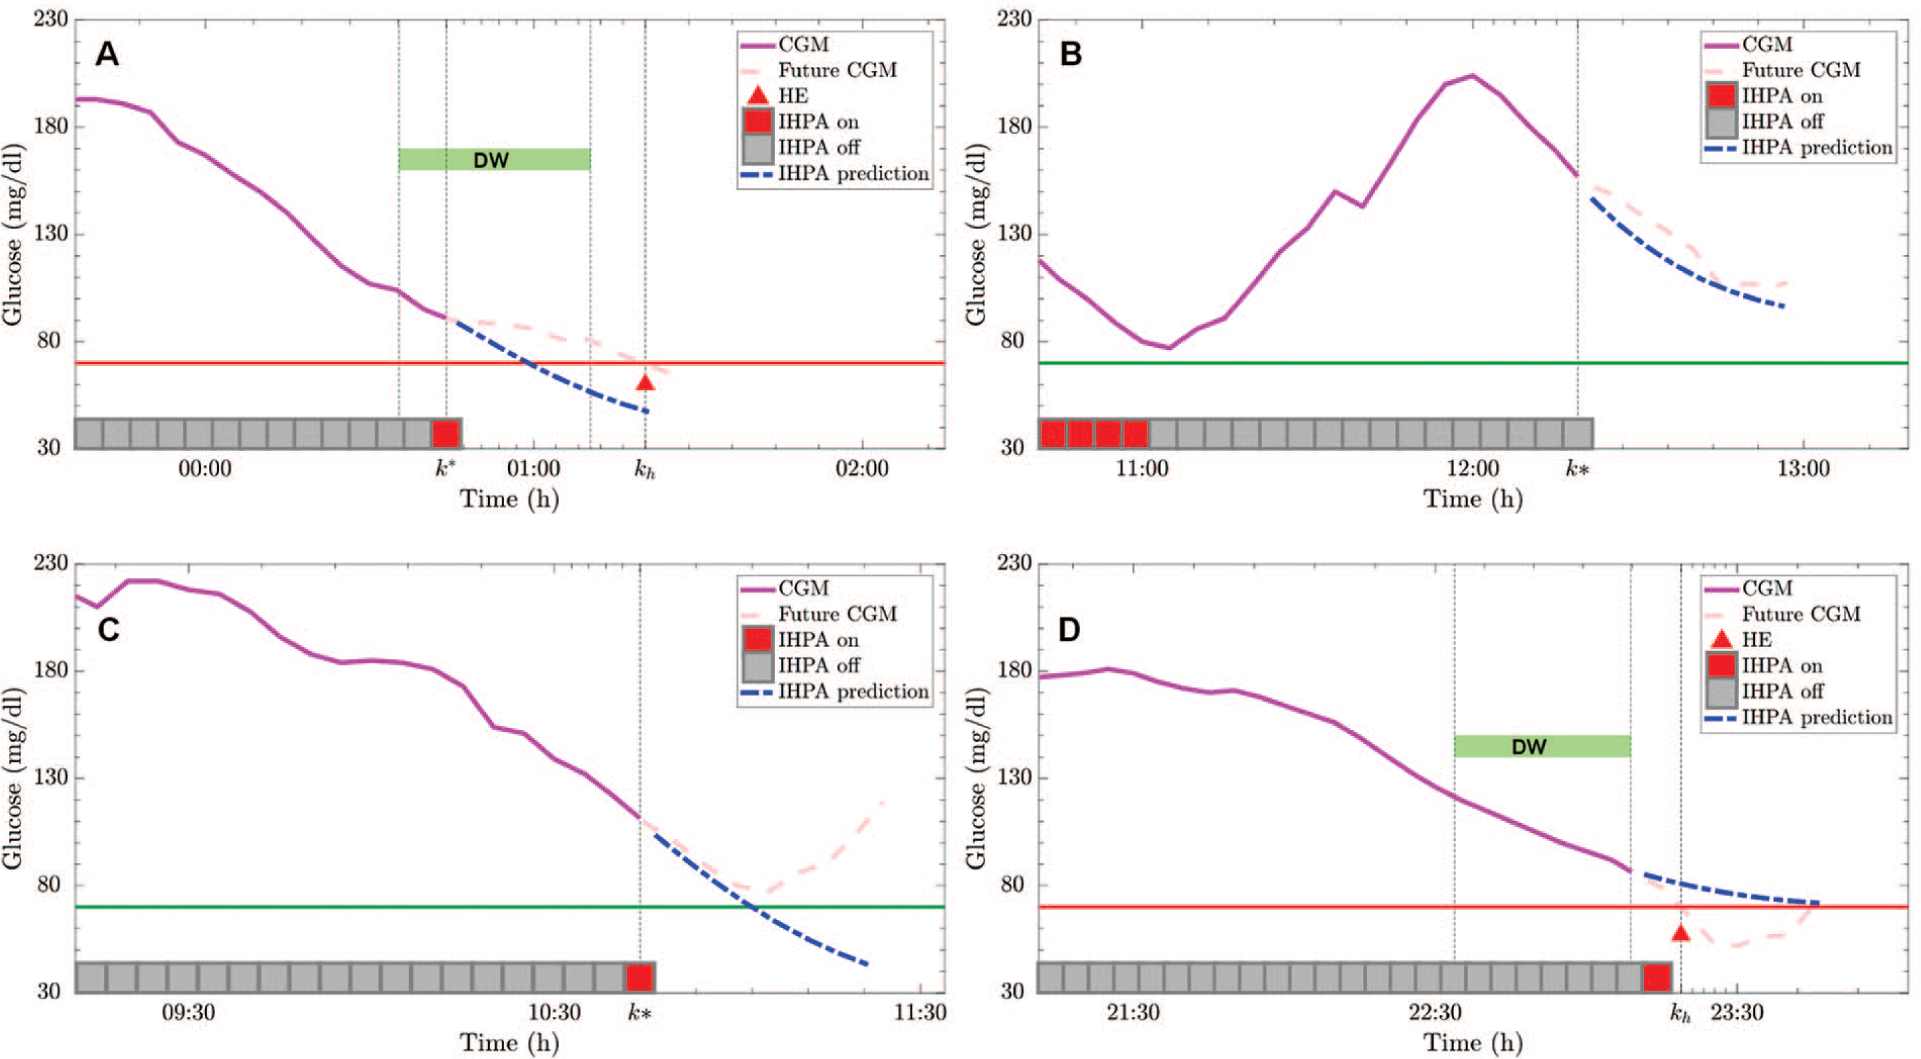
Example of true positive (a), true negative (b), false positive (c), and false negative (d) of prediction by individualized hypoglycemia predictive alert. In each panel, the continuous glucose monitoring (CGM) measured before the considered time instant
The parameters related to these definitions have been set in this work as follows 36 : trec = 20 minutes, DWs = 9 (ie, 45 minutes), and DWe = 2 (ie, 10 minutes).
The performance metrics used to evaluate IHPA approach are as follows:
- True positive rate (TPR), or sensitivity, and true negative rate (TNR), or specificity, to measure the proportion of positives and negatives that are correctly identified, respectively; these indices can be computed as follows:

- Predictive value (PPV), or precision, and negative predictive value (NPV) to measure the proportion of positives and negatives that are correctly identified over all the positive or negative predictions:

- False positive rate (FPR) and false negative rate (FNR) to measure the proportion of positives and negatives that are wrongly identified, respectively:

- Accuracy (ACC) to measure the proportion of classifications, both positive and negative, that are correctly identified:

- False omission rate (FOR) to measure the proportion of negatives wrongly predicted over all the negatives:

- F1 score (F1) to measure the harmonic average of the precision and sensitivity, F1 score reaches its best value at 1 (perfect precision and sensitivity) and worst at 0:

For each index, the mean (±SD) for normally distributed data or the median [25th-75th percentiles] for the non-normally distributed data has been computed over the patient cohort as cumulative index of the entire population.
It should be noted that in our population, the time spent in hypoglycemia was 1.9% ± 1.1% (mean ± SD) 9 and this poses well-known problems on the interpretation of the metrics reported above. In fact, in this condition, TN is very large with any reasonable alarm system, and it saturates the metrics influenced by this quantity, eg, TNR will be close to 100%, thus making these metrics less informative than in the case of balanced datasets. For instance, in an unbalanced dataset, like the one considered here, any degenerate alarm/classification algorithm that detects always the most common class (not hypoglycemia in our case) scores a very high accuracy without a real good performance.
In view of this, in this work, we will focus on sensitivity (TPR) and precision (PPV), not depending on TN, even if all the performance metrics reported before are computed for completeness.
Results and Discussion
We identified a PTM for each AMC patient. The performance metrics of these models are evaluated on the entire trial excluding the training set intervals used for the identification. The results reported in Table 1 involves the average values of the different metrics (
Predictive Performance of Patient-Tailored Models Identified for Seven Patients.
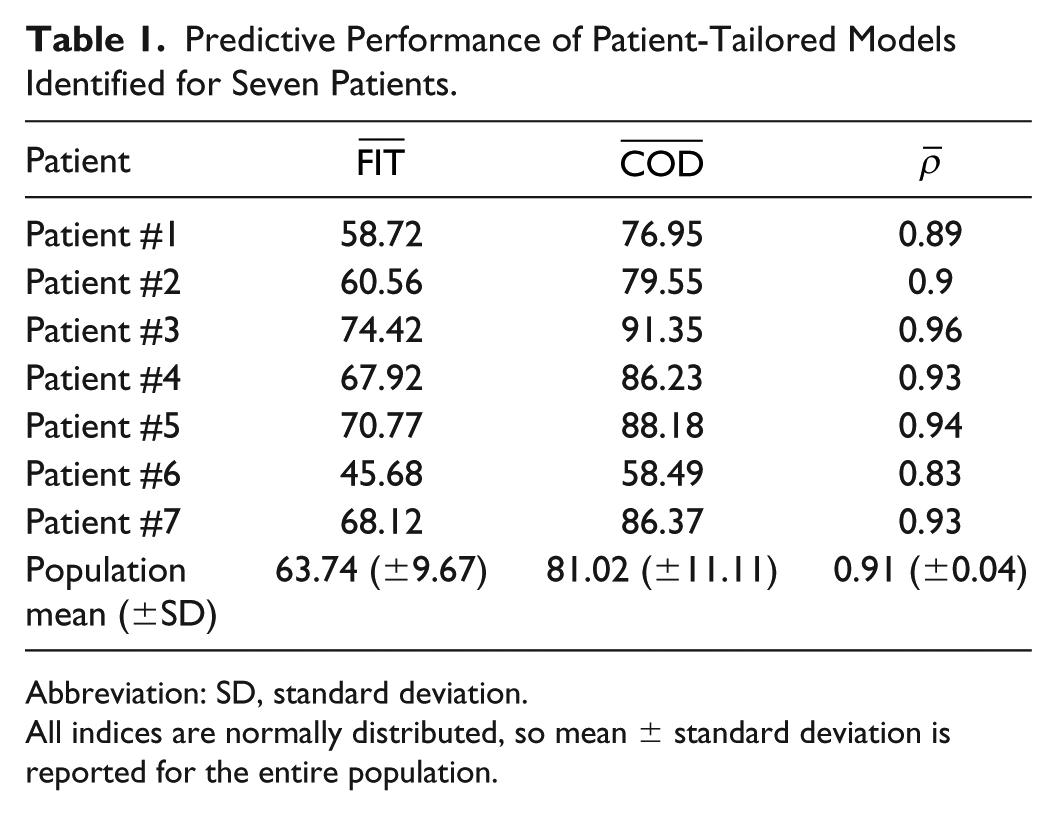
Abbreviation: SD, standard deviation.
All indices are normally distributed, so mean ± standard deviation is reported for the entire population.
From the results, it is possible to note that
The results reported in Table 2 involve the population values of different metrics (
Predictive Performance of Patient-Tailored Models Identified for the Entire Population Across the Prediction Horizon.
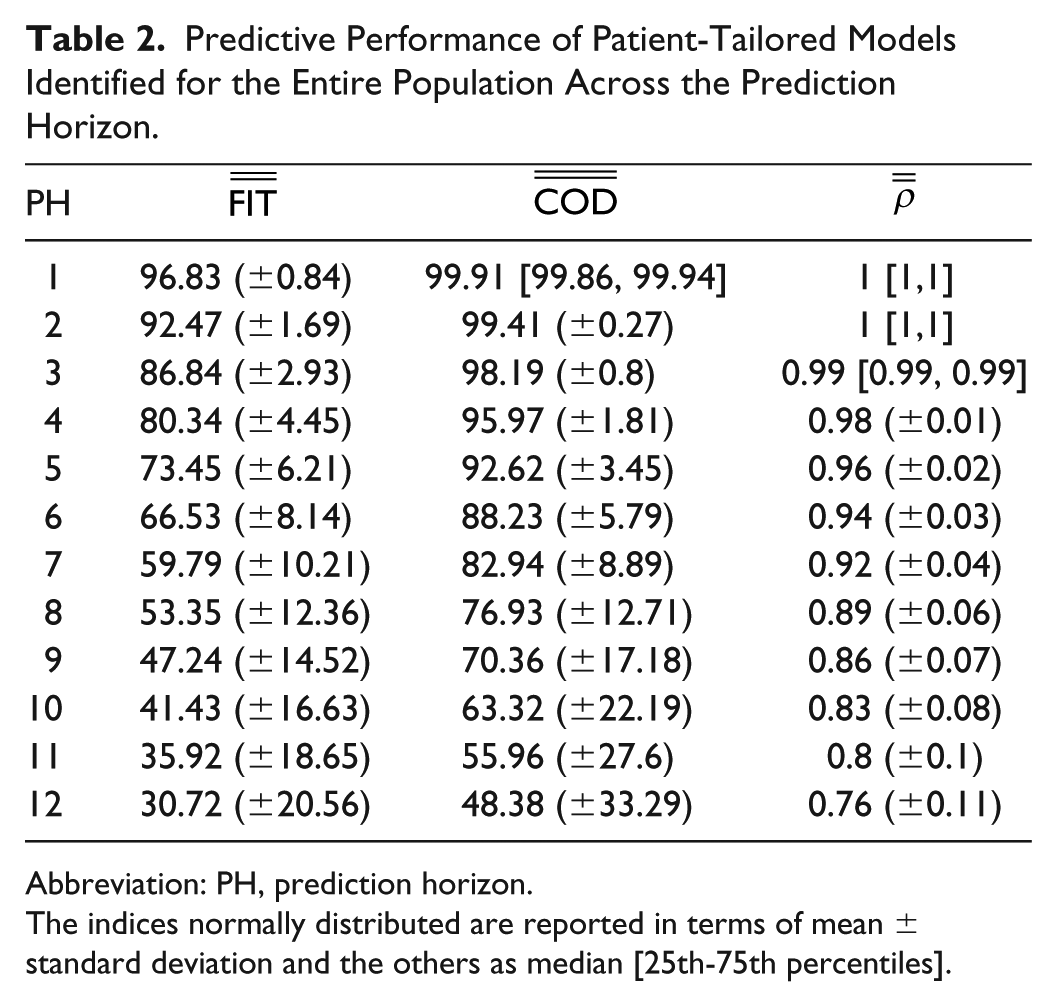
Abbreviation: PH, prediction horizon.
The indices normally distributed are reported in terms of mean ± standard deviation and the others as median [25th-75th percentiles].
The performance decreases with the increase of the PH as expected. Note that these models have been identified to design IHPA systems that uses predictions till 45 minutes (PH = 9), so it is important that the performance indices related to this interval remain above 45% for the FIT and 70% in terms of COD. However, seen the application considered in this work, the performance indices of more interest are the ones related to the hypoglycemia prediction reported in Table 3.
Individualized Hypoglycemia Predictive Alerts Performance Indices Computed on the Selected Cohort of Seven Patients.
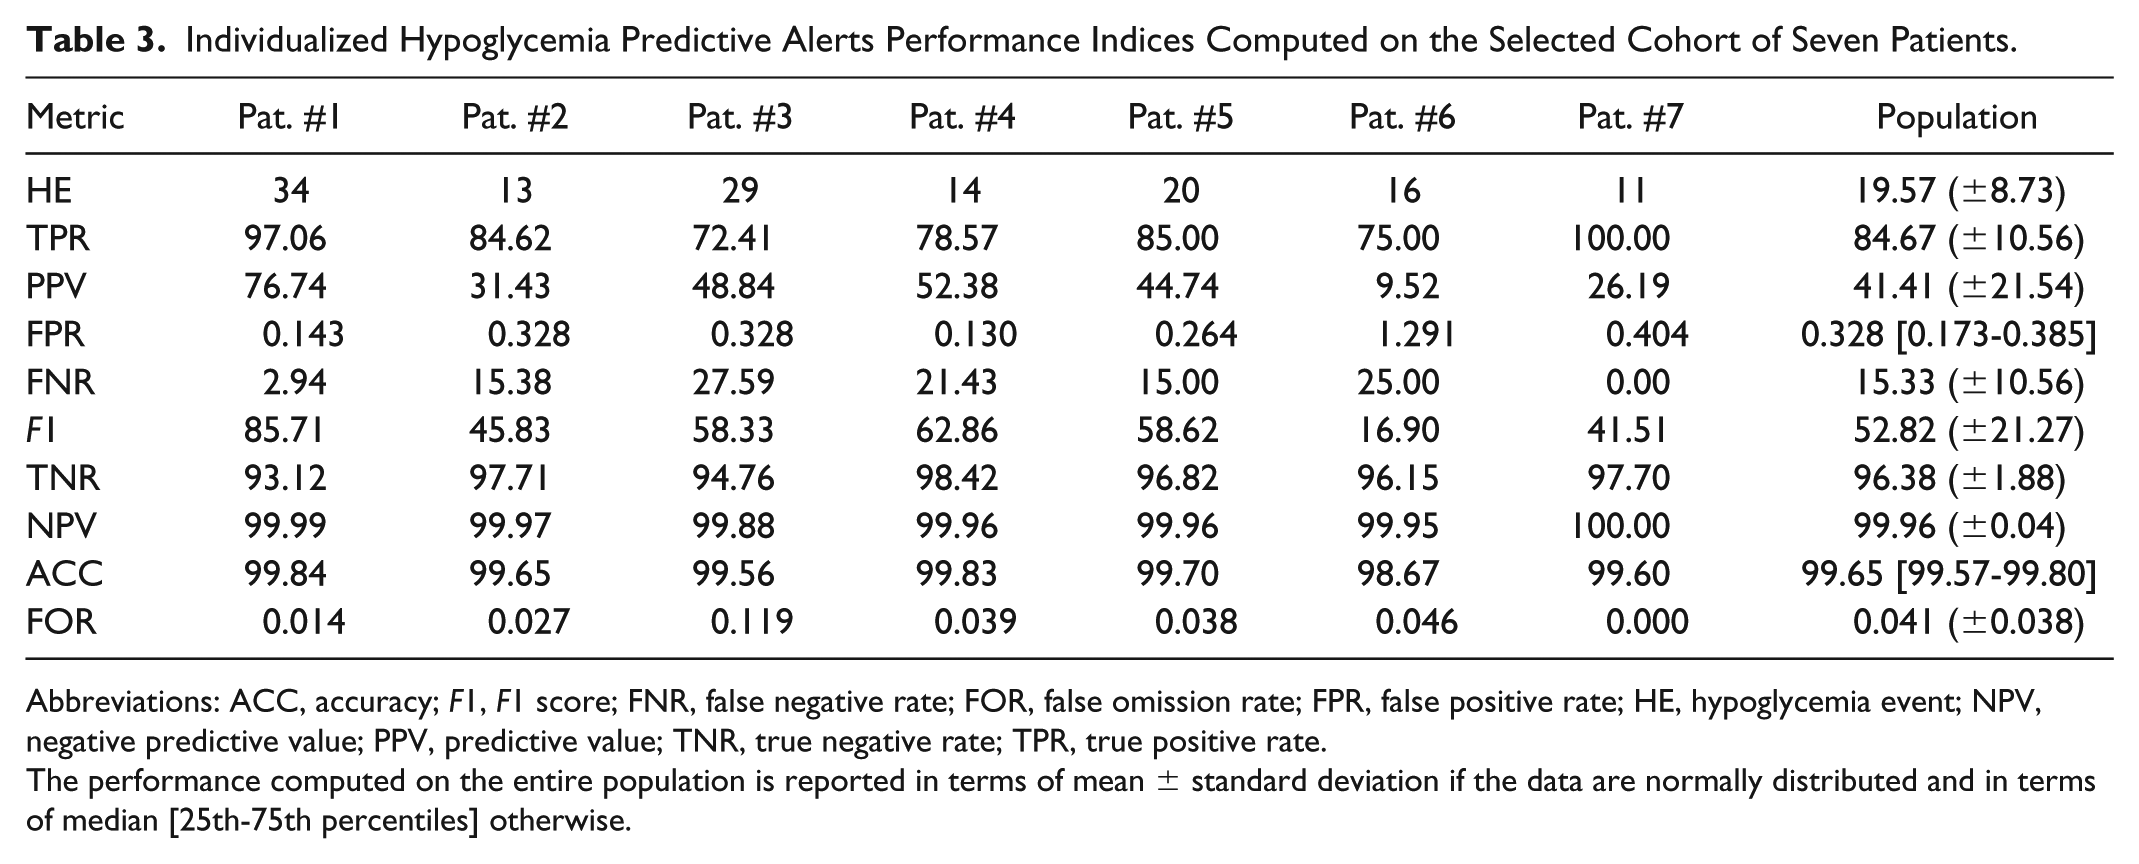
Abbreviations: ACC, accuracy; F1, F1 score; FNR, false negative rate; FOR, false omission rate; FPR, false positive rate; HE, hypoglycemia event; NPV, negative predictive value; PPV, predictive value; TNR, true negative rate; TPR, true positive rate.
The performance computed on the entire population is reported in terms of mean ± standard deviation if the data are normally distributed and in terms of median [25th-75th percentiles] otherwise.
The patients experienced about 20 HE on average. The performance indices of IHPAs on each patient and on the entire the population are reported in Table 3. The results include the sensitivity (TPR) of the predictor of 84.67% and precision (PPV) of 41.41% with FPR of 0.328% and FNR of 15.33%. F1 reaches 52.82% on average for all seven patients. Regarding the performance metrics affected by the unbalanced nature of the dataset, the specificity (TNR), accuracy (ACC), NPV (all >96%), and FOR (<0.042%) indicate alarms activated mostly when needed.
Conclusion
In this study, the technique described in Soru et al 36 and extended in Toffanin et al 40 to deal with free-living data collected without ad hoc clinical protocols has been used to identify patient-tailored models for seven AMC patients. The data used in this work were collected during a long (1 month) AP trial in free-living conditions 9 involving three clinical centers. Even if the number of the considered subjects is limited, the importance of the results obtained in this work is enforced by the large changes of the patient habits and the time-varying nature of the system under study, together with the long duration of the observed period. Patient-tailored glucose-insulin models show good predictive performance on the considered test set in terms of glucose prediction in free-living conditions with an average FIT of 63.74% on the entire considered population.
The PTMs obtained with this technique have been used to develop an individualized alarm system for each patient. The IHPAs based on PTMs showed a sensitivity (TPR) of 84.67% with FPR of 0.328% on the entire cohort of patients: on average, about 85% of the hypoglycemia events occurred during the trial have been detected in time to allow a rescue action with a negligible (<0.4%) number of false alarms.
Future works will be focused on the synthesis of individualized MPC algorithms based on these PTMs, but the testing of these controllers requires suitable clinical trials.
Footnotes
Acknowledgements
We acknowledge the AP@home project. Particular thanks to Drs J. Kropff and J.H. DeVries for conducting the clinical trial in the University of Amsterdam Medical Centre.
Declaration of Conflicting Interests
The author(s) declared no potential conflicts of interest with respect to the research, authorship, and/or publication of this article.
Funding
The author(s) received no financial support for the research, authorship, and/or publication of this article.