
Abstract
Background:
The Glucose Rate Increase Detector (GRID), a module of the Health Monitoring System (HMS), has been designed to operate in parallel to the glucose controller to detect meal events and safely trigger a meal bolus.
Methods:
The GRID algorithm was tuned on clinical data with 40-70 g CHO meals and tested on simulation data with 50-100 g CHO meals. Active closed- and open-loop protocols were executed in silico with various treatments, including automatic boluses based on a 75 g CHO meal and boluses based on simulated user input of meal size. An optional function was used to reduce the recommended bolus using recent insulin and glucose history.
Results:
For closed-loop control of a 3-meal scenario (50, 75, and 100 g CHO), the GRID improved median time in the 80-180 mg/dL range by 17% and in the >180 range by 14% over unannounced meals, using an automatic bolus for a 75 g CHO meal at detection. Under open-loop control of a 75 g CHO meal, the GRID shifted the median glucose peak down by 73 mg/dL and earlier by 120 min and reduced the time >180 mg/dL by 57% over a missed-meal bolus scenario, using a full meal bolus at detection.
Conclusions:
The GRID improved closed-loop control in the presence of large meals, without increasing late postprandial hypoglycemia. Users of basal-bolus therapy could also benefit from GRID as a safety alert for missed meal corrections.
The primary goal of the artificial pancreas (AP) is to eliminate the occurrence of severe hypoglycemia and reduce the time spent in hyperglycemia (>180 mg/dL) in an effort to improve quality of life and reduce long-term complications. 1 Safe and effective control of type 1 diabetes mellitus (T1DM) using an AP has been researched widely for several decades, with many advances, but several challenges remain. These challenges include overcoming large meal disturbances, the effects of exercise, and the delays associated with subcutaneous glucose sensing and insulin delivery. 2 One of the most difficult aspects of the diabetes therapy routine is dealing with meals, and it has been shown that inaccurate estimation of meal sizes occurs frequently, resulting in additional glucose fluctuations. 3 Recent behavioral studies have also shown that people with T1DM are interested in an automated system but are concerned with relinquishing full control.4,5 Therefore, an automatic AP that is safe and robust to daily living conditions and is trusted by the users is critical.
The AP is a multilayered device that will contain several features, including a core glucose controller, devices for monitoring of glucose and possibly other biologically relevant compounds or signals, software to interface with the user, safety systems to monitor the status of the system, and telemedicine to convey information about the system to the user and family and/or medical personnel. The core of the AP is the controller, the design of which has been explored by several research teams, with promising results.6-11 Continuous glucose monitoring (CGM) devices and insulin pumps are continually being improved, and are at a performance level that enables automatic control.12,13 Currently, longer clinical trials with several meals and exercise are being performed with good results.6,14 Generally, the trials with meals larger than 50 g of carbohydrate (CHO) use a feed-forward approach, announcing meals and giving a full or partial bolus near meal time.10,15-17 This approach is taken due to the large glucose excursion caused by high CHO meals and the delays in subcutaneous glucose sensing and insulin action. For fully automatic control to be possible with the currently available glucose sensing and insulin delivery routes, meal detection must be integrated into the control scheme.
Several types of meal detection algorithms have been devised and studied in recent years.18-21 In those cases, 1 minute sampling was used, which may increase the speed of detection and allow for increased accuracy. At this time, however, most CGMs provide data at a 5-minute sampling time. In Dassau et al, 18 the algorithms were tuned using data with withheld boluses, enhancing the meal excursion and allowing for higher sensitivity and faster detection. In addition, only isolated meals were evaluated, not full traces with several meals, and other disturbances. Some of the algorithms were trained and tested on 1-minute simulation data, with very little noise and disturbances.19,20 The present article contains an algorithm that has been trained and tested on clinical data that were in fully closed-loop mode, a reasonable model for the actual conditions in which meal detection will be utilized.
The Glucose Rate Increase Detector (GRID) is a module of the Health Monitoring System (HMS) that has been designed as a component of the AP that operates in parallel to the controller. The objective of the GRID is to detect persistent increases in glucose associated with a meal, and trigger a meal bolus to blunt the meal peak safely. It may be used in open-loop control, closed-loop control with user input, or fully automatic closed-loop control.
Methods
The modules of the HMS are each designed to monitor a specific component of the AP, or type of adverse event or disturbance seamlessly without interference. The most prevalent and risky occurrence is hypoglycemia. Thus, the Low Glucose Predictor (LGP) was designed to predict and prevent severe hypoglycemia in parallel to a controller, and has been shown to be effective in clinic in combination with the zone–Model Predictive Control (zone-MPC) controller.22-24
In an automatically controlled system, unmeasured disturbances such as meals can cause large excursions out of the target zone, leading to hyperglycemia and, often, subsequent hypoglycemia due to overdelivery in response to a meal. The GRID has been designed as the second module in the HMS, for the express purpose of detecting meal excursions with high specificity and short reaction time.
HMS With GRID Design
The GRID algorithm uses CGM data to estimate the rate of change (ROC) of glucose and detect meal-related glucose excursions. The GRID consists of 3 main subsections: (1) a preprocessing section to prepare the CGM data for analysis, (2) an estimation section to approximate the ROC of glucose, and (3) a detection section to logically pinpoint meal events.
In the preprocessing section, the algorithm filters the data using a noise-spike filter, 25
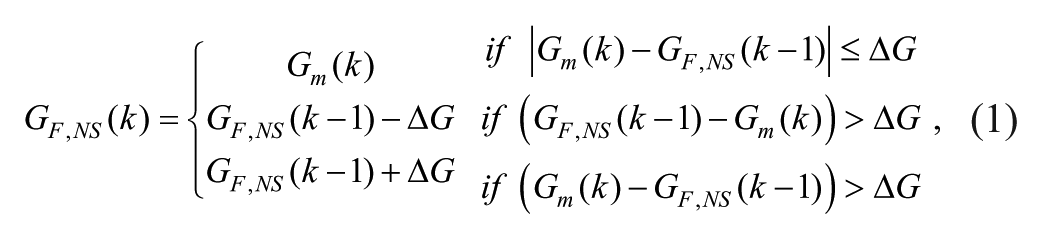
where k is the sampling instant,
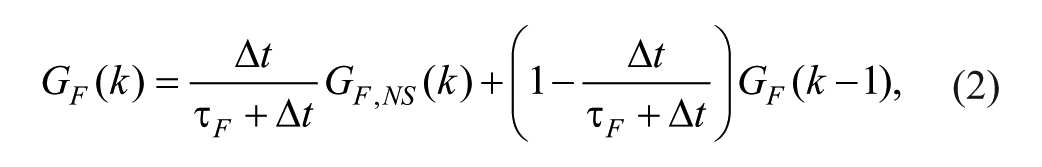
where
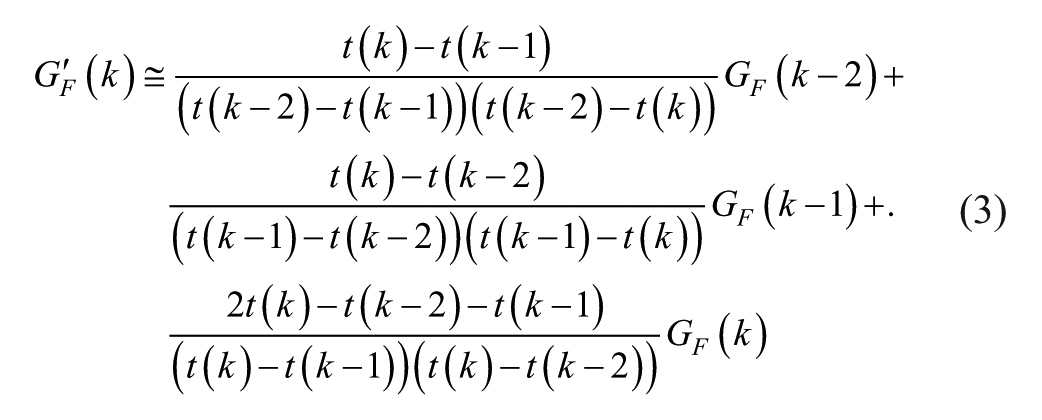
In the estimation section, the ROC of glucose is calculated using the first derivative of the 3-point Lagrangian interpolation polynomial, evaluated at the most recent point, as follows:18,22
In the detection logic, the detection,
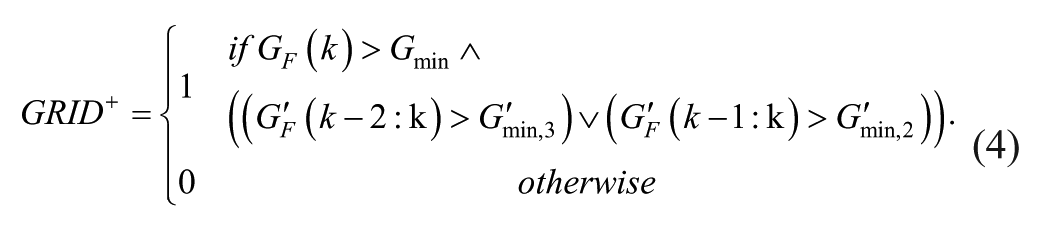
The value of
Kalman Filter Algorithm
A standard Kalman filter (KF) was used as a benchmark to evaluate the GRID algorithm. The KF was a version of the Optimal Estimation algorithm used by Palerm et al, 28 modified for use with 5-minute sampling. The detection logic was implemented as it was in the GRID, and tuned along with the number of states (2 states including glucose value and ROC of glucose and 3 states including the acceleration of glucose as well) and the Q to R ratio for specificity and detection speed, resulting in slightly different tuning than the GRID for the detection logic.
Integration of HMS Into Control Scheme
The knowledge of a meal event is helpful for disturbance rejection, and can be used as a form of inferential control. Using GRID, the state of the system, with respect to meal events, is estimated. Once the discrete meal event is detected by the GRID module, a sequence of events to reject the disturbance is activated. There are 2 modes explored in this article, as shown in Figure 1: the User-Input Mode, in which the detection triggers an alert that requests meal information, which is then used to deliver a full or partial meal bolus; and the Automatic Mode, in which a medium-sized meal bolus or a correction to low normal glucose levels is calculated and delivered automatically. Both modes can operate with the Recent History Correction (RHC) function active to adjust the recommended bolus. The RHC has 2 functions: (1) to calculate the insulin delivery over the last 60 minutes and subtract the amount over basal from the recommended bolus and (2) to calculate a correction to 140 mg/dL for the lowest glucose value in the past 60 minutes and add it to the recommended bolus. The correction to 140 mg/dL can be negative, reducing the recommended bolus if recent glucose values were on the lower end of the target zone. This action provides an additional safeguard against overdelivery. All of these calculations are based on the clinical parameters of the subjects, including insulin to carbohydrate ratios and correction factors.
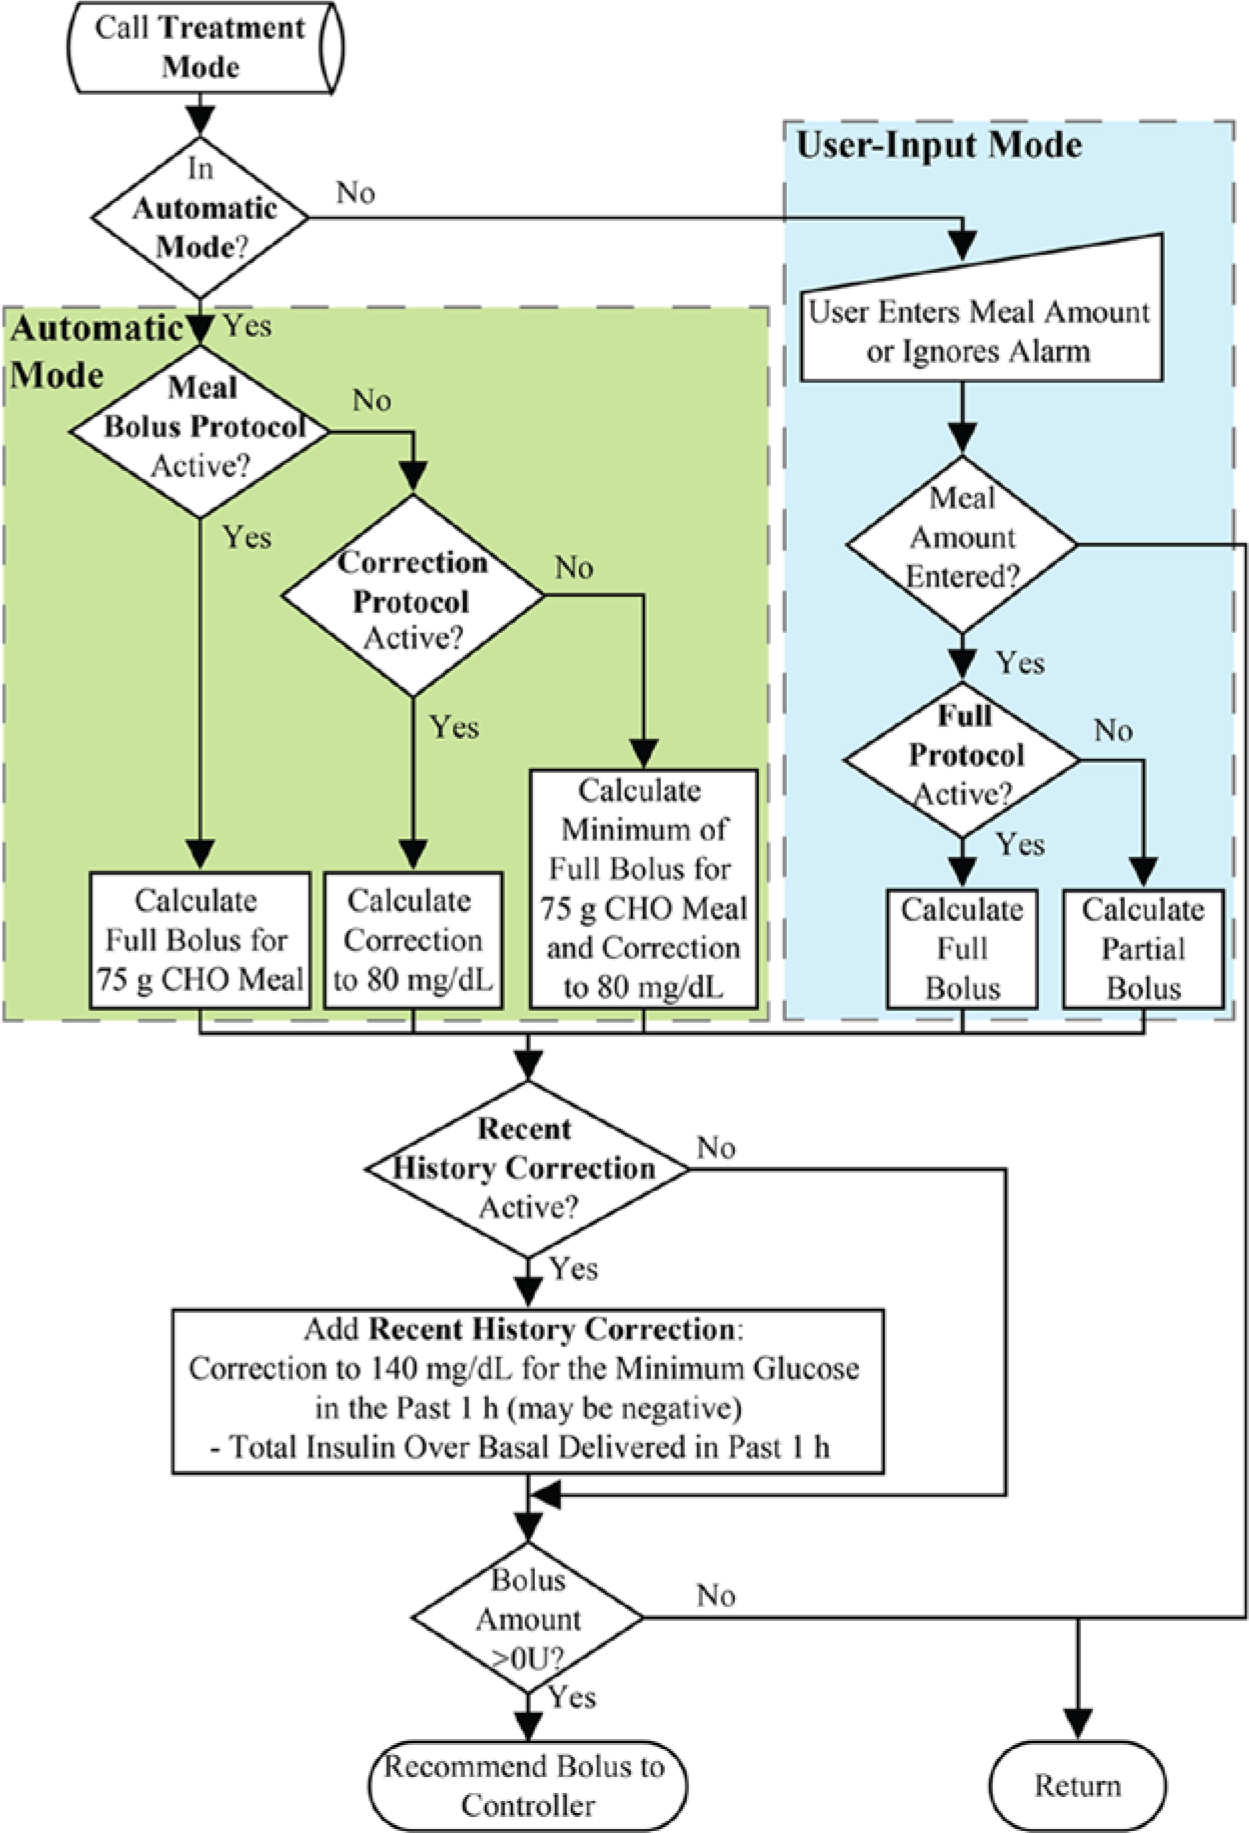
Flow chart for GRID treatment protocols, followed after a meal is detected. Automatic Mode protocols are in the green box (on the left) and User-Input Mode protocols are in the blue box (on the right).
The full incorporation of the HMS, including the GRID and the LGP, is shown in Figure 2, with CGM information being sent to both LGP and GRID, and insulin information being sent to GRID to allow for calculation of the RHC. The HMS operates in parallel with the controller to minimize interference and also to reduce the likelihood of adverse safety events due to module failure.
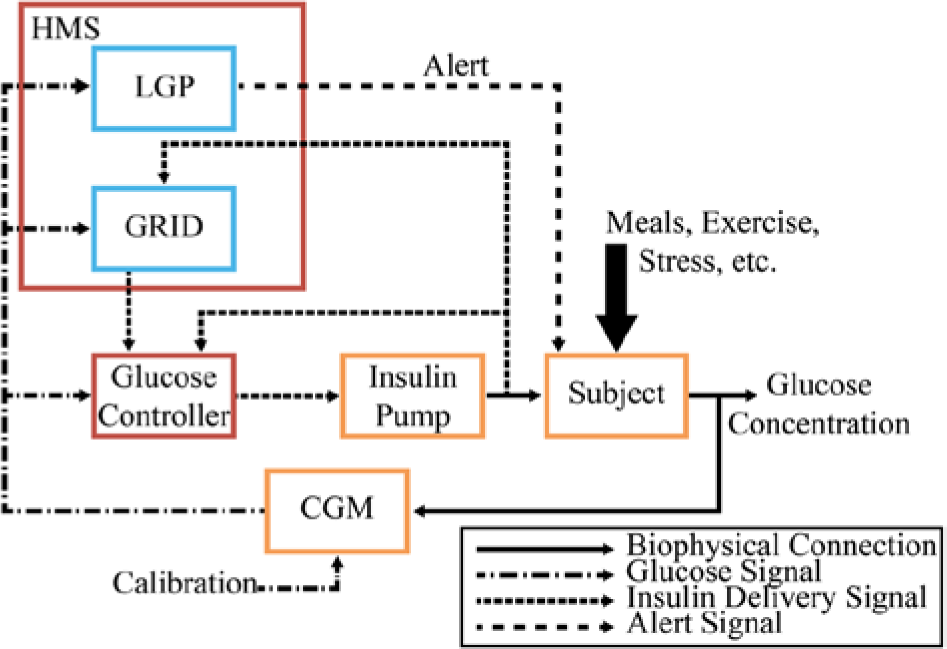
Block diagram of a fully automated AP with the GRID receiving CGM and insulin delivery information, and, upon detection of a meal, relaying a bolus recommendation to the glucose controller. The HMS is outlined in red, with submodules GRID and LGP outlined in blue, the controller in red, and physical devices and the subject in orange.
Training and Validation
The GRID and KF algorithms were tuned using training data from clinical trials and tested on a validation set of clinical data and an in silico data set, all with unannounced meals. As mentioned above, the algorithms were tuned, in order of importance, for low detection time, low false positive rate (high specificity), and high number of meals positively identified. Tuning involved exploring a wide parameter space for 4 tuning parameters,
Characteristics of Training Clinical Data Sets, Validation Clinical Data Sets, and Simulation Testing Set.
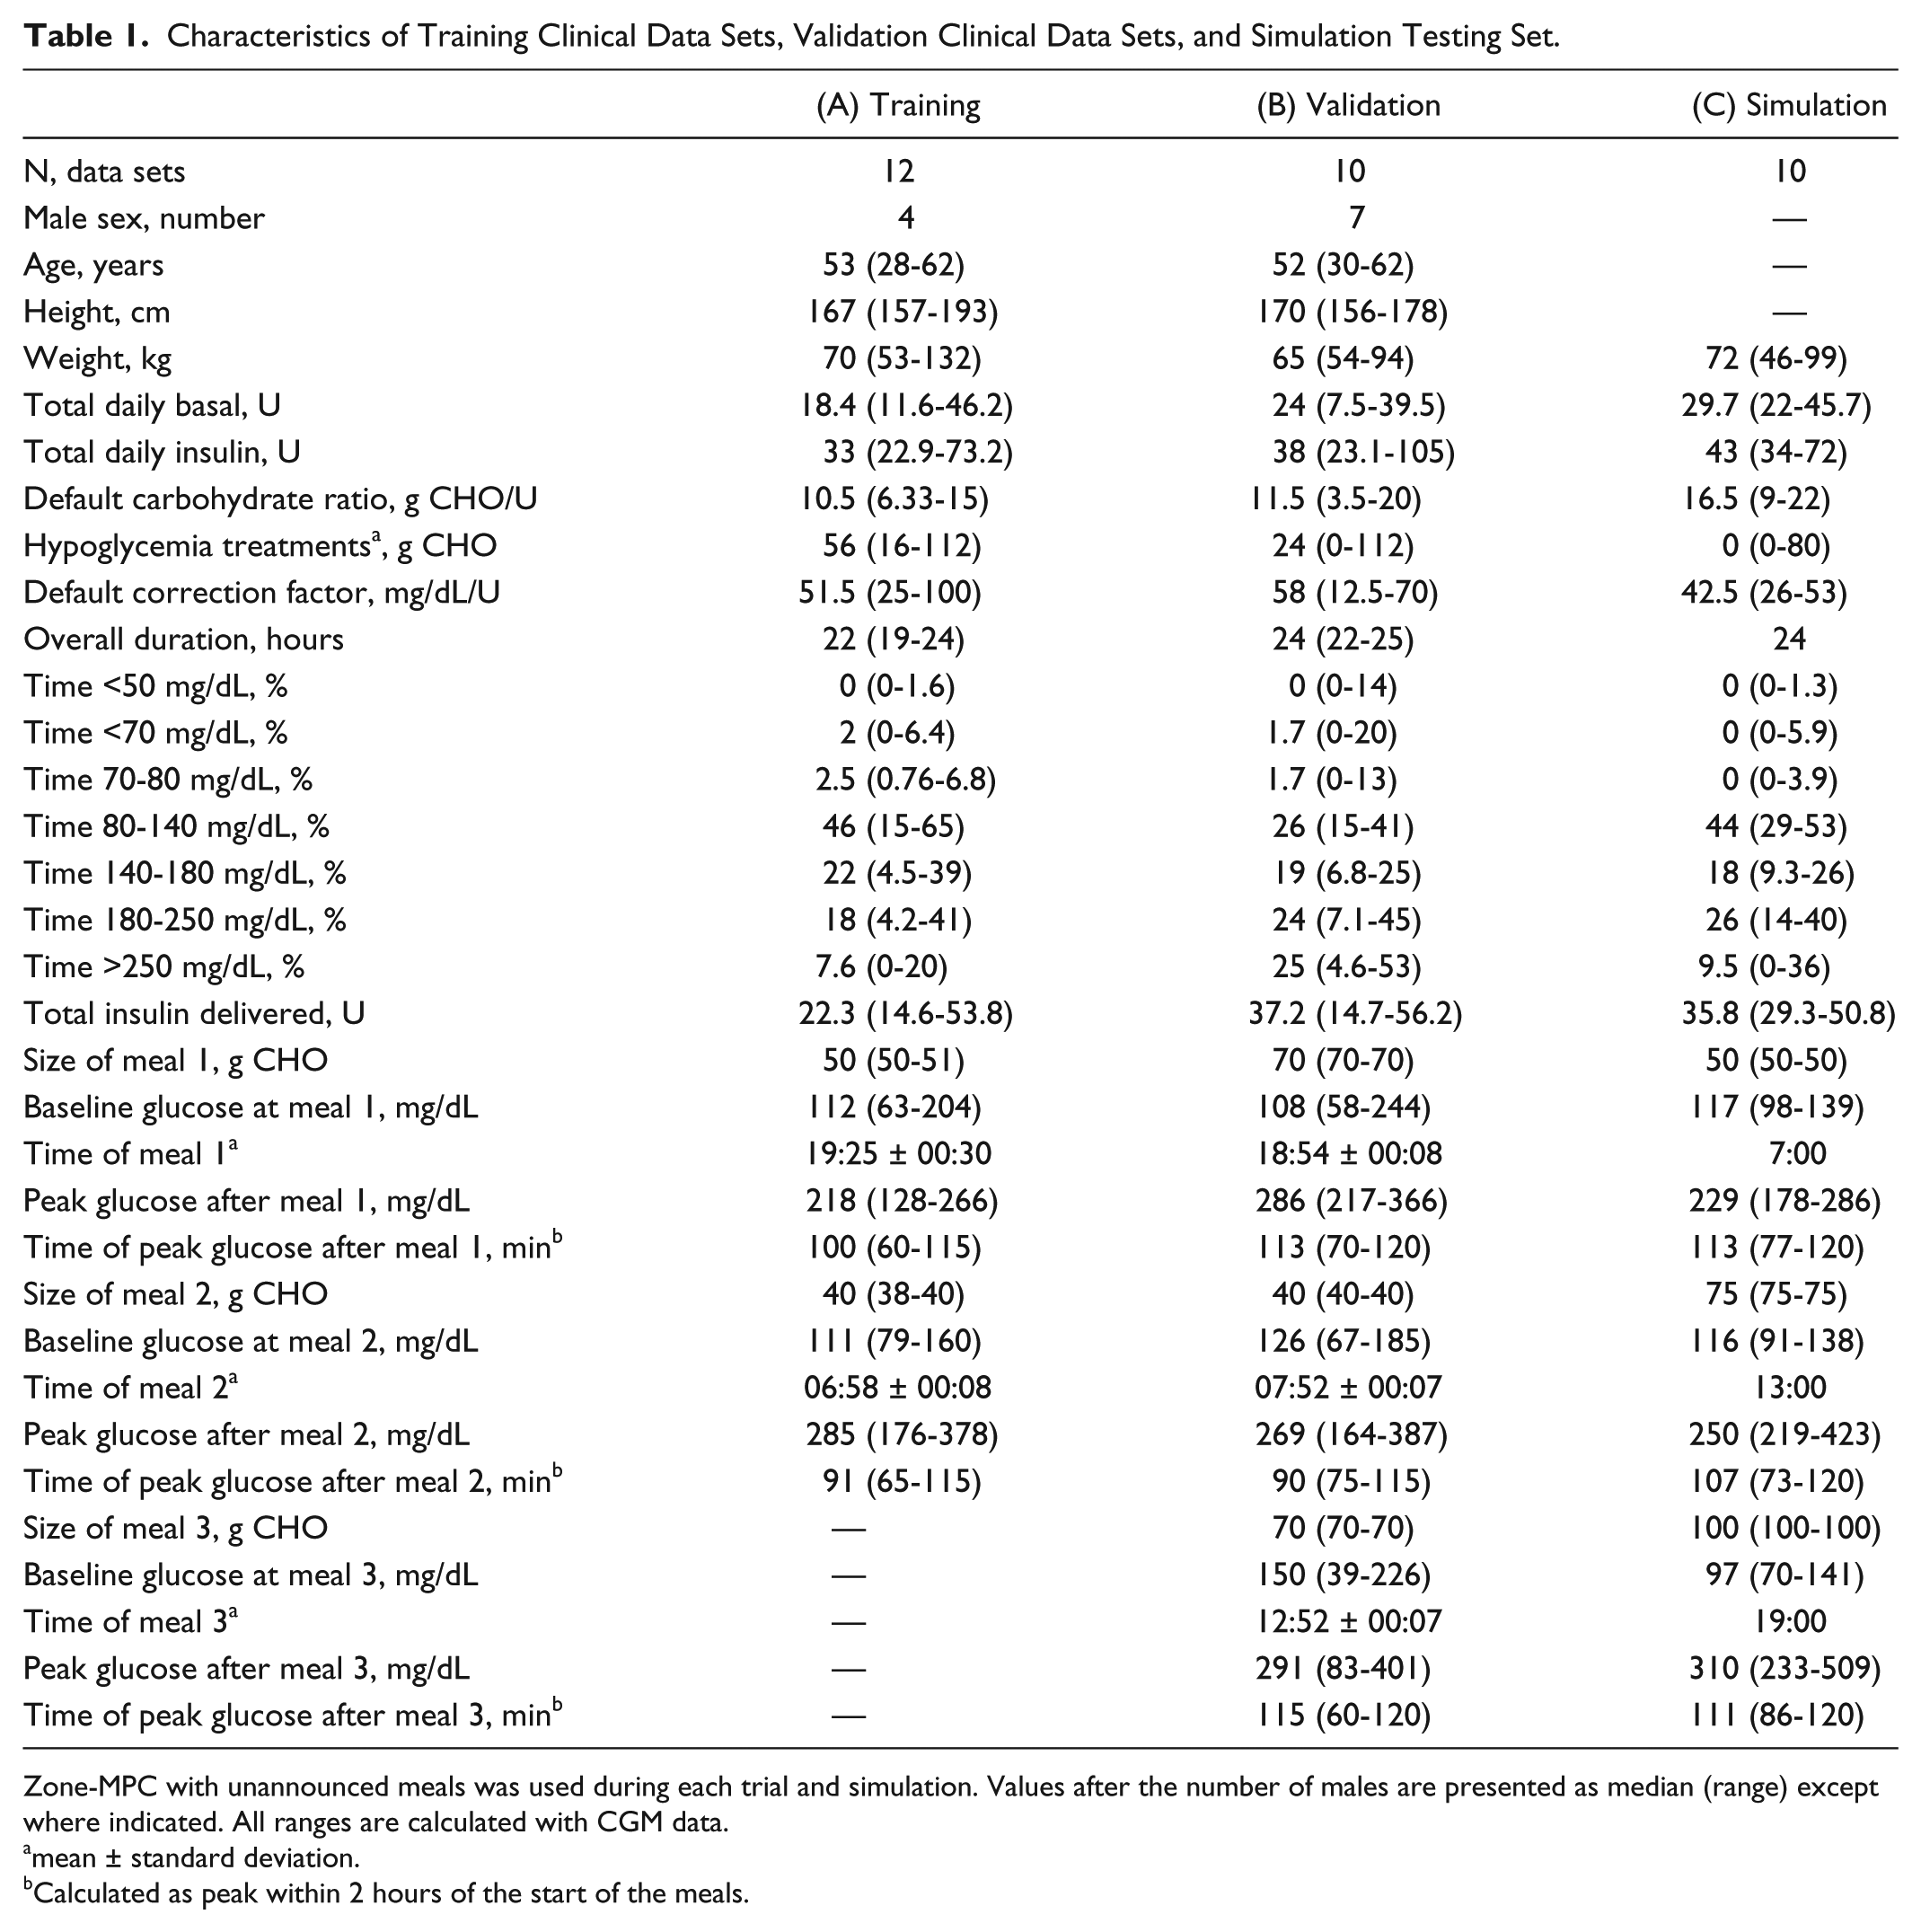
Zone-MPC with unannounced meals was used during each trial and simulation. Values after the number of males are presented as median (range) except where indicated. All ranges are calculated with CGM data.
mean ± standard deviation.
Calculated as peak within 2 hours of the start of the meals.
Retrospective Clinical Data
The training data comprised 12 fully closed-loop, 24-hour trials with subjects with T1DM using zone-MPC with a target zone of 80-140 mg/dL and HMS with LGP, performed at the Sansum Diabetes Research Institute using the Artificial Pancreas System (APS©). 33 The subjects were given small to medium-sized meals (40-50 g CHO) and performed 30 minutes of moderate exercise, with some subjects receiving 16 g CHO snacks before exercise, and several receiving 16 g rescue CHO per the HMS. All subjects used Dexcom® SEVEN® PLUS, (Dexcom®, San Diego, CA) CGMs with a 5-minute sampling period, and received subcutaneous insulin delivery.
After tuning the algorithms, validation was performed on data from a separate set of clinical trials with different subjects, all with T1DM. 34 Again, zone-MPC with HMS was used in the AP system. Subjects consumed meals of 40-70 g CHO and several received 16 g rescue CHO per the HMS.
In Silico Trial Testing
To further compare sets of tuning parameters, in silico trials were conducted using the Food and Drug Administration (FDA)–accepted UVA/Padova metabolic simulator consisting of 10 adult subjects. The simulation was started at 3:00
Cost–Benefit Analysis
The success of automatically rejecting the meal disturbance is highly dependent on the speed of detection. If detected too late, it may be of no use, or even cause hypoglycemia if too much insulin is delivered in excess of the controller correction. The simulator provides a sampling period of 1 minute, so an analysis of the benefit of faster sampling rate on speed of detection, rise at detection, and the percentage of meals detected was performed.
Prospective Application
Several in silico scenarios with GRID actively running and triggering meal boluses were performed to test the algorithm. All scenarios used a sampling period of 5 minutes.
Standard Care Alert
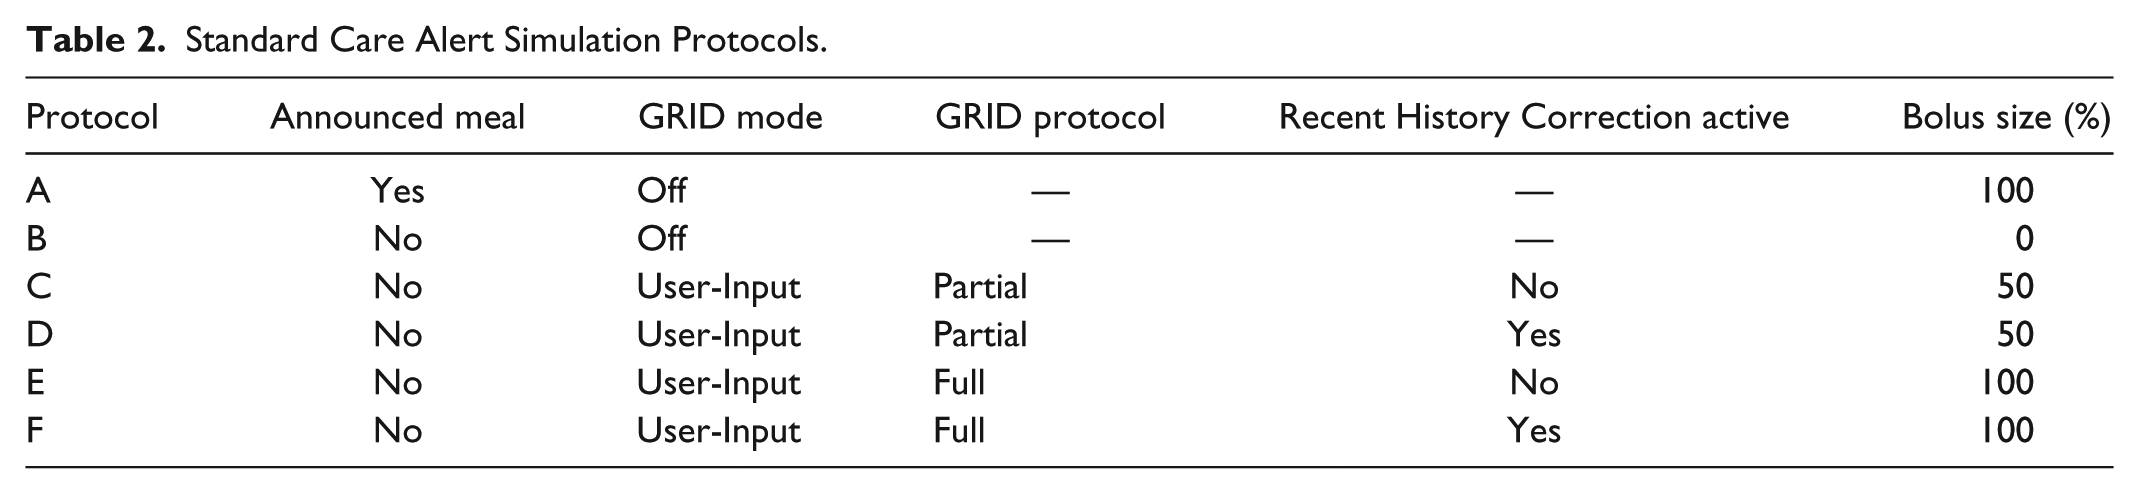
For subjects on standard basal-bolus therapy, meal boluses are sometimes missed, especially by adolescents or busy adults. 35 A missed meal bolus during standard basal-bolus therapy was simulated, to evaluate the ability of the algorithm to inform a CGM user of the missed bolus in a timely manner, blunting the glucose peak and decreasing the time in hyperglycemia. An 18-hour scenario with a 50, 75, or 100 g CHO meal at 4.5 hours was simulated with several protocols, shown in Table 2. User-input boluses are delivered at the cycle after detection to simulate the delay of waiting for user response.
Standard Care Alert Simulation Protocols.
Zone-MPC With Inferential Control
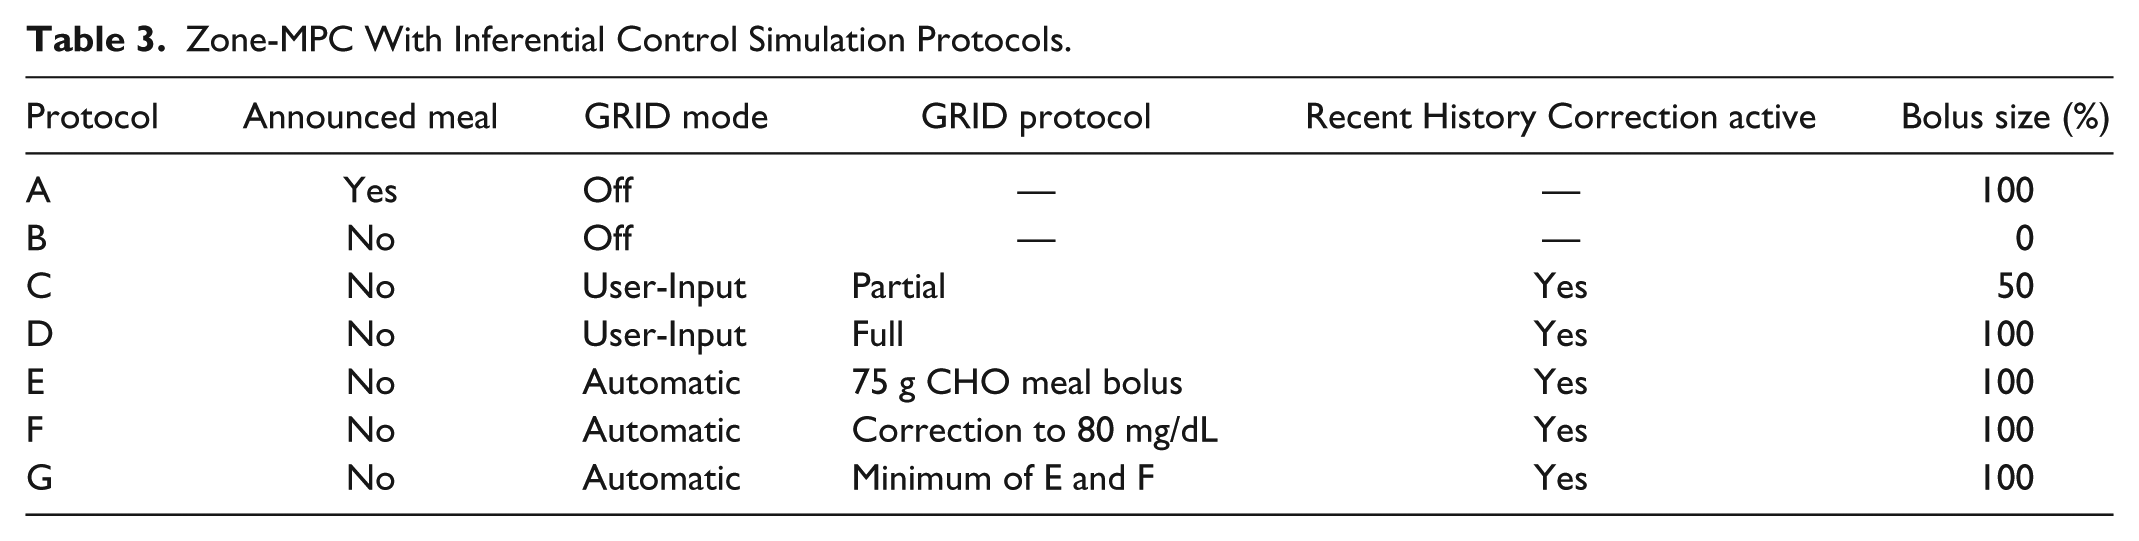
As shown above, the GRID was integrated into the control scheme as a form of inferential control, by detecting the meal disturbance, calculating an insulin bolus to reject the disturbance, and feeding this information to the zone-MPC controller. The LGP module of the HMS was also active, with a prediction threshold of 65 mg/dL and an activation threshold of 100 mg/dL.22,23,36,37 A 24-hour scenario with 3 meals of 50, 75, and 100 g CHO was performed, as above in the In Silico Trial Testing section. Control protocols are shown in Table 3.
Zone-MPC With Inferential Control Simulation Protocols.
Results and Discussion
Training and Validation
Based on the training data, the best set of tuning parameters for the GRID was the following:
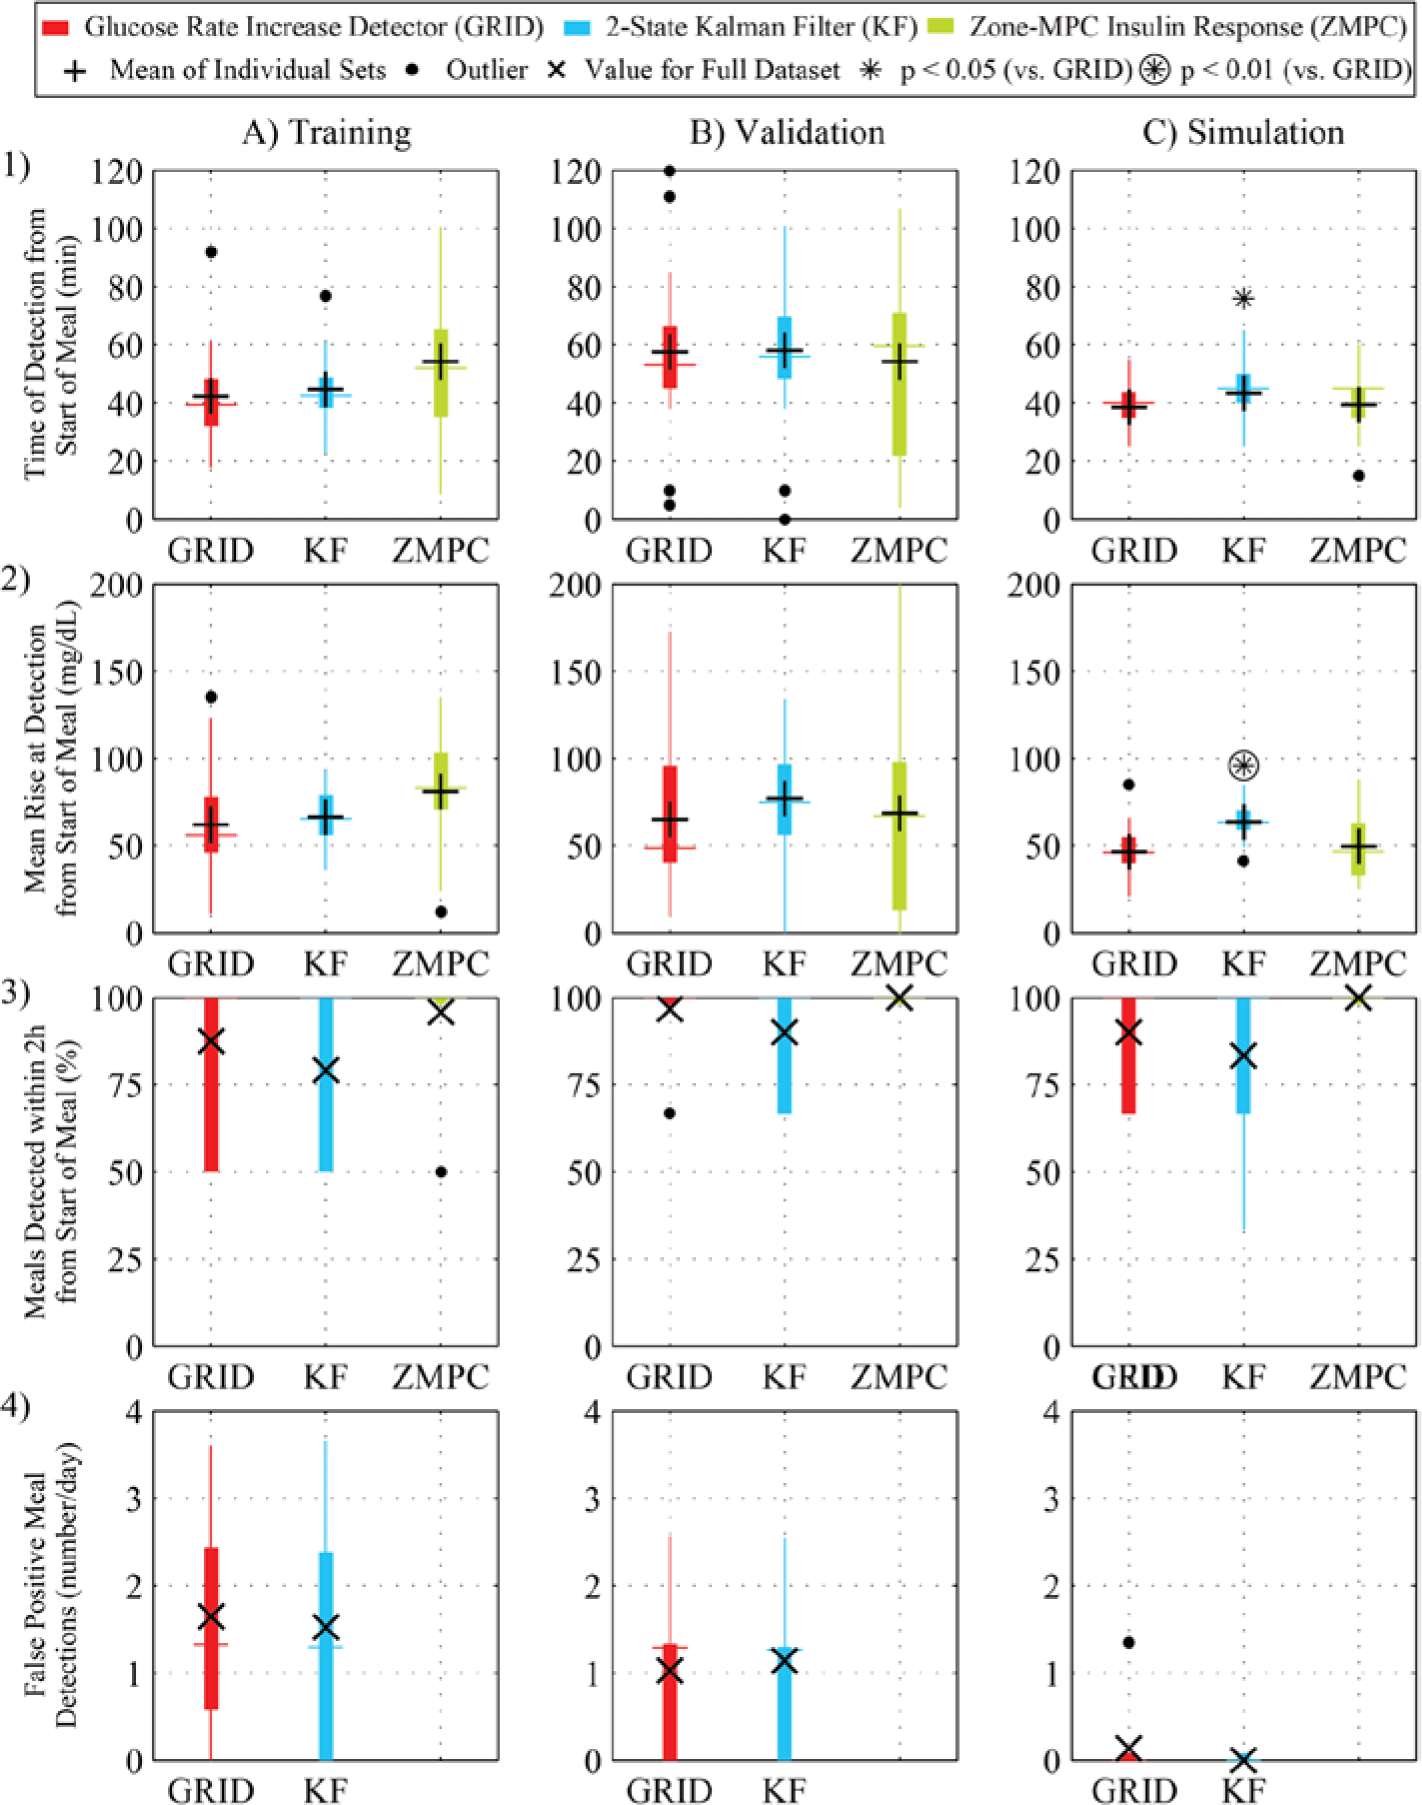
Results for the GRID (red) and KF (blue), compared with the zone-MPC insulin response (green). (A) Training set from a 12-subject clinical trial using zone-MPC with 2 unannounced meals (50 and 40 g CHO); (B) validation set from a 10-subject clinical trial using zone-MPC, with 3 unannounced meals (70, 40, and 70 g CHO); and (C) simulation set from a 10-subject scenario, with 3 unannounced meals (50, 75, and 100 g CHO). (1) Time of detection; (2) rise in glucose at detection; (3) the percentage of meals that were detected within 2 hours; (4) rate of false positive detections. The metrics with statistically significantly different results from the GRID algorithm (paired t test, P < .05 and P < .01) are shown above the boxes with asterisks and circled asterisks, respectively. Means are shown as crosses and totals in x’s.
Cost–Benefit Analysis
The cost of faster sampling can be seen in the form of expensive sensors and increased energy consumption by the sensors, receivers, and controllers, which could lead to shorter life and increased monetary cost. As the glucose sampling period increases, it is expected that detection of meals will deteriorate, so a faster sampling period could improve the performance of a controller with inferential control using meal detection. The cost–benefit analysis of this system was performed by testing sampling times of 1 to 30 minutes, as seen in Figure 4. For meals above 50 g CHO, a 5-minute increase in time to detection and a 15 mg/dL increase in glucose at detection resulted when increasing from 1- to 5-minute sampling, while all meals were still detected. Metrics for smaller meals were more impacted, due to a less pronounced glucose excursion. Small meals can generally be dealt with without the use of additional insulin from meal detection. This result indicates that a sampling period of 5 minutes is sufficient for meal detection of medium to large meals but, if reliable 1-minute sampling were readily and cheaply available, meal detection could be improved.
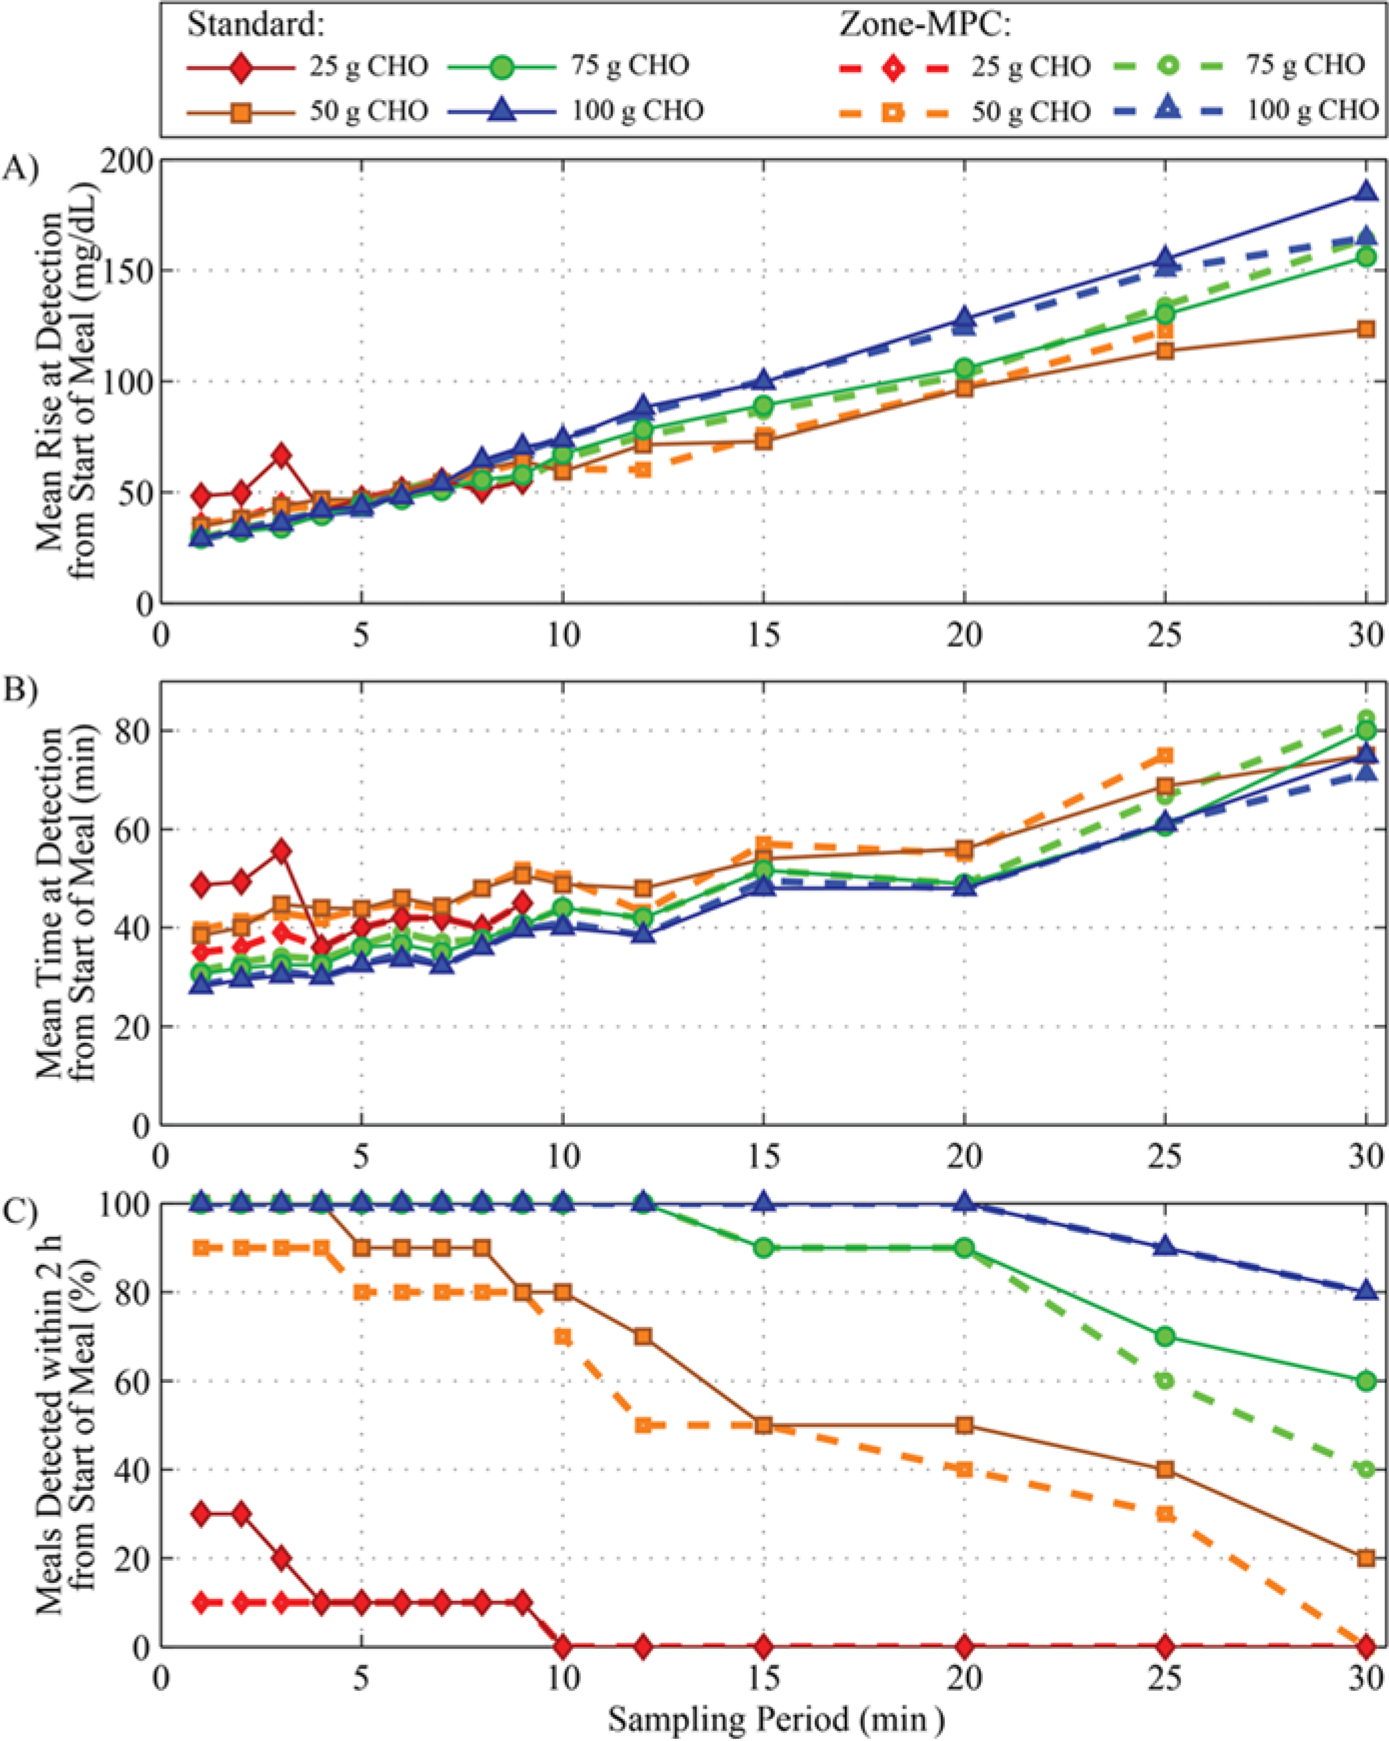
Results of a cost–benefit analysis of sampling period on meal detection metrics using in silico data. Meals of 25, 50, 75, or 100 g CHO with no bolus are shown in red diamonds, orange squares, green circles, and blue triangles, respectively. Both Zone-MPC, shown in dotted lines with open symbols, or Standard Care (basal/bolus), shown with solid lines and filled symbols, control types were tested. The GRID was executed on the data with sampling periods varying from 1 to 30 minutes. (A) Mean rise in glucose from meal commencement to time of detection; (B) mean time from meal commencement to time of detection; and (C) percentage of meals detected within 2 hours from the start of the meal.
Prospective Application
Standard Care Alert
The GRID yielded positive meal detections approximately 40-45 minutes from the start of meals, and reduced both the meal peaks and the duration of hyperglycemia, when compared to unannounced meals, as shown in Figure 5 for a 75 g CHO meal. The result of the delay in the bolus during GRID-active protocols is shown in Figure 5 by the presence of red and yellow cells in the heat plots, but is a large improvement over the missed meal protocol (B).
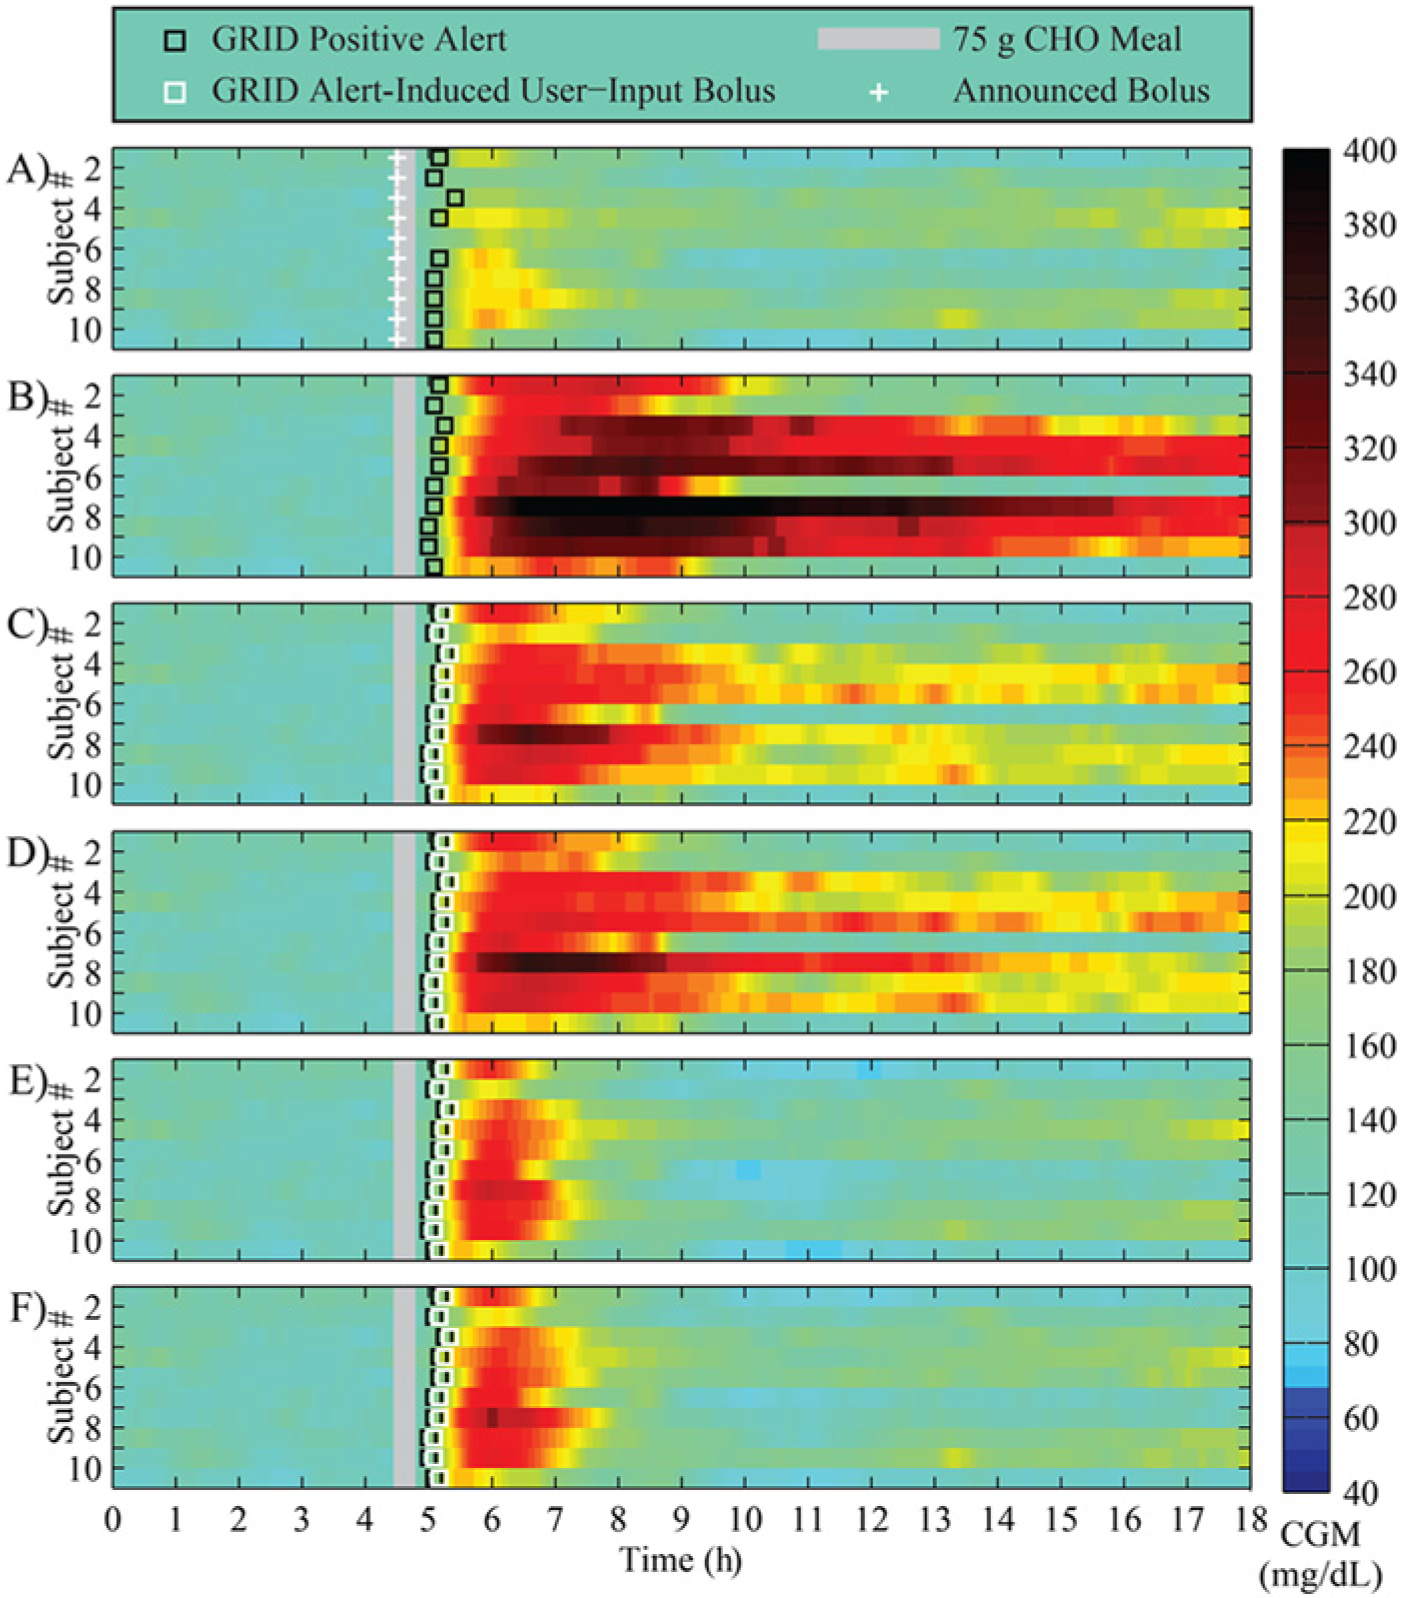
Results of an in silico study of 10 adult subjects using the UVA/Padova simulator with a 75 g CHO meal at 4.5 hours. (A) Announced meals using standard basal-bolus therapy; (B) unannounced meals using standard basal-bolus therapy (bolus withheld); (C) unannounced meals using standard therapy and the GRID active in User-Input Mode, delivering a 50% bolus for the meal, 5 minutes after detection; (D) unannounced meals using standard therapy and the GRID active in User-Input Mode, delivering a 50% bolus for the meal plus RHC, 5 minutes after detection; (E) protocol C with a 100% bolus; and (F) protocol D with a 100% bolus. Announced boluses are shown in white crosses, and User-Input Mode delivery in white squares. Meals are shown in gray bars, and GRID positive alerts in black squares.
The time in range results of single meals of 50, 75, or 100 g CHO with open-loop therapy are shown in Figure 6, with paired t test results comparing the unannounced protocol (B) to the others shown above the boxes with asterisks or circled asterisks when statistically significant. In the case of open-loop control, a full bolus with RHC is recommended at detection (E), with significantly better time in range and much less time in the hyperglycemia range than the unannounced protocol (B).
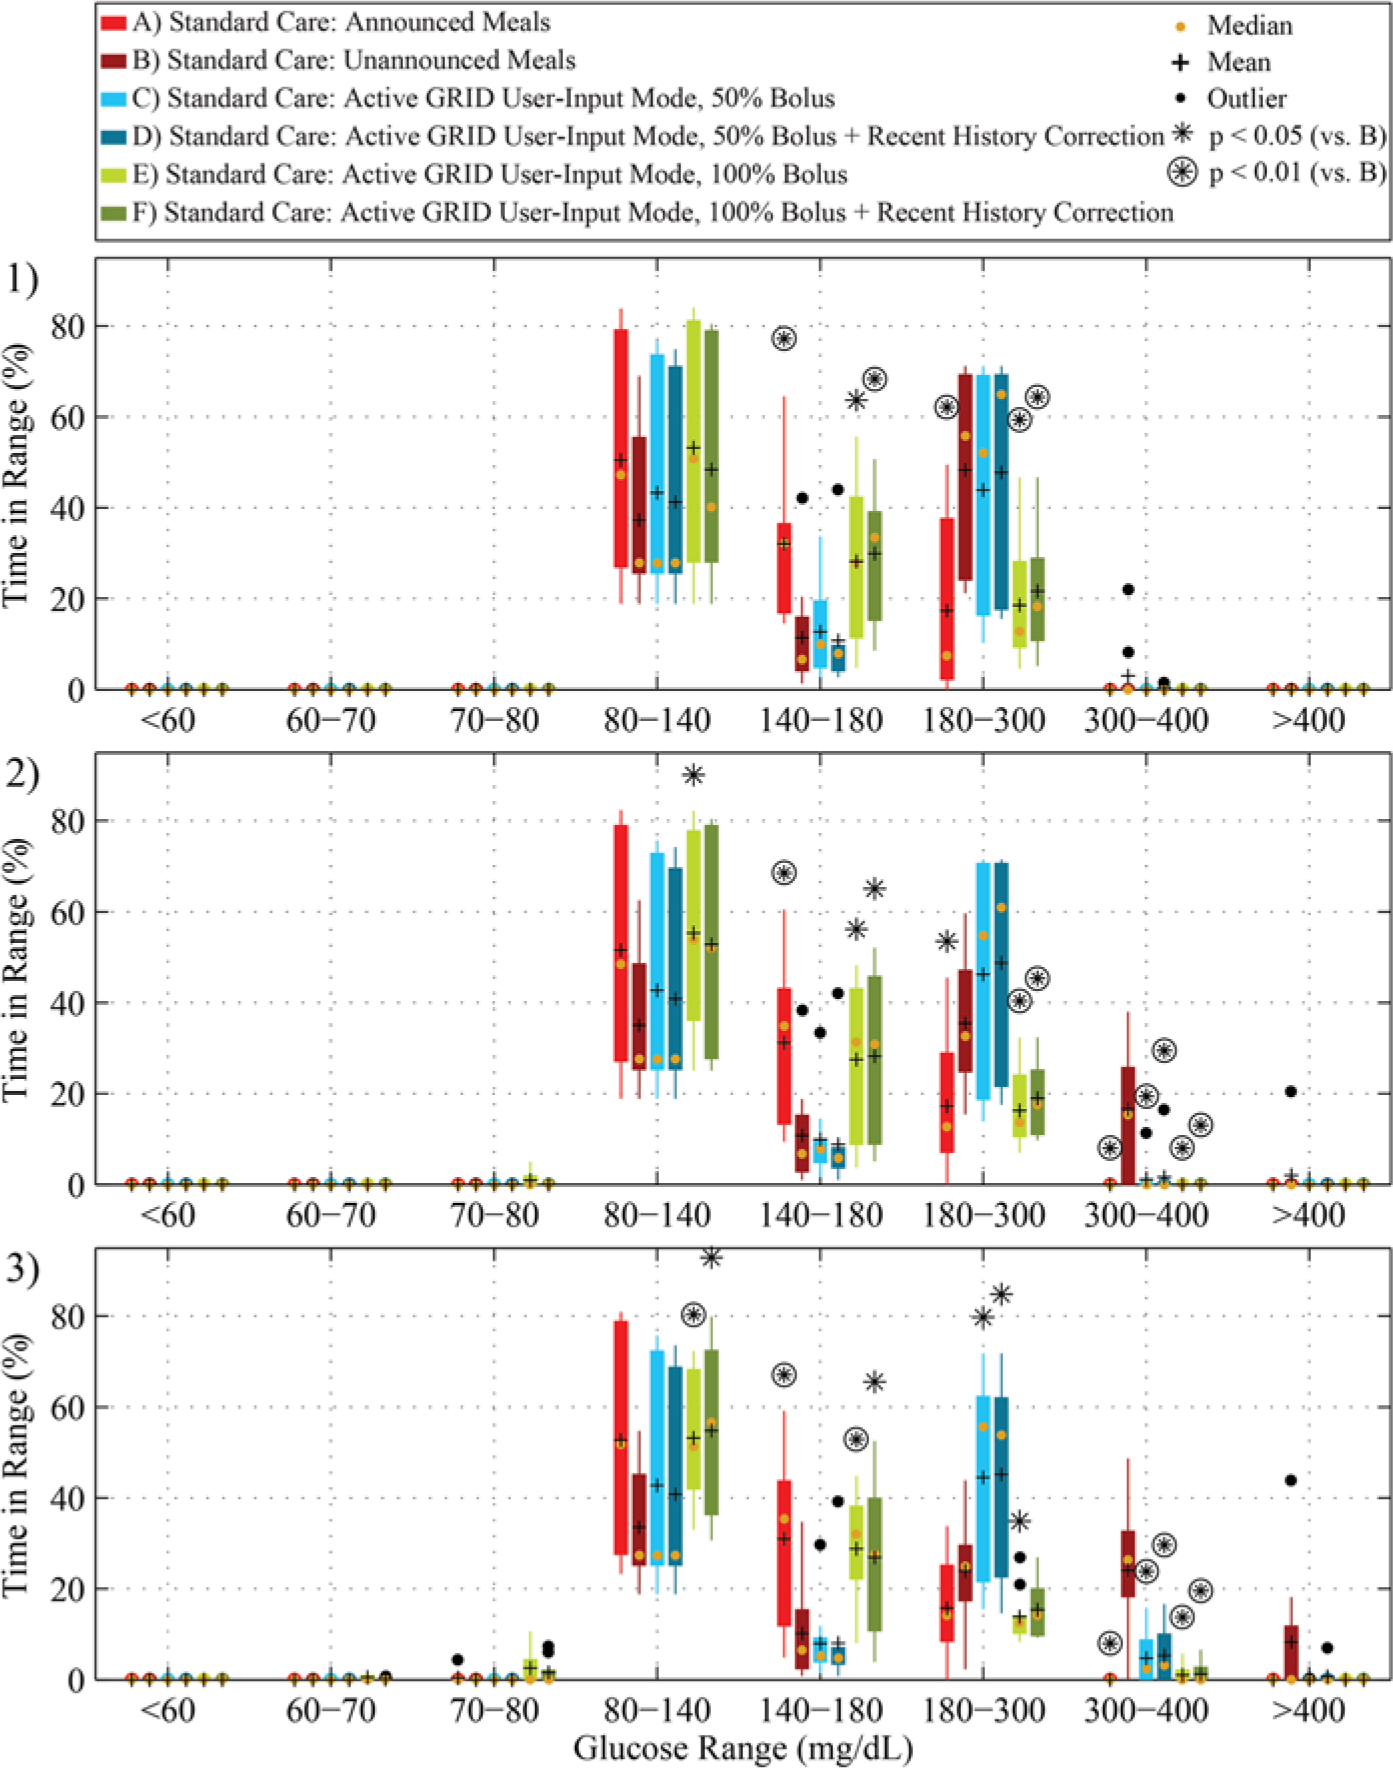
Time in range results of an 18-hour in silico study of 10 adult subjects using the UVA/Padova simulator with, from top to bottom, 50 g (1), 75 g (2), or 100 g (3) CHO meal at 4.5 hours. Scenarios A-F correspond to A-F in Figure 5 and Table 2 in red, dark red, light blue, blue, light green, and green, respectively (from left to right in each grouping). Means are shown in black crosses, and medians in orange dots. Protocols that have statistically significantly different results from the unannounced (B) protocol (paired t test, P < .05 and P < .01) are shown above the boxes with asterisks and circled asterisks, respectively.
Zone-MPC With Inferential Control
Detailed results of the zone-MPC protocols are shown in Figure 7, with time in range in Figure 8. The GRID yielded positive meal detections approximately 40-45 minutes from the start of the meal, and delivered a calculated bolus, as described above. For the Automatic Mode bolus protocol (E), the meal peak and time in the 80-180 range were significantly better than in the unannounced case (B). For all meals, the time in the 80-180 range was improved over the unannounced protocol (B) by both the Automatic Mode bolus protocol (E), and User-Input Mode protocol (D). Although up to 5 hypoglycemia treatments were given per HMS with LGP, 7 out of 10 subjects had no hypoglycemia (<70 mg/dL), and the number of treatments and time under 70 mg/dL was not significantly higher for any of the protocols when compared to announced meals. In the case of closed-loop control, a full bolus for a 75 g CHO meal with RHC is recommended at detection (E), with significantly better time in range and much less time in the hyperglycemia range than the unannounced protocol (B). Detailed results are shown in Table 4.
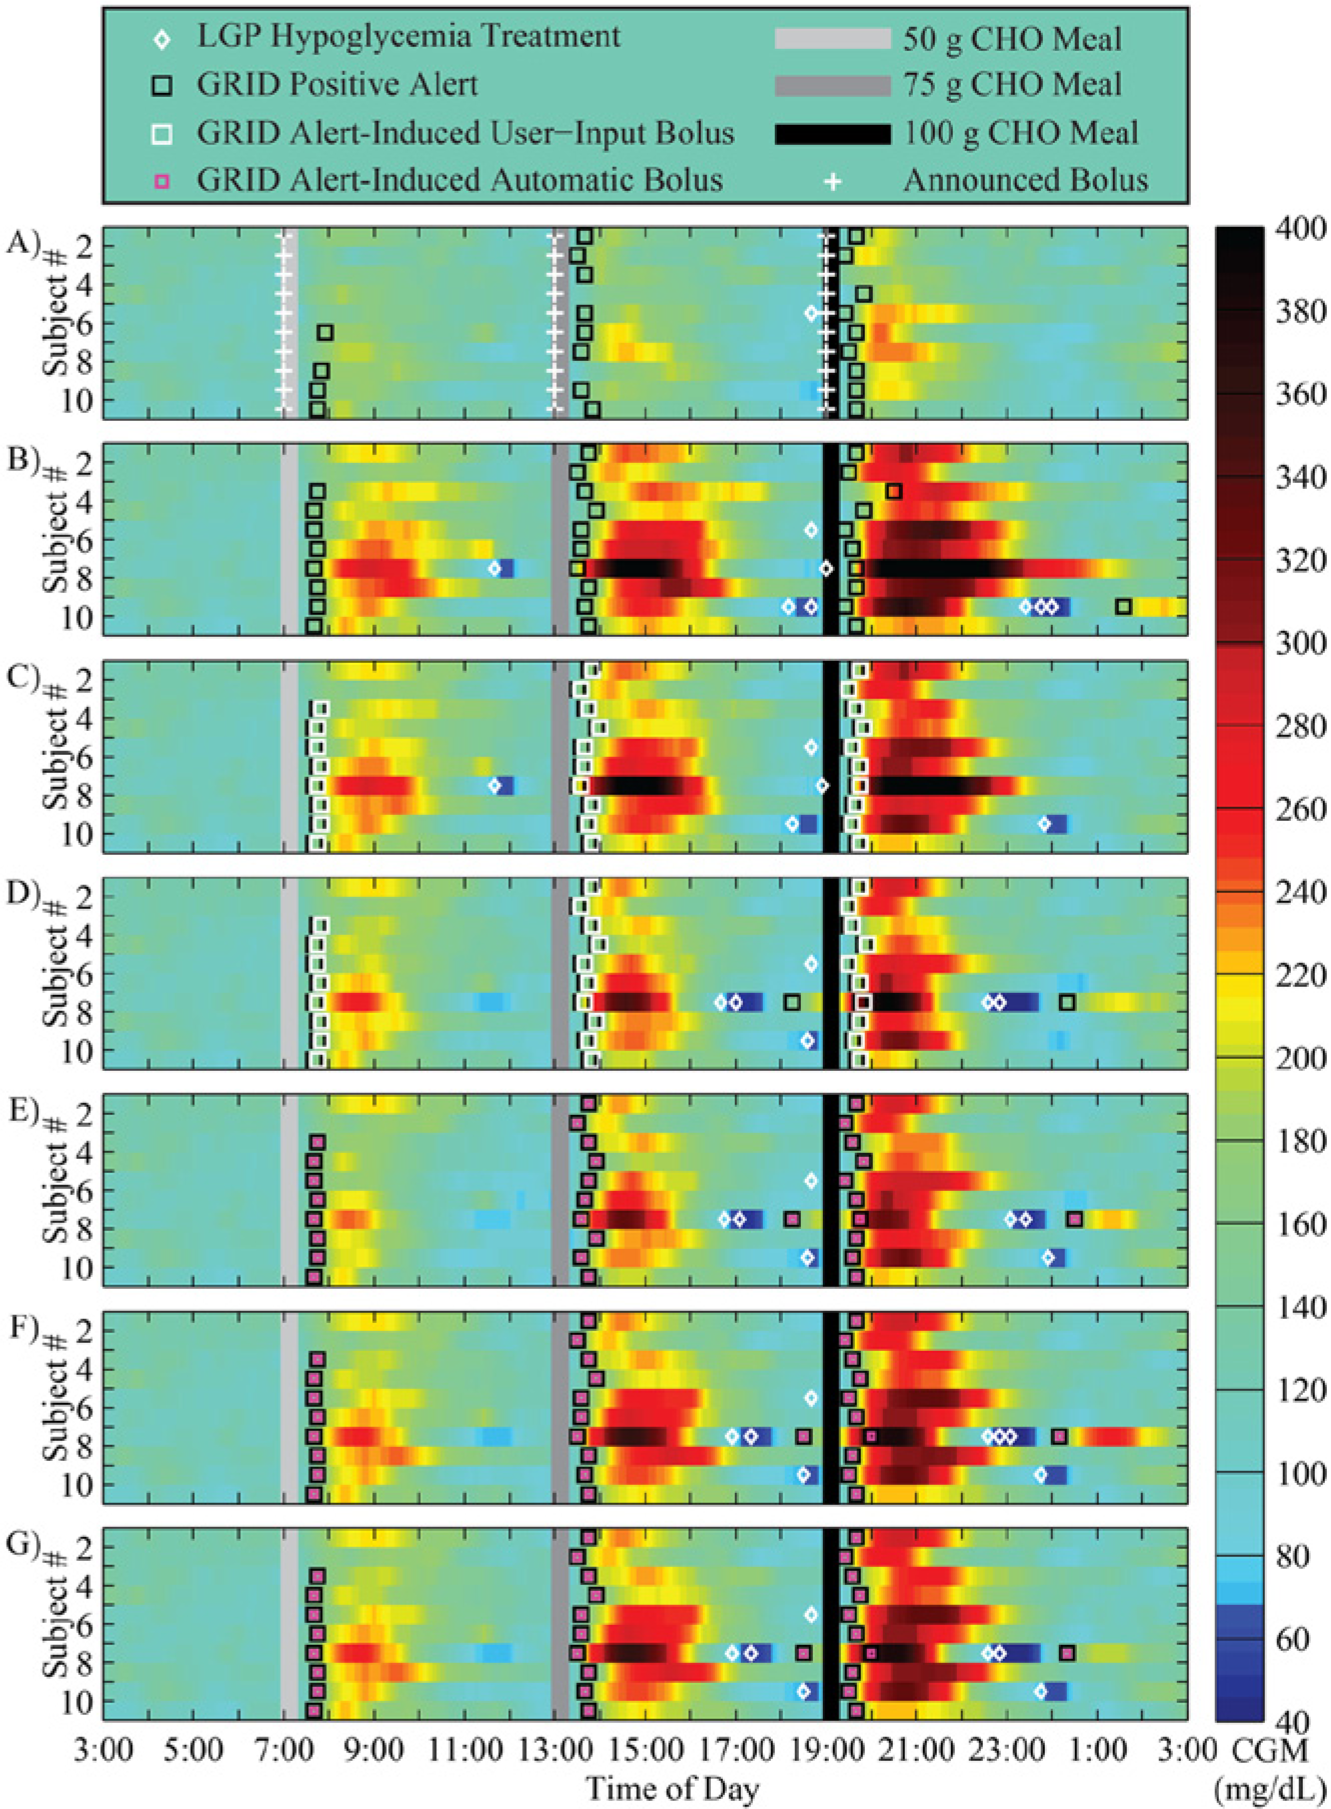
Results of a 24-hour in silico study of 10 adult subjects using the UVA/Padova simulator with 50, 75, and 100 g CHO meals at 7:00, 13:00, and 19:00, respectively, all using zone-MPC and unannounced meals with active GRID with RHC in C-G. (A) Announced meals using Zone-MPC; (B) unannounced meals; (C) User-Input mode, delivering a 50% bolus for the most recent meal plus, 5 minutes after detection; (D) protocol C with a 100% bolus; (E) Automatic Mode, immediately delivering a bolus for a 75 g CHO; (F) Automatic Mode, immediately delivering a bolus to correct the current level to 80 mg/dL; and (G) minimum of methods used in (E) and (F). Announced boluses are shown in white crosses, Automatic Mode delivery in magenta squares, and User-Input Mode delivery in white squares. Meals are shown in gray and black bars, LGP-alarm rescue carbohydrates in white diamonds, and GRID positive alerts in black squares.
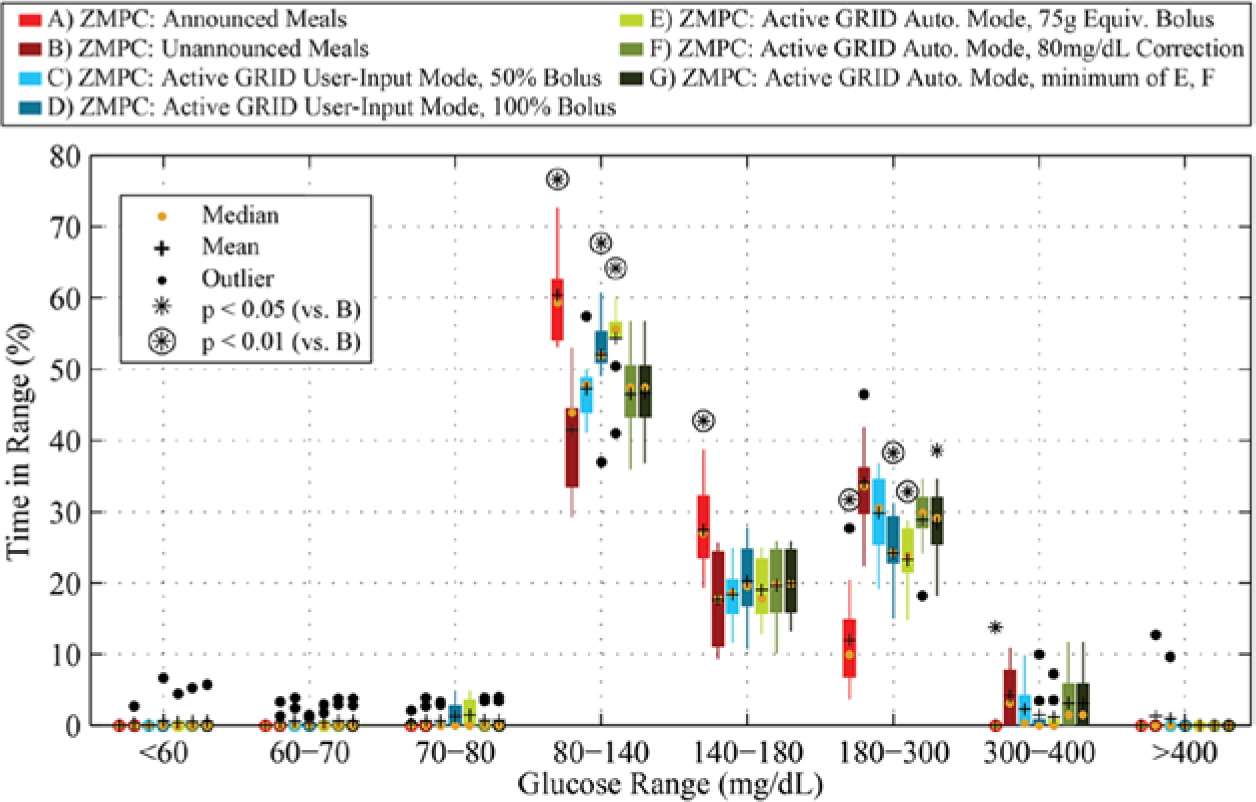
Time in range results of a 24-hour in silico study of 10 adult subjects using the UVA/Padova simulator with 50, 75, and 100 g CHO meals at 7:00, 13:00, and 19:00, respectively. Scenarios A-G correspond to A-G in Figure 7 and Table 3 in red, dark red, light blue, blue, light green, green, and dark green, respectively (from left to right in each grouping). Means are shown in black crosses, and medians in orange dots. Protocols that have statistically significantly different results from the unannounced (B) protocol (paired t test, P < .05 and P < .01) are shown above the boxes with asterisks and circled asterisks, respectively.
Characteristics of an In Silico Study of 10 Adult Subjects Using the UVa/Padova Simulator.
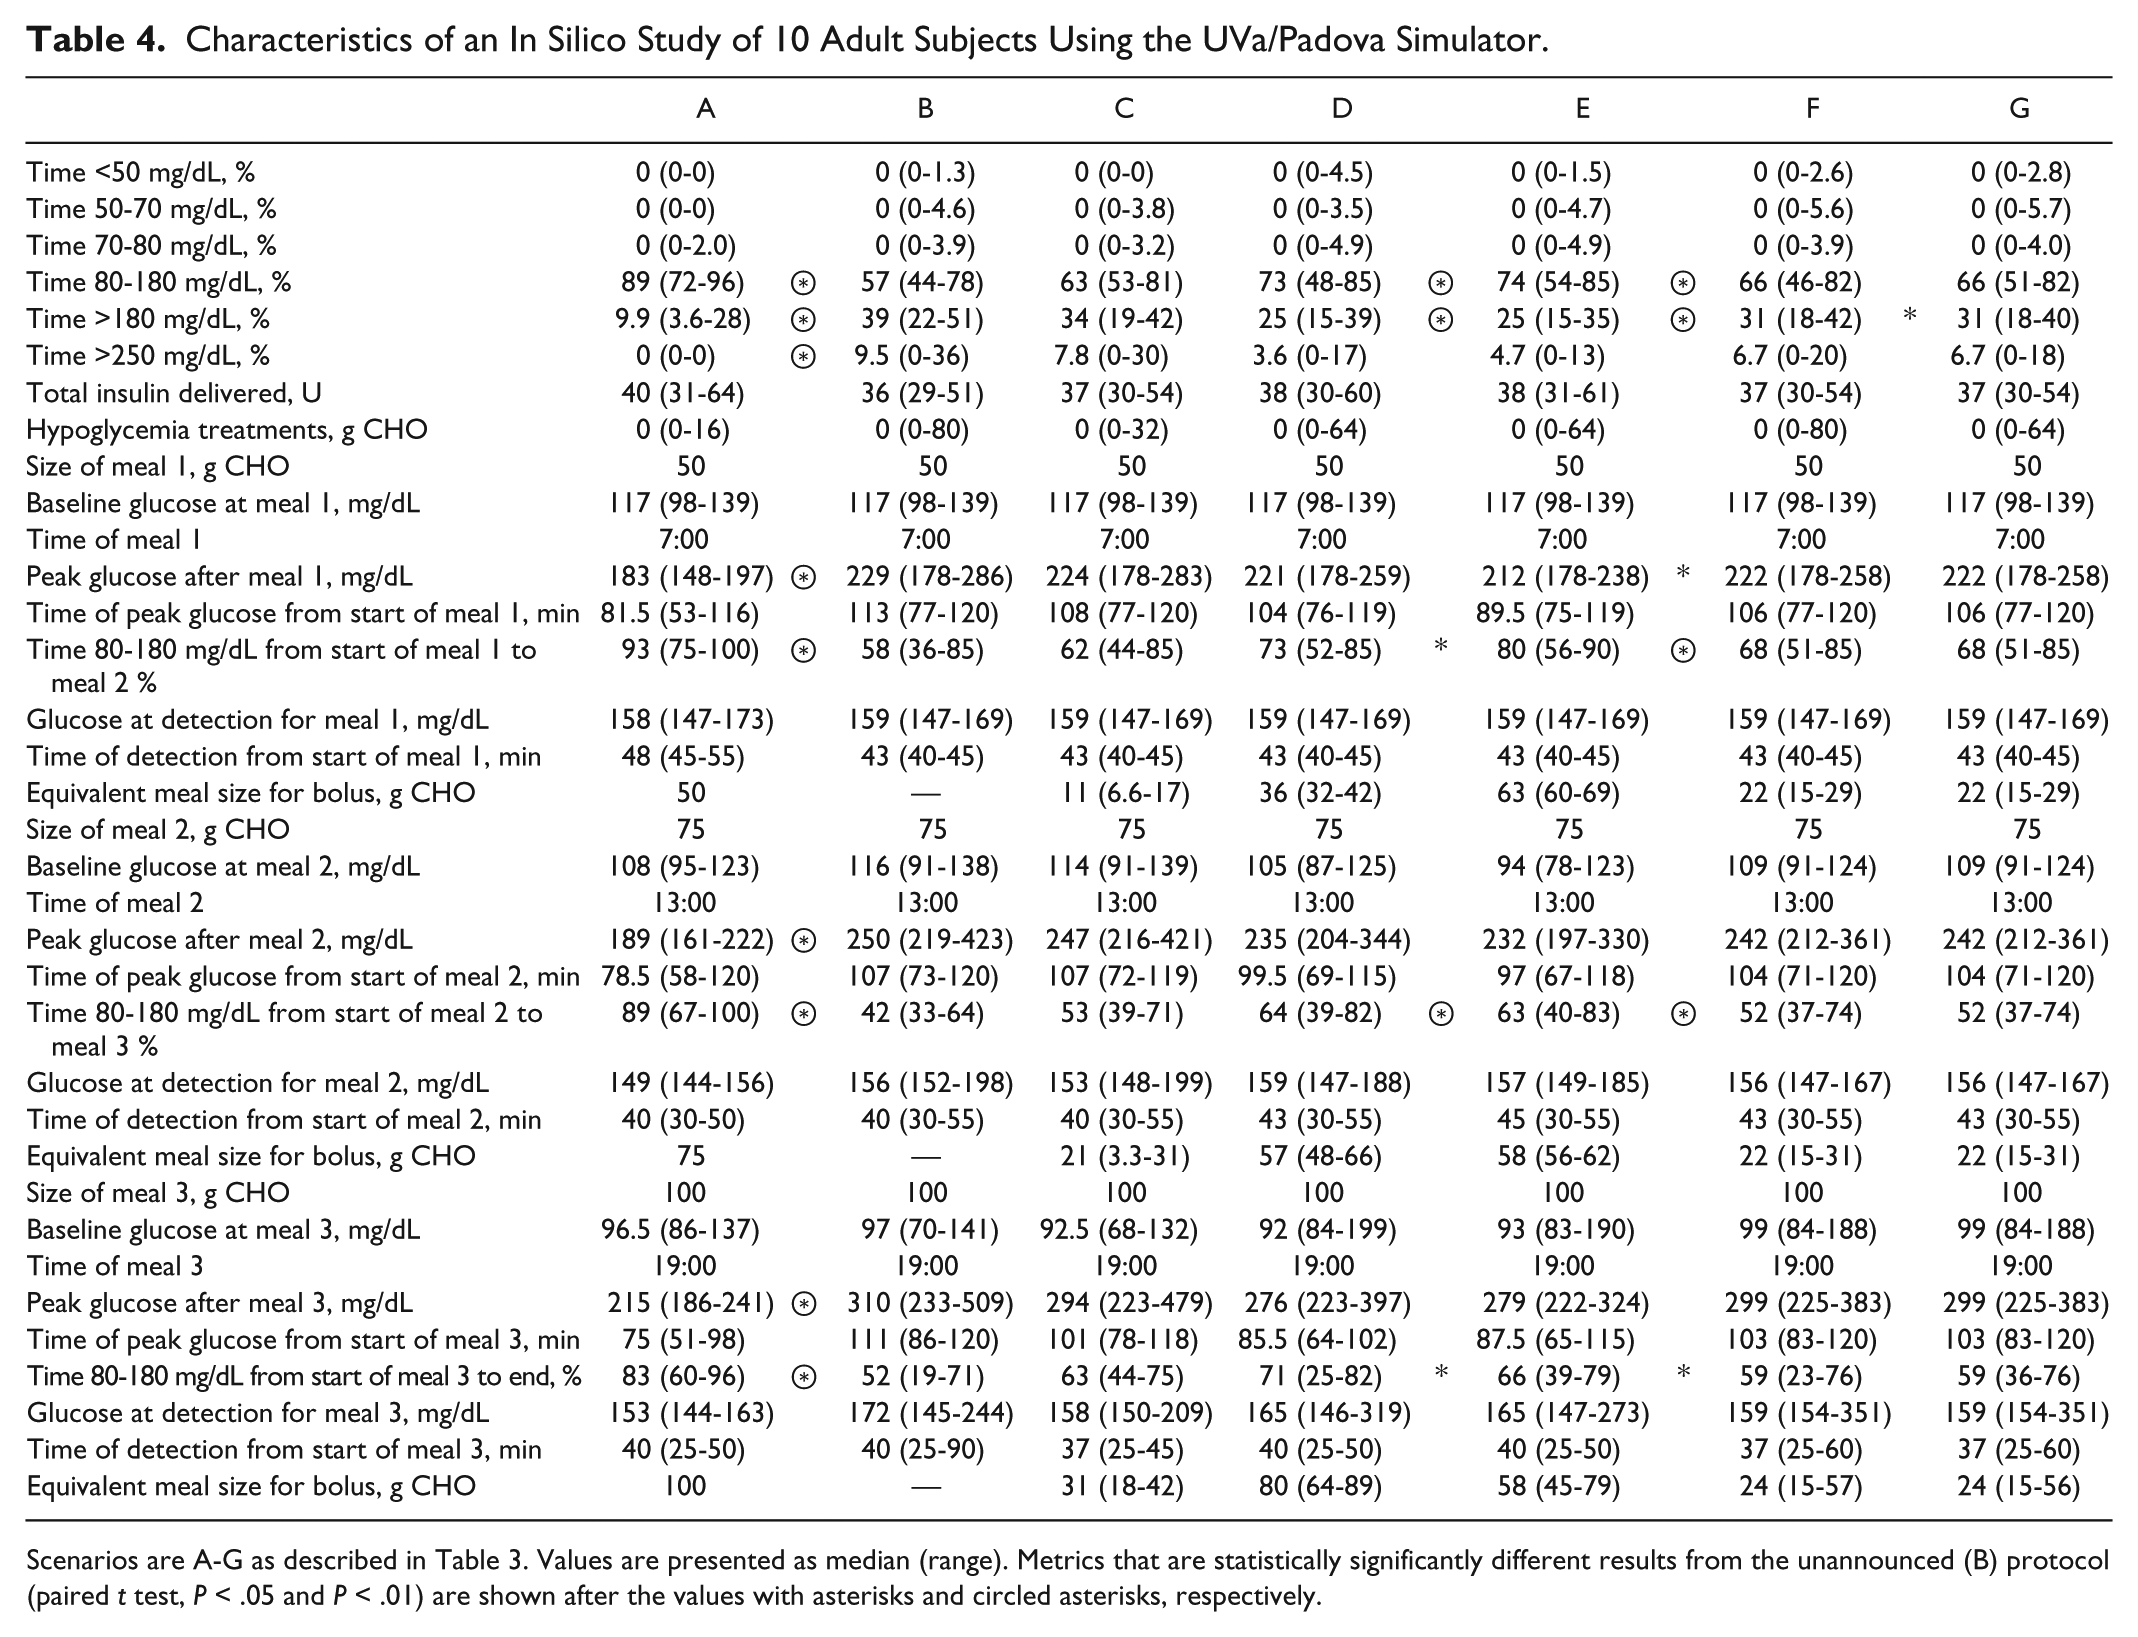
Scenarios are A-G as described in Table 3. Values are presented as median (range). Metrics that are statistically significantly different results from the unannounced (B) protocol (paired t test, P < .05 and P < .01) are shown after the values with asterisks and circled asterisks, respectively.
Conclusions
The GRID module of the HMS was designed to accurately and quickly identify meal glucose excursions and logically recommend an insulin bolus to reject the meal disturbance. The algorithm was tuned using noisy clinical trial data with unannounced meals and several snacks, and the same controller used in the simulations. It should be noted that, while tuning for speed of detection was the first priority, any algorithms that produced more than 2.0 false positive detections per day were excluded. Even with those algorithms included, the fastest detection time would have been 35 minutes for KF or GRID. Thus, with controlled data and medium-sized meals, a 30-plus-minute delay for meal detection based on CGM data is the limit of detection speed.
The GRID is designed as a parallel module to the controller that focuses on meal detection, to trigger a rejection of the meal disturbance. This approach provides a more bolus-like meal response by the controller, and the IOB constraint keeps overdelivery from occurring, essentially front-loading the insulin for the meal response without need for outside input. With the knowledge that the meal detection is delayed by at least 30 minutes, the disturbance rejection action was logically modified by the RHC function, which reduced the recommended bolus by recent delivery and adjusted for recent glucose history.
During closed-loop control, the GRID was able to improve control in the presence of large meals, without increasing the instances of hypoglycemia or increasing the time in the hypoglycemia range (<70 mg/dL), as seen in Figure 7, Figure 8, and Table 4. In addition, fast recognition of missed meal boluses in open-loop mode, for users on standard therapy can greatly improve the time in range and serve as a safety alert for users of the currently available devices.
A robustness study of the GRID with more complex meal scenarios and insulin and meal inaccuracies will be performed in the future to evaluate the GRID system further, but is outside of the scope of the current article. In addition, the HMS will be designed and evaluated using behavioral outcome measures to improve the system and ensure that the users trust and have improved lives due to the use of the HMS.
Footnotes
Abbreviations
AP, artificial pancreas; APS, Artificial Pancreas System; CGM, continuous glucose monitor; CHO, carbohydrates; FDA, Food and Drug Administration; GRID, Glucose Rate Increase Detector; HMS, Health Monitoring System; IOB, insulin on board; KF, Kalman filter; LGP, Low Glucose Predictor; NIH, National Institutes of Health; ROC, rate of change; T1DM, type 1 diabetes mellitus; zone-MPC, zone–Model Predictive Control
Declaration of Conflicting Interests
The author(s) declared no potential conflicts of interest with respect to the research, authorship, and/or publication of this article.
Funding
The author(s) disclosed receipt of the following financial support for the research, authorship, and/or publication of this article: We acknowledge the National Institutes of Health (grants DK085628 and DP3DK094331) for their financial support. RAH received financial support from the Eugene Cota-Robles Fellowship and the Air Products and Chemicals Discovery Fellowship. Product support was received from Roche Diagnostics Corporation, Dexcom Inc, the Investigator-Initiated Study Program of LifeScan, Inc, and Animas Corporation.