
Abstract
Background:
Fear of exercise related hypoglycemia is a major reason why people with type 1 diabetes (T1D) do not exercise. There is no validated prediction algorithm that can predict hypoglycemia at the start of aerobic exercise.
Methods:
We have developed and evaluated two separate algorithms to predict hypoglycemia at the start of exercise. Model 1 is a decision tree and model 2 is a random forest model. Both models were trained using a meta-data set based on 154 observations of in-clinic aerobic exercise in 43 adults with T1D from 3 different studies that included participants using sensor augmented pump therapy, automated insulin delivery therapy, and automated insulin and glucagon therapy. Both models were validated using an entirely new validation data set with 90 exercise observations collected from 12 new adults with T1D.
Results:
Model 1 identified two critical features predictive of hypoglycemia during exercise: heart rate and glucose at the start of exercise. If heart rate was greater than 121 bpm during the first 5 min of exercise and glucose at the start of exercise was less than 182 mg/dL, it predicted hypoglycemia with 79.55% accuracy. Model 2 achieved a higher accuracy of 86.7% using additional features and higher complexity.
Conclusions:
Models presented here can assist people with T1D to avoid exercise related hypoglycemia. The simple model 1 heuristic can be easily remembered (the 180/120 rule) and model 2 is more complex requiring computational resources, making it suitable for automated artificial pancreas or decision support systems.
American Diabetes Association guidelines strongly recommend physical activity to individuals with type 1 diabetes (T1D). 1 Regular physical activity in these individuals is associated with increased cardiorespiratory fitness 2 leading to improved blood lipid profiles 3 and reduction in long-term cardiovascular disease risk. 4 During physical activity, individuals with T1D have an increased peripheral insulin sensitivity due to the upregulation of the expression of glucose transporter type 45-7 and an impaired counterregulatory hormonal response 8 creating an imbalance of hepatic glucose production and glucose utilization often resulting in exercise-induced hypoglycemia. 9 The increased likelihood and fear of hypoglycemia during exercise and for many hours afterward10-12 discourages a majority of people with T1D from engaging in regular physical activity. In individuals with T1D, early hypoglycemic symptoms tend to be masked during physical activity, resulting in a higher risk of severe hypoglycemia. 6
A recent consensus statement 9 provides guidelines and recommendations on adjusting insulin and consuming carbohydrates prior to exercise to avoid hypoglycemia. However, many people with T1D may have difficulty following these recommendations and there is currently a large number of people with T1D who report problems with exercise-induced hypoglycemia. 13 Many people with T1D have difficulty understanding the complex interplay between insulin kinetics and dynamics and exercise intensity. This challenging situation has many people with T1D consuming additional carbohydrates either before or during exercise, which can result in worse glucose control.13-15
There are multiple options for people with T1D to manage their glucose. These therapies can be broadly divided into two categories, open loop and closed loop therapies. Open loop therapies require the person with T1D to measure their glucose either through finger-stick measurements or through continuous glucose monitoring (CGM) and then dose insulin themselves. Many people with T1D use multiple daily injection (MDI) therapy to control their glucose levels. 16 Approximately 40% of people with T1D use insulin pumps that deliver a basal insulin rate throughout the day while enabling a meal bolus delivery at meal times. 16 Closed-loop systems that automate the delivery of insulin have recently become commercially available to help people with T1D better manage their glucose. 17 These so-called artificial pancreas (AP) systems are composed of a CGM, an insulin pump and a control algorithm that automates the delivery of insulin in response to the sensed glucose. 18 Glucagon can also be included as an additional hormone to help avoid hypoglycemia.19,20
More recently, various research groups including our group have reported success at integrating physical activity into the AP.21-24 With the advent of accurate, wearable physical activity sensors, 25 incorporating activity data from accelerometers and heart rate data have enabled detection of physical activity and incorporation of exercise metrics into AP systems to better enable the avoidance of exercise-induced hypoglycemia.21-24,26,27 Once exercise is detected, an AP system can reduce or shut-off insulin.23,24 The system can also recommend consumption of carbohydrates to avoid hypoglycemia during or after exercise.26,28 And the system can suggest increased glucagon dosing in the case of dual-hormone therapy. 21 AP systems have been shown to reduce time in hypoglycemia, but they have not been effective at preventing hypoglycemia altogether. Even completely shutting insulin off at the time of exercise can still result in exercise-induced hypoglycemia.29-31 In this article, we present two new prediction algorithms with different levels of complexity to identify the risk of hypoglycemia at the start of exercise.
Methods
Participants
Data were compiled from 3 separate randomized clinical studies conducted at Oregon Health & Science University (Portland, OR) including 244 exercise observations involving 55 adults with T1D (22 men, 33 women; weight: 76 ± 15 kg; age: 33 ± 6 years). Of these 55 adults, 43 were used for training the model and 12 were used for validation of the model. Demographic information is listed in Table 1. Each of these studies have been registered on clinicaltrials.gov: study 1: NCT02241889, study 2: NCT02687893, and study 3: NCT02862730.
Clinical and Demographic Characteristics of the Study Participants (n = 55).
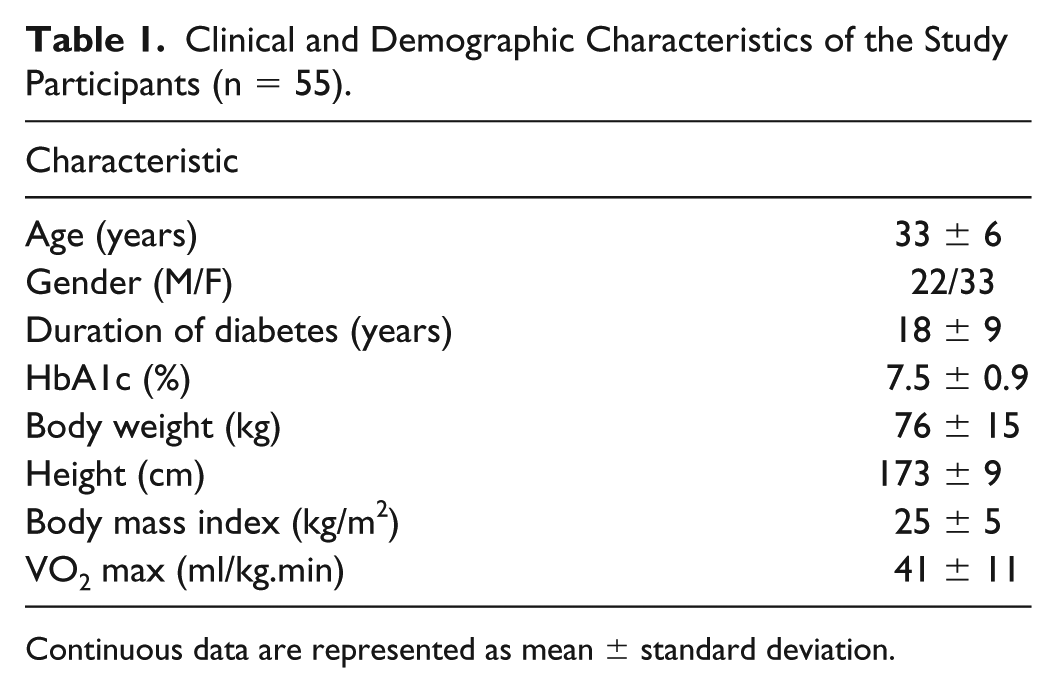
Continuous data are represented as mean ± standard deviation.
Data Collection Protocols
Study 1
In-clinic aerobic exercise data were collected as part of a randomized cross-over study to assess the efficacy of an automated dual-hormonal (insulin and glucagon) AP system to reduce exercise related hypoglycemia. 22 In this 3 arm crossover trial, 21 adults with T1D were randomly assigned to AP with exercise dosing adjustment, AP with no exercise dosing adjustment, and sensor-augmented pump (SAP) therapy. Participants performed mild to moderate exercise for 45 minutes at 60% of their maximum heart rate (30%-50% of VO2 max) on a treadmill, with no pre-exercise snack. A total of 63 exercise observations were used from this study.
Study 2
In-clinic aerobic exercise data were collected as part of a study designed to assess the impact of exercise on nocturnal hypoglycemia and on sleep in patients with T1D. 10 In this 3-week crossover trial, 10 adults with T1D were randomized to perform aerobic, resistance or no exercise. During each exercise week, participants completed two separate 45-minute exercise sessions. Participants managed their glucose levels using a BG meter and insulin pump therapy and performed moderate aerobic exercise for 45 minutes at 60% of their VO2 max at 4pm. Twenty aerobic exercise session observations were used from this study.
Study 3
In-clinic aerobic exercise data were collected as part of a study designed to assess the efficacy of a dual hormone AP with exercise detection compared against either single hormone AP with exercise detection, a predictive low glucose suspend system (PLGS) form of therapy or SAP therapy. 31 In this 4-arm crossover trial, 20 adults with T1D were randomly assigned to each of the study arms. Each study arm lasted 4 days, with 2 in-clinic exercise visits on the first and last day of the study. Participants performed moderate exercise for 45 minutes at 60% of their VO2 max on a treadmill. A total of 161 exercise session observations were used from this study.
In each study, if the measured capillary blood glucose value was <70 mg/dL, the participants were treated with 15-16 g of rapid carbohydrates. All treatments were based on a confirmation with a capillary blood glucose measurement; sensor glucose measurements can be less accurate during periods of rapid glycemic change.
Data Processing and Feature Extraction
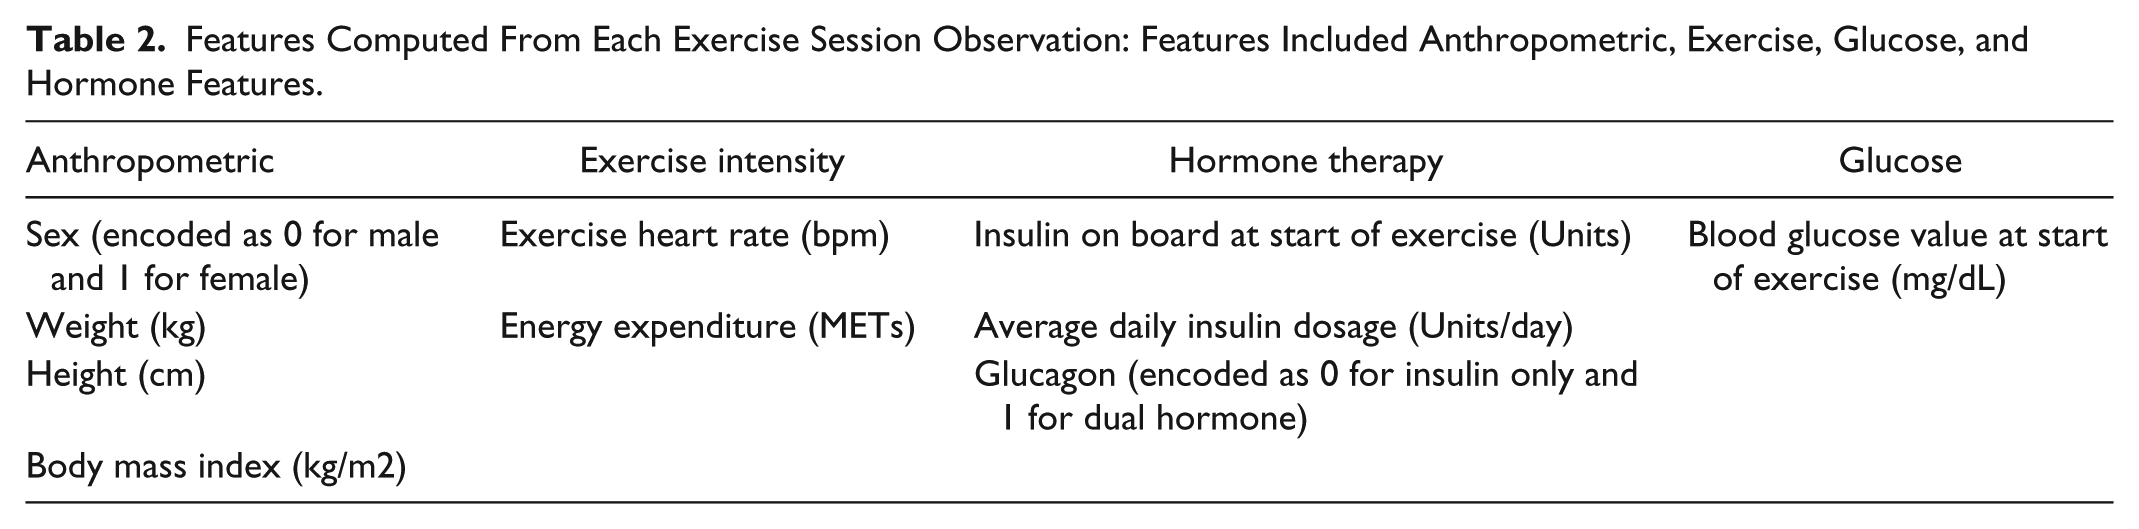
Features used to predict hypoglycemia (<70 mg/dL) during exercise (Table 2) were acquired at or before the start of exercise. Hypoglycemia was defined as the capillary blood glucose value measured during exercise or immediately after exercise <70 mg/dL. For this analysis we did not consider the cases where rescue carbs were given if the specified hypoglycemic conditions above were not met. The features included anthropometric data, physical activity, glucose data, and hormone data. The exercise features included a heart rate estimate and an estimation of metabolic energy expenditure (MET) during the first five minutes of exercise.19,20 Heart rate (bpm) was acquired using a Zephyr HR monitor also within the first 5 minutes of exercise from a wearable HR monitor. The insulin features used in the algorithm included the insulin on board at the start of exercise in units and the total daily insulin dosage (TDI) in units/day. Insulin on board is a weighted sum of past insulin boluses over the past 9 hour period, with an exponential decay as reported in Jacobs et al. 20 The glucose feature was the glucose at the start of exercise. In addition, there was a feature for whether glucagon was used within the therapy.
Features Computed From Each Exercise Session Observation: Features Included Anthropometric, Exercise, Glucose, and Hormone Features.
Training of the Predictive Models
We developed two predictive models: one decision tree classifier model and one random forest (RF) model. We undertook a supervised machine learning approach to learn the structure of the decision tree and the RF from the data.
A decision tree approach was chosen for model 1 because we wanted to develop an easy-to-remember heuristic for people to use when doing aerobic exercise and we could constrain the decision tree to utilize only a few predictive variables. Decision trees are popular in machine learning because of their visual representation of the model and because they can determine nonlinear relationships between the predictor variables.32,33 An implementation of CART 34 called rpart that is in the R environment was used to build the decision tree model. 35
Model 1 Data Set
Training of Model 1
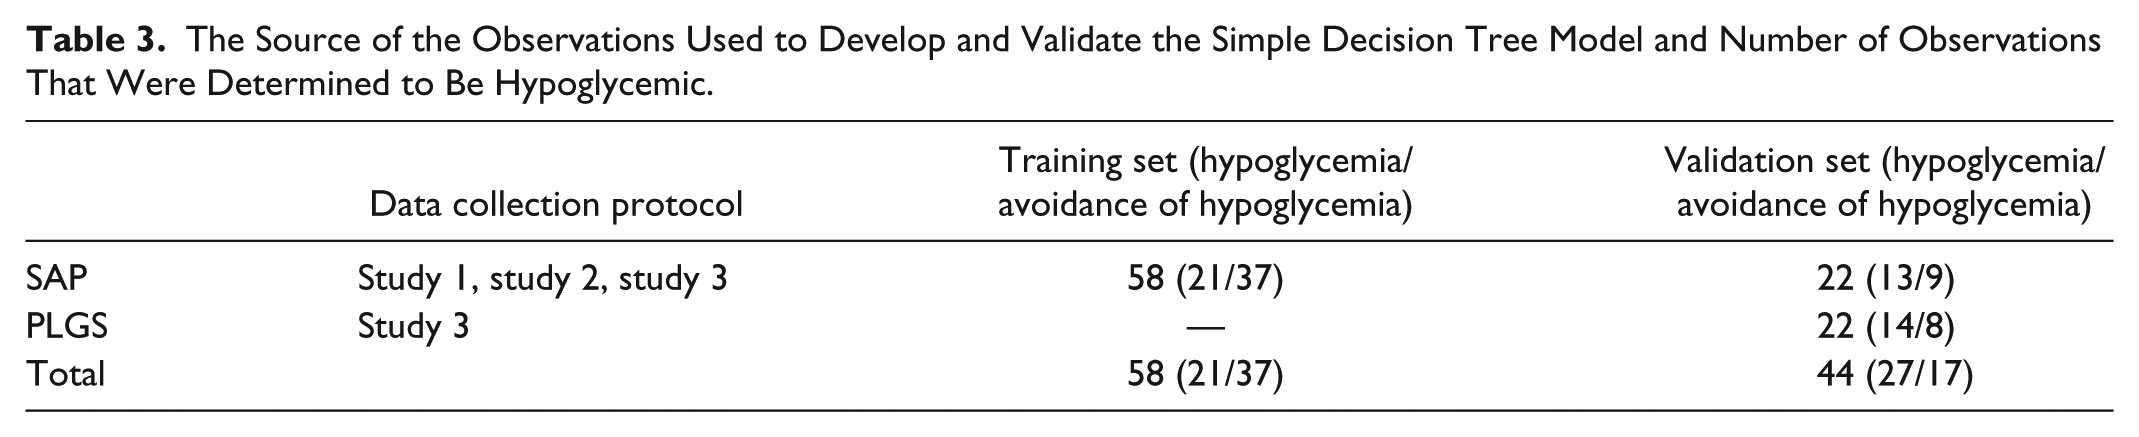
To train model 1, we used a subset of the aerobic exercise sessions that were collected from studies 1-3 when these individuals were administering their own care otherwise known as open loop care (OLC) or SAP. Table 3 shows a breakdown of the datasets used for training and validation of the model. A total of 58 exercise session observations were used to train this model. Ten different model structures were fit on a randomly selected set of 90% of the observations and tested on the remaining 10%. This 10-fold cross validation was conducted during the training phase. To minimize the complexity of the final tree, a grid search was performed while tuning the complexity measure (cp). The goodness of split in each tree was evaluated by an impurity function; here we used the Gini index and we evaluated each model using the misclassification error during the cross-validation step. The best model with the highest accuracy and with minimum complexity was selected from this process and then evaluated on the unseen validation data indicated in Table 3.
The Source of the Observations Used to Develop and Validate the Simple Decision Tree Model and Number of Observations That Were Determined to Be Hypoglycemic.
Model 2: Random Forest
An RF classifier is an ensemble of randomized decision trees. RF was used because it is capable of capturing nonlinear interactions between the input features and because it is an ensemble classifier making it more robust to noise than a single decision tree. The importance of each feature to the RF classifier was calculated by iteratively holding out each feature and calculating the change in accuracy of the resulting classifier. 36 Predictions generated by each tree in the forest were aggregated and the final model prediction (ie, hypoglycemia or not) was based on the majority vote across all trees. An implementation of this approach called the “randomForest” 37 and “caret”38,39 packages within the R environment were used to build this model and source code is available from the first author.
Model 2 Data Set
Training of Model 2 (RF)
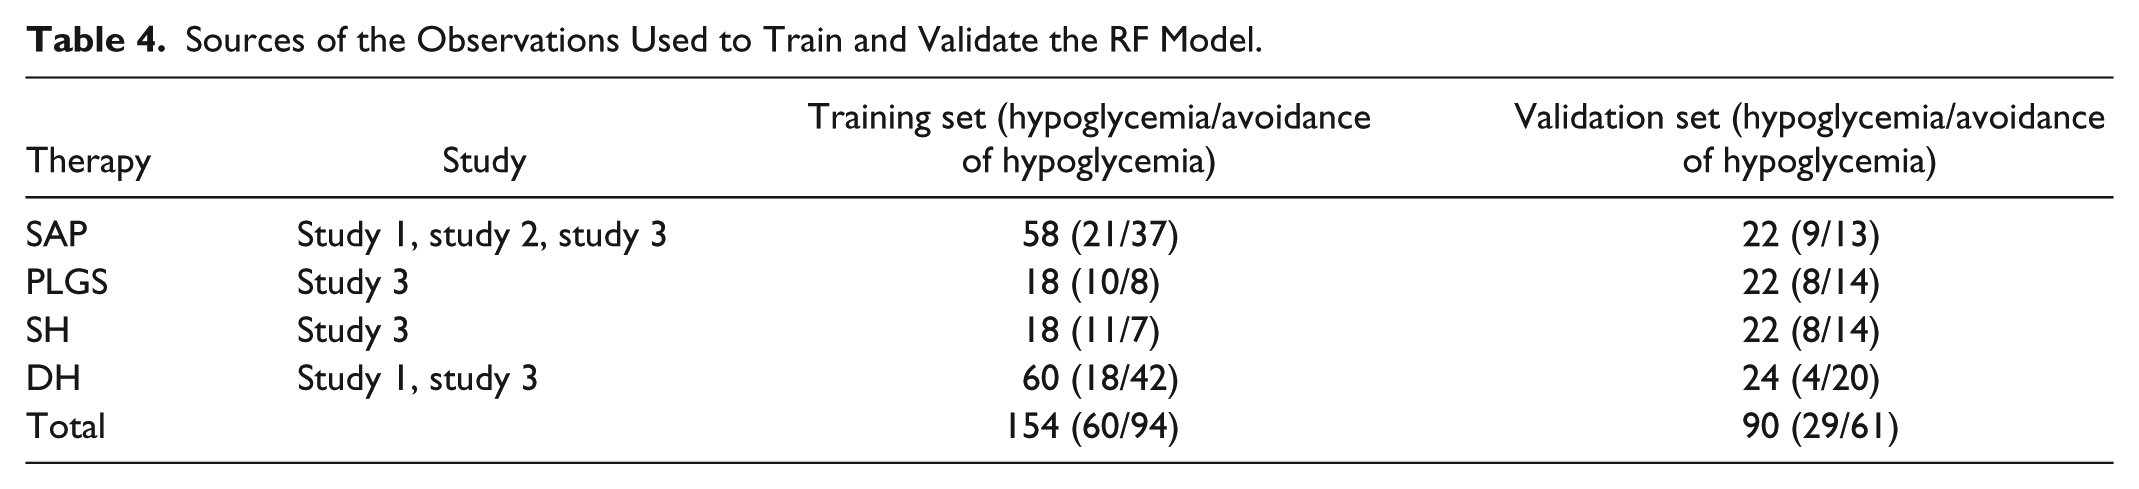
We used 154 exercise observations that were collected from studies 1-3 for the training set (Table 4). The RF Model was trained and tested using the 10-fold cross validation generating 10 different model structures. We evaluated each model using the misclassification rate on the hold out set also known as the out of bag error. The model structure with the highest accuracy was determined to be the best model. The complexity of the RF model is controlled by four hyper-parameters. These hyper-parameters are number of trees (ntree), number of variables included in each tree (mtry), depth of the tree (interactions between the independent variables), and row sample (number of samples used to train each tree). These four hyper-parameters were optimized using a grid search. We investigated ntree = 20, 25, 50, and 100; mtry from 2 up to the maximum number of variables in increments of 2; max depth = 2, 4, 6, 8, and 10; row sample of 30%, 50%, and 90%. The best RF model determined through grid search had the following hyper parameters: ntree = 25, mtry = 8, max depth = 6 and row sample fraction of 0.90 (90% of the data points were used to train each tree). This best RF model was then validated using the 90 unseen validation data set exercise observations described in Table 4.
Sources of the Observations Used to Train and Validate the RF Model.
Statistical Analysis
The performance of the models was assessed using the prediction accuracy, area under the receiver operating curve (AUC), sensitivity, specificity, positive predictive value (PPV), and negative predictive value (NPV). PPV represents the probability of hypoglycemia when the model output is predicted to be hypoglycemia while NPV is the probability of not having a hypoglycemic episode when avoidance of hypoglycemia is predicted by the model. All statistical analyses, including the preprocessing to compute the inputs and specific implementation of the statistical learning methods, were performed using R-software (www.r-project.org). 40 Models were trained, tuned, cross-validated and validated using the “party,” 41 “randomForest,” 37 and “caret”38,39 packages within R. This software is available from the first author upon request.
Results
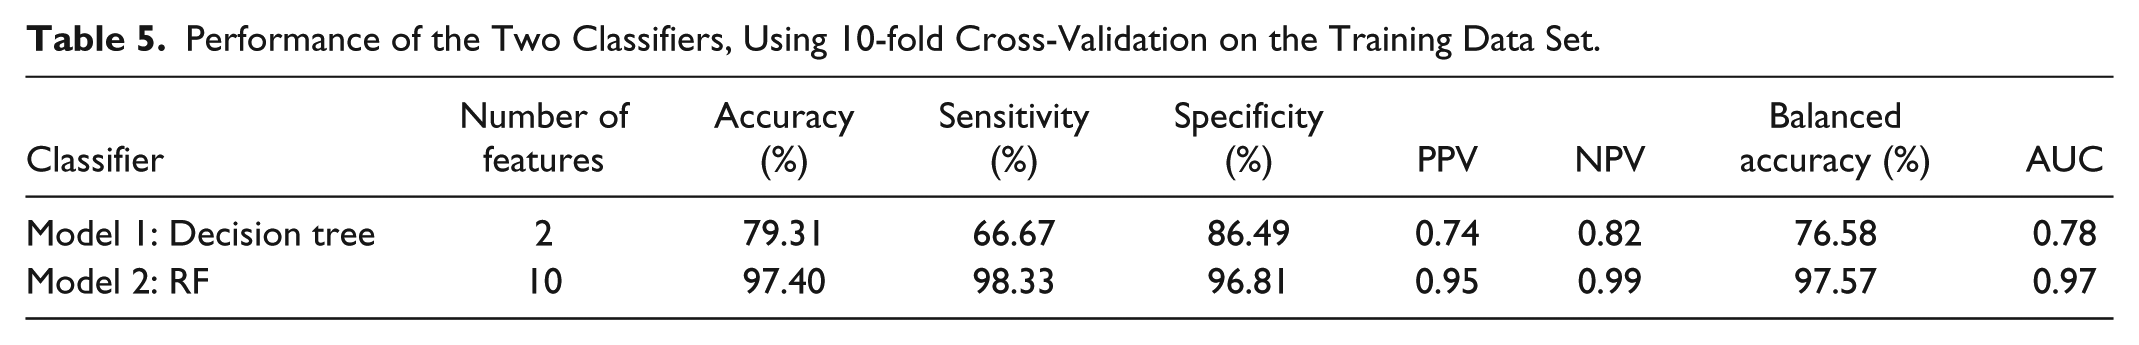
The RF model (model 2) performs better than the decision tree (model 1) across all accuracy metrics (Table 5). The structure of model 1 is shown in Figure 1. Figure 2 shows the 4 most important features for model 2 and how the features differ between hypoglycemia and non-hypoglycemia exercise events.
Performance of the Two Classifiers, Using 10-fold Cross-Validation on the Training Data Set.
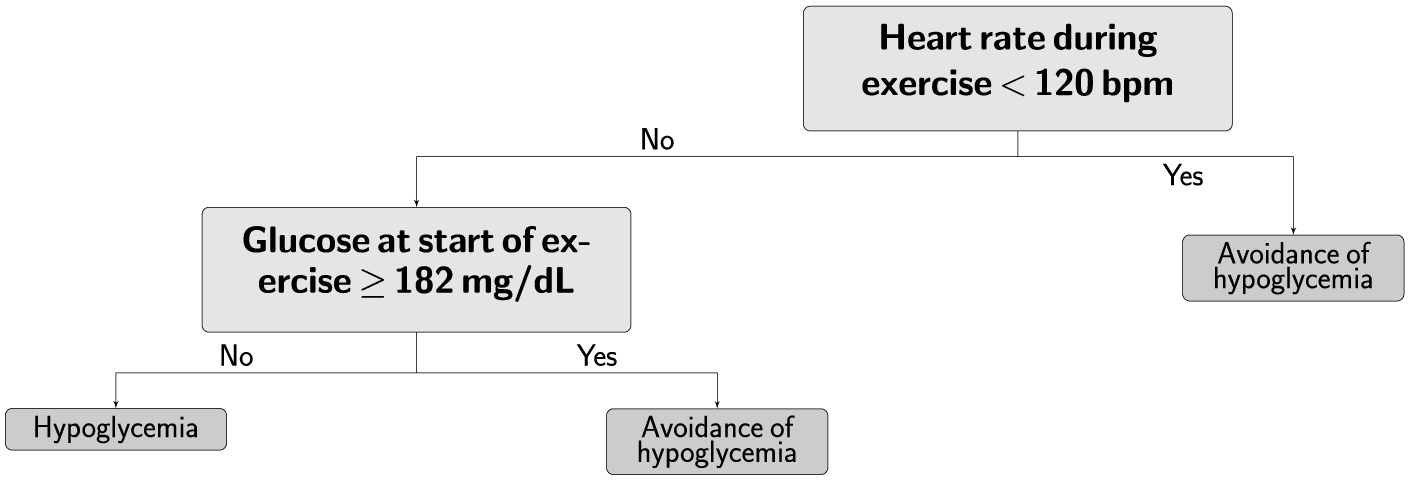
Simple decision tree with only two features. This easy-to-remember heuristic (the 180/120 rule) may be used by individuals with type 1 diabetes in conjunction with current aerobic exercise recommendations to help avoid hypoglycemia under open loop therapy.
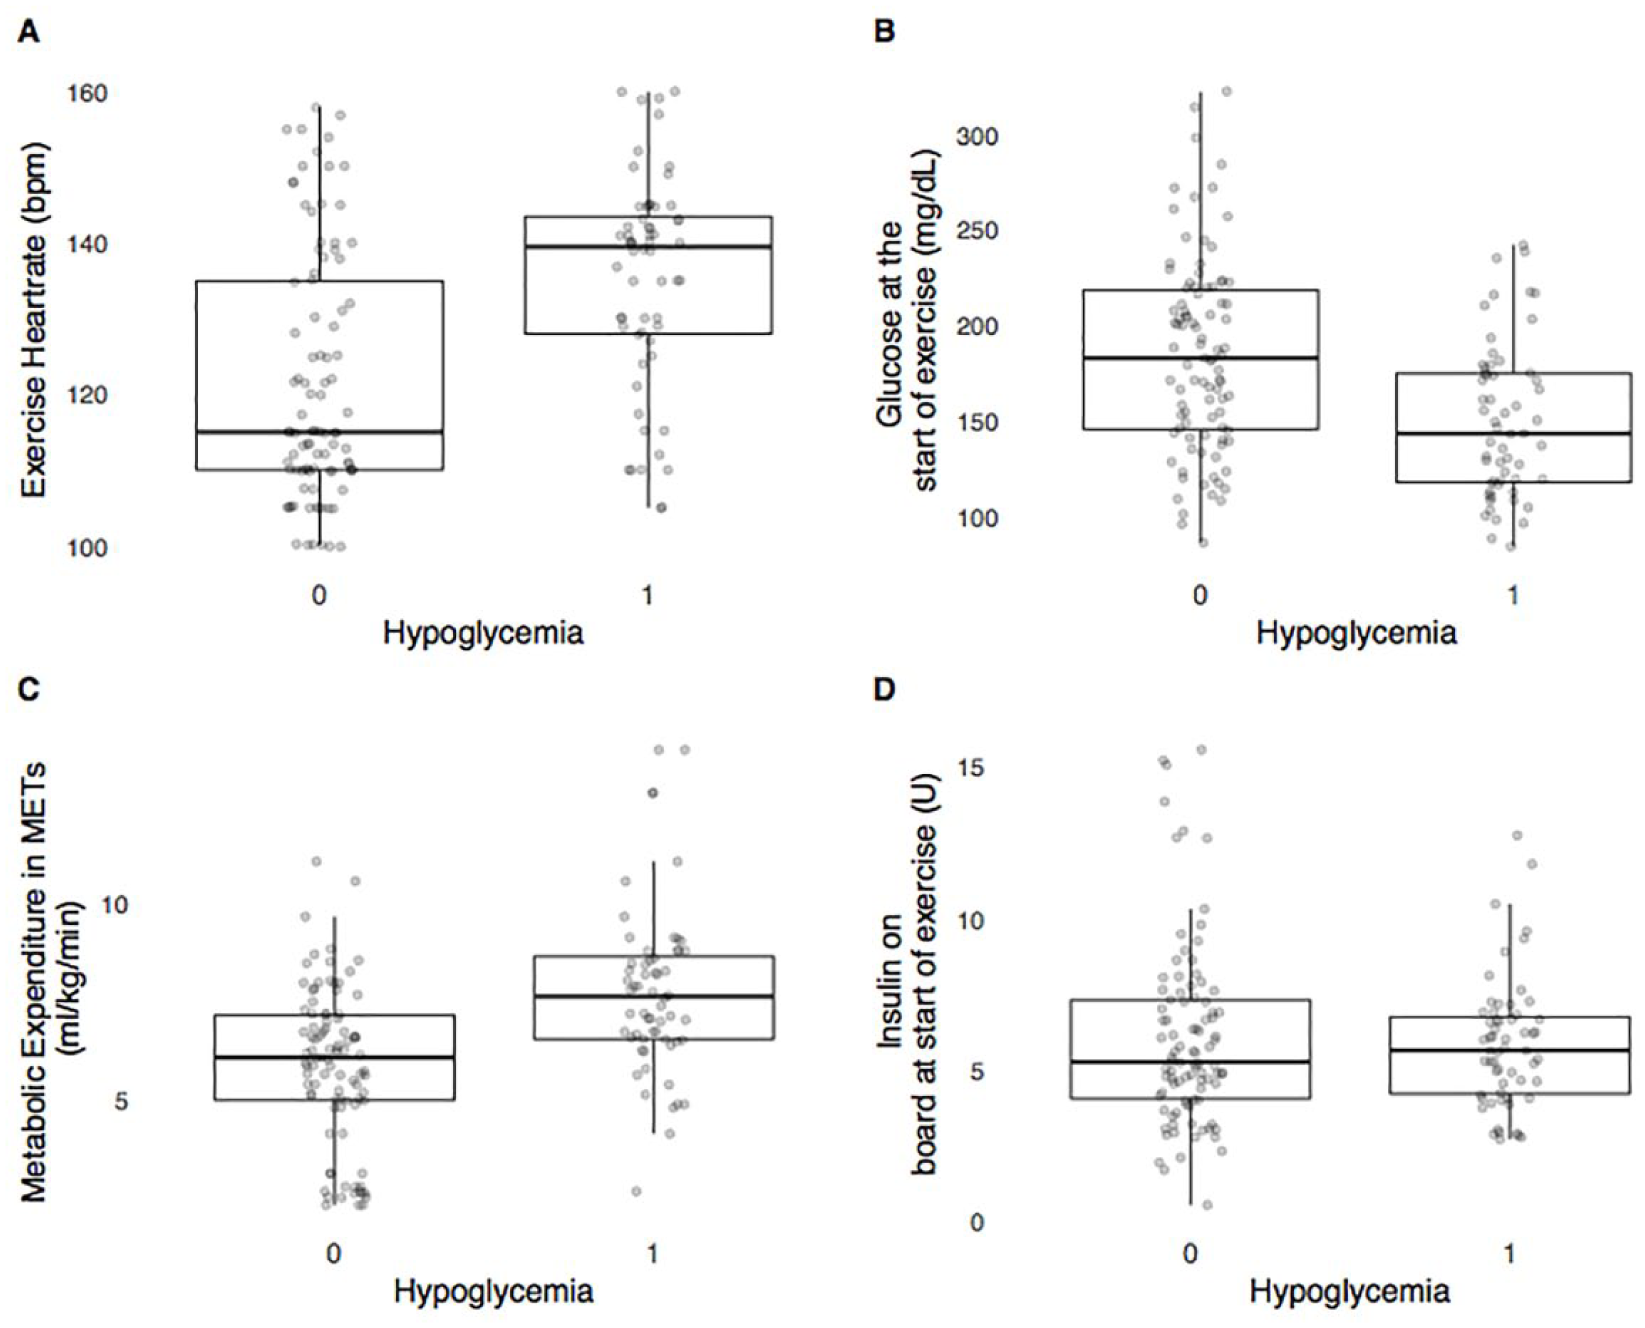
The most important features within the RF model are shown here. The x-axis shows the occurrence of hypoglycemia, with 0 indicating avoidance of hypoglycemia during the exercise session and 1 indicating hypoglycemia occurred during exercise session. (A) The relationship between exercise heart rate in beats per min and the observed hypoglycemia in the training set. Higher heart rate at start of exercise tends to increase likelihood of hypoglycemia. (B) The relationship between glucose at the start of exercise and the observed hypoglycemia in the training set. Lower glucose values at the start of exercise increases likelihood of hypoglycemia during the exercise bout. (C) The relationship between energy expenditure in METs and the observed hypoglycemia in the training set. Higher intensity of exercise, as measured by the increase in energy expenditure, increases likelihood of hypoglycemia. (D) The relationship between insulin on board at the start of exercise and the observed hypoglycemia in the training set.
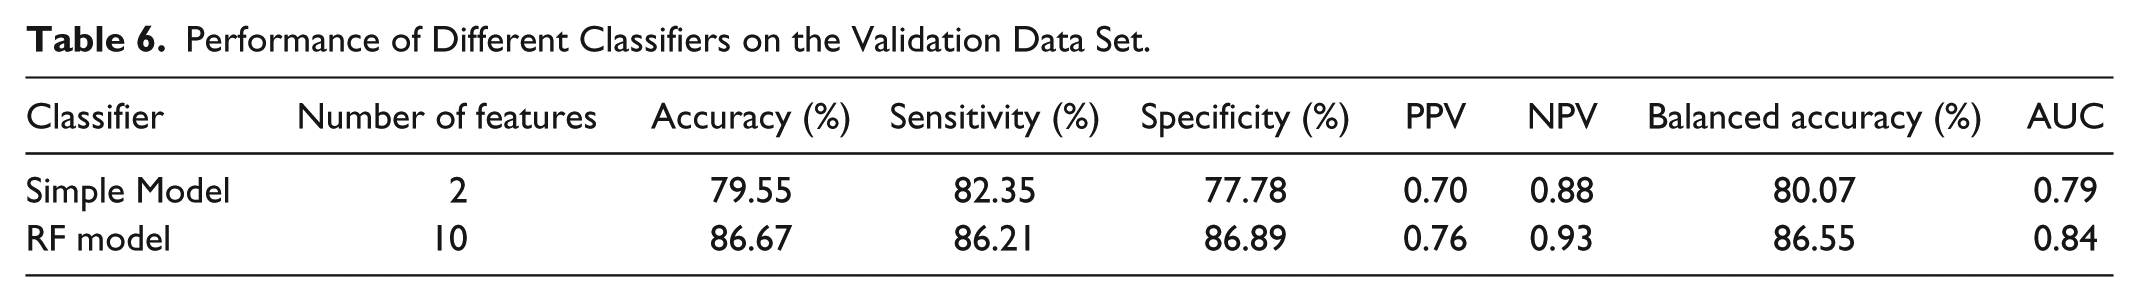
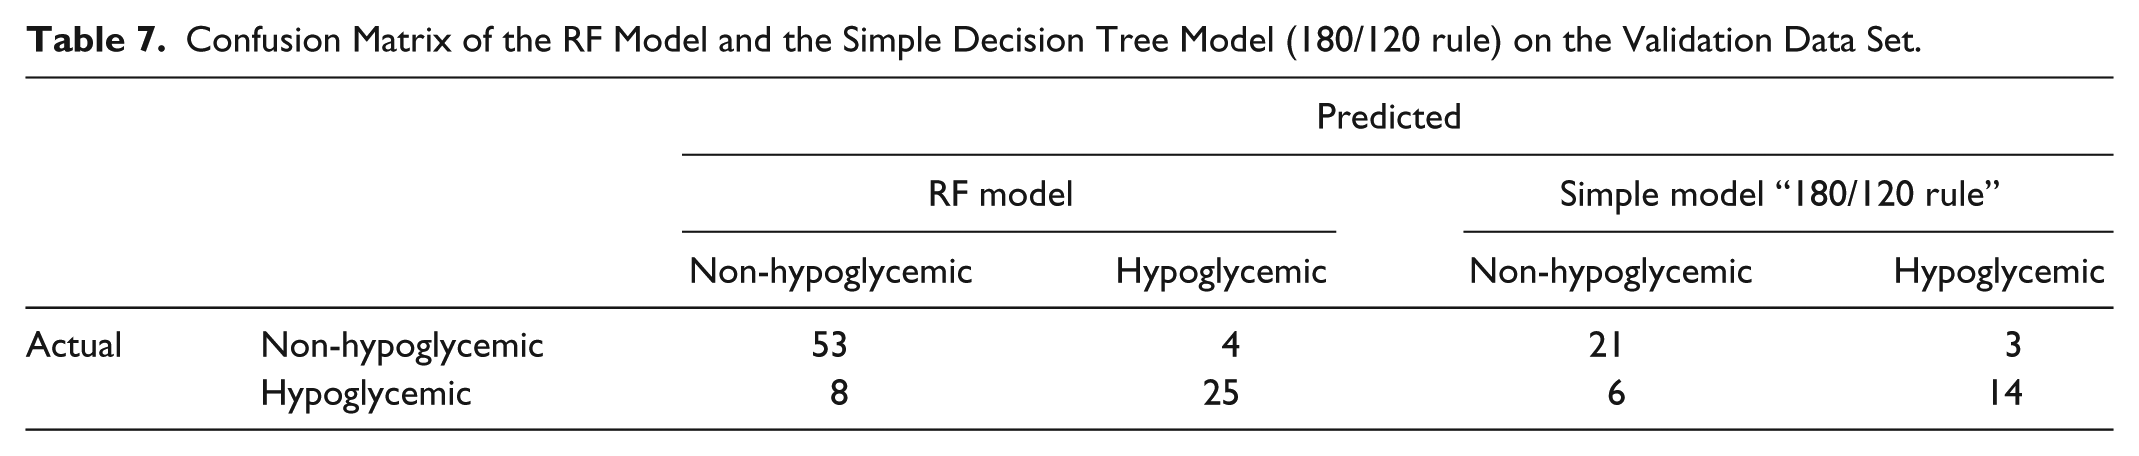
The prediction accuracy for each model on the validation data set is in Table 6. Model 1 has an accuracy of nearly 80% using only 2 features, while the more complex RF model achieved an accuracy of nearly 87% on the validation data set. The accuracy of both models is demonstrated in the confusion matrix given in Table 7. To demonstrate the improved performance of the RF model over a naïve classifier, a hypothesis test was conducted to test if the prediction accuracy of the RF model was greater than that of the rate of the largest class. In the validation set the number of non-hypoglycemic observations was 67.78% of the total observations. The RF model accurately classifies 86.67% of the total observations with the 95% CI between 77.87% and 92.92% (P < .0001).
Performance of Different Classifiers on the Validation Data Set.
Confusion Matrix of the RF Model and the Simple Decision Tree Model (180/120 rule) on the Validation Data Set.
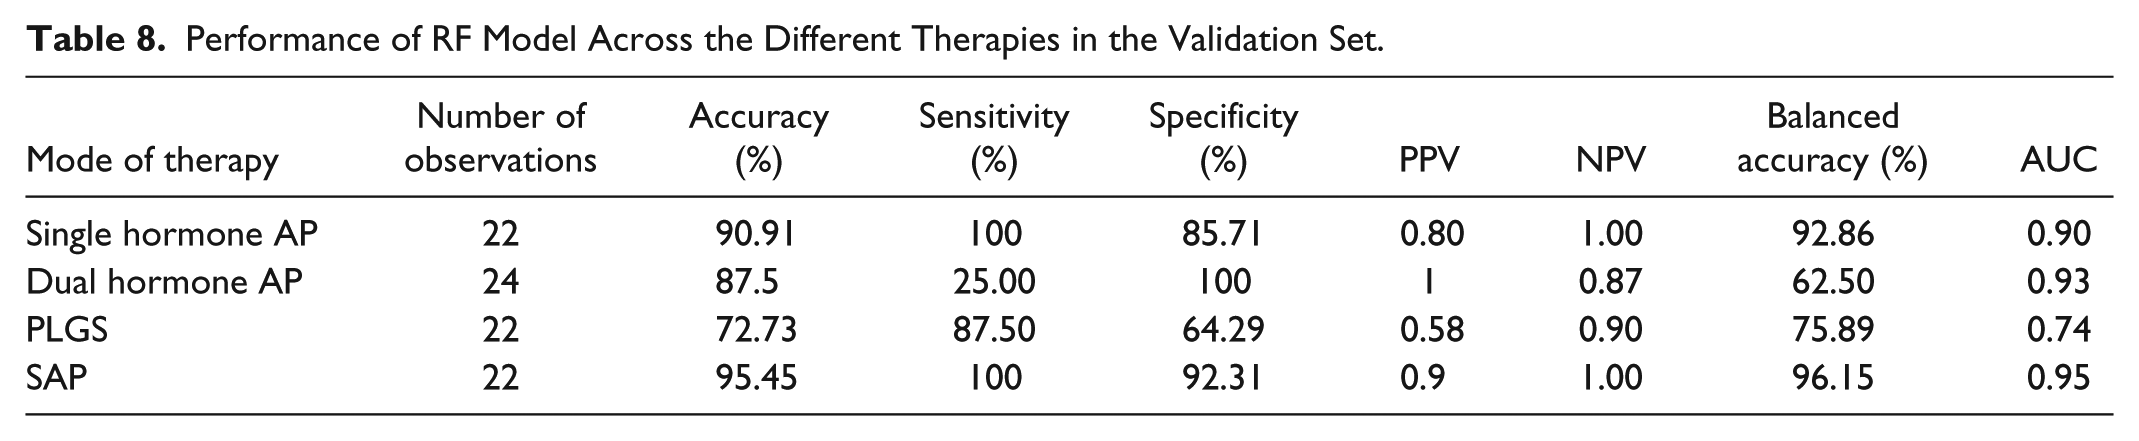
The classification accuracy was higher among the insulin only therapies when compared with the dual hormone therapy (Table 8). Hypoglycemia occurred less often during dual-hormone therapy, and so there were fewer hypoglycemia examples on which to train the classifier. This could partially explain the lower accuracy during dual-hormone therapy.
Performance of RF Model Across the Different Therapies in the Validation Set.
Discussion
The hypoglycemia prediction algorithms performed well across a large and diverse data set from people with T1D undergoing a variety of glycemic management therapies during exercise. The exercise events used for training and evaluation took place at different times throughout the day (morning, afternoon and late afternoon), under different pre-exercise carbohydrate ingestion scenarios (breakfast, lunch, and before dinner), and under early postprandial and late postprandial conditions. The performance of the models during training indicated that the time of day did not impact the accuracy of the models. We provide both a simple rule based decision tree model for individuals with T1D to use as a rule of thumb (the 180/120 rule) and also a more complex RF model that automated AP and decision support systems may use. As has recently been suggested in the exercise consensus statement, 9 only under cases of severe hypoglycemia (≤50 mg/dL) or hyperglycemia (>270 mg/dL) with ketone levels ≥1.5 mmol/L is exercise contraindicated. Figure 2 shows that exercise intensity, exercise heart rate and blood glucose at the start of exercise are the most important variables that can be used for the prediction of hypoglycemia. The anthropomorphic features are displayed in Supplemental Figure 1. We tried other features such as resting heart rate and heart rate reserve but the performance of the models did not improve with these additional features.
There have been other papers published describing criteria for recommending adjustments to insulin or carbohydrate consumption to prevent exercise-induced hypoglycemia.9,42 We evaluated these criteria on our data set to determine how accurate the criteria presented in these papers predicted hypoglycemia compared with the 180/120 rule. Riddell and colleagues 9 describe in a consensus statement that people with T1D are advised to consume approximately 10 g of carbohydrate if their glucose at the start of exercise is less than 124 mg/dL. 9 We evaluated the accuracy of this metric in predicting hypoglycemia on our validation data set in the OLC data set (Table 3 validation data set). We found that this guideline had an accuracy of 72% at predicting hypoglycemia. In other words, when we used the prediction rule that if glucose was less than 124 at the start of exercise, prediction of hypoglycemia had 72% accuracy. Model 1 presented in the current analysis also used a starting glucose criteria in the prediction algorithm but heart rate was also used. We have shown that incorporating heart rate into this decision-making process can increase accuracy of hypoglycemia prediction up to nearly 80%. DeBoer et al 42 recently showed that a HR measurement can be used to inform the dosing of an artificial pancreas. In this study they improved glycemic control in the hours after exercise but did not show improvement in preventing hypoglycemic events during exercise. Their control to range algorithm 42 predicts hypoglycemia if the predicted glucose value is less than 140 mg/dL over the next 30 minutes at the start of exercise. We evaluated the performance of this prediction algorithm on our validate data set (Table 4 validation set) by extrapolating the 15 min average change in glucose at the start of the exercise session over the next 30 minutes. We evaluated whether participants became hypoglycemic if their glucose was predicted to be below 140 mg/dL in the next 30 minutes. The accuracy of this approach was 69% on our data set. Using this predictive threshold approach, out of 90 total observations evaluated, there were 7 false negatives and 20 false positives. Turksoy et al 43 described a method for predicting hypoglycemia using a multivariable ARMAX model that included exercise metrics as an input. Their real-time prediction algorithm was able to achieve a sensitivity of 81.5% and a specificity of 65.7% while predicting 30 minutes in advance on 14 people with T1D under free-living conditions. In comparison, our RF algorithm achieved a sensitivity of 82% and a specificity of 78%. However, it’s difficult to compare the two algorithms as the test scenarios were quite different.
Our work had some limitations. All exercise sessions were conducted in a controlled inpatient environment; therefore, future trials in real-life settings will be needed to confirm our results. As our protocols only included adult participants between the ages of 21 to 45 years, the algorithms that we present here may only apply to individuals in this age group. To explore whether age was a factor in prediction of hypoglycemia for the 180/120 rule, we did further analysis on the data considering age as an additional predictor. Specifically, using all of the data from studies 1, 2, and 3, we trained a logistic regression model on three variables, heart rate, CGM at start of exercise, and age. We found that while heart rate and CGM at start of exercise were both significant predictors of hypoglycemia (P < .001 and P = .011, respectively), age was not a significant predictor (P was not significant). Supplemental Figure 2 further show that age did not significantly change how the HR and starting glucose predictor variables indicated hypoglycemia. While this does not account for the limitation that we only studied participants age 21-45, it does indicate that within this age group, age did not impact the accuracy of the 180/120 rule. An additional limitation was that all bouts of exercise were limited to aerobic exercise at intensities in the range of 30-60% of VO2 max and the duration of exercise was between 30 and 45 minutes. There are many variants of this type of exercise that can involve different durations and intensities outside of the ones that we used to train our algorithm and these may impact the accuracy of the algorithms presented. Exercising during fasting (eg, before breakfast) was not included as a data set to train the algorithms described here. Certainly more extensive real-world data sets are required to validate this rule and we are planning future studies to do this validation in real-world, free-living conditions. Data sets that include long- and short-duration exercise, resistance training, high-intensity interval training, and exercise sessions at different times of day and different insulin loading will be critical for validation of this rule. Another limitation is that the algorithm requires HR data 5 minutes into the start of the activity and if hypoglycemia is predicted, the individual will have to stop exercise and treat the predicted hypoglycemia. We are exploring how HR from prior exercise sessions can be used in place of the HR data from the current session. We have found that accuracy is reduced, but only by about 10%. Further testing is needed on bigger data sets to determine if prior exercise metrics can be used to achieve comparable accuracy as when using HR data from the first 5 minutes of exercise. While we trained the algorithms across different types of open and closed-loop therapies, we may be able to achieve higher accuracy if we train the algorithms on individual therapies. As shown in Table 8, the performance of the RF model is good across all forms of AP therapy; this could be further improved with a therapy specific model in the future.
Conclusion
In conclusion, the validated models shown here provide evidence that exercise-induced hypoglycemia can be accurately identified and possibly prevented in a majority of the cases. This work represents a promising step forward to encourage individuals with T1D to engage in PA with reduced fear of exercise-induced hypoglycemia.
Supplemental Material
Supplemental_Material – Supplemental material for Prediction of Hypoglycemia During Aerobic Exercise in Adults With Type 1 Diabetes
Supplemental material, Supplemental_Material for Prediction of Hypoglycemia During Aerobic Exercise in Adults With Type 1 Diabetes by Ravi Reddy, Navid Resalat, Leah M. Wilson, Jessica R. Castle, Joseph El Youssef and Peter G. Jacobs in Journal of Diabetes Science and Technology
Footnotes
Acknowledgements
We wish to thank Deborah Branigan (OHSU), Brian Senf (OHSU), Virginia Gabo (OHSU), Kathryn Hanavan, RN, MSN, ANP-C (OHSU), Sarah Soltman, MD (OHSU), and Elena Varlamov, MD (OHSU) for their assistance with conducting studies. We wish to thank Nicholas Preiser (OHSU) and Joseph Leitschuh (OHSU) for help developing the software tools used to collect the data and run the AP. We wish to thank Tomas Walker (Dexcom) and Vance Swanson (Tandem) for their support of the studies.
Abbreviations
AP, artificial pancreas; AUC, area under the curve; bpm, beats per minute; CGM, continuous glucose monitoring; MDI, multiple daily injection; MET, metabolic equivalent; NPV, negative predictive value; OLC, open loop care; PLGS, predictive low glucose suspend; PPV, positive predictive value; RF, random forest; SAP, sensor augmented pump; T1D, type 1 diabetes; TDI, total daily insulin dosage.
Declaration of Conflicting Interests
The author(s) declared the following potential conflicts of interest with respect to the research, authorship, and/or publication of this article: JRC and PGJ have a financial interest in Pacific Diabetes Technologies Inc, a company that may have a commercial interest in the results of this research and technology.
Funding
The author(s) disclosed receipt of the following financial support for the research, authorship, and/or publication of this article: This work was supported by grants from the National Institutes of Health (grant 1DP3DK101044) and by Oregon Clinical and Translational Research Institute UL1TR002369 from the National Center for Advancing Translational Sciences at the NIH.
Supplemental Material
Supplemental material for this article is available online.
References
Supplementary Material
Please find the following supplemental material available below.
For Open Access articles published under a Creative Commons License, all supplemental material carries the same license as the article it is associated with.
For non-Open Access articles published, all supplemental material carries a non-exclusive license, and permission requests for re-use of supplemental material or any part of supplemental material shall be sent directly to the copyright owner as specified in the copyright notice associated with the article.