
Abstract
Background:
There is currently no stable liquid form of glucagon commercially available. The aim of this study is to assess the speed of absorption and onset of action of G-Pump™ glucagon at 3 doses as compared to GlucaGen®, all delivered subcutaneously via an OmniPod®.
Methods:
Nineteen adult subjects with type 1 diabetes participated in this Phase 2, randomized, double-blind, cross-over, pharmacokinetic/pharmacodynamic study. Subjects were given 0.3, 1.2, and 2.0 µg/kg each of G-Pump glucagon and GlucaGen via an OmniPod.
Results:
G-Pump glucagon effectively increased blood glucose levels in a dose-dependent fashion with a glucose Cmax of 183, 200, and 210 mg/dL at doses of 0.3, 1.2, and 2.0 µg/kg, respectively (P = ns vs GlucaGen). Mean increases in blood glucose from baseline were 29.2, 52.9, and 77.7 mg/dL for G-Pump doses of 0.3, 1.2, and 2.0 µg/kg, respectively. There were no statistically significant differences between treatments in the glucose T50%-early or glucagon T50%-early with one exception. The glucagon T50%-early was greater following G-Pump treatment at the 2.0 μg/kg dose (13.9 ± 4.7 min) compared with GlucaGen treatment at the 2.0 μg/kg dose (11.0 ± 3.1 min, P = .018). There was more pain and erythema at the infusion site with G-Pump as compared to GlucaGen. No serious adverse events were reported, and no unexpected safety issues were observed.
Conclusions:
G-Pump glucagon is a novel, stable glucagon formulation with similar PK/PD properties as GlucaGen, but was associated with more pain and infusion site reactions as the dose increased, as compared to GlucaGen.
Hypoglycemia is a serious and potentially life-threatening complication of insulin therapy. Individuals with type 1 diabetes are at particular risk as their primary physiological defenses against hypoglycemia are absent or impaired. Glucagon secretion, which functions to raise circulating glucose primarily by breaking down hepatic glycogen, is dysfunctional in type 1 diabetes and epinephrine secretion may also be impaired after recurrent hypoglycemia. 1 Exercise and sleep, which by themselves already present times of high risk for hypoglycemia, may further impair the sympatho-adrenal response to hypoglycemia. 2 In a large registry of subjects with type 1 diabetes, 12% of participants had experienced a severe hypoglycemic episode resulting in a seizure or coma in the past year. 3 Estimates of deaths in those with type 1 diabetes related to hypoglycemia range from 4-10%.4-6
Hypoglycemia is clearly an issue that has not been fully addressed by current day therapies and technologies. Closed-loop systems are being developed as 1 potential solution. 7 Among these systems, automated insulin delivery alone is most common, but multiple groups have demonstrated safety and efficacy of combined insulin and glucagon delivery systems.8-10 In such systems, small doses of glucagon are given via a pump automatically to prevent or treat hypoglycemia. Currently available glucagon formulations, such as GlucaGen® (Novo Nordisk), consist of lyophilized powder that requires reconstitution with sterile water. They are approved only for treatment of severe hypoglycemia. The product is to be used immediately after reconstitution and then discarded due to issues of protein aggregation and degradation. 11 There remains an unmet need for a stable glucagon formulation. Xeris Pharmaceuticals is developing a body-temperature stable, soluble liquid glucagon formulation, G-Pump™ glucagon, that can be administered with an infusion pump,12,13 and it has been safely administered to adults with type 1 diabetes via syringes. 14 Its first use in humans via a patch pump as compared to GlucaGen is described here, specifically to evaluate the speed of glucagon absorption and onset of action between the 2 formulations of glucagon.
Methods
Materials
G-Pump glucagon was provided by Xeris Pharmaceuticals, Inc (Austin, TX, USA) as a 5 mg/ml solution. This solution was transferred to an OmniPod® system without further processing. GlucaGen glucagon was purchased from Cardinal and reconstituted to 1 mg/ml with the diluent provided, as per the label instructions, prior to transfer to the OmniPod system. Transfer of GlucaGen to the OmniPod was typically within 10 minutes of reconstitution to avoid product degradation.
Subjects
Nineteen subjects with type 1 diabetes on insulin pump therapy were admitted for two 12-hour visits. All subjects provided written informed consent before entering the study. The mean age of all subjects was 35.3 years (range 24 to 60 years), and the majority were females (63.2%).
All subjects were required to be between 18 and 65 years of age, on an insulin pump, and have an A1C of <10%. Women of childbearing age were required to have a negative urine pregnancy test prior to participation. Patients with prior history of cardiovascular, cerebrovascular, kidney, or liver disease or any other uncontrolled medical conditions were excluded. Other exclusion criteria included oral or parenteral corticosteroid use, active foot ulceration, bleeding disorder, seizure disorder, active alcohol or substance abuse, glycogen storage disease, or any contraindication to receiving glucagon.
Protocol
The research protocol was approved by the Oregon Health & Science University (OHSU) Institutional Review Board, this study was registered with clinicaltrials.gov (NCT02081001), and was filed under IND 120653. This was a single center, double-blind, randomized, 2-treatment, 2x3-period crossover study designed to compare the pharmacokinetic and pharmacodynamic profiles of G-Pump glucagon compared to GlucaGen given via an OmniPod to adult subjects with type 1 diabetes. Subjects were randomized to 1 of 6 treatment groups to receive the appropriate sequence of blinded study medication. Both the order of drug administration (G-Pump versus GlucaGen) and the dosing sequence were randomized.
On treatment days, subjects arrived to OHSU at approximately 7:30
Statistical Analysis
The primary efficacy variables were the speed of action as assessed by the time to reach 50% of the maximum glucose concentration (T50%-early) and the speed of absorption as assessed by the time to reach 50% of the maximum glucagon concentration. A sample size of 18 was determined to be sufficient to establish bioequivalence with 90% power, a level of significance of 10%, and equivalence limits of −2.35 and 2.35 when the true difference between means was 0.00 and the standard deviation was 1.0 (PASS Version 11, NCSS Kaysville UT 2011). These criteria were predetermined in accordance with FDA guidance on bioequivalence. The secondary variables were maximum concentration, time to maximum concentration, time to reach 50% of maximum concentration after Cmax was achieved, and area under the curve (AUC) from time 0 to 60 min, 0 to 120 min, and 0 to 150 minutes for both glucose and glucagon concentration. Adverse events, infusion site pain, Draize Scale, and discomfort level were summarized descriptively for all subjects. The mean, SD, minimum and maximum values, or count and percentage were summarized for G-Pump and GlucaGen treatments for infusion site pain, Draize Scale, and discomfort level. To allow more precise evaluation, pain at the infusion site was measured using a 100-mm visual analog score (VAS) as opposed to be being captured as an adverse event. VAS scores range from 0 = “no discomfort” to 100 = “worst possible discomfort.” Subjects reported pain using the VAS at 10 minutes and 30 minutes post the start of the infusion.
A mixed model, including all the factors (formulation, dose level, time period, sequence, and baseline value) and interactions, was applied first to test for bioequivalence. However, in some cases, the mixed model failed to converge, in which case a reduced model with fewer factors and interactions was used. The reduced model still included formulation, time period, sequence, baseline value, and subject as the repeated random factor. Log-transformed parameters were used as the input to obtain the ratio between G-Pump and GlucaGen and to satisfy the normality assumption of the mixed model. The test results provided the 90% confidence interval (CI), estimated from contrasts, the point estimates, and pairwise comparison P values. A similar mixed model was also used to test the difference in AUC among doses of each formulation as well as the VAS. McNemar’s test was also applied to test the effects of G-Pump and GlucaGen treatments on discomfort incidence as well as the Draize Scale assessments. Data from 2 subjects (one for visit 1, one for visit 2) were excluded from the analysis. This was due to 1 subject receiving the wrong study drug and the other subject receiving only 20% of the intended dose. In addition, 1 subject withdrew from the study due to nausea and vomiting in visit 1. Statistical significance was accepted at P < .1 in accordance with FDA guidance on bioequivalence studies.
Dextrose rescues was given to 5 subjects and was given within the last few times points of each dosing period. In such cases, the glucose measured after rescue did not reflect the effects of the test drug. To solve this problem, the glucose measurements were imputed after the dextrose rescue using linear extrapolation based on the log-transformed values of the glucose reported before the dextrose rescue. This resulted in the imputation of the last 4 data points for 1 subject, the last 3 data points for 2 subjects, and the last 2 data points for 2 subjects. The imputation was done by estimation of the slope from the log of the last 2 data points before administration of dextrose, then extrapolation to the rest of the data points, and then exponentially transforming the data back.
Results
Dose-dependent increases in glucose and glucagon levels were observed following both G-Pump and GlucaGen treatments at all 3 doses. The mean glucagon and glucose concentration curves were comparable between the G-Pump and GlucaGen treatments with little separation at all 3 doses. The mean maximum glucose increases from baseline were 29.2, 52.9, and 77.7 mg/dL following G-Pump treatment with doses of 0.3, 1.2, and 2.0 μg/kg, respectively (P = ns vs GlucaGen; see Figure 1). There were no statistically significant differences between G-Pump and GlucaGen treatments in the glucose T50%-early or glucagon T50%-early at the 0.3 ug/kg and 1.2 ug/kg. The glucagon T50%-early was greater following G-Pump treatment at the 2.0 μg/kg dose (13.9 ± 4.7 min) compared with GlucaGen treatment at the 2.0 μg/kg dose (11.0 ± 3.1 min, P = .018). Insulin levels were similar for both arms. Just prior to the 0.3 ug/kg glucagon dose, mean insulin levels were 5.6 vs 5.4 μg/L, after the dose (the mean over the subsequent 150 min) 5.3 vs 5.6 μg/L, before the 1.2 ug/kg dose 7.2 vs 7.5 μg/L, after the dose 6.9 vs 6.3 μg/L and before the 2.0 μg/kg 7.1 vs 4.9 μg/L, and after the dose 5.4 vs 5.6 μg/L (GlucaGen vs G-Pump). Dose responses were observed for glucagon AUC60, AUC120, and AUC150. Significant statistical differences were detected among all doses for both G-Pump and GlucaGen treatments. Similarly, dose responses were observed for glucose AUC60, AUC120, and AUC150 of both G-Pump and GlucaGen treatments and significant differences were detected between 2.0 ug/kg and 0.3 ug/kg dose for glucose AUC120, and AUC150. There was no statistically significant difference detected between treatments at any dose for other secondary PK or PD variables. See Table 1 for detailed PK results, and see Table 2 for detailed PD results.
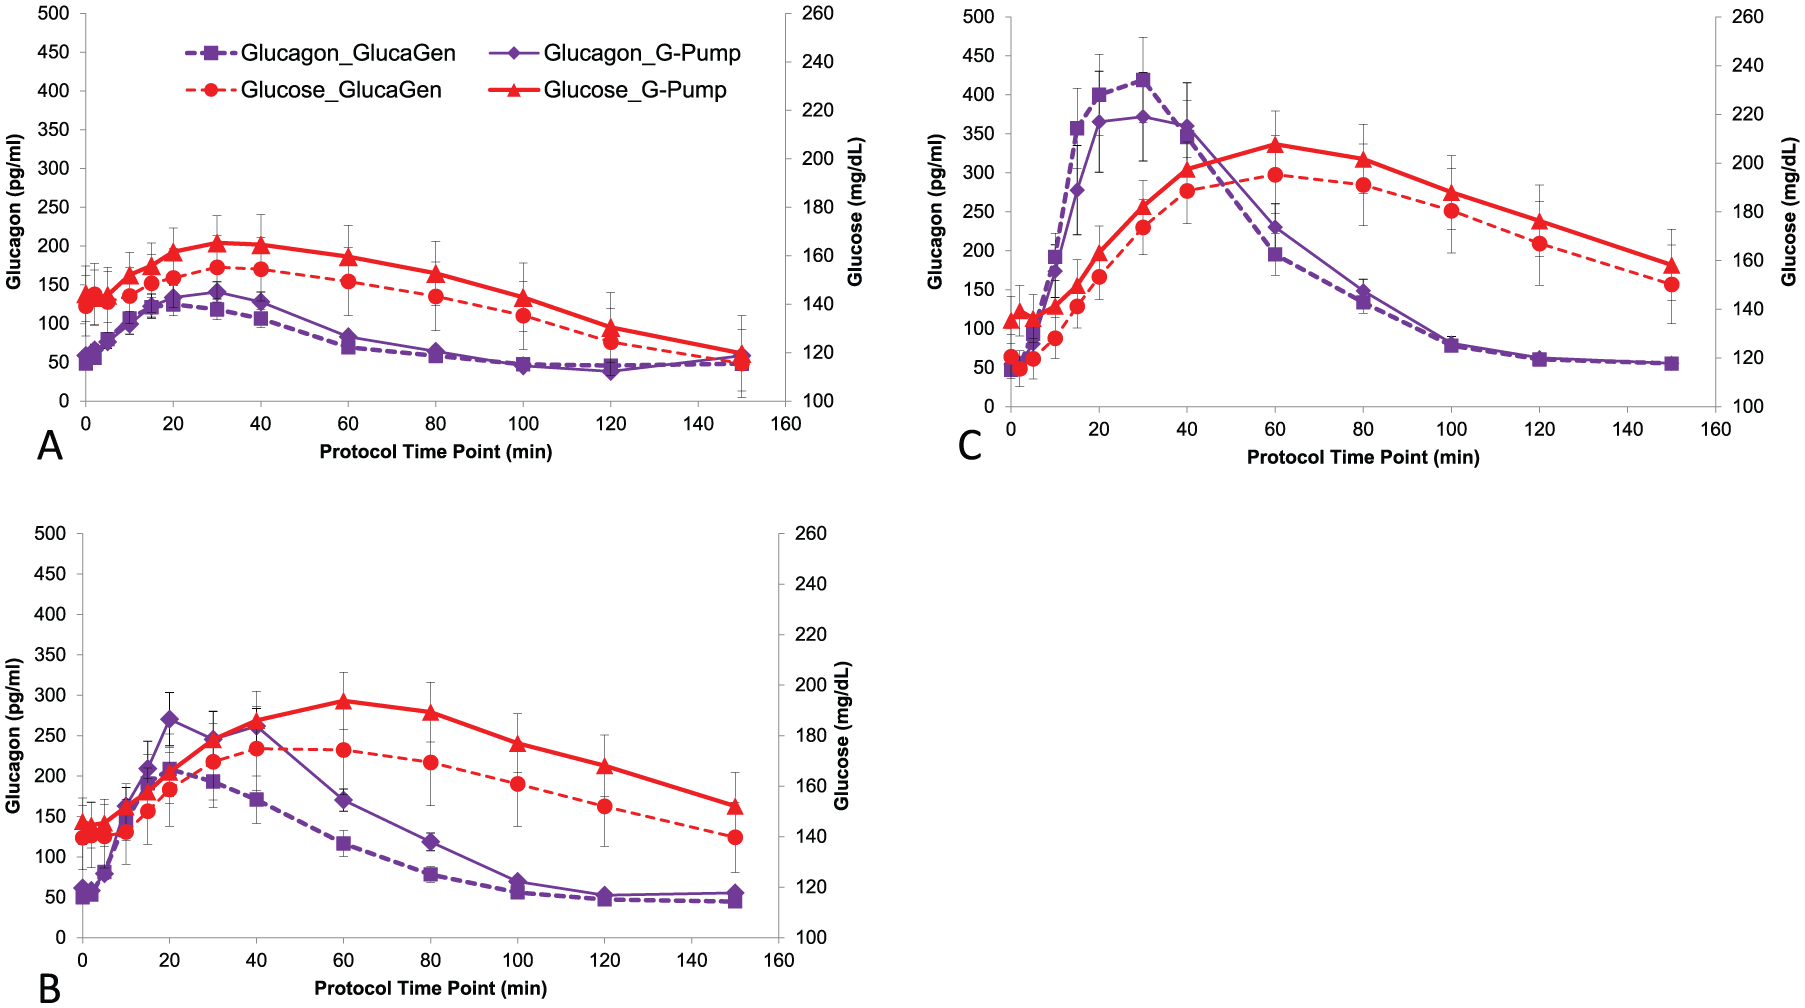
Mean glucagon and glucose concentration curves for G-Pump and GlucaGen (panel A 0.3 µg/kg dose, panel B 1.2 µg/kg dose, and panel C 2.0 µg/kg dose). Glucagon levels after GlucaGen administration are shown with purple squares with dashed lines and after G-Pump with purple diamonds with solid lines. Glucose levels after GlucaGen are shown with red circles with dashed lines and after G-Pump with red triangles with solid lines. Note there is little separation between glucagon and glucose levels after administration of G-Pump versus GlucaGen at all 3 doses.
Pharmacokinetic Parameters of G-Pump Versus GlucaGen Glucagon.
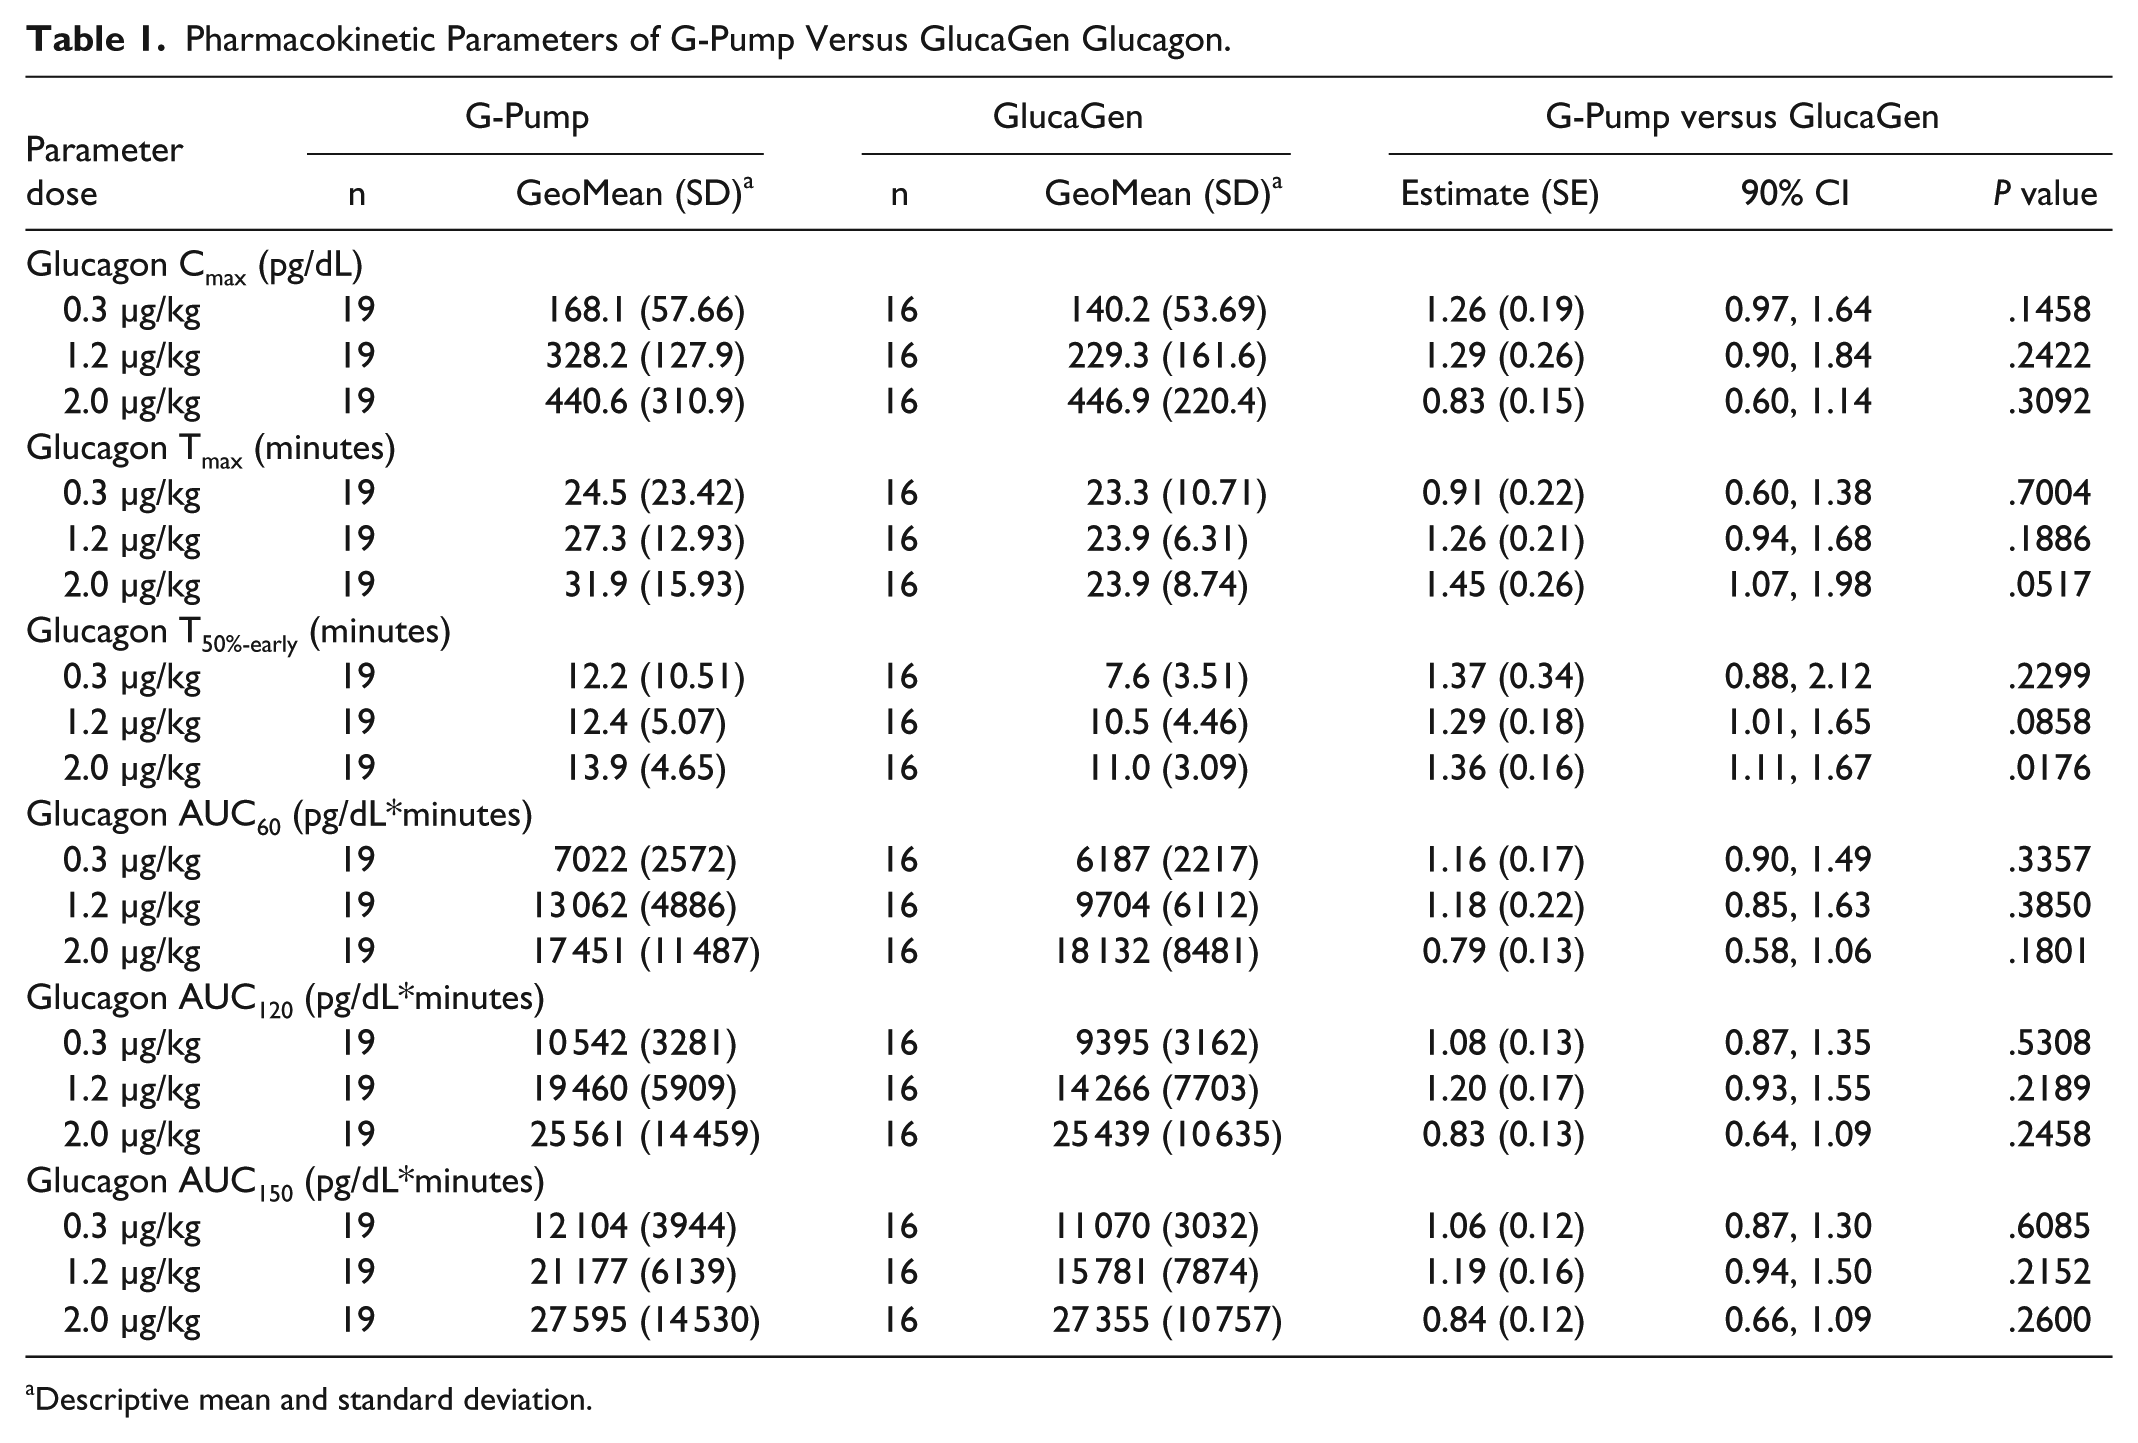
Descriptive mean and standard deviation.
Pharmacodynamic Parameters of G-Pump Versus GlucaGen Glucagon.
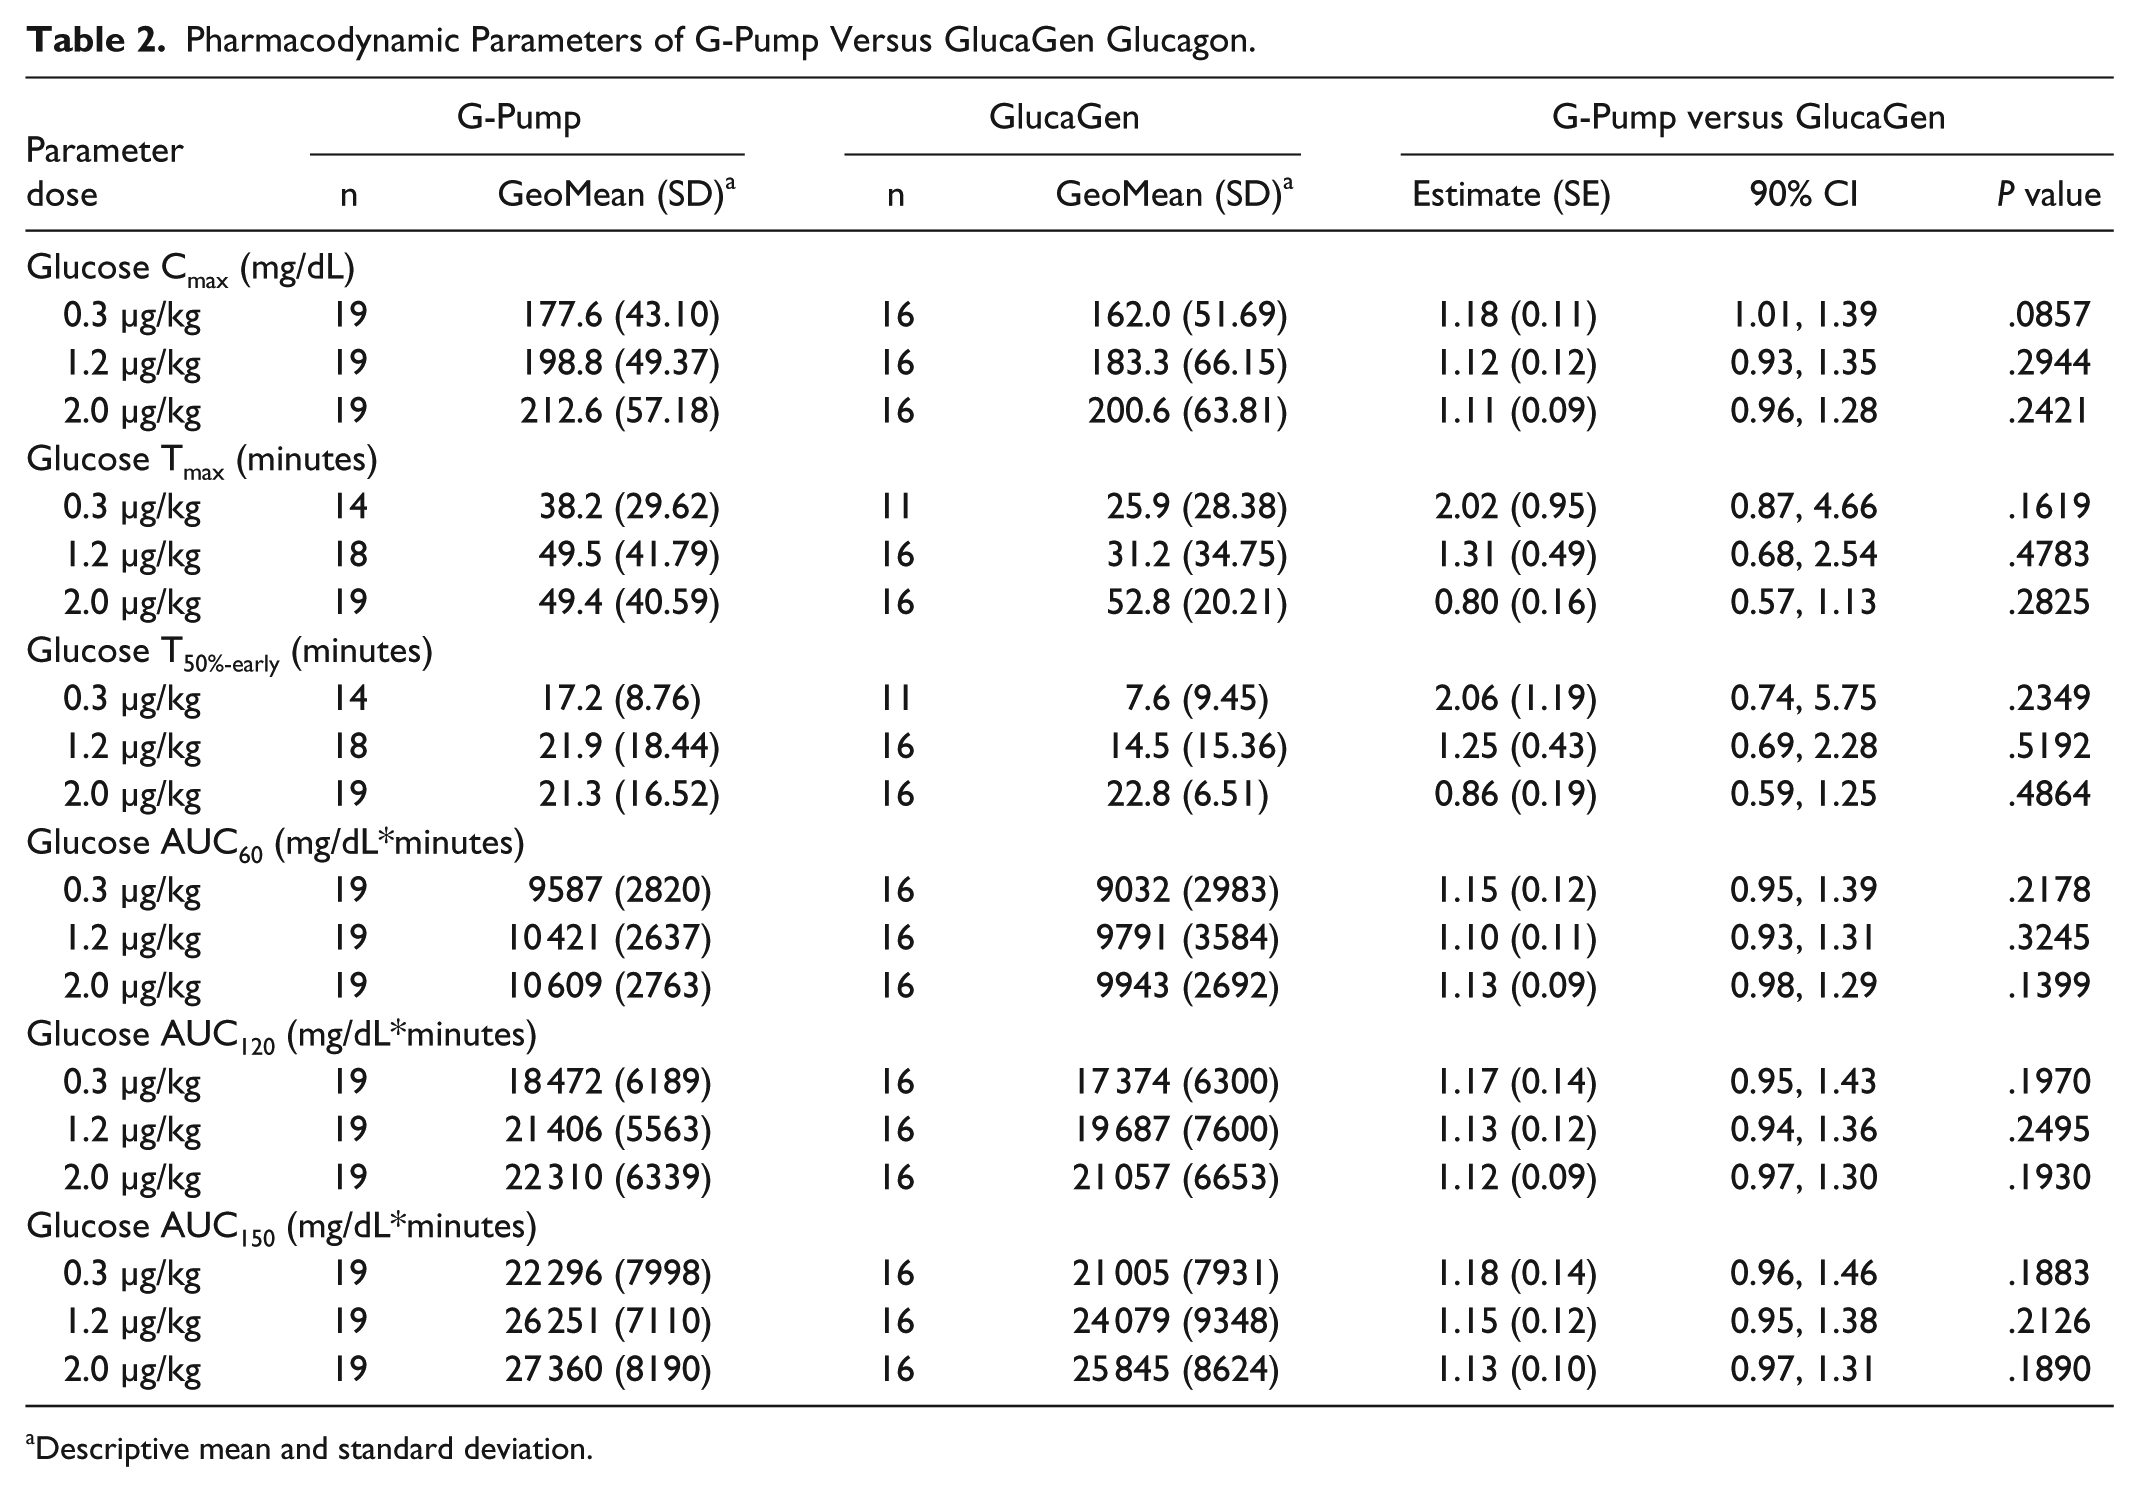
Descriptive mean and standard deviation.
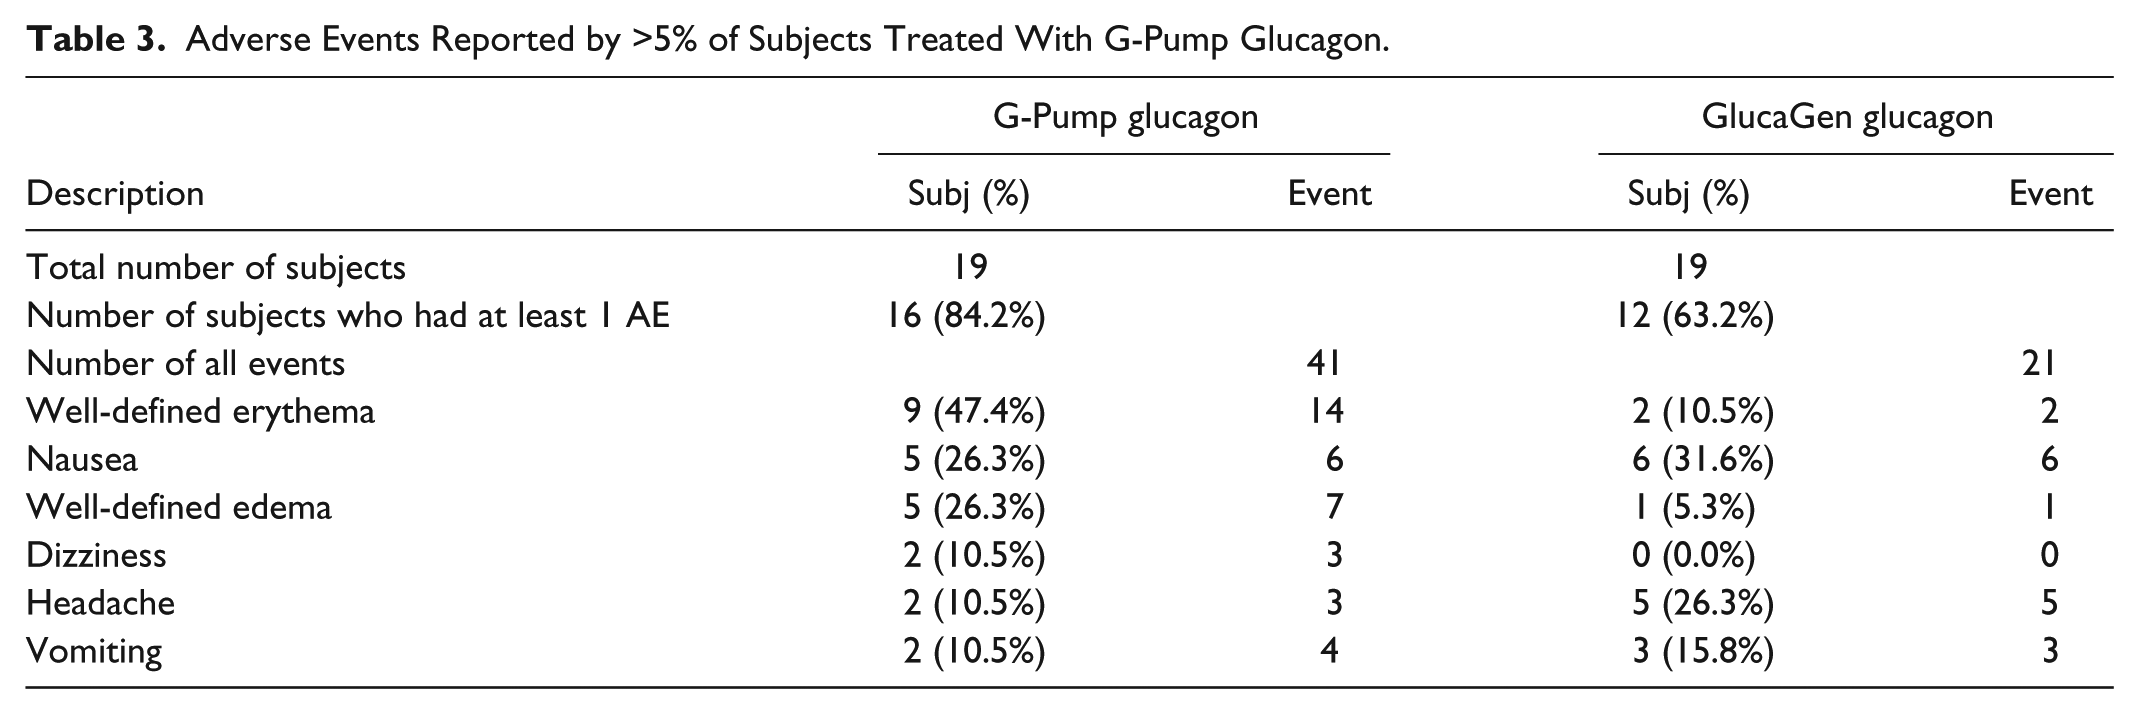
The majority of subjects reported an adverse event (AE) following G-Pump (84.2%) and GlucaGen (66.7%) treatment (see Table 3, which depicts AEs reported by >5% of subjects given G-Pump). Most of the AEs reported were either mild or moderate. Two events were reported by 1 subject during the study (nausea and vomiting), which were classified as severe and occurred following G-Pump treatment. There were no deaths, serious adverse events, or other significant AEs reported during this study. There was no evidence for any effect of either treatment on clinical laboratory assessments, vital signs, weight, or EKG evaluations.
Adverse Events Reported by >5% of Subjects Treated With G-Pump Glucagon.
At 10 minutes post injection, significant differences in the VAS results for infusion site pain were detected between G-Pump and GlucaGen at the 1.2 μg/kg dose (18.9 ± 21.1 vs 0.3 ± 1.0, P = .0005) and 2.0 μg/kg dose (22.7 ± 25.5 vs 0.3 ± 0.7, P < .0001), but not at the lowest dose (7.8 ± 18.9 vs 2.2 ± 9.2, P = ns). At 30 minutes post injection, there was a significant difference in the VAS results at the 2.0 µg/kg dose (3.8 ± 9.0 vs 0.3 ± 1.4, P = .0258), but not at the 2 other doses. Twelve of the 13 subjects with pain at 30 minutes after receiving G-Pump glucagon had coinciding erythema at the infusion site. See Table 4 for detailed visual analog scale results.
Visual Analog Scale Data: Discomfort by Dose and Between Treatments at Each Time Point.
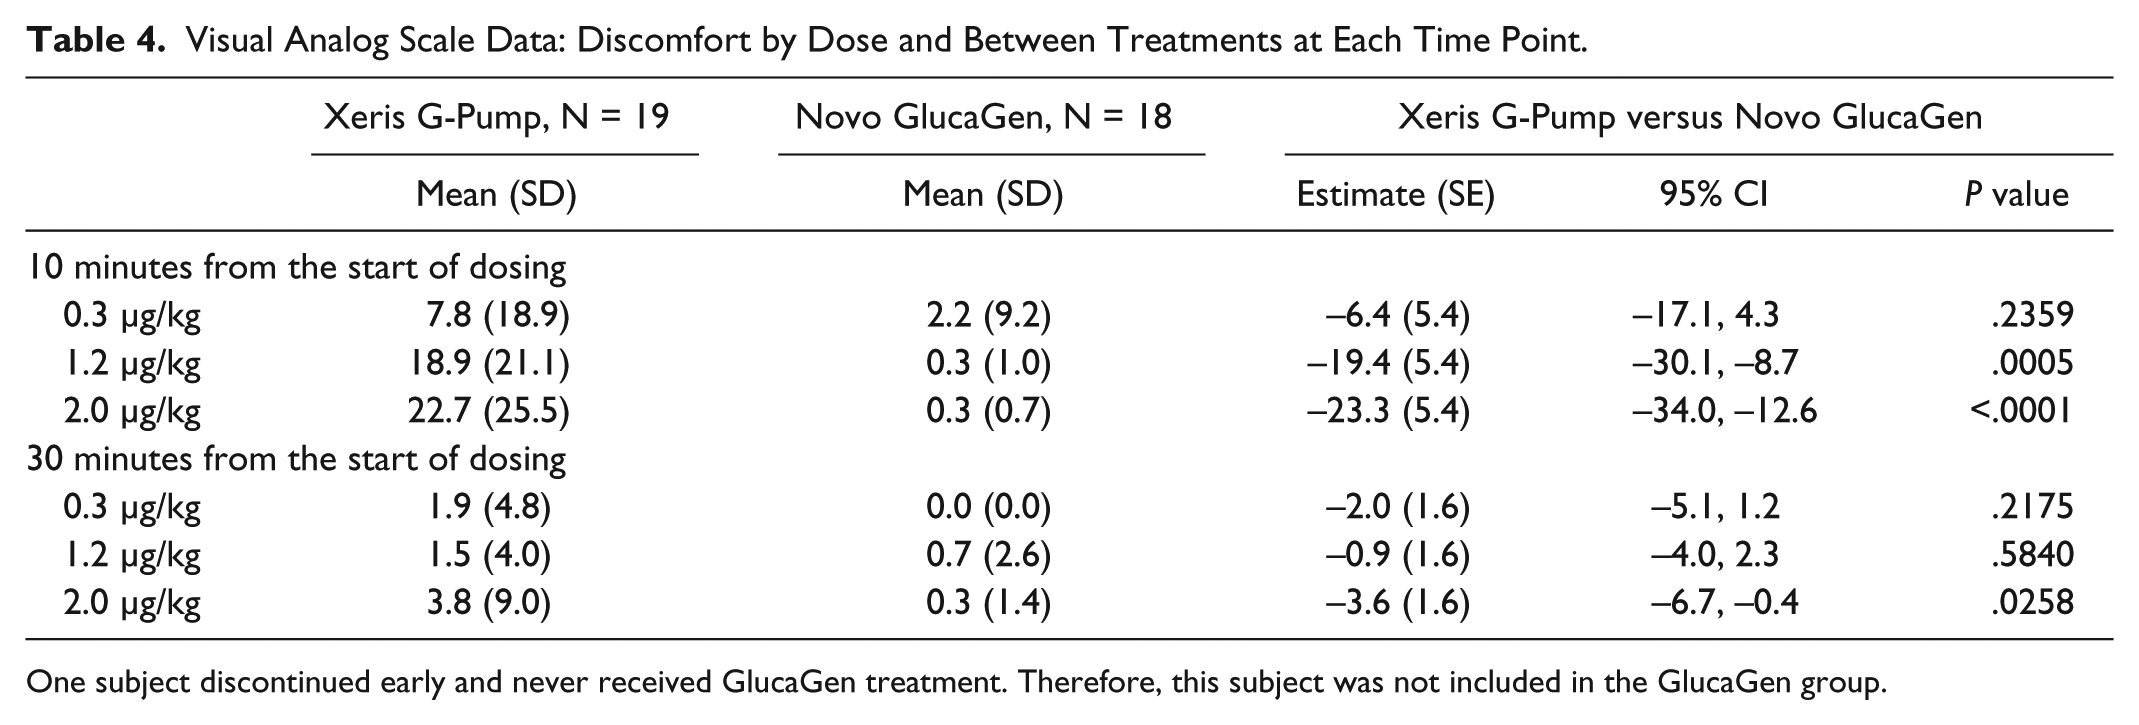
One subject discontinued early and never received GlucaGen treatment. Therefore, this subject was not included in the GlucaGen group.
Discussion
The development of a stable, liquid form of glucagon will allow for a premixed, ready-to-use glucagon auto-injector that does not require reconstitution. Other potential applications of stable glucagon include a mini-dose pen for administration of smaller doses in cases such as gastroenteritis16,17 as well as delivery via a pump in the context of a closed-loop system. Xeris Pharmaceuticals’ G-Pump glucagon is the first known native glucagon formulation to offer extended liquid stability at room or body temperature, and may ultimately enable such product applications.
The pharmacokinetic and pharmacodynamic properties of G-Pump glucagon were very similar to GlucaGen. At the highest dose of 2.0 μg/kg, there was a consistent trend for less drug exposure and slower absorption for G-Pump glucagon as compared to GlucaGen. However, this trend did not extrapolate to the pharmacodynamic data, which had a trend toward a more rapid rise in glucose, but this was not statistically significant. If G-Pump is incorporated into bihormonal closed-loop systems in the future, likely no changes in treatment algorithms will be required, although future studies will be required to determine if changes are needed.
Limitations of this study include that 5 of the subjects required rescue from hypoglycemia using dextrose. Hypoglycemia has been shown in animals to accentuate the response to glucagon 18 and the administration of dextrose immediately raises blood glucose. Therefore the last few data points for those 5 subjects were imputed after the administration of dextrose. In addition, 3 doses of glucagon were given on a single study day and the baseline glucose was commonly higher for the subsequent doses as compared to the first glucagon dose. It is unknown if the higher baseline glucose at the time of glucagon administration blunted the rise in glucose. The order of the 3 doses was randomized to account for this possible effect and the order of the doses were held constant for any particular subject between the G-Pump dosing visit and the GlucaGen dosing visit. In addition, endogenous glucagon production was not suppressed in this study. However, as expected, their baseline glucagon levels were low.
The G-Pump formulation used in this study was associated with significantly more erythema and pain at the pump infusion site as compared to GlucaGen. The majority of reactions were mild or moderate, but nevertheless may limit the clinical utility of G-Pump glucagon at higher doses. The smallest dose was much better tolerated, and G-Pump glucagon could potentially be delivered in multiple small doses as needed. In this protocol, the glucagon was dosed immediately after pump placement and then the pump was removed after 10 minutes. It is unknown if the erythema and pain would have been significantly reduced with a longer application of the pump, as these pumps are typically worn for 72 hours. It is also unknown if repeated administration could increase the site reactions. The mechanism of the pain is unclear, but could arise due to the hypotonic nature of the nonaqueous glucagon formulation. Additional testing is required and an optimized G-Pump formulation may be required for administration via a pump.
Conclusions
These study results demonstrate that the speed of absorption and onset of action of G-Pump were similar to that of GlucaGen. There was a dose-dependent increase in both glucagon and glucose levels, and there was little separation between G-Pump and GlucaGen treatments at all 3 doses. Given the similarities of the pharmacodynamic profiles of G-Pump and GlucaGen, likely no changes in treatment algorithms will be required for use of G-Pump in place of GlucaGen in a closed-loop system.
While G-Pump demonstrated sufficient efficacy in this study, additional drug formulation development or dosing adjustment could be tested to increase the clinical utility of this stable liquid glucagon.
Footnotes
Acknowledgements
The content is solely the responsibility of the authors and does not necessarily represent the official views of the NIH. JRC is the guarantor of this work and, as such, had full access to the data in the study and takes responsibility for the integrity of the data and the accuracy of the data analysis. We wish to thank Christine Swanson, MD (OHSU) and Nicolas Kissell (OHSU) for their assistance with conducting studies.
Abbreviations
AE, adverse event; CI, confidence interval; EDTA, ethylene diamine triacetic acid; ELISA, enzyme-linked immunoassay; FDA, Food & Drug Administration; IND, Investigational New Drug; OHSU, Oregon Health & Science University; RIA, radioimmunological assay; VAS, visual analog scale.
Declaration of Conflicting Interests
The author(s) declared the following potential conflicts of interest with respect to the research, authorship, and/or publication of this article: JRC has a financial interest in Pacific Diabetes Technologies, Inc, a company that may have a commercial interest in the results of this research and technology. This potential conflict of interest has been reviewed and managed by OHSU. BN, PS, MC, and SP are employees of Xeris Pharmaceuticals.
Funding
The author(s) disclosed receipt of the following financial support for the research, authorship, and/or publication of this article: This work was supported by grants from JDRF and the National Institutes of Health (NIH) (4R44DK096706-02). This publication was also supported by Oregon Clinical and Translational Research Institute (OCTRI), grant number (UL1TR000128) from the National Center for Advancing Translational Sciences (NCATS) at the National Institutes of Health (NIH).