
Abstract
Objective:
The objective was to assess clinical risks of inaccurate continuous glucose monitoring (CGM) system readings as estimated by the surveillance error grid (SEG).
Methods:
Values from Dexcom G4 Platinum system with an advanced algorithm (Software 505) were plotted on the SEG with temporally matched reference venous (YSI) values collected during clinic visits on days 1, 4, and 7 of sensor wear. Data from a pediatric study (N = 79, age [mean ± SD] 12.2 ± 4.6 years, all with type 1 diabetes) and an adult study (N = 51, age 46.7 ± 15.8 years, 44 with type 1 diabetes and 7 with type 2 diabetes) were used.
Results:
Pediatric data included 2262 paired points, of which 1990 (88.0%) were in the “no risk” zone. Adult data included 2263 paired points, of which 2056 (90.9%) were in the “no risk” zone. Performance was best on Day 4, when 92.7% and 93.3% of points from the pediatric and adult studies, respectively, were in the “no risk” zone. Nine of the 4525 points (<0.2%) from 5 different sensors were in zones representing moderate risk, and none were in zones representing great or extreme risk.
Conclusions:
SEG analysis suggests that in pediatric and adult subjects with diabetes, using CGM values for diabetes management poses minimal risk to the user. CGM users also benefit from glucose trends and alerts.
The information provided by continuous glucose monitoring (CGM) is quantitatively and qualitatively different from that provided by self-monitoring of blood glucose (SMBG), and CGM data now form the basis for many routine self-management decisions required of people with diabetes. 1 As described in early studies that algorithmically incorporated CGM data into diabetes management 2 and established its effectiveness in clinical care settings, 3 trend information has been an important part of treatment decisions by CGM users. However, the extent to which CGM data can be safely used in lieu of SMBG values for diabetes-related treatment decisions (ie, nonadjunctively) is of interest. We addressed this question by analyzing data from earlier CGM accuracy studies with the surveillance error grid (SEG). 4
The SEG was developed in 2012 using an advanced mathematical interpretation of questionnaire responses from 206 clinicians and in contrast to the Clarke and Parkes Error Grids, provides asymmetric, nonlinear boundaries between risk categories and allows for a more granular assessment of the risk associated with inaccurate glucose measurements. The SEG was designed to be used as a tool for postmarket surveillance of blood glucose meters. Characterization of risks resulting from expanding a clinical indication for an approved, commercialized CGM product is a potential new use of the SEG.
Methods
Data from two previously published accuracy studies of the Dexcom G4 Platinum system using an advanced algorithm (Software 505) were used. The studies involved 79 pediatric 5 and 51 adult 6 subjects who provided reference venous (YSI) glucose values, temporally matched sensor glucose (SG) values, and temporally matched SMBG values during clinic visits on days 1, 4, and 7 of sensor wear. The pediatric study (age [mean ± SD] 12.2 ± 4.6 years, all with type 1 diabetes) provided 2262 paired SG/YSI points with a mean absolute relative difference (MARD) of 10%. The adult study (age 46.7 ± 15.8 years, 44 with type 1 diabetes and 7 with type 2 diabetes) provided 2263 paired points with a MARD of 9%. The points from each study and each day of sensor wear were mapped to the SEG using the Excel macro as described. 7
Results
Results of the SEG analysis are given in Figure 1 and Table 1. In the pediatric study, 1990 (88.0%) of the paired points were in the “no risk” zone, 263 (11.6%) were in the “slight risk” zone, and 9 (0.4%) were in the “moderate risk” zone. In the adult study, 2056 (90.9%) were in the “no risk” zone and the remaining 207 (9.1%) were in the “slight risk” zone. The overall risk presented by inaccurate CGM data is quite low, with >99.8% of recorded data pairs representing no or slight risk. None of the paired points in the adult study and <0.5% of the points from the pediatric study were in a zone representing moderate or great risk. In both studies, more points representing a risk were observed on Day 1 than either Day 4 or Day 7.
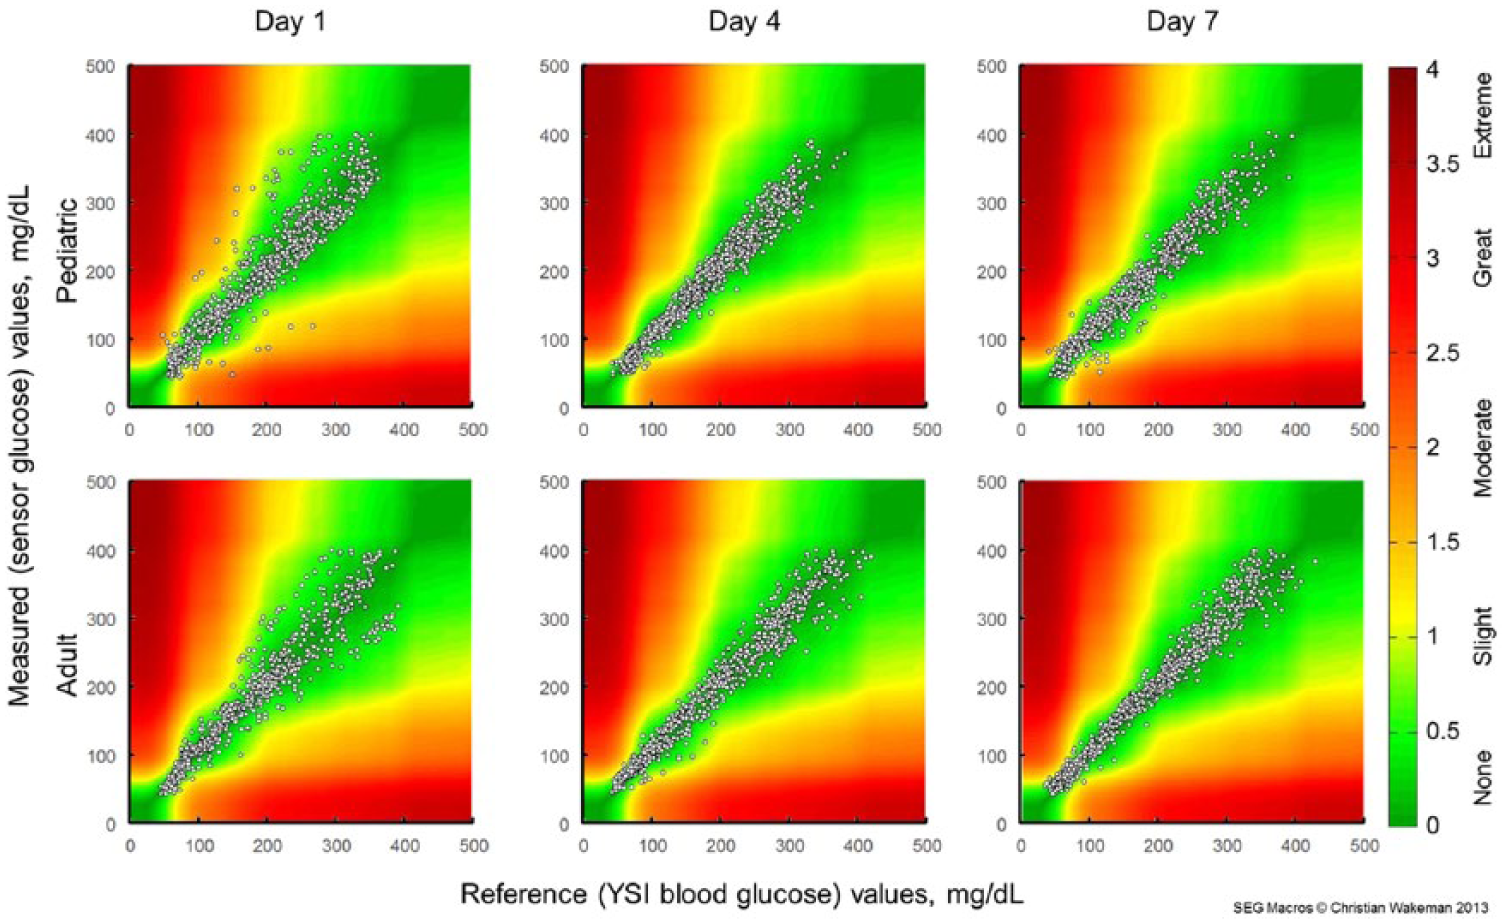
Surveillance error grid analysis for sensor wear Day 1 (left), Day 4 (center), and Day 7 (right) of the pediatric (top row) and adult (bottom row) studies. Colors indicate associated risk levels ranging from none (dark green) to extreme (brown).
Surveillance Error Grid Data Point Distributions for the Pediatric and Adult Studies on Each of the In-Clinic Study Days.
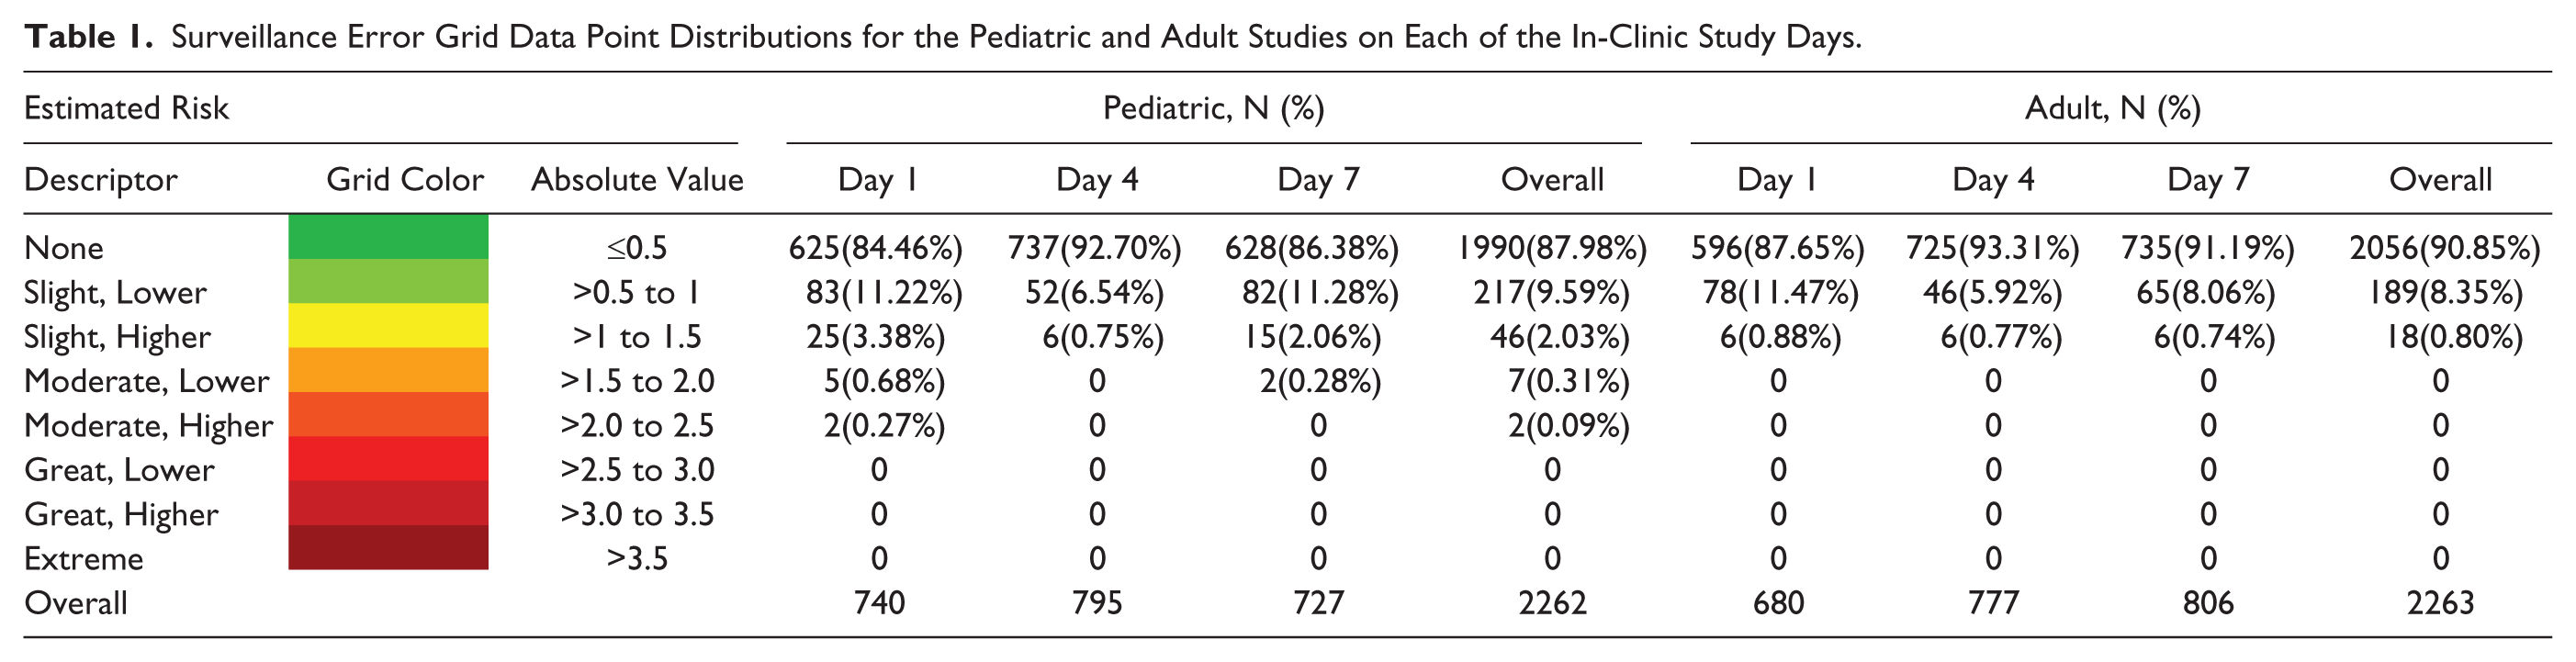
The 9 points classified as “moderate risk” were associated with 5 different sensors (Table 1). Two of these sensors (309126-G and 316182-D) accounted for 3 “moderate risk” points each; the frequent-sample testing for both of these sensors occurred on Day 1 of wear. Three other sensors accounted for the remaining 3 “moderate risk” points. Data from the entire in-clinic visits of a patient with a poorly performing sensor (309126-G) and a patient with a well-performing sensor (310908-F) are shown in Figure 2.
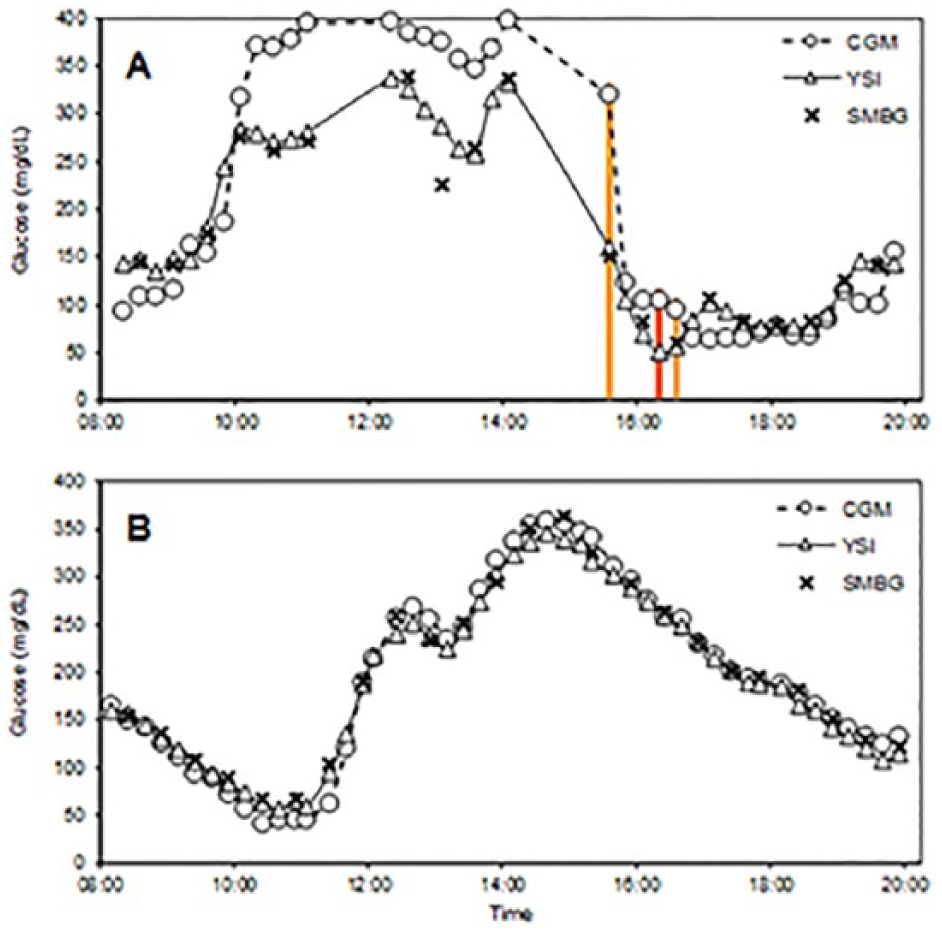
Glucose concentrations during two in-clinic experiments. (A) Sensor 316182-D, showing poor performance and 3 points in the “Moderate” risk zone, designated by vertical bars colored to show the risk category. Data gaps represent intervals with missing CGM and/or YSI values. (B) Sensor 310908-F, showing good performance. Triangles/solid lines, reference venous (YSI) values; “×” marks, capillary (SMBG) values; circles/dashed lines, sensor glucose (CGM) values.
Discussion
Although personal blood glucose meters are generally accurate,8,9 obtaining and testing a blood sample is a multistep process that is painful and burdensome.10,11 Many patients test infrequently (35% of patients in a T1D Exchange clinic registry study 12 tested 0-3 times per day), resulting in long between-test intervals. By contrast, optimal use of currently available CGM systems requires wearing of a sensor and transmitter, periodic sensor calibration, and proximity of a separate device for receiving, storing, and displaying the data. 13 However, CGM provides users with far more options for visualizing, sharing, and interacting with their data than does SMBG. The default CGM display includes the current glucose concentration estimate, 36 previous values (shown as a trend graph), settings for high and low threshold alerts, and directional arrows to indicate the glucose concentration rate of change (ROC). 14 Evidence from exploratory data analyses 15 and user surveys1,16,17 suggests that frequent screen views and use of threshold alerts favorably impact glycemic control, and that ROC arrows contribute to insulin dosing decisions among people with both type 1 and type 2 diabetes. Point estimates provided by blood glucose meters, unless clearly out of range, are less useful for patients who make diabetes management decisions throughout the day.
As the SEG demonstrates in the current analysis, some inaccurate CGM values pose a risk of leading to inappropriate treatment decisions. To mitigate this risk, users are advised against basing treatment decisions on CGM readings in several situations. Specifically, the Instructions for Use booklet 18 notes that performance may vary significantly between sensors, and advises users (1) to “pay attention to how each newly inserted sensor is working for you when deciding whether to make treatment decisions based on your glucose readings” and (2) to avoid basing treatment decisions on CGM data unless the display shows a number and a trend arrow and (3) to use a blood glucose meter when making treatment decisions if symptoms don’t match the CGM reading.
In a tracking study comparing CGM readings to reference YSI glucose values in a 14-year-old adolescent, data from the poorly performing sensor (Figure 2A) show that the YSI, SMBG, and SG values were all increasing rapidly early in the experiment, and fell rapidly after several meal and correction boluses of insulin were administered. The experiment was notable for data gaps in which YSI and/or CGM values were not available, several “moderate risk” and “slight risk” points, and for a SMBG-YSI mismatch at 13:04. The first point flagged as “moderate risk” occurred at 15:34, when CGM values were decreasing rapidly. ROC alerts, had they been in use during the experiment, would have called attention to impending hypoglycemia and thus mitigated the risk of the transient sensor inaccuracy. Most of the 16 points flagged as “slight risk” occurred between 10:15 and 11:00 (when glucose concentrations were markedly elevated) and between 16:00 and 17:45 (coinciding with the times of “moderate risk”). Of note, the CGM-YSI mismatches were transient, as later in the tracking study, the CGM and YSI glucose estimates were more closely aligned. In a different experiment where no points were flagged as “moderate risk,” YSI, SMBG, and SG values were in good agreement throughout (Figure 2B).
CGM data are now used by device algorithms without confirmatory SMBG data in several ways—to stop insulin delivery in response to existing or predicted hypoglycemia, 19 to accelerate basal insulin delivery in response to hyperglycemia, 20 and to control insulin delivery in investigational artificial pancreas implementations. 21 The risks and benefits of using glucose trend information have been evaluated in silico, 22 as has the relationship between sensor error and the risk of hypo- and hyperglycemia resulting from erroneous dosing decisions. 23 On a practical level, recommendations for using CGM data nonadjunctively 14 should streamline the process of adjusting insulin for CGM users.
The original intent of the SEG was that it be used as a tool for postmarket surveillance to assess risks for hypoglycemia or hyperglycemia due to blood glucose measurement inaccuracies;8,24 the idea of using the SEG to extend an indication was not considered. Although the SEG has been applied to flash glucose monitoring data, 25 this is the first work that uses SEG data to assess risks of extending a labeled indication for an approved product and first to apply the SEG to a CGM system. The SEG results suggest that there are minimal risks from basing routine diabetes management decisions on point estimates provided by the CGM system used here. 23 These risks are largely confined to Day 1 of sensor use, after which accuracy typically improves. 26 The risk assessment provided by the SEG does not account for potentially mitigating effects of trend information and alerts.
Nonadjunctive use of CGM data for diabetes management decisions has been formally studied in the recently completed REPLACE-BG study (NCT02258373), and has been an approved indication in the European Union and other jurisdictions since 2015. Based in part on the recommendation of an FDA advisory panel meeting, 27 this is now an approved indication for the Dexcom G5 Mobile system in the United States. 28 The revised labeling reflects common use of the technology1,11 and is expected to increase CGM adoption while reducing the burden of SMBG testing among CGM users.
Footnotes
Acknowledgements
The authors thank Christian Wakeman for development of the SEG macro.
Abbreviations
CGM, continuous glucose monitoring; FDA, Food and Drug Administration; MARD, mean absolute relative difference; SEG, surveillance error grid; SG, sensor glucose; SMBG, self-monitored blood glucose.
Declaration of Conflicting Interests
The author(s) declared the following potential conflicts of interest with respect to the research, authorship, and/or publication of this article: The authors are employees of Dexcom, Inc.
Funding
The author(s) received no financial support for the research, authorship, and/or publication of this article.