
Abstract
Introduction
A glucose self-measurement system is either a blood glucose monitor (BGM) for measuring the glucose concentration in capillary blood from a finger-stick or a continuous glucose monitor (CGM) for measuring the glucose concentration in interstitial fluid. An accuracy study compares measurements from the index system, either a BGM or a CGM, to reference values, also called comparator, control, or “true” values. The reference/index pairs from an accuracy study are often plotted on an error grid with the reference measurement on the horizontal or x-axis and the index measurement on the vertical or y-axis. The error grid can be divided into risk zones such that every data pair falls within one of multiple (usually five) risk categories. Three widely used error grids for glucose measurements have been developed: the Clarke error grid (CEG)—1987, 1 the Parkes error grid (PEG)—2000, 2 and the Surveillance error grid (SEG)—2014. 3
The Purpose of an Error Grid
The performance of a quantitative monitoring device of any physiological process can be described based on analytical accuracy or clinical accuracy. Analytical accuracy quantitatively expresses how close the measurement by the index system is to the same measurement by a reference method. 3 Various statistical metrics, such as precision and bias, can be used to measure analytical accuracy. 3 On the other hand, clinical accuracy is a qualitative measure expressing the clinical outcome associated with using the measurement by the index system to make a treatment decision. 3
The analytical or statistical accuracy of a measurement does not necessarily reflect the clinical significance or the clinical accuracy of the value. 1 Analytical accuracy assigns equal significance to each data pair (index and reference) that is separated by the same relative difference. However, at some levels of measurement, an error of a particular magnitude might have greater or lesser significance than at other levels. Clinical accuracy assigns significance to the index-reference difference that depends on the level of the measurement. Also, for BGMs and CGMs, differences where the index measurement overestimates the reference value are considered to confer greater risk than those where the index measurement underestimates the reference value. The metrics of analytical accuracy, such as the mean absolute relative difference (MARD) and agreement rate (AR), give equal weight to overestimates and underestimates. In contrast, error grids can divide errors into risk zones that take into account both the level of the measurement and the direction of the error. Data sets can thus be defined by the percentage of data points within each risk zone. 3 The error grids for glucose self-measurement devices have five zones—Zone A through Zone E—with A indicating the least risk and E indicating the most risk.
The main users of an error grid for glucose monitors are manufacturers and regulatory bodies. The grid can be used to assess the accuracy of new glucose measurement systems as well as to inform regulatory body decision-making. 3 The ISO 15197 second edition May 15, 2013 (In vitro diagnostic test systems—Requirements for blood glucose monitoring for self-testing in managing diabetes mellitus) specifies that 99% of individual measured glucose values shall fall within Zones A and B of the PEG for type 1 diabetes (T1D). 4 Error grids are also important for evaluating the performance of glucose self-measurement systems during post-market surveillance. A clinician or user of a glucose monitor can use the error grid results to get a general idea of the clinical performance of a glucose monitor, but the error grid information is not intended to replace a metric of analytical accuracy or to support a specific action in a specific situation.
How the Clarke Error Grid, Parkes Error Grid, and Surveillance Error Grid Were Developed
Clarke error grid
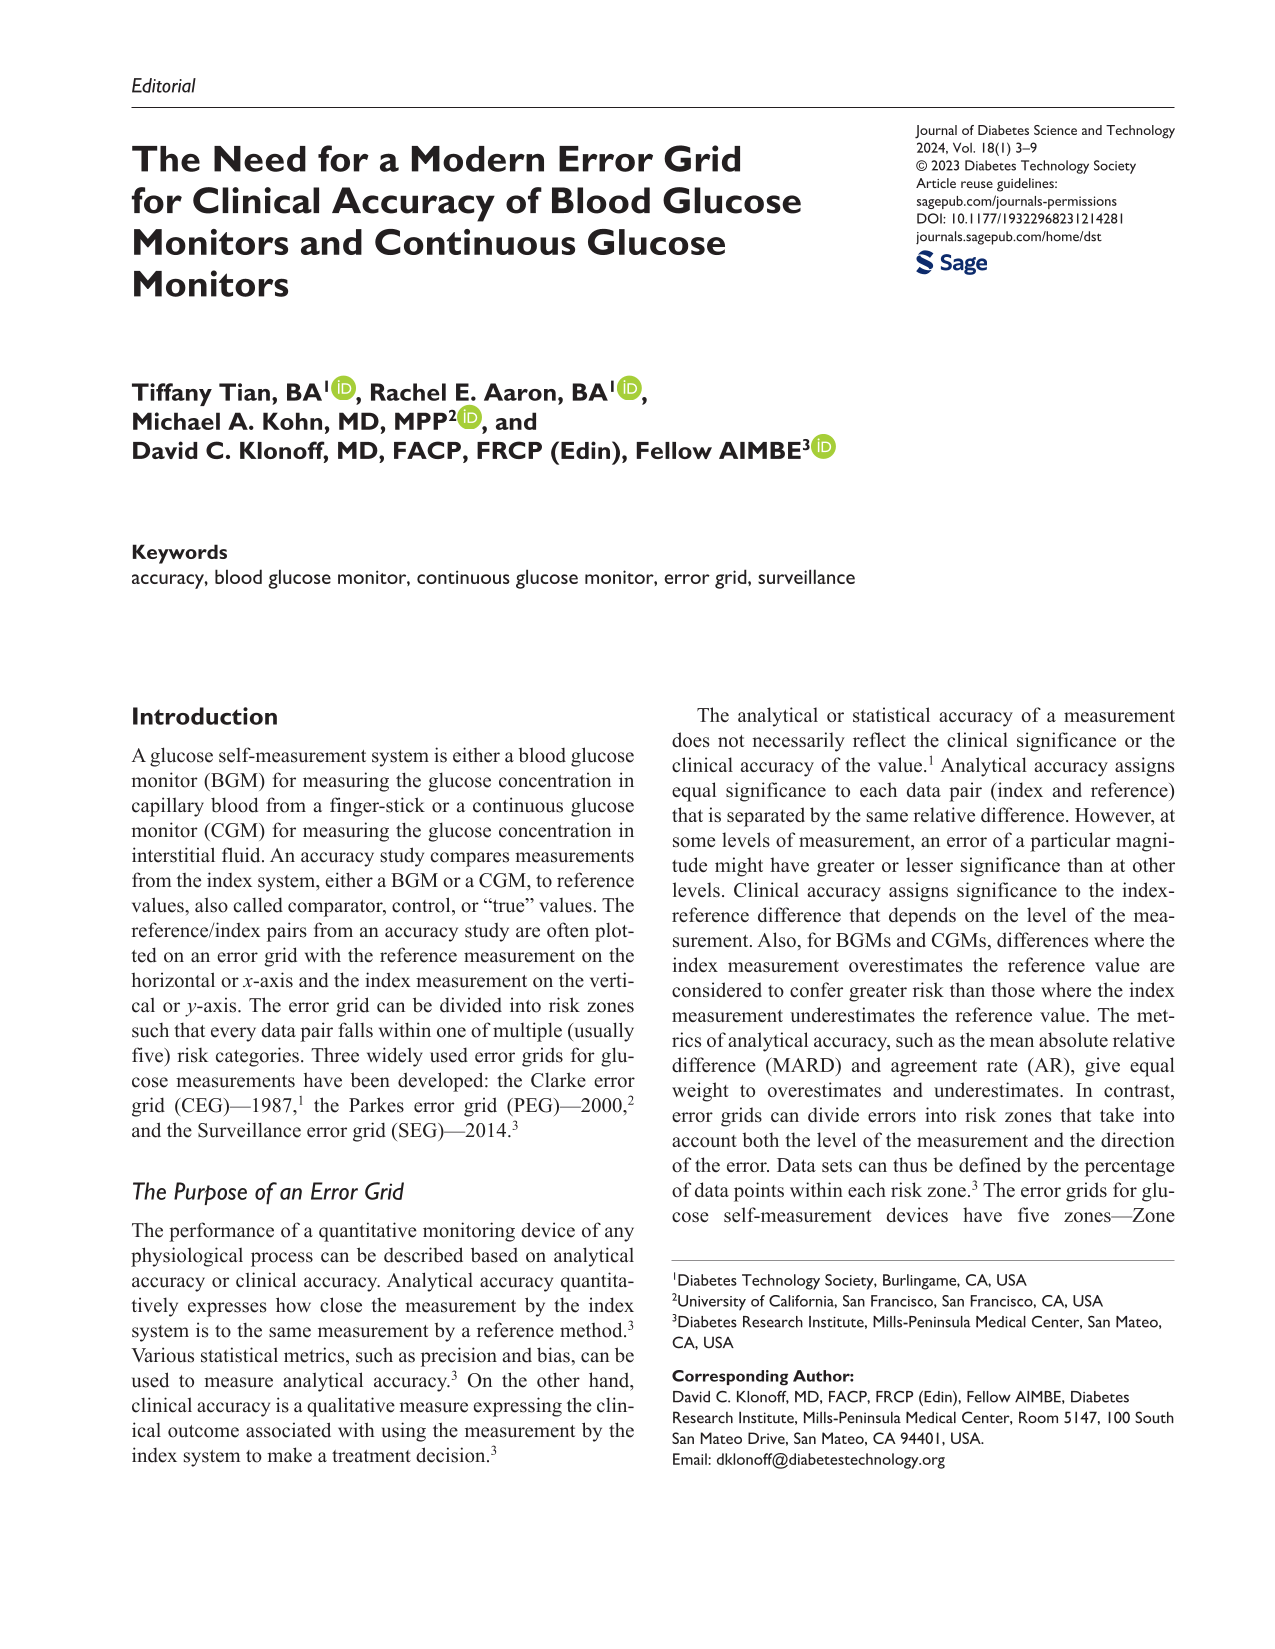
The CEG was published in 1987 by Clarke et al, recognizing the need for a method to assess the clinical accuracy of different blood glucose (BG) monitoring systems. 1 It is based on a set of assumptions from clinical practices in the authors’ medical center. The x-axis of the CEG is the reference BG and extends from 0 to about 450 mg/dL. The y-axis is the result of the BGM device and extends from 0 to 400 mg/dL. The CEG superimposed over the axes of the SEG is shown in Figure 1. Zones A to E are described in Table 1. Zones A to B are usually considered to be clinically acceptable, and Zones C to E are considered to be clinically significant errors. The risk boundaries, or the cutoffs between zones, are delineated by straight lines on the grid. The CEG has been criticized for the discontinuity of risk categories—such as going directly from Zone A to Zone D with only a small change in BG level. 2 In addition, these categories were created from the judgment of only a small number of clinicians. 2
The Clarke error grid superimposed over the axes of the Surveillance error grid.
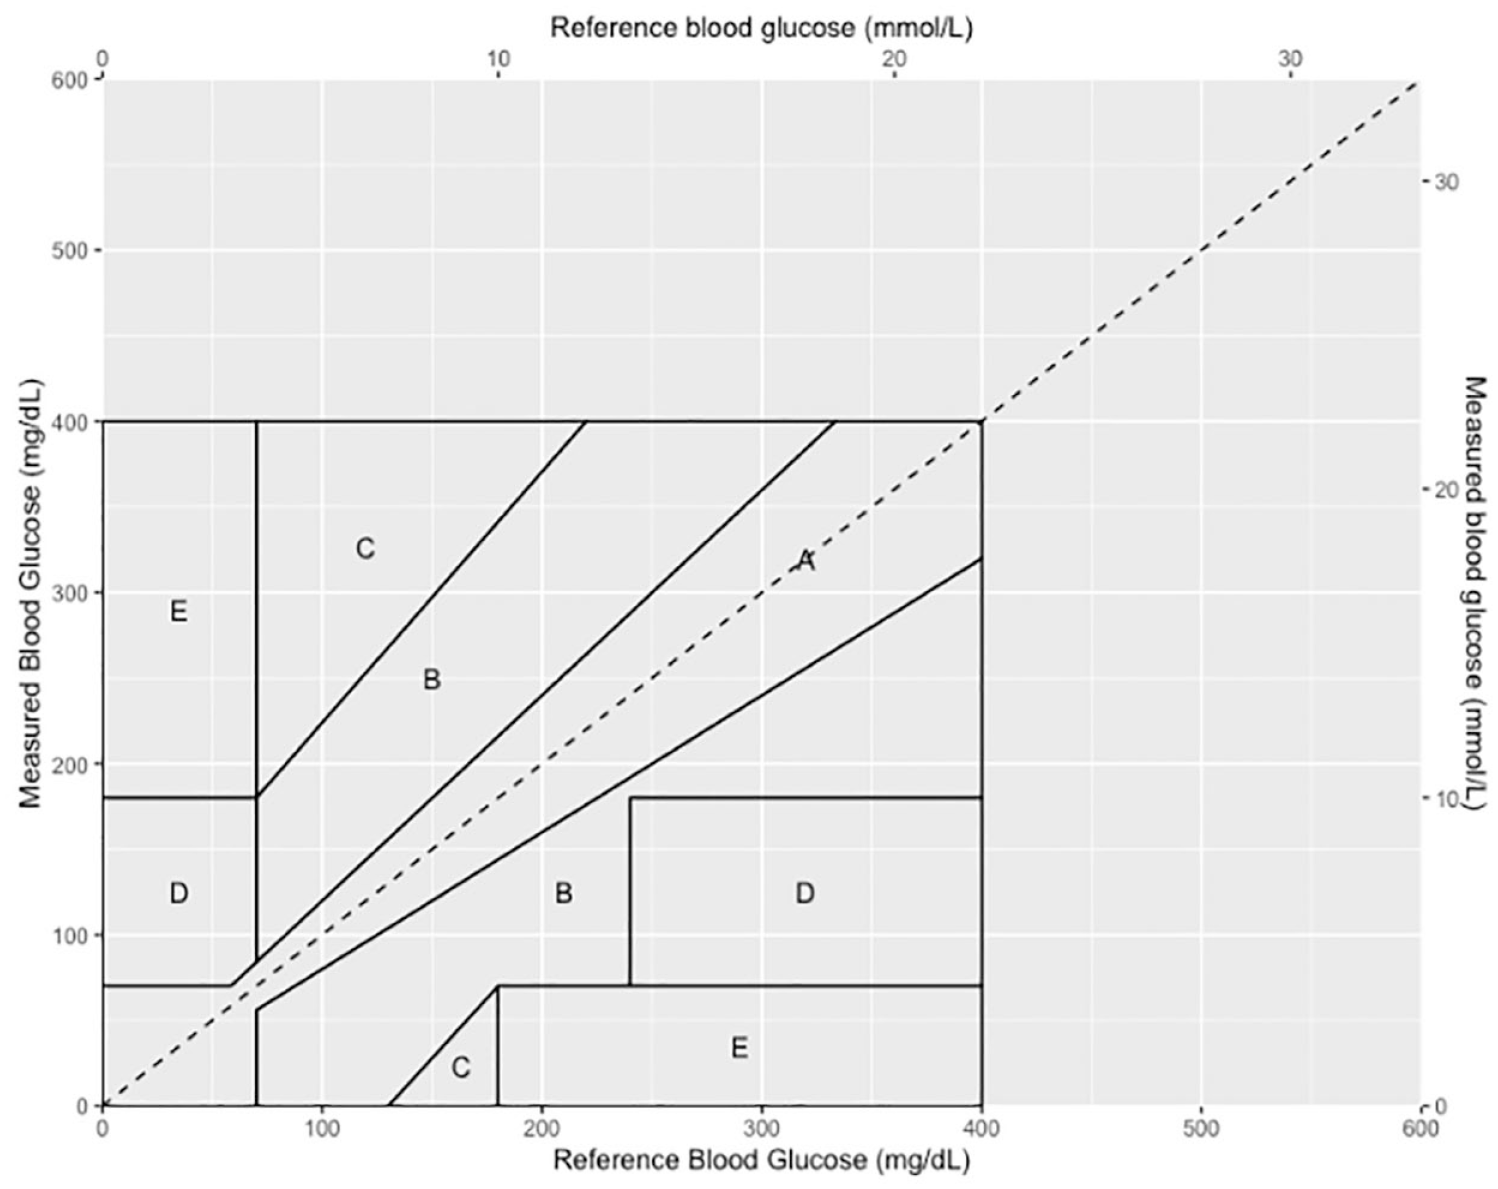
Comparison Between the Three Most Commonly Used Error Grids.
Target range is defined by Clarke et al 1 as “the range of glucose values that we teach our patients to attempt to attain and maintain.”
Abbreviation: BG, blood glucose.
Parkes error grid
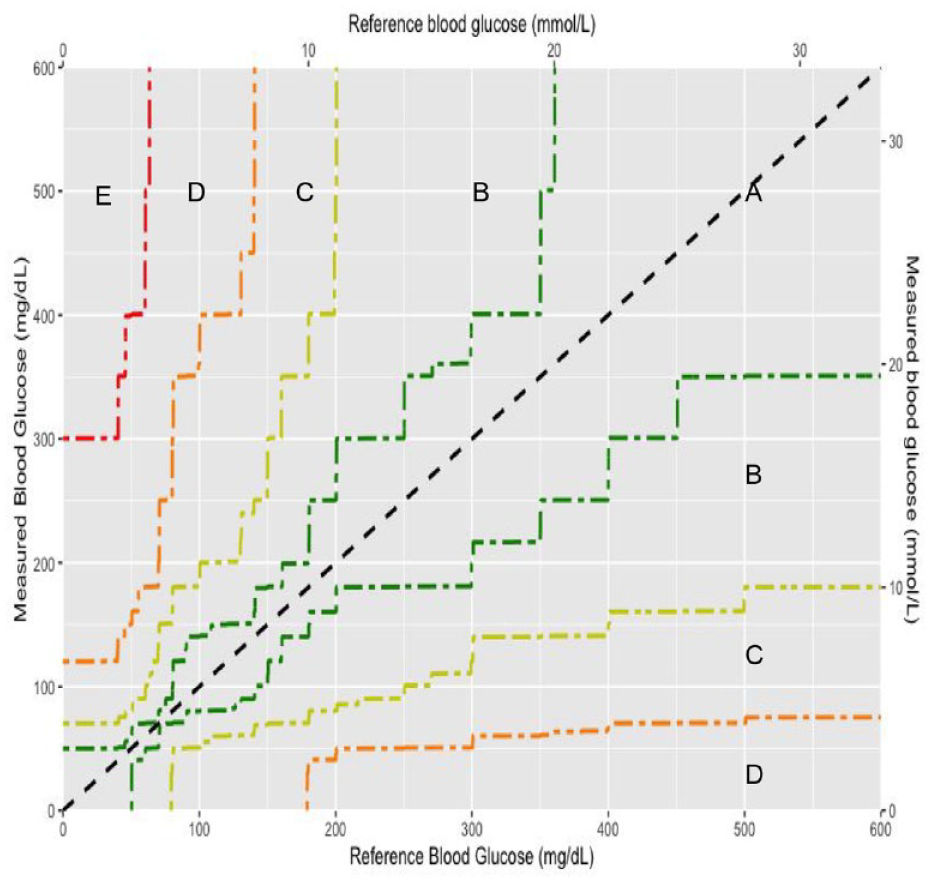
The PEG (also known as the Consensus error grid) was based on a survey of 100 attendees of the American Diabetes Association Scientific Sessions in 1994 with unknown expertise. This error grid was eventually published in 2000 by Parkes et al as an update to the CEG. 2 The x-axis and y-axis again correspond to the reference and BGM measurements, respectively, but they both extend from 0 to 550 mg/dL. The PEG superimposed over the axes of the SEG is shown in Figure 2. Each clinician was given two questionnaires, one for T1D and one for type 2 diabetes (T2D), each of which contained descriptions of hypothetical patients. The clinicians then assigned any plausible error in BG measurement to risk categories A to E, described in Table 1, based on the patient descriptions. The final consensus PEG was constructed by assigning the risk categories the values of 0, 1, 2, 3, and 4, taking the arithmetic average of the 100 clinician responses, and smoothing the boundaries. The T1D and T2D PEGs are similar but not identical, with the T1D PEG judging errors more strictly than the T2D PEG. 2 The T1D PEG is more widely used. 3
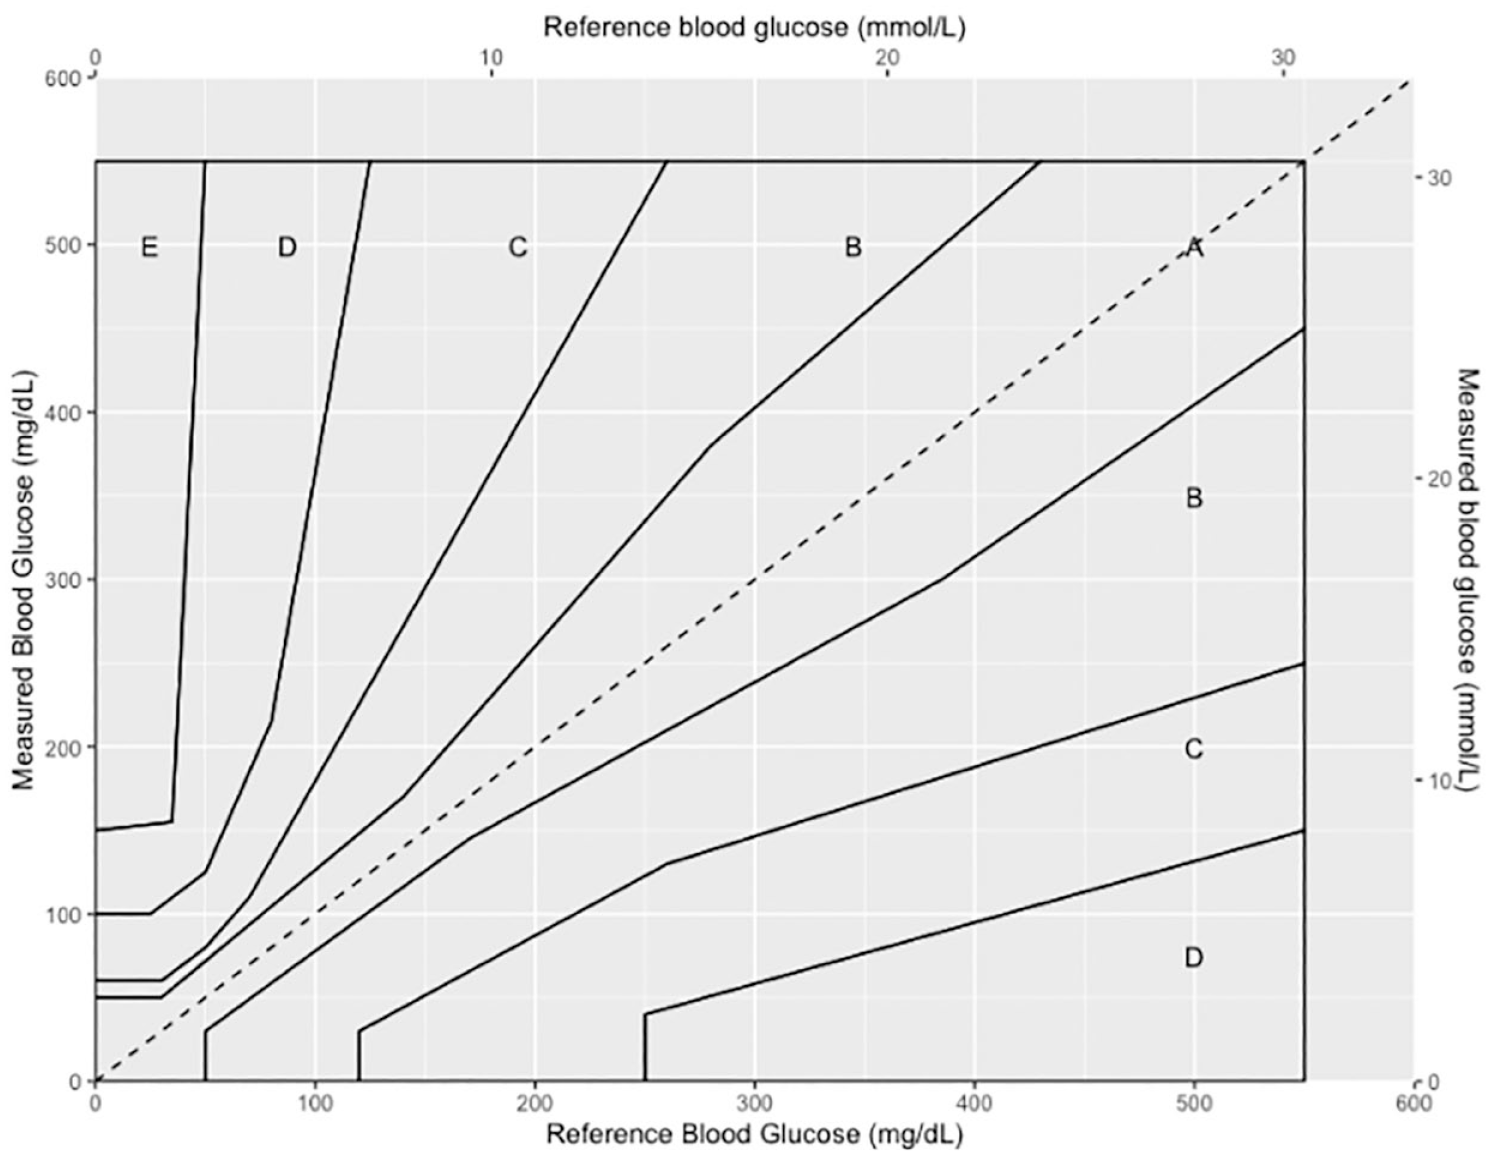
The Parkes error grid for type 1 diabetes superimposed over the axes of the Surveillance error grid.
Surveillance error grid
The Surveillance error grid (SEG) was published in 2014 by Klonoff et al to reflect changing practices and concerns in the diabetes field since the publication of the PEG. 3 The SEG surveyed 206 international clinicians and diabetes experts. Each respondent listed the BG level ranges that corresponded to (1) emergency treatment for low BG, (2) take oral glucose, (3) no action needed, (4) take insulin or exercise and eat less, and (5) emergency treatment for high BG. 3 The clinicians were then asked to respond to two scenarios that were randomly chosen from four possible patient scenarios. Each potential data pair of 600 reference BGs (1-600 mg/dL) and 600 measured BGs (1-600 mg/dL) was then assigned a risk score based on the average perception of clinical risk by surveyed diabetes experts. This led to a continuous risk spectrum that generally increases with distance from the no-risk identity line. Each possible combination of reference and index system results was assigned a clinical risk score from −4 to +4, resulting in the nine clinical impact zones described in Table 1, where −4 is extreme risk of hypoglycemia, +4 is extreme risk of hyperglycemia, and 0 is no risk. Each risk estimate from 0 to 4 and from 0 to −4 was further subdivided into increments of 0.5, creating 15 total risk zones. Finally, the absolute values of the fifteen risk zones were combined into five risk zones with absolute risk values of 0 to 0.5 (Zone A), >0.5 to 1.5 (Zone B), >1.5 to 2.5 (Zone C), >2.5 to 3.5 (Zone D), and >3.5 (Zone E). The final error grid, shown in Figure 3, is color-coded by the absolute value of the nearly continuous risk estimates, where green indicates no risk, yellow indicates slight risk, orange indicates moderate risk, red indicates great risk, and brown indicates extreme risk. 3 Unlike the PEG, the borders between the zones of the SEG were not smoothed. The zone boundaries of the SEG are shown in Figure 4.
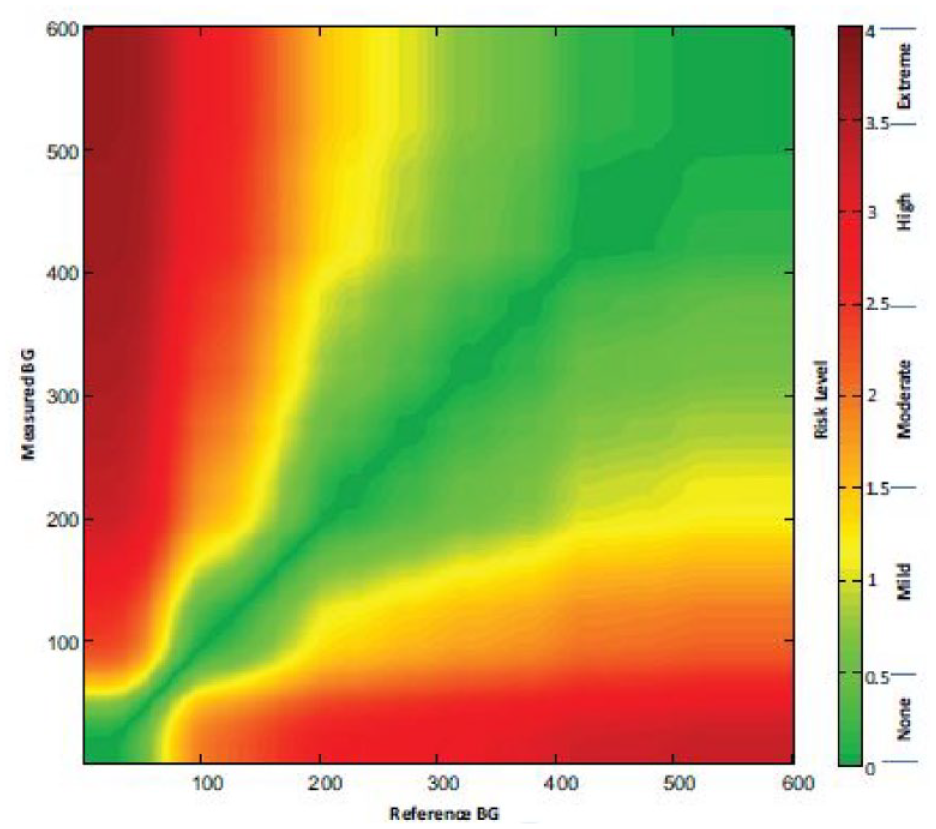
The color-coded continuous Surveillance error grid. Reproduced from Klonoff et al. 3
The zone boundaries of the Surveillance error grid. Zone A (green) indicates no risk, Zone B (yellow) indicates slight risk, Zone C (orange) indicates moderate risk, Zone D (red) indicates great risk, and Zone E (brown) indicates extreme risk.
As with the CEG and PEG, the x-axis and y-axis of the SEG correspond to reference and index measurements, respectively. However, the two axes of the SEG both extend from 0 to 600 mg/dL, while the CEG axes extend from 0 to about 450 mg/dL and the PEG axes extend from 0 to 550 mg/dL. Figure 5 shows the CEG, PEG, and SEG on the same axes.
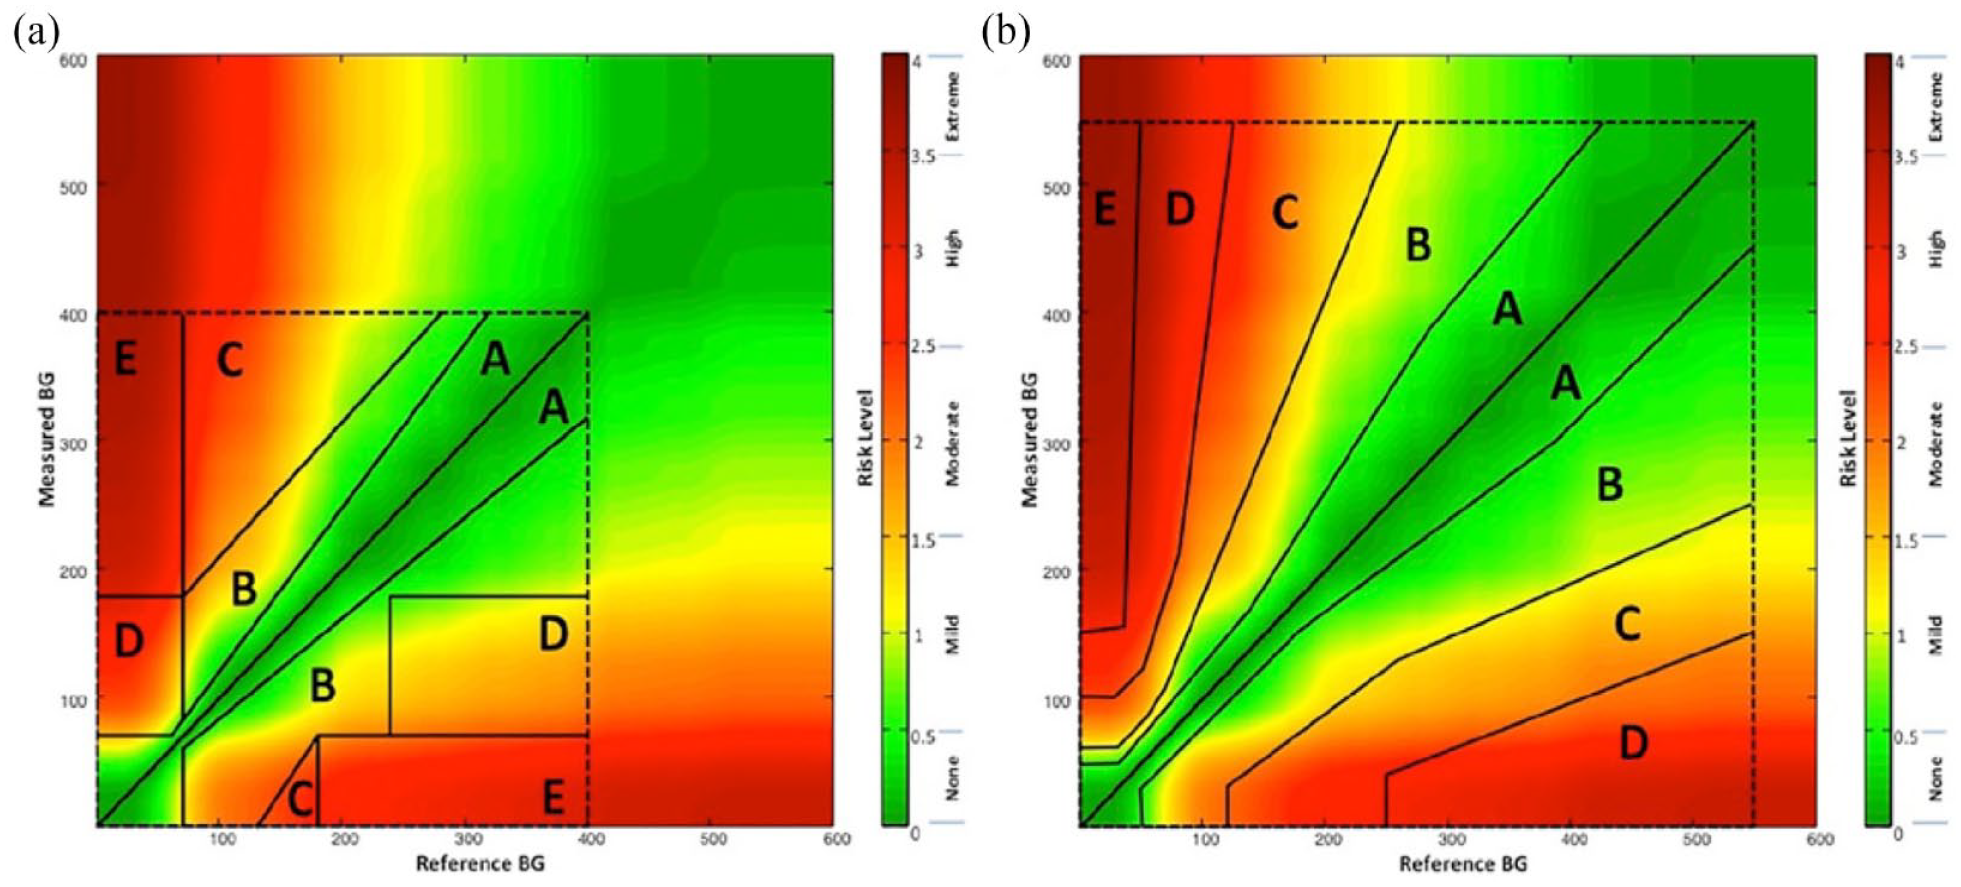
Comparison of the CEG, PEG, and SEG boundaries. (a) The CEG superimposed over the continuous color-coded SEG. (b) The PEG superimposed over the continuous color-coded SEG. Reproduced from Klonoff et al. 3
Currently, with all three error grids, every data pair within a zone of risk is assigned the same risk score. However, there is an additional alternate method for using the SEG, which would be to assign every data pair a unique risk score down to two decimals. The SEG can therefore assign a global risk score to a dataset without lumping points together into risk zones. This produces a single-number risk score corresponding to the average risk in the dataset and avoids the discrete increases in risk between points on either side of a zone boundary. To our knowledge, there are no publications that use the SEG to generate a global risk score for a dataset.
Advantages of the SEG Compared With the CEG and PEG
The SEG reflected changing practices and concerns in the diabetes field since the development of the two most widely used error grids, the CEG in 1987 and the PEG in 2000. 3 These differences include the adoption of the results of the Diabetes Control and Complications Trial (DCCT) into standard care. This study demonstrated that maintaining BG concentrations at near-normal levels using multiple daily injections or insulin pump therapy could mitigate long-term complications in people with diabetes. 5 However, the CEG was published prior to the DCCT results, and the PEG was constructed using a 1994 survey that took place less than a year after DCCT publication. Although the results of these trials have influenced treatment and therapy decisions made by health care professionals (HCPs), they are not reflected in the CEG and the PEG. The DCCT also found increased rates of hypoglycemia among those using insulin, 6 and population-based studies in the 2000s, such as Action to Control Cardiovascular Risk in Diabetes, A Diabetes Outcome Progression Trial, and the Veterans Affairs Diabetes Trial, increased awareness of the frequency and consequences of hypoglycemia, which continues to be a significant barrier facing people with diabetes.7-9 These findings may have contributed to a stricter boundary among clinicians in terms of the errors that can be tolerated to mitigate the risk of hypo- and hyperglycemia. 3
After the CEG and PEG were published, new short-acting analog insulins with faster absorption and shorter duration of action were developed, with the first, Lispro, being approved in 1996. 10 The more widespread usage of analog insulins, which improved glycemic control and reduced complications, 10 along with insulin delivery pumps have changed the field of diabetes care and increased clinicians’ expectations of what type of glucose control should be achieved. At the time of development of the CEG and PEG, however, BGMs were newer and less accurate, and clinicians at the time would have had lower performance expectations compared with during the development of the SEG. In addition, no CGMs were cleared for real-time use by the US Food and Drug Administration (FDA) at that time. As a result, people with diabetes, clinicians, and regulators are now more concerned about inaccurate BG monitoring systems and expect high-performing systems.
Finally, the SEG reflects a consensus of 206 diabetes experts (mostly clinicians), compared with the five clinician authors who developed the CEG and the 100 clinicians who were surveyed for the PEG. These 206 participants included both US and non-US experts. The authors of the SEG determined a significant difference in the way US and non-US HCPs defined A to B, C to D, and D to E zone boundaries, but, because of the relatively small numerical differences, decided against creating two separate error grids. 3 Thus, the SEG reflects international consensus and can be applicable to other countries in addition to the United States.
Flaws With the SEG
Despite its advantages compared to earlier glucose monitor error grids, five flaws have decreased the appeal of the SEG: (1) a confusing number of zones, (2) a lack of readily available software for calculating zone distribution, (3) an admonition not to use this grid for CGM data, whereas other earlier grids did not specifically prohibit their use for this purpose (possibly because they were developed before CGMs were widely used), (4) a lack of a clinical accuracy metric for describing trend data of CGMs, and (5) granularity due to a lack of smoothed borders.
Although the granularity of the SEG makes it flexible to an individuals’ preferred risk tolerance, it can be difficult to interpret given that each individual data point in a data set can be assigned its own clinical risk to create a global risk score. A data set can also be presented as a distribution of the percentages of data points within each of the risk zones. However, the SEG can define either five, nine, or 15 risk zones, while the CEG and PEG have only five risk zones. Other error grids that have been developed also only use four or five zones, including a recently developed hypoglycemia error grid 11 and an error grid developed for measuring arterial pressure. 12 Based on comments we received at the Diabetes Technology Society after the SEG was published, we have learned that users prefer error grids that contain five zones.
The difficulty in using and interpreting the SEG was initially compounded by a lack of readily available dedicated software, a dedicated website, or a mobile app. Such software was eventually posted on the Diabetes Technology Society website but requires updating.
The SEG was developed specifically for point-of-care BG monitoring techniques. Real-time CGM data were not available in 2014. However, real-time CGMs are now widely used non-adjunctively for monitoring glucose concentrations in people with diabetes outside and occasionally inside the hospital. The SEG does not address the clinical accuracy of CGMs, nor does it account for trend accuracy. Many clinicians believe that, for monitoring patients using CGMs, trend information is as important or even more important than point accuracy, especially in the near hypoglycemia ranges. Therefore, it is important to have an idea of the accuracy of the trend information of their patients’ CGMs. Since CGMs provide both data points and trend information, the clinical accuracy of these devices for both measurements must now be addressed if the applicability of the SEG is to be extended from real-time BGM data to real-time CGM data. A continuous four-dimensional error grid accounting for both point accuracy and trend accuracy was proposed by Kovatchev et al. 13 It contains all important point and trend information on a single grid. However, it is based on the 1987 CEG borders. In addition, many clinicians consider it to be complicated, and it is not widely used. An updated SEG could be developed to account for both point accuracy and trend accuracy in modern real-time CGMs.
The SEG also has non-linear borders between risk zones that are unintuitive. A lack of smooth borders allows expert opinions to be presented accurately but could also be considered an artifact of how the expert opinions were obtained. This can lead to irregularities because experts do not uniformly allow for more error for the same amount of risk as the glucose levels rise. Most error grids—even those developed by far fewer than 206 experts, such as the PEG—become easier to use if the borders of zones of constant risk from expert surveys can be smoothed.
Conclusion
The SEG assesses the clinical risk of BGM errors and is an important metric for post-market surveillance as well as manufacturer and FDA decision-making. It accounts for new advances in the field of diabetes care since the development of the two other most widely used error grids, the CEG and the PEG, both of which are now outdated. However, the SEG also has interpretability and usability issues. We need an updated SEG to address these issues in addition to expanding its use to real-time CGMs by incorporating trend accuracy.
Footnotes
Acknowledgements
The authors thank Annamarie Sucher-Jones for her expert editorial assistance.
Abbreviations
AR, agreement rate; BG, blood glucose; BGM, blood glucose monitor; CEG, Clarke error grid; CGM, continuous glucose monitor; DCCT, Diabetes Control and Complications Trial; FDA, Food and Drug Administration; HCPs, health care professionals; MARD, mean absolute relative difference; PEG, Parkes error grid; SEG, surveillance error grid; T1D, type 1 diabetes; T2D, type 2 diabetes.
Declaration of Conflicting Interests
The author(s) declared the following potential conflicts of interest with respect to the research, authorship, and/or publication of this article: DCK is a consultant for Afon, Better Therapeutics, Integrity, Lifecare, Nevro, Novo, and Thirdwayv. TT, REA, and MAK have no disclosures.
Funding
The author(s) received no financial support for the research, authorship, and/or publication of this article.