
Abstract
Introduction:
An error grid compares measured versus reference glucose concentrations to assign clinical risk values to observed errors. Widely used error grids for blood glucose monitors (BGMs) have limited value because they do not also reflect clinical accuracy of continuous glucose monitors (CGMs).
Methods:
Diabetes Technology Society (DTS) convened 89 international experts in glucose monitoring to (1) smooth the borders of the Surveillance Error Grid (SEG) zones and create a user-friendly tool—the DTS Error Grid; (2) define five risk zones of clinical point accuracy (A-E) to be identical for BGMs and CGMs; (3) determine a relationship between DTS Error Grid percent in Zone A and mean absolute relative difference (MARD) from analyzing 22 BGM and nine CGM accuracy studies; and (4) create trend risk categories (1-5) for CGM trend accuracy.
Results:
The DTS Error Grid for point accuracy contains five risk zones (A-E) with straight-line borders that can be applied to both BGM and CGM accuracy data. In a data set combining point accuracy data from 18 BGMs, 2.6% of total data pairs equally moved from Zones A to B and vice versa (SEG compared with DTS Error Grid). For every 1% increase in percent data in Zone A, the MARD decreased by approximately 0.33%. We also created a DTS Trend Accuracy Matrix with five trend risk categories (1-5) for CGM-reported trend indicators compared with reference trends calculated from reference glucose.
Conclusion:
The DTS Error Grid combines contemporary clinician input regarding clinical point accuracy for BGMs and CGMs. The DTS Trend Accuracy Matrix assesses accuracy of CGM trend indicators.
Introduction
For clinical decision-making in diabetes care, clinicians must have confidence and knowledge of the accuracy of devices measuring glucose levels. An error grid describes the clinical point accuracy of a glucose monitor compared with reference values, where reference/monitor pairs are assigned to clinical risk zones. To date, the most widely used error grids for glucose measurements are the Clarke Error Grid (CEG), 1 the Parkes Error Grid (PEG) (also known as the Consensus Error Grid), 2 and the Surveillance Error Grid (SEG). 3 All three were developed solely for blood glucose monitors (BGMs) prior to the widespread availability of nonadjunctive continuous glucose monitors (CGMs).4,5 “Non-adjunctive” means that the CGM may be used to determine insulin dosing without a confirmatory BGM result. 6
Error grids for glucose are based on clinical risk scores determined by diabetes experts and reflect contemporaneous knowledge and evidence. Thus, risk scores may change over time.
The SEG, developed in 2014, accounts for advancements in diabetes care that the CEG and PEG, developed in 1987 and 1994, respectively, do not. 7 These advances include the results of the Diabetes Control and Complications Trial (DCCT), 8 which demonstrated the benefits of tight glycemic control. To achieve optimal control, accurate glucose monitoring tools are needed. To demonstrate accuracy of glucose monitors, performance metrics, such as error grids, have become necessary. The DCCT was published six years after the CEG was developed and less than one year before the PEG was developed. The SEG also accounts for the findings of other studies from the 2000s that focused on the frequency and negative consequences of hypoglycemia.9-12 In addition, technological developments have occurred since the CEG and PEG were reported. These include the introduction of short-acting insulin analogs, 13 improved accuracy of various types of BGMs, 14 and increased usage of new insulin delivery technologies by people with diabetes. These developments have greatly affected diabetes management and the expectations that clinicians have for the performance of glucose monitoring devices. Finally, unlike prior error grids, the SEG also reflects a large international consensus of 206 diabetes experts. 3
The original version of the SEG has several usability issues. 7 Based on user preference, the SEG defines sets of five, nine, or 15 risk zones and can assign either a continuous or categorical risk score to any given reference/monitor pair. 3 This level of granularity, combined with nonlinear risk zone borders, can make using the SEG challenging. Finally, the SEG, CEG, and PEG do not account for the point or trend accuracy of nonadjunctive, real-time CGM measurements, which are increasingly becoming a mainstay for glycemic monitoring by people with both type 1 and type 2 diabetes.
Unlike BGMs, CGMs provide an indication of trend—the rate and direction of change in glucose levels. 15 People with diabetes often consider trend information in addition to point information when using CGM data to determine an insulin dose.16,17 A recent literature review on the accuracy of CGMs found that 21% of the included studies reported trend accuracy results. However, no widely used tool for quantifying trend accuracy has been developed. 18 A Continuous Glucose Error Grid (CG-EGA) was introduced in 2004, defining both point and trend accuracy, and introducing a trend accuracy matrix. At the time, this analysis was considered complex and has not been widely adopted. 19 Currently, a simple modern tool reporting rate of change errors is required to assess the clinical accuracy of CGM trend indicators, just as an updated user-friendly tool is needed to assess the clinical accuracy of point measurements. 7
To update and improve usability of the SEG for assessing point accuracy and to develop an approach to evaluating the accuracy of CGM trend indicators, Diabetes Technology Society (DTS) convened a panel of 89 international experts in glucose monitoring. Panelists were from 21 countries (Australia, Austria, Brazil, Canada, China, Colombia, Czech Republic, Denmark, Germany, India, Italy, Japan, Luxembourg, New Zealand, Republic of Korea, Saudi Arabia, Singapore, Sweden, Switzerland, the United Kingdom, and the United States) and included endocrinologists, other clinicians, clinical chemists, biomedical engineers, and physiologists. Hospitals, government agencies, and professional organizations represented include the National Institutes of Health, the Centers for Disease Control and Prevention, the American Diabetes Association, the Association for Diagnostics & Laboratory Medicine, and DTS. Guided by the Panel, DTS created browser-based software to display the DTS Error Grid and Trend Accuracy Matrix using user data, in units of both milligrams per deciliter (mg/dL) and millimoles per liter (mmol/L).
The DTS Error Grid and Trend Accuracy Matrix were developed primarily for device developers, clinical researchers, and regulatory bodies to provide modern, easy-to-use methods for rigorous evaluation of both point and trend accuracy in glucose monitoring devices. These tools are intended as instruments in the development and certification of current generation BGMs and CGMs, as well as future technologies for measuring glucose.
Methods
Fitting the Original SEG Risk Zones With a Continuous Function
The SEG accommodates reference/monitor values from 1 to 600 mg/dL (0.056-33.3 mmol/L). In the original SEG project, 206 diabetes experts classified glucose concentrations requiring five types of responses: emergency treatment for low blood glucose (BG), take oral glucose, no action needed, take insulin, and emergency treatment for high BG. 3 Clinical risk depends on how each action would differ if based on the monitor measurement instead of the reference measurement. The response risk zone boundaries were used to divide the 600 × 600 grid into 25 regions or “boxes.” The boxes along the 45° diagonal of agreement were assigned a risk score of 0. The experts then assigned the other 20 boxes to slight (=1), moderate (=2), high (=3), or extreme (=4) risk. Averaging the risk scores across all experts resulted in a 600 × 600 grid of 360,000 risk scores. The SEG divided these risk scores into five risk zones without smoothing the risk zone boundaries: 0-0.5 (Zone A = no risk); >0.5-1.5 (Zone B = slight risk); >1.5-2.5 (Zone C = moderate risk); >2.5-3.5 (Zone D = great risk); and >3.5 (Zone E = extreme risk).
The resulting risk zones had irregular boundaries with residual “boxiness.” 7 Nearby data pairs that represented the same relative error were assigned to different risk zones, which is not clinically realistic. To remedy this visually confusing pattern in the SEG, a continuous function was fitted to the risk scores.
The fitting process started with the scores associated with all 360,000 risk pairs weighted by the frequency with which they occurred in a combined data set of 5542 reference/monitor pairs from an accuracy study of 18 marketed BGMs. 20 The original SEG risk scores and other sources indicated that, for both BGMs and CGMs, clinicians considered differences where the monitor measurement overestimates the reference value to be riskier than those where the monitor measurement underestimates the reference value. Therefore, the continuous function was fitted separately to the risk scores for monitor glucose > reference glucose and the risk scores for monitor glucose < reference glucose. In addition, the original SEG risk scores indicated that, for data pairs where both the monitor and the reference values were ≤50 mg/dL (2.78 mmol/L), experts assigned “None” to the risk of an incorrect action in response to the monitor measurement. In other words, the region with both reference ≤50 mg/dL (2.78 mmol/L) and monitor ≤50 mg/dL (2.78 mmol/L) is included in Zone A. Also, most of the clinicians participating in development did not differentiate between values ≤50 mg/dL (2.78 mmol/L). This was tantamount to treating all values ≤50 mg/dL (2.78 mmol/L) as the same. All errors were scaled according to log(monitor) – log(reference), so we have the same space from an error of 0% to −20% as from 0% to +25%, from 0% to −33% as from 0% to +50%, from 0% to −50% as from 0% to +100%, and so on.
Point Accuracy
The DTS Panel determined that the criteria for BGM accuracy and nonadjunctive CGM accuracy should be the same. Using the fitted continuous risk function, the boundaries of the risk zones for the DTS Error Grid were defined as: 0-0.5 (Zone A), >0.5-1.5 (Zone B), >1.5-2.5 (Zone C), >2.5-3.5 (Zone D), and >3.5 (Zone E). The risk function is negative when monitor glucose < reference glucose, so its absolute value is used.
Clinical point accuracy data from two BGMs out of the existing set of 18 marketed BGMs 20 and one combined CGM data set were evaluated using the DTS Error Grid. The BGMs were labeled as BGM A, which was a lower accuracy BGM relative to others in the study with 319 reference/monitor pairs, and BGM B, which was a higher accuracy BGM with 317 reference/monitor pairs. Reference values were obtained by performing a deep fingerstick nearly simultaneously and testing the sample on a lab analyzer (2300 Stat Plus Glucose Lactate Analyzer; YSI Life Sciences, Yellow Springs, Ohio, USA). The CGM data set was created by combining data from nine CGM accuracy data sets submitted by members of the Panel. These were independent CGM accuracy studies performed in the United States and Europe with a variety of reference instruments.
Because CGMs measure glucose in the interstitial fluid, if the glucose level is changing, then the CGM reading might lag behind the reference measurement. The CGM measurements were paired with reference measurements as follows: (1) start with the reference measurement; (2) search for the closest CGM measurement within the five minutes AFTER the reference measurement; (3) if there is none, then search for the closest CGM measurement within five minutes BEFORE the reference measurement; and (4) if there still is none, then there is no CGM measurement to compare with the reference measurement, and the reference measurement is excluded from the analysis. Differing lag times between glucose levels in venous blood, capillary blood, and interstitial fluid may account for some of the decreased accuracy between CGMs compared with BGMs.
Relationship Between DTS Error Grid Percent in Zone A and Mean Absolute Relative Difference
Analytical accuracy is a measure of nearness of the measured value to the known true value, whereas clinical accuracy assesses error in terms of its impact on clinical decision-making. We investigated the relationship between the percent of reference/monitor pairs in Zone A (pZA) of the DTS Error Grid, which is a metric of clinical accuracy, and the mean absolute relative difference (MARD), which is a metric of analytical accuracy. Generally, as the pZA increases, MARD decreases.
Assuming relative errors have a log-normal distribution with a median of 0%, an approximate nonlinear mathematical relationship between pZA and MARD was derived (Supplemental Appendix 1). Panel members provided results from 22 BGM accuracy studies and nine CGM accuracy studies. We calculated the pZA and MARD for each study and plotted them along with the approximate nonlinear mathematical relationship for comparison. Then, we fitted the data points with a line. The equation for that line provides an approximate conversion of pZA to MARD or from MARD to pZA. This approach provides a direct relationship between analytical and clinical accuracy measures to allow better comparison across prior and future studies, which may not report both.
Trend Accuracy
Indicators for reported CGM trends were defined as follows:
+2: Rising more than 2 mg/dL (0.11 mmol/L) per minute
+1: Rising greater than 1 mg/dL (0.056 mmol/L) per minute and less than or equal to 2 mg/dL (0.11 mmol/L) per minute
0: Changing less than or equal to 1 mg/dL (0.056 mmol/L) per minute
−1: Falling greater than 1 mg/dL (0.056 mmol/L) per minute and less than or equal to 2 mg/dL (0.11 mmol/L) per minute
−2: Falling more than 2 mg/dL (0.11 mmol/L) per minute
For CGMs that have seven instead of five trend indicators, the +2 indicator includes both +2 and +3 CGM trend indicators; similarly, the −2 indicator includes both −2 and −3 CGM trend indicators. The CGM trend indicators are the arrows that are displayed. Currently, the only way to obtain CGM trend indicators for inclusion in a data set is to record them manually because a digital record of trends is not available from a marketed CGM.
A concurrence matrix with columns representing the reference values and rows representing index measurements can be used to assess the accuracy of the CGM-reported trend indicators. Here, the index measurement is the CGM trend indicator. The concurrence matrix serves to compare the trends detected by the CGM against reference trends, classified by their rate of change. Each cell in this matrix contains the count of occurrences for each combination of detected and actual trends. With five ordered trend indicators, this creates a 5 × 5 concurrence matrix. The 25 cells are categorized into risk levels based on the potential clinical impact of discrepancies between the measured and actual trends.
The five trend risk categories are the following:
Same as Reference (No Risk)
CGM Underestimate (Mild Risk)
CGM Overestimate (Moderate Risk)
CGM Extreme Underestimate (High Risk)
CGM Extreme Overestimate (Extreme Risk)
We are using “overestimate” to mean the CGM says the rate of change is “higher” than the reference rate of change. If the reference rate of change is negative, then “higher” can mean the CGM-reported trend is less negative, zero, or positive. If the reference rate of change is zero, then “higher” means the CGM-reported trend is positive. If the reference rate of change is positive, then “higher” means the CGM-reported trend is more positive. Similarly, we are using “underestimate” to mean the CGM says the rate of change is “lower” than the reference rate of change. If the reference change is positive, then “lower” can mean the CGM-reported trend is less positive, zero, or negative. If the reference rate of change is zero, then “lower” means the CGM-reported trend is negative. If the reference rate of change is negative, then “lower” means the CGM-reported trend is more negative.
This trend concurrence matrix differs from the concurrence matrix shown in Clinical and Laboratory Standards Institute (CLSI) document POCT05 (the Performance Metrics for Continuous Interstitial Glucose Monitoring guideline from the CLSI) 15 and the matrix recommended by Eichenlaub et al. 21 In particular, the CGM indicators (row headings) are ordered descending from +2 to −2. The complete agreements between CGM and reference trend are thus on the diagonal from lower left to upper right. This is similar to the diagonal in the trend accuracy matrix proposed by Clarke and Kovatchev. 22
The two cells corresponding to “CGM Extreme Overestimate” (trend risk category 5) are based on the US Food and Drug Administration’s (FDA) requirement for integrated CGM (iCGM) systems that no more than 1% of iCGM trend indicators show a positive glucose rate of change greater than 1 mg/dL/min (0.056 mmol/L/min) when the corresponding true negative glucose rate of change is less than −2 mg/dL/min (−0.111 mmol/L/min) as determined by the reference device.23,24 The two cells corresponding to “CGM Extreme Underestimate” (trend risk category 4) are based on the FDA’s requirement that no more than 1% of iCGM trend indicators show a negative glucose rate of change less than −1 mg/dL/min (−0.056 mmol/L/min) when the corresponding true positive glucose rate of change is greater than 2 mg/dL/min (0.111 mmol/L/min) as determined by the reference device. 23
The reference trend is calculated from the reference glucose measurements as follows:
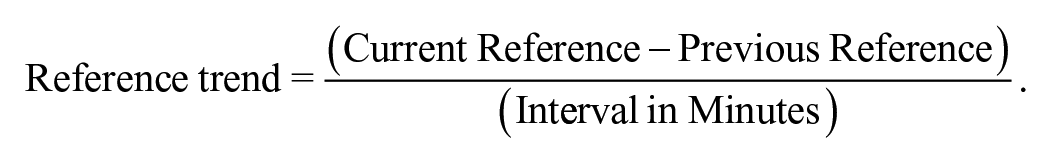
“Current Reference” is defined as a reference reading within five minutes of the CGM reading associated with the CGM’s reported trend indicator. “Previous Reference” is defined as the closest reference reading at least 15 minutes prior and up to 45 minutes prior to “Current Reference.” If the previous reference reading was >45 minutes prior to the current reference reading, then no reference trend is calculated.
We present the DTS Trend Accuracy Matrix results for a combined CGM trend accuracy data set. Details are provided in the “Results” section.
Results
DTS Error Grid
In the data set of 5542 reference/monitor pairs from an accuracy study of 18 marketed BGMs, the fitted, straight-line risk zones had the same number of points as the original SEG. However, 134 (2.6%) of the points in SEG Zone A were recategorized into DTS Error Grid Zone B and an equal number were recategorized from the SEG Zone B into DTS Error Grid Zone A. The exact coordinates of the zone boundaries in the DTS Error Grid are presented in Supplemental Appendix 2.
The DTS Error Grid, with data from two BGM data sets and one combined CGM data set, is shown in Figure 1. BGM A is shown in Figure 1a, BGM B is shown in Figure 1b, and the combined CGM data set is shown in Figure 1c. For both BGMs, the reference measurements ranged from 57 to 372 mg/dL (3.16-20.6 mmol/L). The CGM data set was created by combining data from nine CGM accuracy studies of 75 participants over a total of 100 study days. Each participant’s CGM contributed data from one to four study days with an average of 40 reference measurements per study day and a total of 3952 reference measurements. The interval between reference measurements was usually 15 minutes, but could vary.
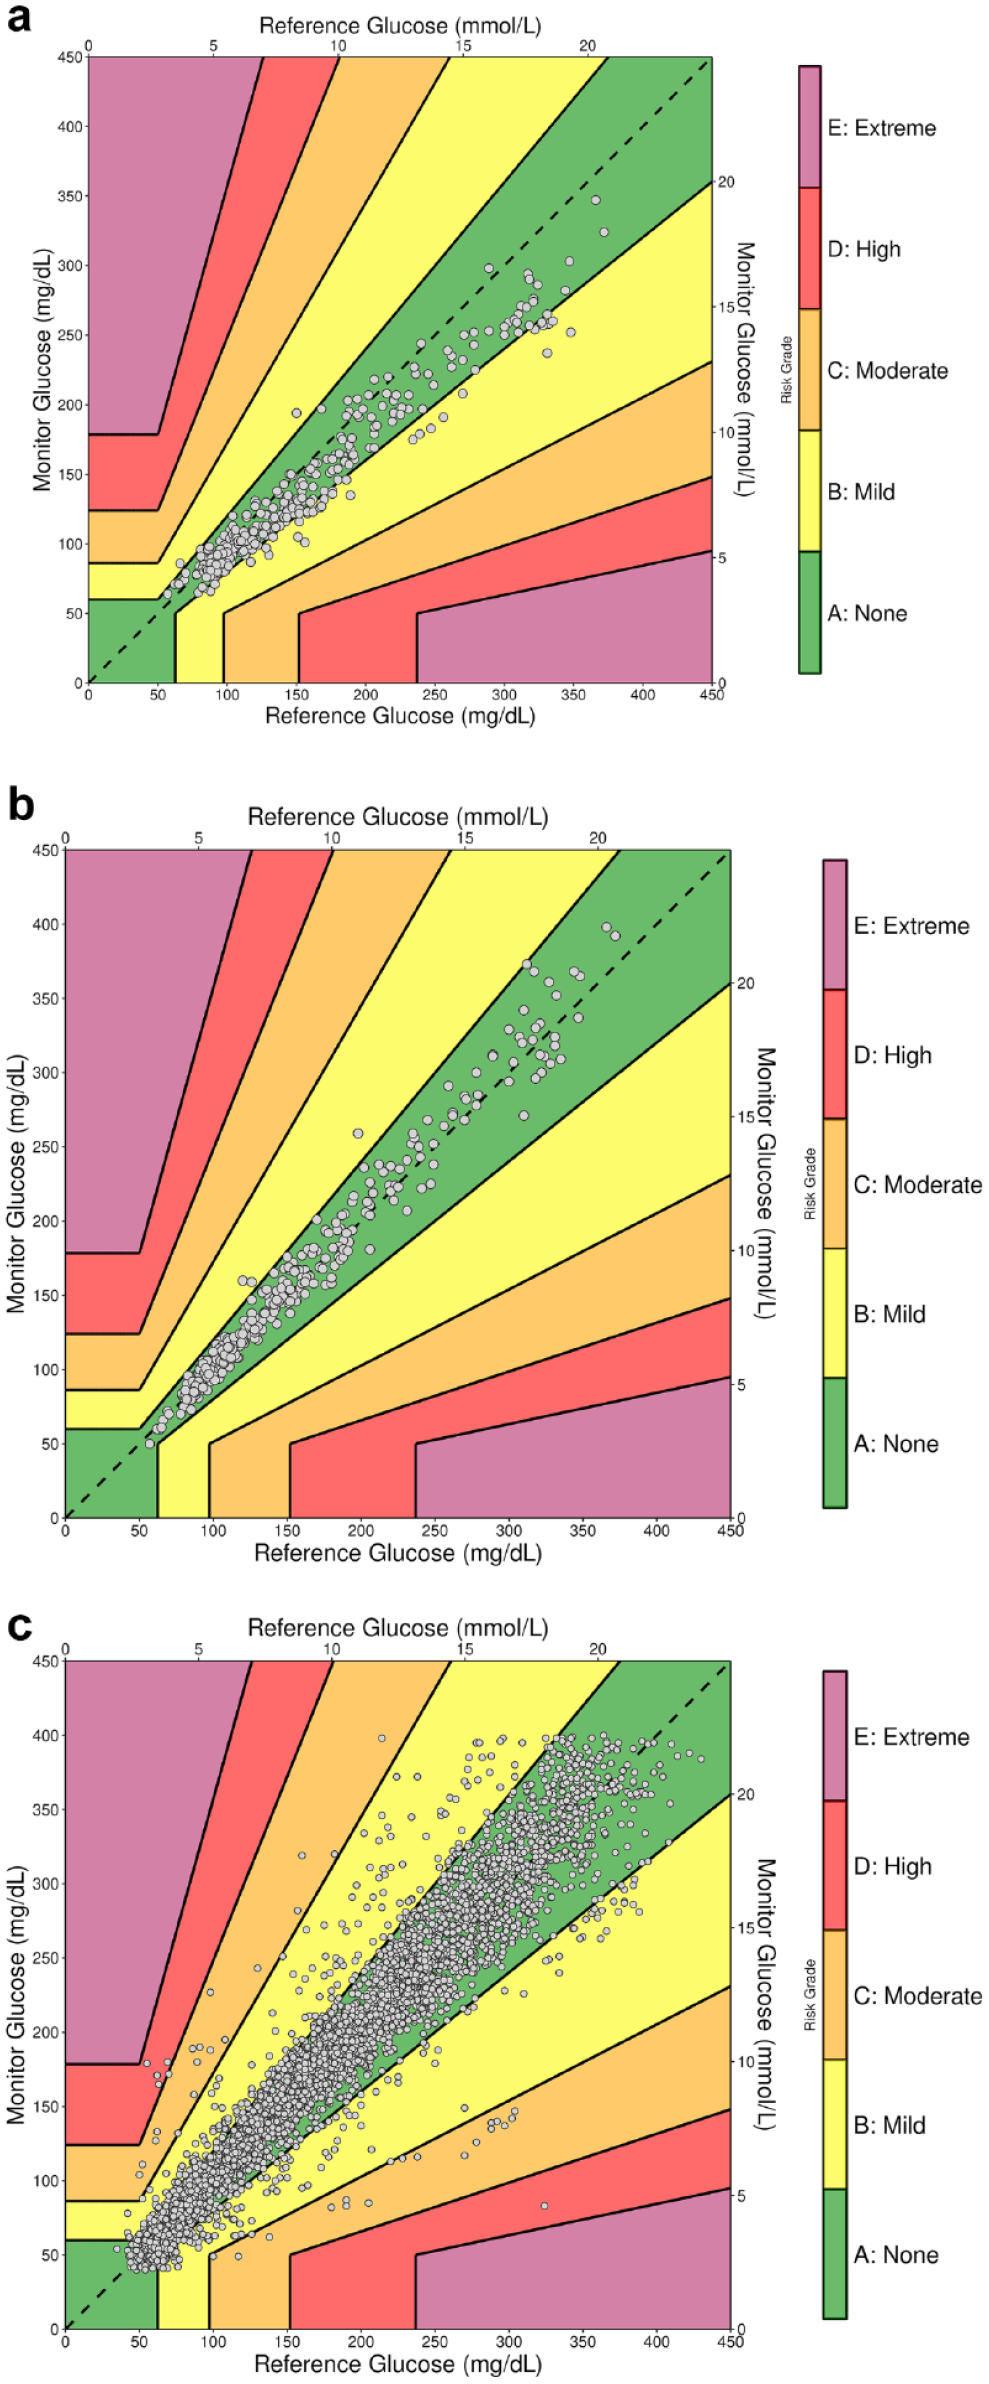
The Diabetes Technology Society Error Grid for (a) BGM A, (b) BGM B, and (c) the CGM combined accuracy data set of 3952 reference/monitor data pairs.
The plots in Figure 1 are only 450 × 450 mg/dL (25.0 mmol/L) because there were no reference or monitor values >450 mg/dL (25.0 mmol/L) in any of the three data sets. The DTS Error Grid software allows the user to restrict the axis boundaries. Table 1 summarizes the data from the two BGM clinical point accuracy studies and the combined CGM accuracy study.
Summary Results From BGM A, BGM B, and the Combined CGM Accuracy Study.
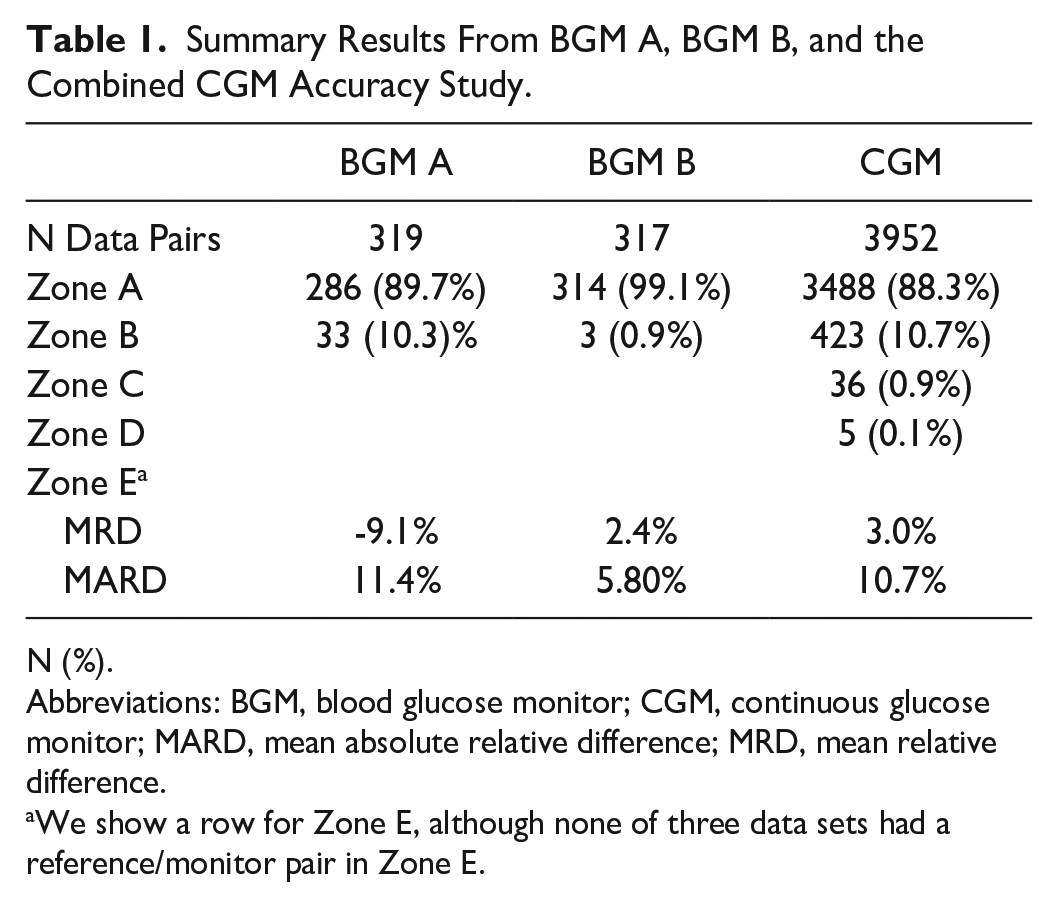
N (%).
Abbreviations: BGM, blood glucose monitor; CGM, continuous glucose monitor; MARD, mean absolute relative difference; MRD, mean relative difference.
We show a row for Zone E, although none of three data sets had a reference/monitor pair in Zone E.
In the study of 18 marketed BGMs, BGM A was considered inaccurate while BGM B was considered accurate. 20 The pZA was only 89.7% for BGM A versus 99.1% for BGM B. The combined CGM data set reflects the accuracy of the nine CGM data sets on which it was based. The pZA was 88.3%.
Relationship Between DTS Error Grid Percent in Zone A and MARD
For each of the 22 BGM accuracy studies and nine CGM accuracy studies, we determined the pZA of the DTS Error Grid and calculated the MARD. We plotted these results along with the approximate mathematical relationship between pZA and MARD in Figure 2. The approximate mathematical relationship assumes that relative errors have a log-normal distribution and a median error of 0% (Supplemental Appendix 1). For real data, the median error differs from 0%, so in Figure 2, the study results tended to be slightly above the curve for the theoretical relationship.
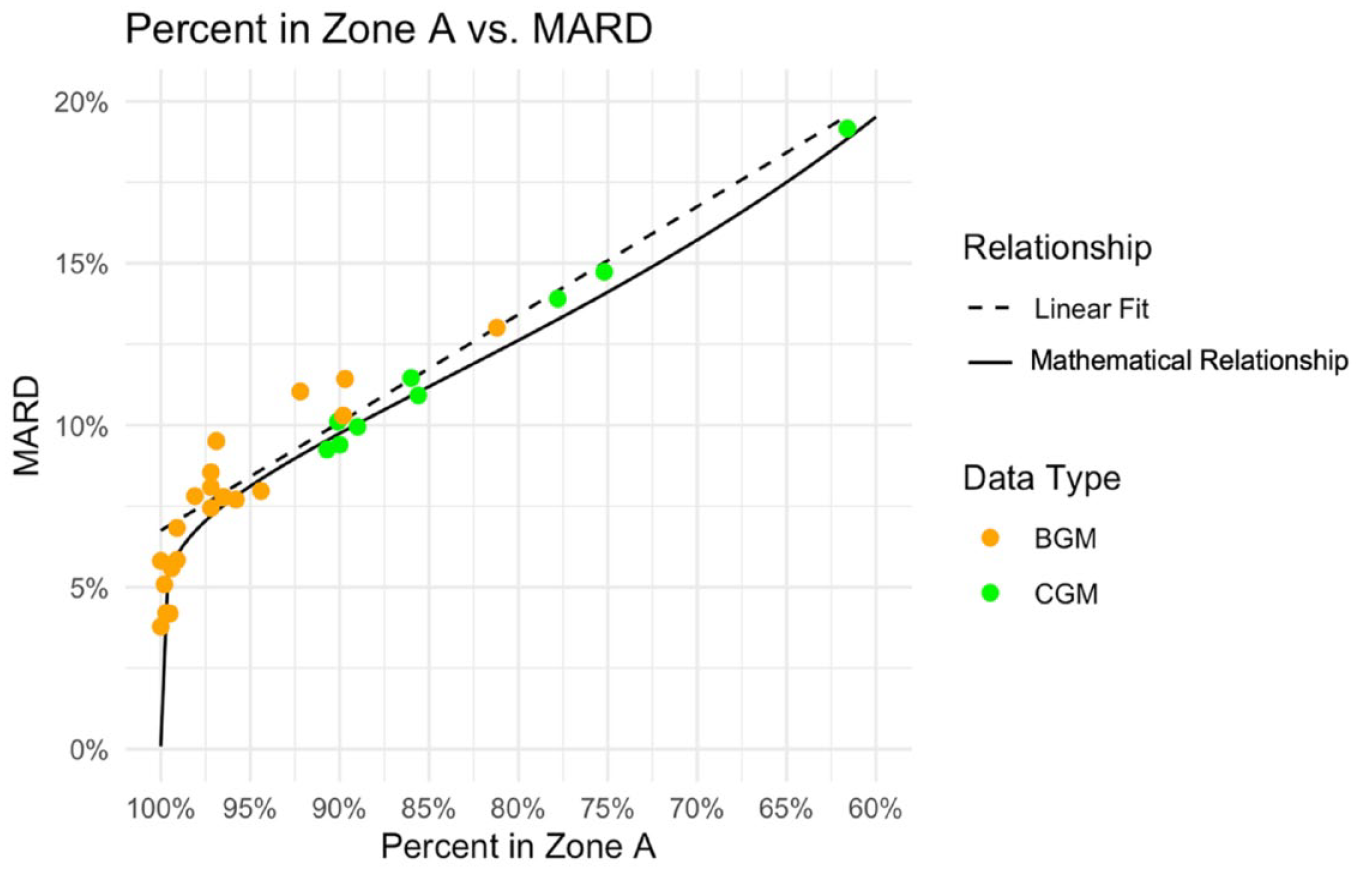
The mathematical relationship and line of best fit between the percent of data pairs in Zone A of the Diabetes Technology Society Error Grid and the MARD.
The line fitting the data is defined as follows:


A pZA of 90% is approximately consistent with a MARD of 10%. For every 1% increase in pZA, MARD decreases by 0.33%, and for every 1% decrease in MARD, pZA increases by 3%. A pZA greater than 99% could be consistent with any MARD <7%. The highest pZA for a BGM accuracy study was 99.8% and the MARD for that study was 5.1%.
Trend Accuracy Matrix
A CGM accuracy study data set that can be analyzed with the DTS Error Grid software consists of records with the fields specified in Table 2. The TREND field stores the CGM trend indicators and is not used for point accuracy but is compared with the calculated reference trend (see “Methods” section).
Required Fields for CGM Accuracy Study Data Sets That Can be Analyzed With the Diabetes Technology Society Error Grid Software.
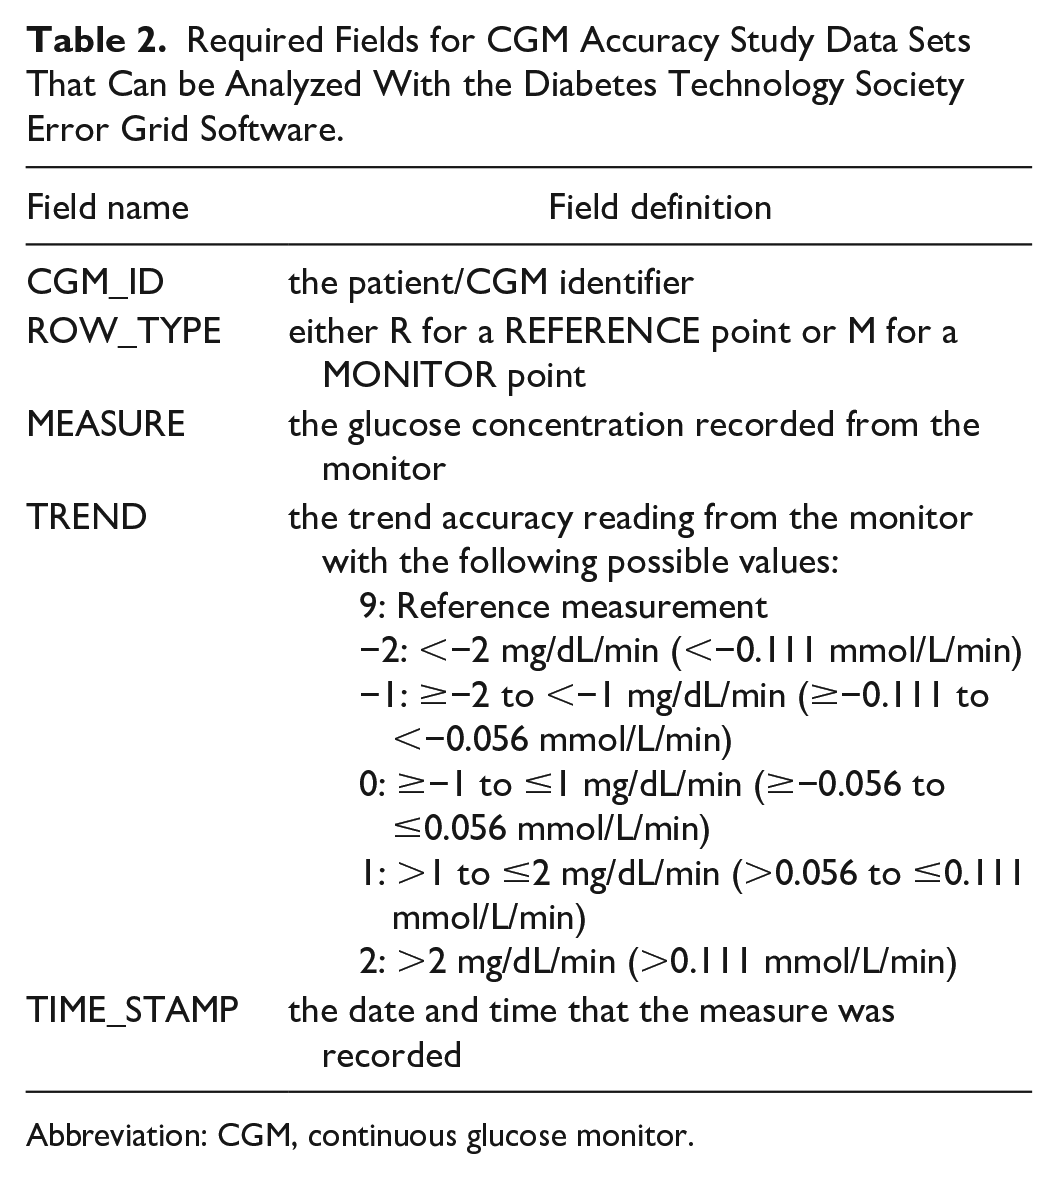
Abbreviation: CGM, continuous glucose monitor.
Following a similar strategy applied for the Error Grid, the DTS Trend Accuracy Matrix categorizes reference trend and monitor trend data pairs into five trend accuracy risk categories: (1) no risk (green), (2) mild risk (yellow), (3) moderate risk (orange), (4) high risk (red), and (5) extreme risk (purple). Overestimates of CGM trend (i.e., a more positive measured trend than reference trend) were determined by the Panel to be more dangerous than underestimates of CGM trend (i.e., a more negative measured trend than reference trend), given the risk of a person with diabetes accidentally administering excessive insulin and developing hypoglycemia, compared with the risk of accidentally withholding a dose of insulin and developing hyperglycemia.
Trend risk category 1 (no risk) includes data pairs where the CGM trend indicator is the same as the reference trend. Trend risk category 2 (mild risk) includes minor CGM underestimates of the reference trend by 1 to 3 bins of rate of change. Trend risk category 3 (moderate risk) includes minor CGM overestimates by 1 to 3 bins of rate of change. Trend risk category 4 (high risk) includes major CGM underestimates by 3 or 4 bins of rate of change (i.e., the CGM indicates glucose is falling by at least 1 mg/dL/min [0.056 mmol/L/min] when it is rising by at least 2 mg/dL/min [0.111 mmol/L/min]). Trend risk category 5 (extreme risk) includes major CGM overestimates by 3 or 4 bins of rate of change (i.e., the CGM indicates glucose is rising by at least 1 mg/dL/min [0.056 mmol/L/min] when it is falling by at least 2 mg/dL/min [0.111 mmol/L/min]).
The main DTS Trend Accuracy Matrix applies when the reference glucose level is any value ≤600 mg/dL (33.3 mmol/L) and accounts for the FDA requirement for iCGM systems (discussed in Methods), which is also independent of reference glucose level. However, the DTS Panel recommended additional trend accuracy analysis that subdivides the reference values into <100 mg/dL (5.56 mmol/L), 100 to 180 mg/dL (5.56-10.0 mmol/L), and >180 mg/dL (10.0 mmol/L). Given that the risk of overestimating is greater when the true blood glucose is low (compared with high), trend risk category 5 of the Trend Accuracy Matrix for reference range <100 mg/dL (5.56 mmol/L) is extended to overestimates by 2 bins. By contrast, because the risk of overestimation is lower when the true blood glucose is high, no combinations of reference trend and monitor trend were deemed clinically risky enough to be labeled as trend risk category 5 in the Trend Accuracy Matrix for reference range >180 mg/dL (10.0 mmol/L). The Trend Accuracy Matrix for reference range 100 to 180 mg/dL (5.56-10.0 mmol/L) has the same trend risk categories as the main Trend Accuracy Matrix for reference range 1 to 600 mg/dL (0.0556-33.3 mmol/L).
As mentioned in DTS Error Grid Results, the combined CGM accuracy study included 75 individuals wearing CGMs and 100 study days. Each study day was three to 12 hours with approximately four reference measurements per study hour. Of 3952 CGM readings, 3448 (87.2%) were accompanied by a trend indicator, and, in 3185 of the readings (80.6% of the total), the CGM’s trend indicator could be compared with a valid calculated reference trend. To compare the CGM’s trend indicator with a reference trend, a reference measurement within five minutes before or after and a prior reference measurement within 15 to 45 minutes previous was required. The results are displayed in the Trend Accuracy Matrix in Figure 3. The Trend Accuracy Matrix assumes a typical distribution of reference data points across the three ranges, <100 mg/dL (5.56 mmol/L), 100 to 180 mg/dL (5.56-10.0 mmol/L), and >180 mg/dL (10.0 mmol/L).
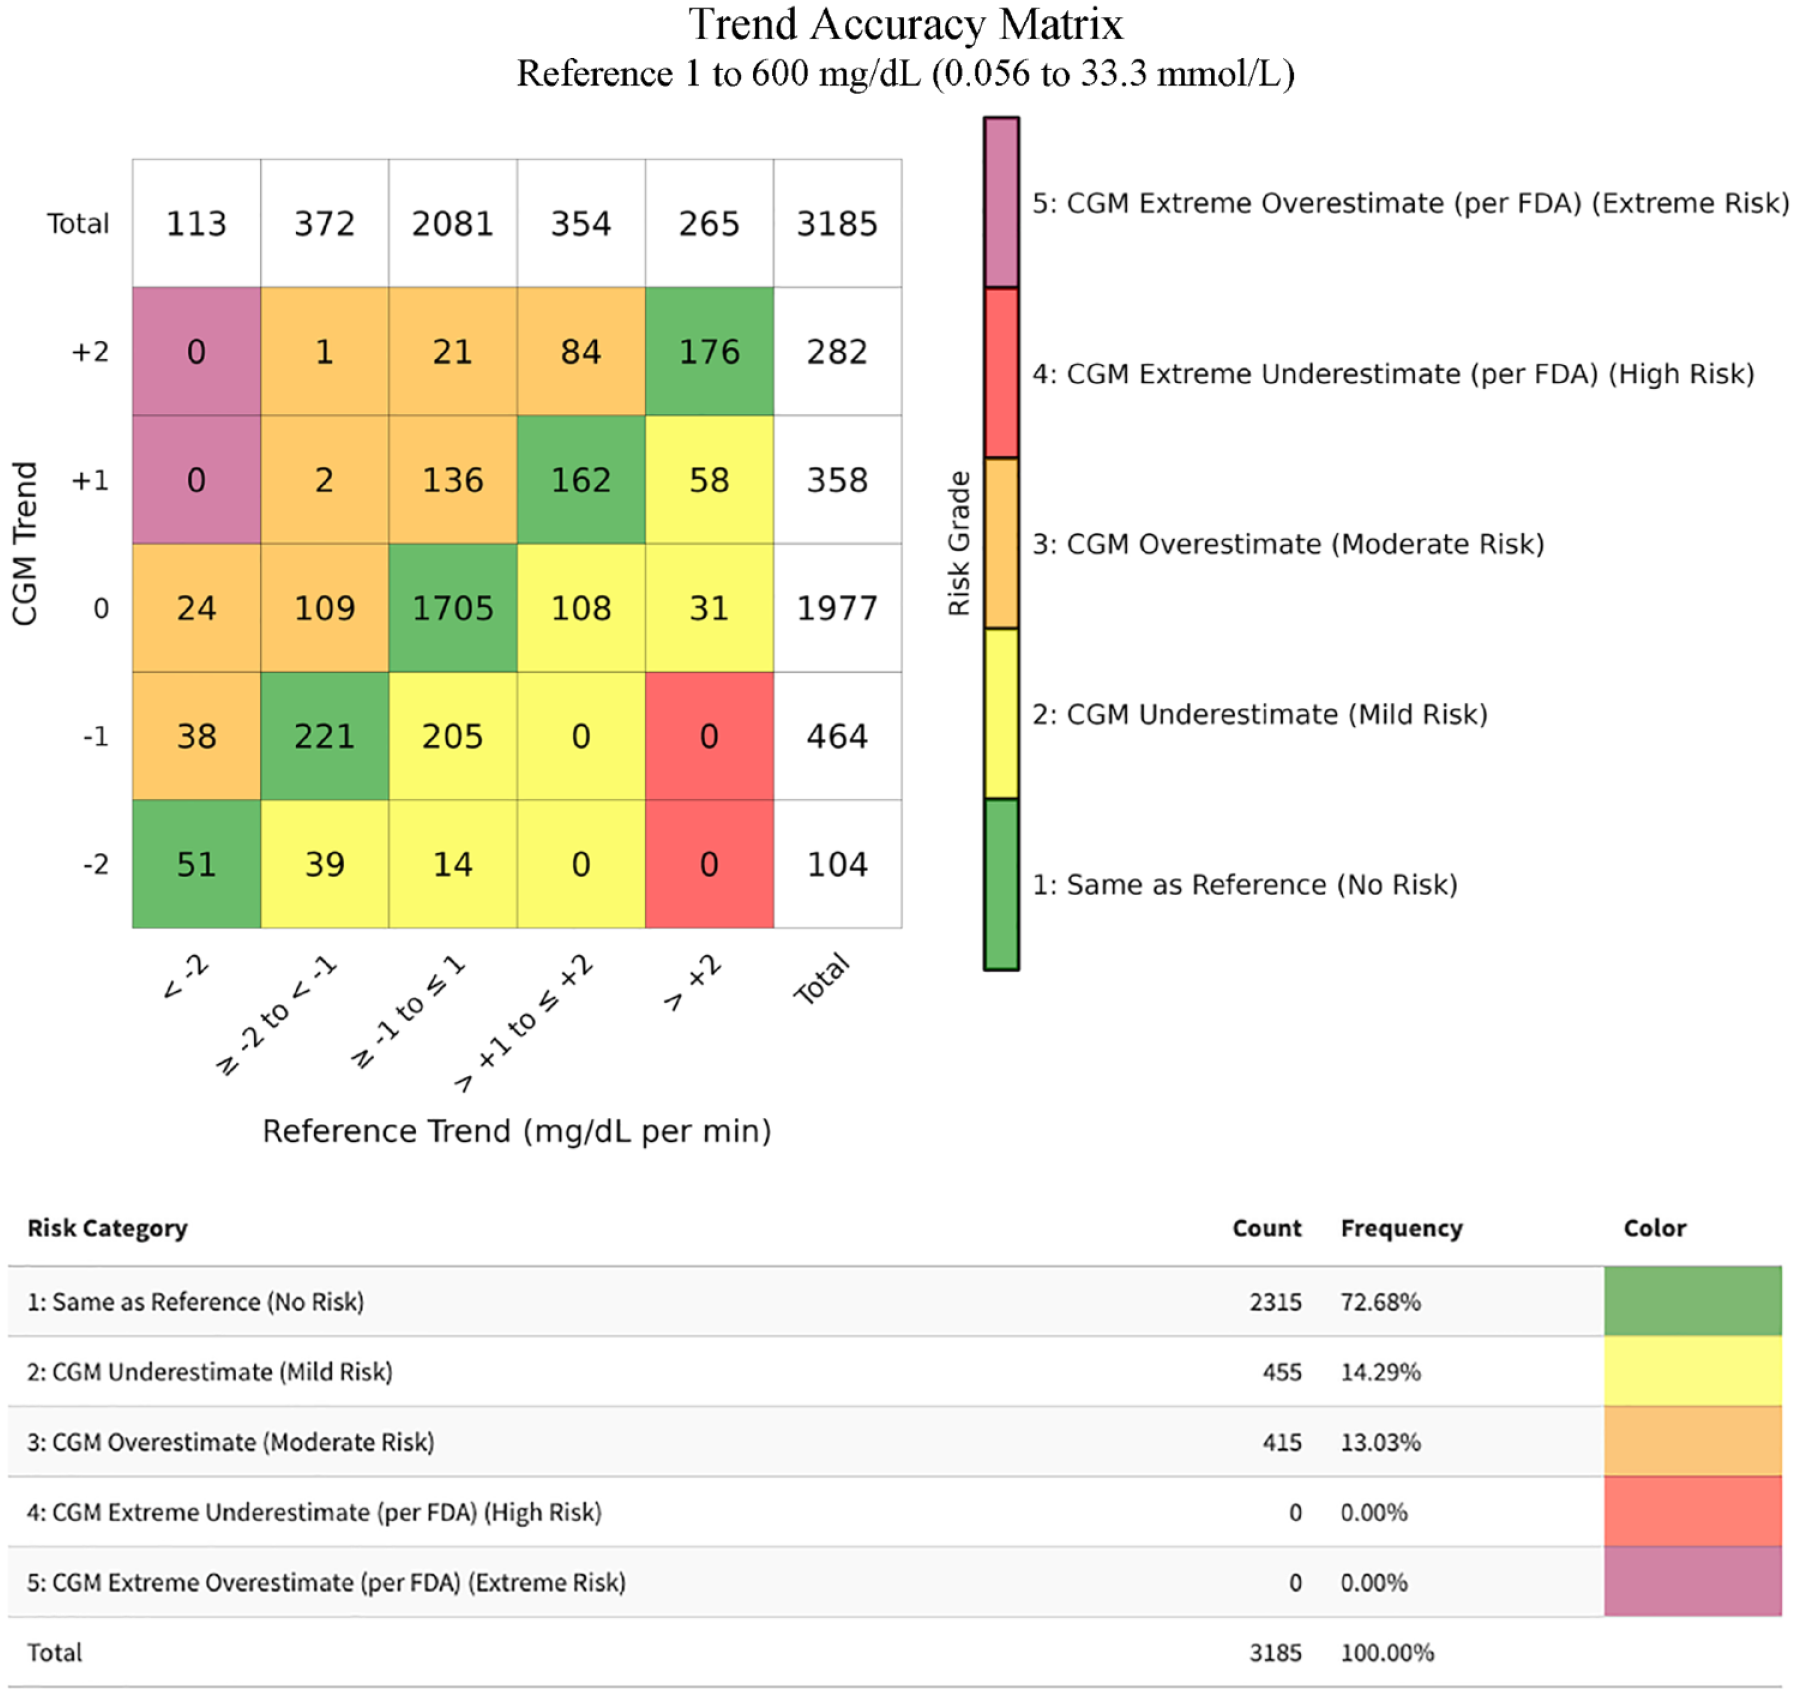
The DTS Trend Accuracy Matrix for reference values from 1 to 600 mg/dL (0.0556-33.3 mmol/L) for our combined CGM data set.
When the glucose level is low, the risk is higher when overestimating the trend than when underestimating the trend. In addition to the overall presentation of the trend data, trend accuracy information for the subset of measurements when the reference value was less than 100 mg/dL (5.56 mmol/L) were presented separately because many important clinical decisions are made when the measured glucose is within this range. In this separate analysis of data points with reference glucose values <100 mg/dL (5.56 mmol/L), the “CGM Extreme Overestimate” trend risk category (defined as trend risk category 5) comprises six rather than two cells, as shown in Figure 4. It should be noted that neither the FDA nor any other regulatory agency has specified a target percentage of data pairs for trend accuracy for any subsets of a data set of trend accuracy results.
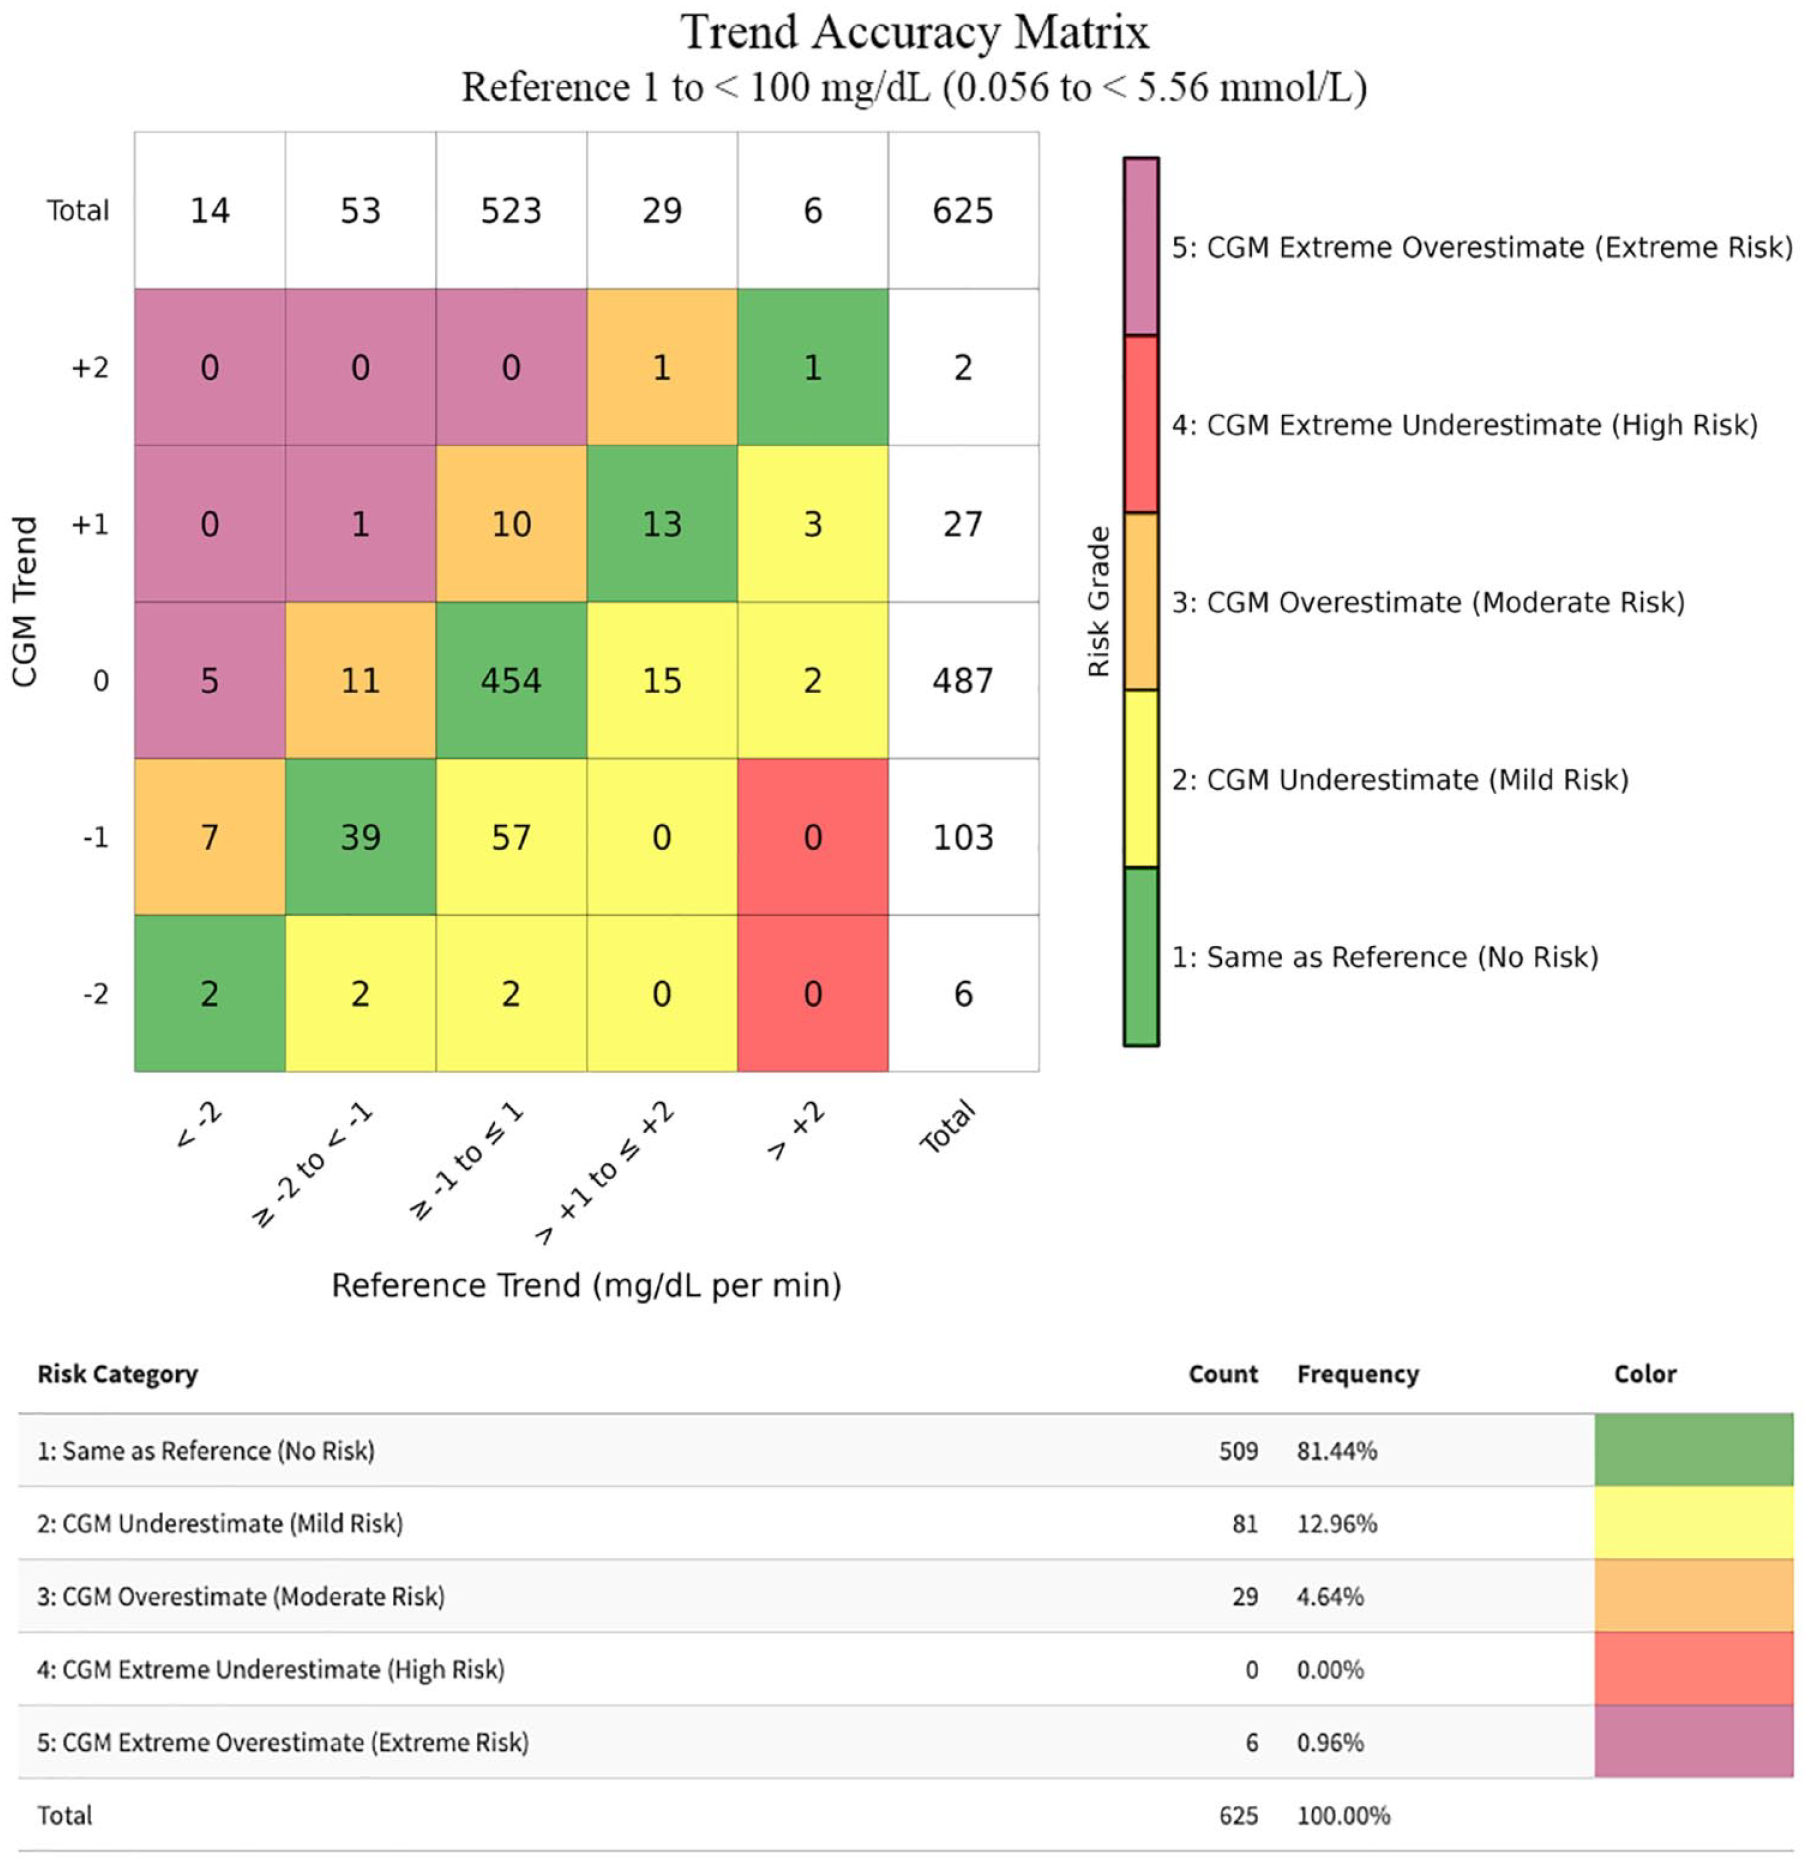
The DTS Trend Accuracy Matrix for reference values 1 to 100 mg/dL (0.0556-5.56 mmol/L) for our combined CGM data set.
In contrast with the subset of reference values <100 mg/dL (5.56 mmol/L), for the subset of reference values >180 mg/dL (10.0 mmol/L), no combinations of reference trend and monitor trend were deemed clinically risky enough to be labeled as trend risk category 5 in the Trend Accuracy Matrix, shown in Figure 5.
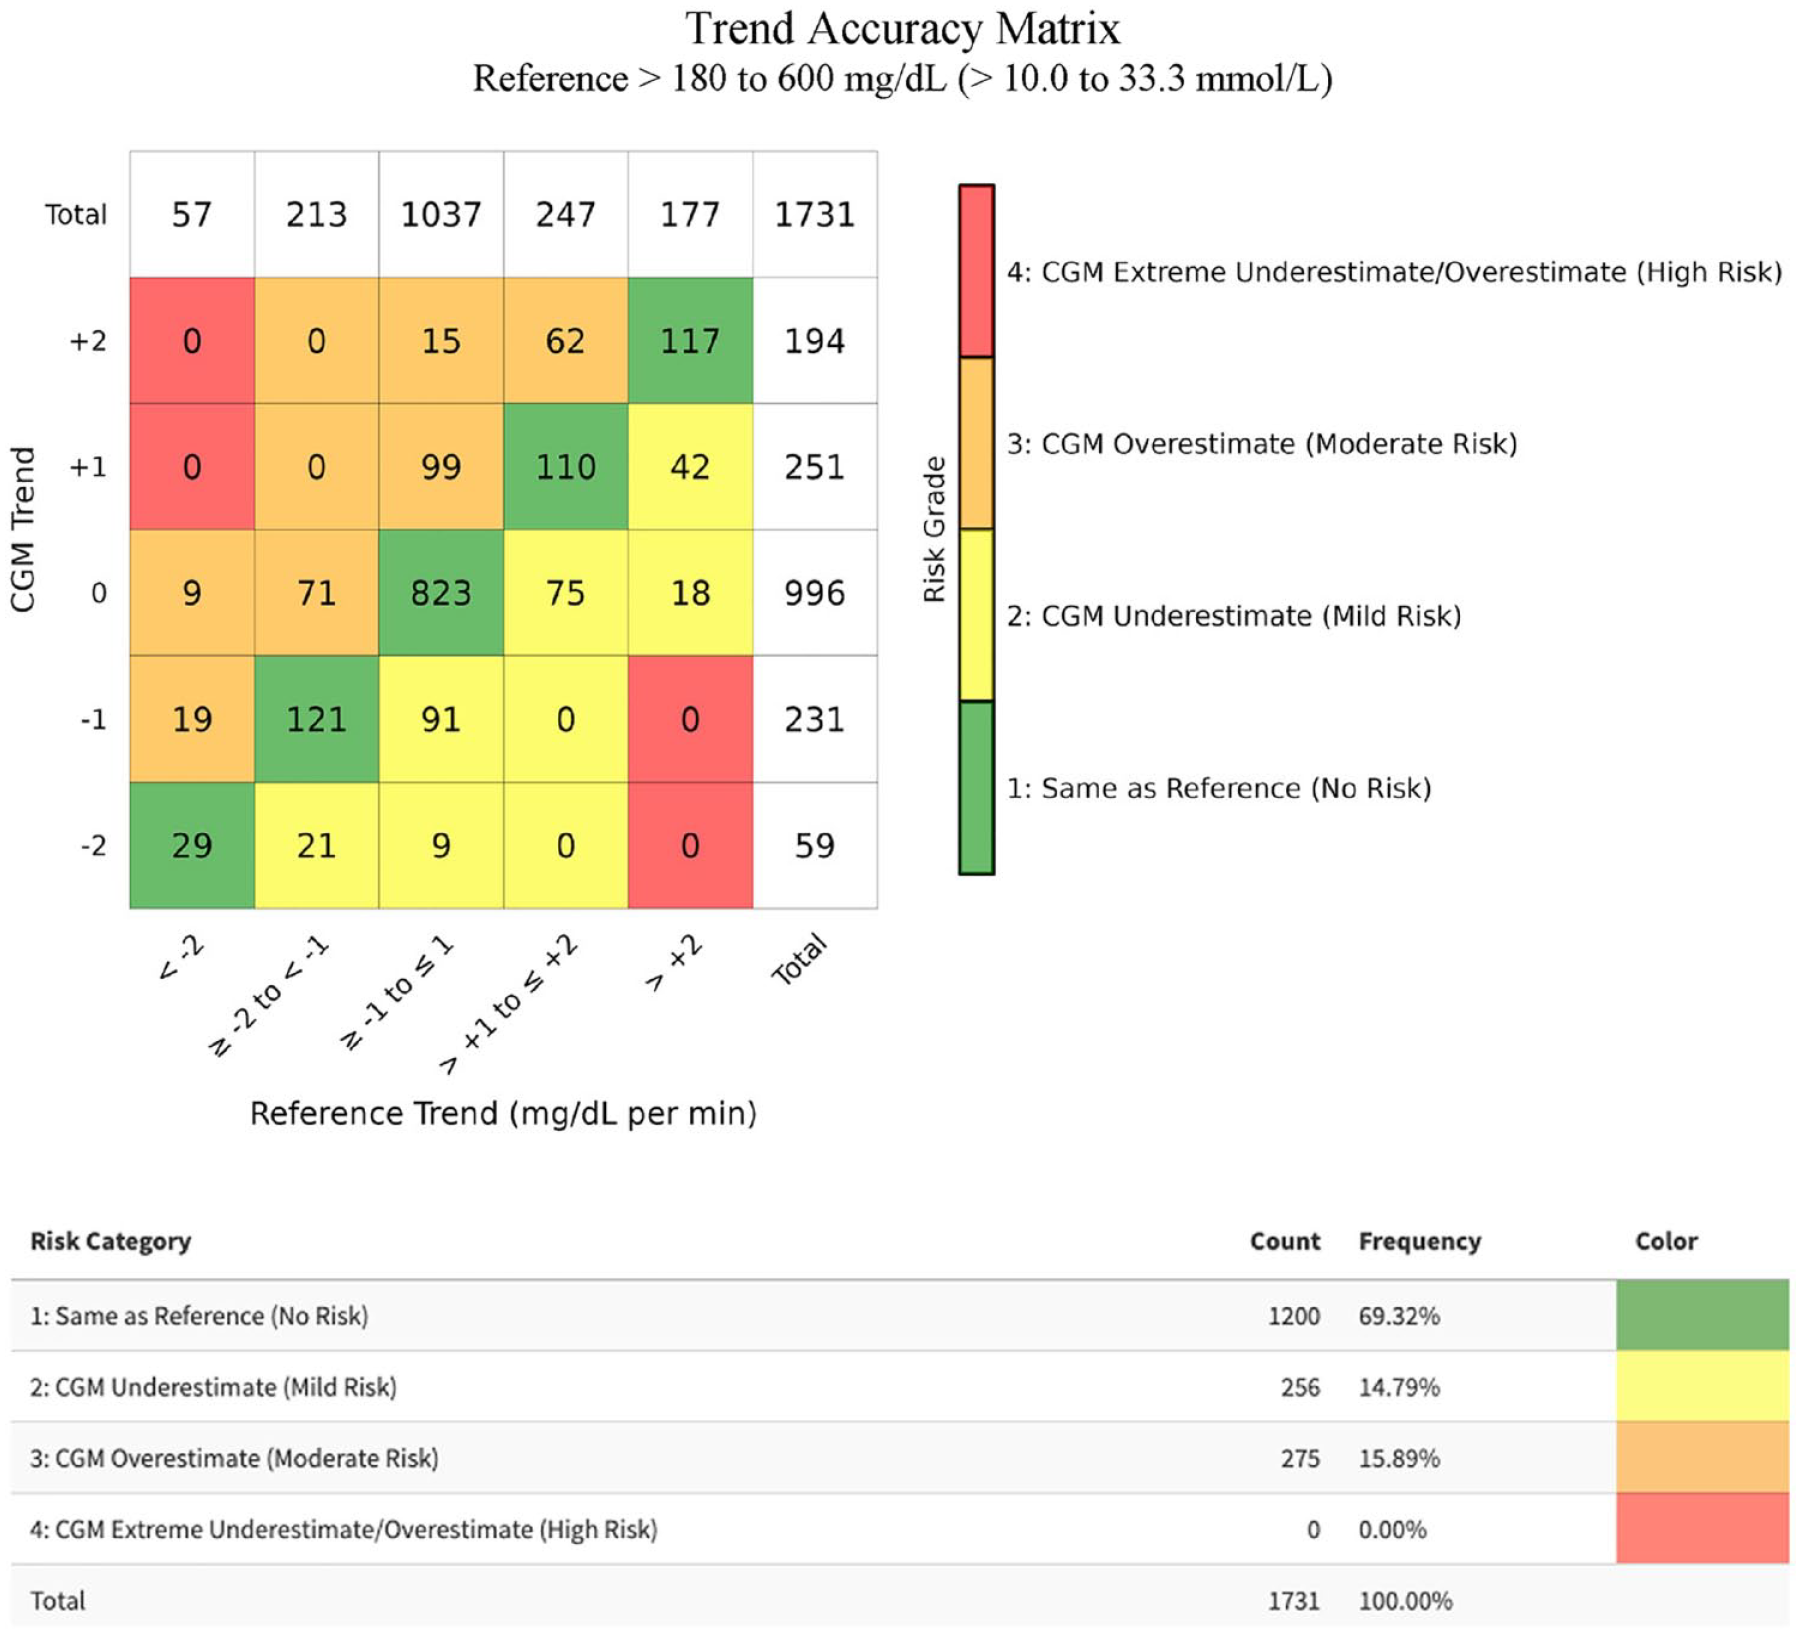
The DTS Trend Accuracy Matrix for reference values from >180 to 600 mg/dL (10.0-33.3 mmol/L) for our combined CGM data set.
Discussion
The DTS Error Grid and the Trend Accuracy Matrix were developed with input from an international panel of clinicians, researchers, and representatives of government agencies in an effort to facilitate and optimize medical decisions at the point of care. Unlike other clinical accuracy error grids, a group of experts in glucose monitoring considered the DTS Error Grid appropriate for assessing the clinical accuracy of both BGMs and CGMs (providing that the latter were cleared as nonadjunctive CGMs). When the three prior error grids for clinical BGM accuracy were developed, no CGM was widely used. The DTS Error Grid and the Trend Accuracy Matrix are the first international consensus-based error grid and trend accuracy tools to be reported for BGMs and CGMs.
The DTS Error Grid classifies reference/monitor pairs into five clinical risk zones: none (green), mild (yellow), moderate (orange), high (red), and extreme (purple). Smoothing the borders between clinical risk zones specified by the SEG removes the serrations in this grid related to the method used to collect the original 206 glucose monitoring experts’ responses. In addition, with five zones of clinical point accuracy, the DTS Error Grid reduces the complexity of the analysis and facilitates easier interpretation of clinical accuracy results.
The Panel noted that some developers of glucose monitors have presented clinical accuracy performance data as the percentage of data pairs in Zone A + Zone B of a point accuracy error grid, as if data pairs in either zone are clinically acceptable. The Panel felt that pZA in the DTS Error Grid is the best metric of adequate clinical performance of a glucose monitor, and that it is inappropriate to present the percentage of data pairs in Zone A + Zone B as a desirable metric of clinical performance.
The five-by-five matrix format of the Trend Accuracy Matrix, combined with the standard five trend risk categories, offers an easy and intuitive interpretation of the clinical accuracy of CGM trend indicators. Furthermore, the Trend Accuracy Matrix takes into account FDA guidance on glucose rate of change measurements.23,24 With the rapid increase in CGM use, CGM displays of trend information must be accurate.
The DTS Error Grid is not trademarked and is in the public domain. Software to assist in performing future clinical accuracy analyses with the DTS Error Grid and Trend Accuracy Matrix is available on the DTS website (https://www.diabetestechnology.org/dtseg/). Glucose concentrations in both mg/dL and mmol/L can be used. For clinical point accuracy, the software presents a summary of the data, the frequencies of datapoints in relative error ranges (within 5%, 10%, 15%, . . . of reference), bias (mean relative difference), MARD, and the 95% limits of agreement. The software will use the imported data set to plot (1) the DTS Error Grid, (2) the relative error, and (3) error in mg/dL and mmol/L. The user can customize the plot by changing plot ranges, point size, point color, and point opacity. Plots can be exported as PNG or PDF files. For the clinical accuracy of CGM trend information, the software will also display the DTS Trend Accuracy Matrix. Panel members assisted with beta testing the DTS Error Grid software.
Limitations
Determining the clinical accuracy of a CGM has a different purpose than determining its analytical accuracy. Future studies might find that the day of wear, the wear site, the rate of change of glycemia, or other elements of a CGM accuracy study might affect the percentage of data pairs in each clinical point accuracy risk zone or each trend risk category. The panel of authors did not define a minimum number of data pairs necessary to create a distribution for the clinical point accuracy risk zones or the trend risk categories. Larger sample sizes increase the precision of estimates but do not necessarily decrease systematic bias.
The BGMs and CGMs used in this study to test the error grid were all FDA approved and widely used in the United States. The assessments of device-measured glucose concentrations assume optimal instrument operation. Thus, they provide information about the quality of the device at the manufacturer level. Their performance for an end-user can be different. An appropriate reference test method for measuring glucose should be highly accurate and traceable to higher-order reference methods.
Conclusion
Measuring glucose remains central to diabetes care. Since the three commonly used error grids for assessing the accuracy of glucose monitoring devices were introduced, there have been major additions to the technology available to support diabetes management, most notably the introduction of CGMs. In this study, the original SEG has been updated by DTS in collaboration with an international panel of experts in glucose monitoring.
The updated DTS Error Grid has simplified the approach to understanding the risk zones and point accuracy when comparing glucose measurements with a reference device. Moreover, the new Trend Accuracy Matrix compares CGM-reported trend indicators with reference trends. Finally, this project demonstrated the relationship between the DTS Error Grid Zone A and the MARD of a glucose monitor. As important therapeutic decisions, including the calculation of a safe and effective dose of insulin, are based on the measurement of both individual and serially measured glucose levels, it remains vital that clinicians and people living with diabetes have confidence in the accuracy of individual glucose values and the interpretation of trends formed by sequential glucose measurements.
Supplemental Material
sj-docx-1-dst-10.1177_19322968241275701 – Supplemental material for The Diabetes Technology Society Error Grid and Trend Accuracy Matrix for Glucose Monitors
Supplemental material, sj-docx-1-dst-10.1177_19322968241275701 for The Diabetes Technology Society Error Grid and Trend Accuracy Matrix for Glucose Monitors by David C. Klonoff, Guido Freckmann, Stefan Pleus, Boris P. Kovatchev, David Kerr, Chui (Cindy) Tse, Chengdong Li, Michael S. D. Agus, Kathleen Dungan, Barbora Voglová Hagerf, Jan S. Krouwer, Wei-An (Andy) Lee, Shivani Misra, Sang Youl Rhee, Ashutosh Sabharwal, Jane Jeffrie Seley, Viral N. Shah, Nam K. Tran, Kayo Waki, Chris Worth, Tiffany Tian, Rachel E. Aaron, Keetan Rutledge, Cindy N. Ho, Alessandra T. Ayers, Amanda Adler, David T. Ahn, Halis Kaan Aktürk, Mohammed E. Al-Sofiani, Timothy S. Bailey, Matt Baker, Lia Bally, Raveendhara R. Bannuru, Elizabeth M. Bauer, Yong Mong Bee, Julia E. Blanchette, Eda Cengiz, James Geoffrey Chase, Kong Y. Chen, Daniel Cherñavvsky, Mark Clements, Gerard L. Cote, Ketan K. Dhatariya, Andjela Drincic, Niels Ejskjaer, Juan Espinoza, Chiara Fabris, G. Alexander Fleming, Monica A. L. Gabbay, Rodolfo J. Galindo, Ana María Gómez-Medina, Lutz Heinemann, Norbert Hermanns, Thanh Hoang, Sufyan Hussain, Peter G. Jacobs, Johan Jendle, Shashank R. Joshi, Suneil K. Koliwad, Rayhan A. Lal, Lawrence A. Leiter, Marcus Lind, Julia K. Mader, Alberto Maran, Umesh Masharani, Nestoras Mathioudakis, Michael McShane, Chhavi Mehta, Sun-Joon Moon, James H. Nichols, David N. O’Neal, Francisco J. Pasquel, Anne L. Peters, Andreas Pfützner, Rodica Pop-Busui, Pratistha Ranjitkar, Connie M. Rhee, David B. Sacks, Signe Schmidt, Simon M. Schwaighofer, Bin Sheng, Gregg D. Simonson, Koji Sode, Elias K. Spanakis, Nicole L. Spartano, Guillermo E. Umpierrez, Maryam Vareth, Hubert W. Vesper, Jing Wang, Eugene Wright, Alan H.B. Wu, Sewagegn Yeshiwas, Mihail Zilbermint and Michael A. Kohn in Journal of Diabetes Science and Technology
Footnotes
Acknowledgements
The authors acknowledge Guillermo Arreaza-Rubín, MD, for his participation in the Panel and review of the manuscript prior to publication. They also acknowledge Ravi Subramaniam, MBA, for his review of the manuscript prior to publication. The findings and conclusions in this report are those of the author(s) and do not necessarily represent the official position of the Centers for Disease Control and Prevention or the Agency for Toxic Substances and Disease Registry. Use of trade names is for identification only and does not imply endorsement by the Centers for Disease Control and Prevention, the Public Health Service, and the US Department of Health and Human Services. The views expressed in this article are those of the authors and do not reflect the official policy of the Department of Army/Navy/Air Force, Department of Defense, or the U.S. Government.
Abbreviations
BG, blood glucose; BGM, blood glucose monitor; CEG, Clarke error grid; CG-EGA, continuous glucose error grid; CGM, continuous glucose monitor; CLSI, Clinical and Laboratory Standards Institute; dL, deciliter; DTS, Diabetes Technology Society; FDA, US Food and Drug Administration; iCGM, integrated continuous glucose monitor; L, liter; MARD, mean absolute relative difference; mg, milligram; min, minutes; mmol, millimole; PEG, Parkes error grid; pZA, percent of reference/monitor pairs in Zone A; SEG, surveillance error grid.
Declaration of Conflicting Interests
The author(s) declared the following potential conflicts of interest with respect to the research, authorship, and/or publication of this article: D.C.K. is a consultant for Afon, Lifecare, Novo, Samsung, embecta, Glucotrack, SynchNeuro, and Thirdwayv. G.F. is CEO of IfDT. G.F./IfDT has/have received research support, speakers’ honoraria or consulting fees in the last three years from Abbott, Ascensia, Berlin Chemie, Boydsense, Dexcom, Glucoset, i-SENS, Lilly, Menarini, Novo Nordisk, Perfood, Pharmasens, Roche, Sinocare, Terumo, Ypsomed. S.P. is an employee of IfDT. B.P.K. declares patent royalties handled by UVA from: DexCom, J&J, Novo Nordisk, and Sanofi; and research support handled by UVA: Dexcom, Novo Nordisk, Tandem Diabetes Care. D.K. has received research support from Abbott Diabetes Care. M.S.D.A. is currently receiving in kind support (CGM devices) from Dexcom Inc for an investigator-initiated clinical study. K.D. receives research funding from Dexcom, Abbott, Sanofi, Viacyte, Insulet, consulting fees from Eli Lilly, Dexcom, Insulet, Oppenheimer, Elsevier, honoraria from Academy for Continued Healthcare Learning, Med Learning Group, Medscape, Impact Education, and royalties from UptoDate. S.M. is in receipt of an investigator-initiated grant from DexCom, has received speaker fees from Sanofi & Lilly, is funded by a Wellcome Trust (223024/Z/21/Z), and is supported by the NIHR Imperial Biomedical Research Centre. A.S. was supported by the NSF Engineering Research Center for Precise Advanced Technologies and Health Systems for Underserved Populations (PATHS-UP) (#1648451). V.N.S. reports receiving personal fees from Sanofi, Embecta, NovoNordisk, Dexcom, Insulet, Tandem Diabetes Care, Ascensia Diabetes Care, Genomelink and LumosFit for consulting, advising or speaking. N.K.T. is a consultant for Roche Diagnostics / Roche Molecular Systems / Radiometer. UC Davis is a Roche Diagnostics Center of Excellence. N.K.T. has received speaking honoraria for Roche Diagnostics, Nova Biomedical, Thermo Fisher, and Radiometer. N.K.T. is also Chair-Elect for the Association for Diagnostic and Laboratory Medicine (ADLM) Critical and Point-of-Care Testing Division, Co-Founder of the Machine Intelligene Learning Optimizer (MILO), Inc, and a member of the International Federation for Clinical Chemistry (IFCC) continuous glucose monitoring workgroup. T.T. is a consultant for Clinical ink. R.E.A. is a consultant for Clinical ink. D.T.A. has received speaker’s honoraria from Abbott, Ascensia Diabetes Care, Insulet, Lilly Diabetes, Mannkind, Novo Nordisk, and Xeris Pharmaceuticals. D.T.A. has received consulting fees from Ascensia Diabetes Care, Lilly Diabetes, and Senseonics. H.K.A. received research grants through University of Colorado from Dexcom, Tandem Diabetes, Medtronic, Mannkind, IM Therapeutics, IAFMS, and received honorarium through University of Colorado for consulting from Dexcom, Tandem Diabetes, and Medtronic. M.E.A.-S. has served on the advisory boards for Abbott, Medtronic, Insulet, VitalAire, Sanofi, Eli Lilly, and Dexcom; has received honoraria for speaking from Abbott, Eli Lilly, Medtronic, Novo Nordisk, Sanofi, VitalAire, and Eli Lilly; and received research support from Medtronic and Sanofi. T.S.B. has received research support from Abbott Rapid Diagnostics, Biolinq, Dexcom, Eli Lilly, Medtronic, Medtrum, Novo Nordisk, Sanofi, Senseonics, and vTv Therapeutics and consulting honoraria from Abbott Diabetes, Abbott Rapid Diagnostics, ACON, CeQur, HagarTech, Intuity Medical, Lifescan, Mannkind, Medtronic, Novo, Perspirion, Sanofi, Sequel Med Tech, and Ypsomed. M.B. currently participates on the Hospital Advisory board with Dexcom and has received research support from Dexcom. L.B. has received research/product support from Dexcom, Ypsomed, and Boehringer Ingelheim; speaker honoraria from Dexcom and Oviva; and participated in advisory boards of Dexcom, Novo Nordisk, Sanofi, Ypsomed, Oviva, and Roche Diabetes Care. Y.M.B. has received honoraria for lectures and scientific advisory from Roche and AstraZeneca in the past 12 months. J.E.B. is on the Speaker’s bureau for Insulet and on the Advisory Board for Cardinal Health and Lifescan. J.E.B. is a consultant for Embecta. J.E.B. receives research support from the Leona M. and Harry B. Helmsley Charitable Trust. E.C. is on the scientific advisory board for Novo Nordisk, Eli-Lilly, Adocia, Arecor, Proventionbio, Portal Insulin, and MannKind. D.C. was a Dexcom employee from August 2018 to May 2024. D.C. is a shareholder of Dexcom, Lilly, Abbott and Tandem. M.C. has received consulting fees from Glooko and research support from Dexcom and Abbott Diabetes Care. G.L.C. is a shareholder of BioTex, Inc., Basepair Biotechnologies Inc., Coordination Centric, Inc., and Shape Memory Medical, Inc. G.L.C. is supported by the NSF Engineering Research Center for Precise Advanced Technologies and Health Systems for Underserved Populations (PATHS-UP) (#1648451). K.K.D. has received honoraria, travel, or fees for advisory boards from AstraZeneca, Novo Nordisk, Boehringer Ingelheim, Eli Lilly, Abbott Diabetes, Menarini, and Sanofi in the last 12 months. J.E. receives federal funding from FDA, NIMHD, and NCATS and is a consultant for Sanofi. C.F. receives royalties from Dexcom and Novo Nordisk managed through her institution. G.A.F. is an advisor for 180 Life Sciences, 89bio, Adocia, Abbott, AdipoPharma, Aerami, Amolyt, Carthera, Catalyst, Cohen Global, CMC Magnetics, Diasome, Eleos, Entera Bio, Enterin, Glyscend, Hagar, Hogan Lovells, IM Therapeutics, Innoneo, Intarcia, Levicure, Lilly Asia Ventures, Lumos, Mars Symbioscience, Melior, metaLead Therapeutics, Microbiotix, MMD, Modular Medical, New Amsterdam, Northwestern, NuSirt, NuVox, Oramed, Pano, Pasithea, PhylloPharma, Pleiogenix, Recordati, Regor, Remodeless, Renaissance, RenovoRx, Rivus, RxMP, Sera Biopharma, Seraxis, Serpin, SFC Fluidics, Skinject, SROne, Stalicla, Surf Bio, TIXiMED, Veroscience, Verthermia, WaveBreak, Zealand Pharma, and Zucara. M.A.L.G. is a consultant for Abbott, Medtronic, Novonordisk, and Roche. R.J.G. received research support from Novo Nordisk, Dexcom and Eli Lilly and consulting fees/advisory fees from Abbott Diabetes Care, Aztra Zeneca, Bayer, Boehringer, Dexcom, Eli Lilly, Novo Nordisk, and Medtronic, outside of this work. R.J.G. is partially supported by the National Institute of Diabetes and Digestive and Kidney Diseases of the National Institutes of Health under Award Numbers P30DK111024, K23DK123384, R03DK138255, and U2CD137135. A.M.G.-M. reports speaker fees from Novo Nordisk, Sanofi, Elli Lilly, Boehringer Ingelheim, Abbott, and Medtronic. L.H. is a consultant for a number of companies that are developing innovative solutions for the treatment of people with diabetes. N.H. reports Advisory Board member fees from Abbott Diabetes Care and Insulet as well as honoraria for lectures from Berlin-Chemie AG, Becton Dickenson, Sanofi Germany, Roche Diabetes Care, and Dexcom Germany. T.H. serves on the advisory board for Acella and Horizons Therapeutics (no financial compensation). S.H. has served on the advisory board for Tandem, Dexcom, and Medtronic, and received honoraria for nonpromotional educational and/or consultancy work from Abbott, Insulet, Dexcom, Roche, and Sanofi. P.G.J. is a shareholder of Pacific Diabetes Technologies Inc. and serves on the advisory board for Eli Lilly. P.G.J. received grant support from SFC Fluidics and research support from Eli Lilly and Dexcom. J.J. has received fees from lectures and or advisory boards from Abbott, Astra Zeneca, Boeringer Ingelheim, Eli Lilly, Medtronic, Nordic Infucare, Novo Nordisk, and Sanofi. S.R.J is a consultant for USV, Marico, Glenmark, Franco Indian, Twin Health, Biocon, and Zydus Lifesciences. S.R.J. received speaking honoraria from Abbott, Novo Nordisk, MSD, Sanofi, Boehringer Ingelheim, AstraZeneca, Lupin, Bayer Zydus, USV, DRL, Meyer Organics, Servier, Natco. R.A.L. is a consultant for Abbott Diabetes Care, Biolinq, Capillary Biomedical, Deep Valley Labs, Gluroo, PhysioLogic Devices, Portal Insulin, Sanofi, and Tidepool. R.A.L. has served on advisory boards for. ProventionBio and Lilly. R.A.L. receives research support through his institution from Insulet, Medtronic, Tandem, and Sinocare. L.A.L. has received research funding from, has provided CME on behalf of, and/or has acted as an advisor to Abbott, AstraZeneca, Boehringer Ingelheim, Eli Lilly, Lexicon, Merck, Novo Nordisk, Pfizer, and Sanofi. M.L. has been a consultant or received honoraria from Astra Zeneca, Boehringer Ingelheim, Eli Lilly, Nordic InfuCare, and Novo Nordisk, and has received research grants from Eli Lilly and Novo Nordisk, all outside of the submitted work. J.K.M. is a member of advisory boards of Abbott Diabetes Care, Becton-Dickinson, Biomea Fusion, Eli Lilly, Embecta, Medtronic, NovoNordisk A/S, Roche Diabetes Care, Sanofi-Aventis, and Viatris and received speaker honoraria from A. Menarini Diagnostics, Abbott Diabetes Care, AstraZeneca, Boehringer Ingelheim, Dexcom, Eli Lilly, Medtrust, MSD, NovoNordisk A/S, Roche Diabetes Care, Sanofi, Viatris, and Ypsomed. J.K.M. is a shareholder of decide Clinical Software GmbH and elyte Diagnostics. A.M. reports speaker fees from Novo Nordisk. M.M. has an existing research & development relationship with Scientific Bioprocessing, Inc and has been a consultant for Abbott. S.-J.M. is a consultant for Abbott, Curestream, Daewoong, EOFlow, G2e, Huons, iSense, Medtronic, Novo Nordisk, and Sanofi. D.N.O. has served on advisory boards for Abbott Laboratories, Medtronic, Merck Sharp & Dohme, Novo Nordisk, Roche, and Sanofi; received research support from Medtronic, Novo Nordisk, Roche, Eli Lilly and Company, and Sanofi; and received travel support from Novo Nordisk and Merck Sharp & Dohme. F.J.P. has received research support (to Emory University) from Dexcom, Insulet, Novo Nordisk, Tandem, and Ideal Medical Technologies, and has received consulting fees from Dexcom. A.L.P. is on the advisory board of Medscape, Vertex, and Lilly; receives research support from Insulin and Abbott; and has stock options in Omada Health. R.P.-B. receives grant support from Novo Nordisk, Lexicon Pharmaceuticals, and Medtronic and received consulting fees from Bayer, Lexicon Pharmaceuticals, Novo Nordisk, and Roche. C.M.R. has received honoraria and/or grant support from AstraZeneca, Dexcom, Fresenius, and Vifor. D.B.S. is supported by the Intramural Research Program of the National Institutes of Health. S.S. was a Novo Nordisk employee from 2022-2023. S.S. has served as advisor for Novo Nordisk and has received speaker fees from Novo Nordisk and Nordic Infucare within the past three years. G.D.S’s employer, nonprofit International Diabetes Center, HealthPartners Institute, has received educational grant funds from Abbott Diabetes Care, Medscape, and Sanofi-Aventis Groupe. G.D.S receives no personal income/honorarium from these activities. K.S. received grant supports from Arkray, Terumo, and Dexcom. E.K.S. is partly supported by the VA Merit Award (1I01CX001825) from the US Department of Veterans Affairs Clinical Sciences Research and has received unrestricted research support from Dexcom and Tandem Diabetes (to Baltimore VA Medical Center and to University of Maryland) for the conduction of clinical trials. N.L.S. received funding from Novo Nordisk for an investigator-initiated research grant unrelated to the current project. G.E.U. is partly supported by research grants from National Institutes of Health (NIH/NATS UL 3UL1TR002378-05S2) from the Clinical and Translational Science Award program, and from National Institutes of Health and National Center for Research Resources (NIH/NIDDK 2P30DK111024-06). G.E.U. has received research support (to Emory University) from Abbott, Bayer, and Dexcom; and has participated in advisory boards for Dexcom and GlyCare. E.W. has received consulting fees from Abbott Diabetes Care, Ascensia, Bayer, Boehringer, Ingelheim, Embecta, GlaxoSmithKline, Lilly, Medtronic, Renalytix, and Sanofi. E.W. has received honoraria from Abbott Diabetes Care, Bayer, Boehringer Ingelheim, GlaxoSmithKline, Lilly, Medtronic, Renalytix, and Sanofi. E.W. is on the Speakers’ Bureau from Abbott Diabetes Care, Bayer, Boehringer, Ingelheim, GlaxoSmithKline, Lilly, Renalytix, and Sanofi. M.Z. is a consultant for DexCom, Inc. M.A.K. is Chief Medical Officer of QuesGen, Inc. C.T., C.L., B.V.H., J.S.K., W.A.L., S.Y.R., J.J.S., K.W., C.W., K.R., C.N.H., A.T.A., A.A., R.R.B., E.M.B., J.G.C., K.Y.C., A.D., N.E., S.K.K., U.M., N.M., C.M., J.H.N., A.P., P.R., S.M.S., B.S., M.V., H.W.V., J.W., A.H.B.W., and S.Y. have nothing to disclose.
Funding
The author(s) disclosed receipt of the following financial support for the research, authorship, and/or publication of this article: This study was supported by a grant from Abbott Diabetes Care.
ORCID iDs
Supplemental Material
Supplemental material for this article is available online.
References
Supplementary Material
Please find the following supplemental material available below.
For Open Access articles published under a Creative Commons License, all supplemental material carries the same license as the article it is associated with.
For non-Open Access articles published, all supplemental material carries a non-exclusive license, and permission requests for re-use of supplemental material or any part of supplemental material shall be sent directly to the copyright owner as specified in the copyright notice associated with the article.