
Abstract
Background:
Application of novel machine learning approaches to electronic health record (EHR) data could provide valuable insights into disease processes. We utilized this approach to build predictive models for progression to prediabetes and type 2 diabetes (T2D).
Methods:
Using a novel analytical platform (Reverse Engineering and Forward Simulation [REFS]), we built prediction model ensembles for progression to prediabetes or T2D from an aggregated EHR data sample. REFS relies on a Bayesian scoring algorithm to explore a wide model space, and outputs a distribution of risk estimates from an ensemble of prediction models. We retrospectively followed 24 331 adults for transitions to prediabetes or T2D, 2007-2012. Accuracy of prediction models was assessed using an area under the curve (AUC) statistic, and validated in an independent data set.
Results:
Our primary ensemble of models accurately predicted progression to T2D (AUC = 0.76), and was validated out of sample (AUC = 0.78). Models of progression to T2D consisted primarily of established risk factors (blood glucose, blood pressure, triglycerides, hypertension, lipid disorders, socioeconomic factors), whereas models of progression to prediabetes included novel factors (high-density lipoprotein, alanine aminotransferase, C-reactive protein, body temperature; AUC = 0.70).
Conclusions:
We constructed accurate prediction models from EHR data using a hypothesis-free machine learning approach. Identification of established risk factors for T2D serves as proof of concept for this analytical approach, while novel factors selected by REFS represent emerging areas of T2D research. This methodology has potentially valuable downstream applications to personalized medicine and clinical research.
Keywords
Over 20 million US adults have type 2 diabetes (T2D); prevalence has more than tripled since 1990.1,2 Prediabetes, an asymptomatic state in which blood glucose concentrations are elevated but lower than diagnostic thresholds, confers high risk for development of T2D. Previous studies have reported demographics, comorbidities, clinical measures, family history, lifestyle, and anthropomorphic measures may be associated with progression. 3 Further elucidation of the factors that drive progression to prediabetes/diabetes would be valuable in characterizing and intervening on at-risk patients. Prevention and clinical management of patients on the diabetes spectrum could have a major impact on personal and population health, and health care resource utilization and expenditures.
The digitalization of clinical records has provided a rich source of high-dimensional data, and presents a unique opportunity for powerful machine learning approaches to identify patterns and predict outcomes. Several diabetes-related prediction models have been reported, though inconsistency remains—model-building approaches, effect estimates, and the overall accuracy and validation of these prediction models vary to the point that consensus has not been reached.4-6 Whereas prediction models are generally constructed in specialized cohorts, with variable selection based on prior publications and/or investigator preconceptions, a hypothesis-free machine learning approach could lead to novel insights into clinical progression and care.7,8 Specifically, accurate predictions of progression to T2D, based on real-world data, would have distinct value for caregivers and patients with modifiable risk factors. Our objective was to identify patient characteristics that predict progression to prediabetes and T2D in a US adult population, as a practical application of pairing machine learning with electronic health records (EHRs), to characterize disease progression and identify opportunities for intervention.
Methods
Data
The source data consisted of clinical records for US adults, 2007-2012, provided by Humedica, Inc (www.humedica.com). Available data included demographic information, ICD-9 codes, prescriptions, laboratory values, and vital signs. Data were deidentified and determined by an independent institutional review board as nonhuman subjects research. Patients eligible for the study population (N = 24 331) were adults belonging to any integrated health care delivery network (IDN), without type 1 diabetes, entering the database with blood glucose measures in the low-risk (normoglycemic) range (Figure 1). The Humedica database includes over 20 IDNs, distributed across all regions of the United States. The exclusion of non-IDN patients (consisting of patients receiving care from various multispecialty, ambulatory service providers), though substantial, was done to ensure that the record of health care interactions for each study patient would be as complete as possible. Data for non-IDN patients were set aside and used as a testing set for prediction models constructed within the study population.
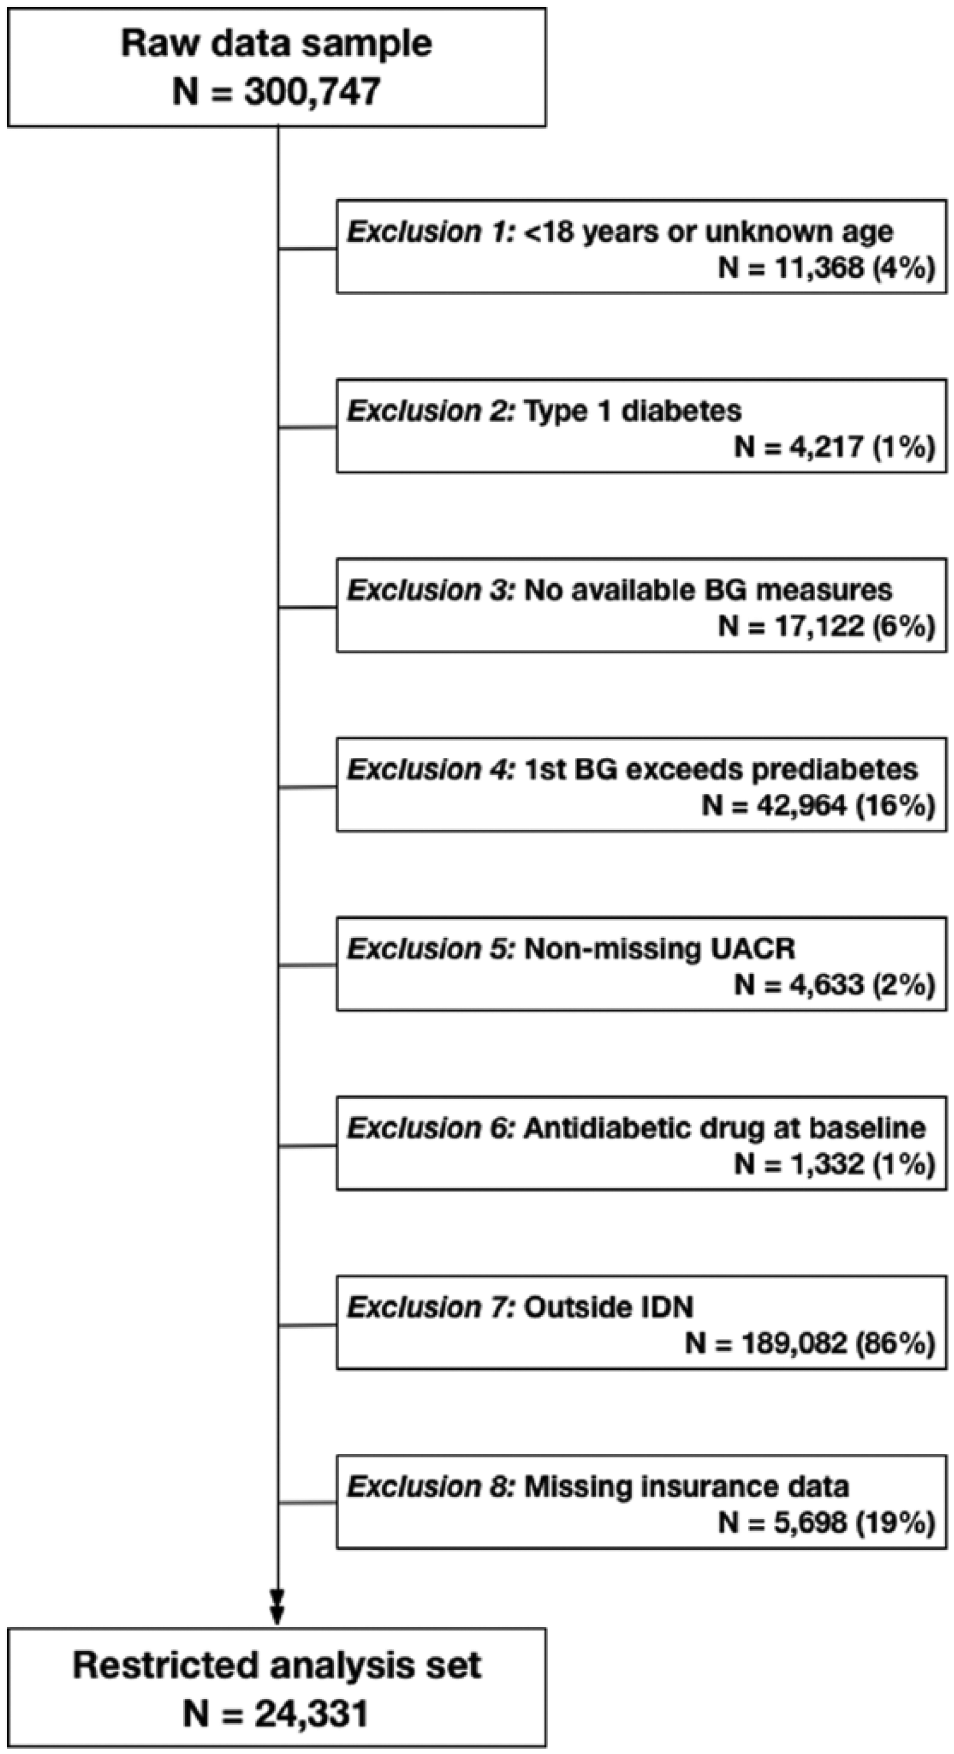
Flow diagram describing restriction criteria for analytical study population applied to Humedica electronic health records data sample, 2007-2012. BG, blood glucose; IDN, integrated delivery network; UACR, urinary albumin to creatinine ratio.
Modeling Approach
We evaluated 3 progression models: (1) normoglycemia to T2D, (2) normoglycemia to prediabetes, and (3) prediabetes to T2D. An incident T2D event was defined as the first observed ICD-9 diagnosis code specific to T2D. Patients were considered to have transitioned to prediabetes on the earliest date corresponding to multiple (≥2) consecutive glucose measures qualifying as prediabetes, according to American Diabetes Association and World Health Organization criteria.9,10 Specifically, the prediabetes threshold was defined as fasting glucose ≥110 mg/dL, 2-hour oral glucose tolerance ≥140 mg/dL, random glucose ≥140 mg/dL, or hemoglobin A1c (HbA1c) ≥5.7%. Models for progression from prediabetes to T2D were restricted to patients who transitioned to prediabetes as described.
Variables
The outcomes of interest were prediabetes or T2D. Covariates included demographics (age, gender, race, region, insurance status, 3-digit zip-code-based average annual household income and education level); laboratory values (hemoglobin A1c, fasting glucose, 2-hour oral glucose tolerance, random glucose, triglycerides, total bilirubin, alanine aminotransferase [ALT], creatinine, low-density lipoprotein [LDL], high-density lipoprotein [HDL], C-reactive protein [CRP]; clinical observations (heart rate, blood pressure, body temperature, body mass index [BMI]); ICD-9 diagnosis codes (grouped using Agency for Healthcare Research and Quality Clinical Classifications Software); 11 and prescriptions (National Drug Codes, classified using the Wolters Kluwer Medi-Span Generic Product Identifier groupings; www.medispan.com). The analysis data set consisted of 442 variables. Patients with missing values were not removed; instead variables were modeled as discrete with a missing category, where applicable. This approach was chosen due to its comparability to imputation methods, 12 the ability to retain data while considering many variables (vs a complete-case analysis), and for practical application in clinical assessments where information on key factors may be unknown.
REFS Bayesian Analytics Platform
We applied a novel analytic platform, Reverse Engineering and Forward Simulation (REFS™) to generate prediction models for progression to diabetes. REFS uses Bayesian inference to learn models directly from data, without prespecified hypotheses. Instead of a single model, REFS produces an ensemble of models sampled from the Bayesian posterior. The ensemble approach has several advantages—applied rigorously, it significantly reduces the risk of over-fitting, and provides a framework to estimate distributions of individual variable effects. As chosen from a prior sensitivity analysis, ensembles for this study consisted of 248 individual component models.
To produce each model in the ensemble, REFS scores the posterior probability of a vast number of putative models, using a maximum entropy structural prior as previously described. 13 A model’s Bayesian score is approximated by marginalizing out the model parameters and applying the Bayesian Information Criterion, which penalizes complexity. Since the space of possible models is too large to enumerate, REFS uses a Markov Chain Monte Carlo approach to generate samples from the equilibrium distribution of models weighted by their score. Each subsequent evaluation corresponds to a small local transformation, such as adding or removing a single model term. To accelerate convergence, a simulated annealing approach was used to obtain samples from the desired posterior distribution. For further detail on REFS, we refer the reader to the appendix.
Prediction model ensembles, ß estimates, predicted probabilities, and area under the (receiver operating characteristic) curve (AUC) estimates were generated using REFS. Supplemental analyses, including Kaplan–Meier plots and multivariable Cox regression models, were conducted using R (version 2.15.0). Cox model estimates are reported as hazard ratios (HRs) with 95% confidence intervals (CIs). Effect estimates were adjusted for factors selected by REFS, in addition to available diabetes risk factors identified a priori.3,4
Results
We evaluated 24 331 eligible patients for progression outcomes. During follow-up, 15% (N = 3765) were diagnosed with T2D. Transition to prediabetes was observed in 46% of the study population. The rate of progression from normoglycemia to T2D was 4.72 events per 100 person-years; normoglycemia to prediabetes, 18.72 events per 100 person-years; prediabetes to T2D, 8.6 events per 100 person-years. Distributions of baseline characteristics by T2D status are listed in Table 1. Patients in the study population were likely to be female, Caucasian, and from the Midwest region. The distributions of T2D events suggested positive associations with: male gender, older age, African American race, South region, inconsistent insurance coverage, low income, hypertension, obesity, higher blood glucose at baseline, high triglycerides, and dyslipidemia (Table 1).
Distributions of Selected Baseline Characteristics Among the Primary Study Population (N = 24 331), and Proportion Progressing to Type 2 Diabetes, Humedica Electronic Health Records Data Sample, 2007-2012.
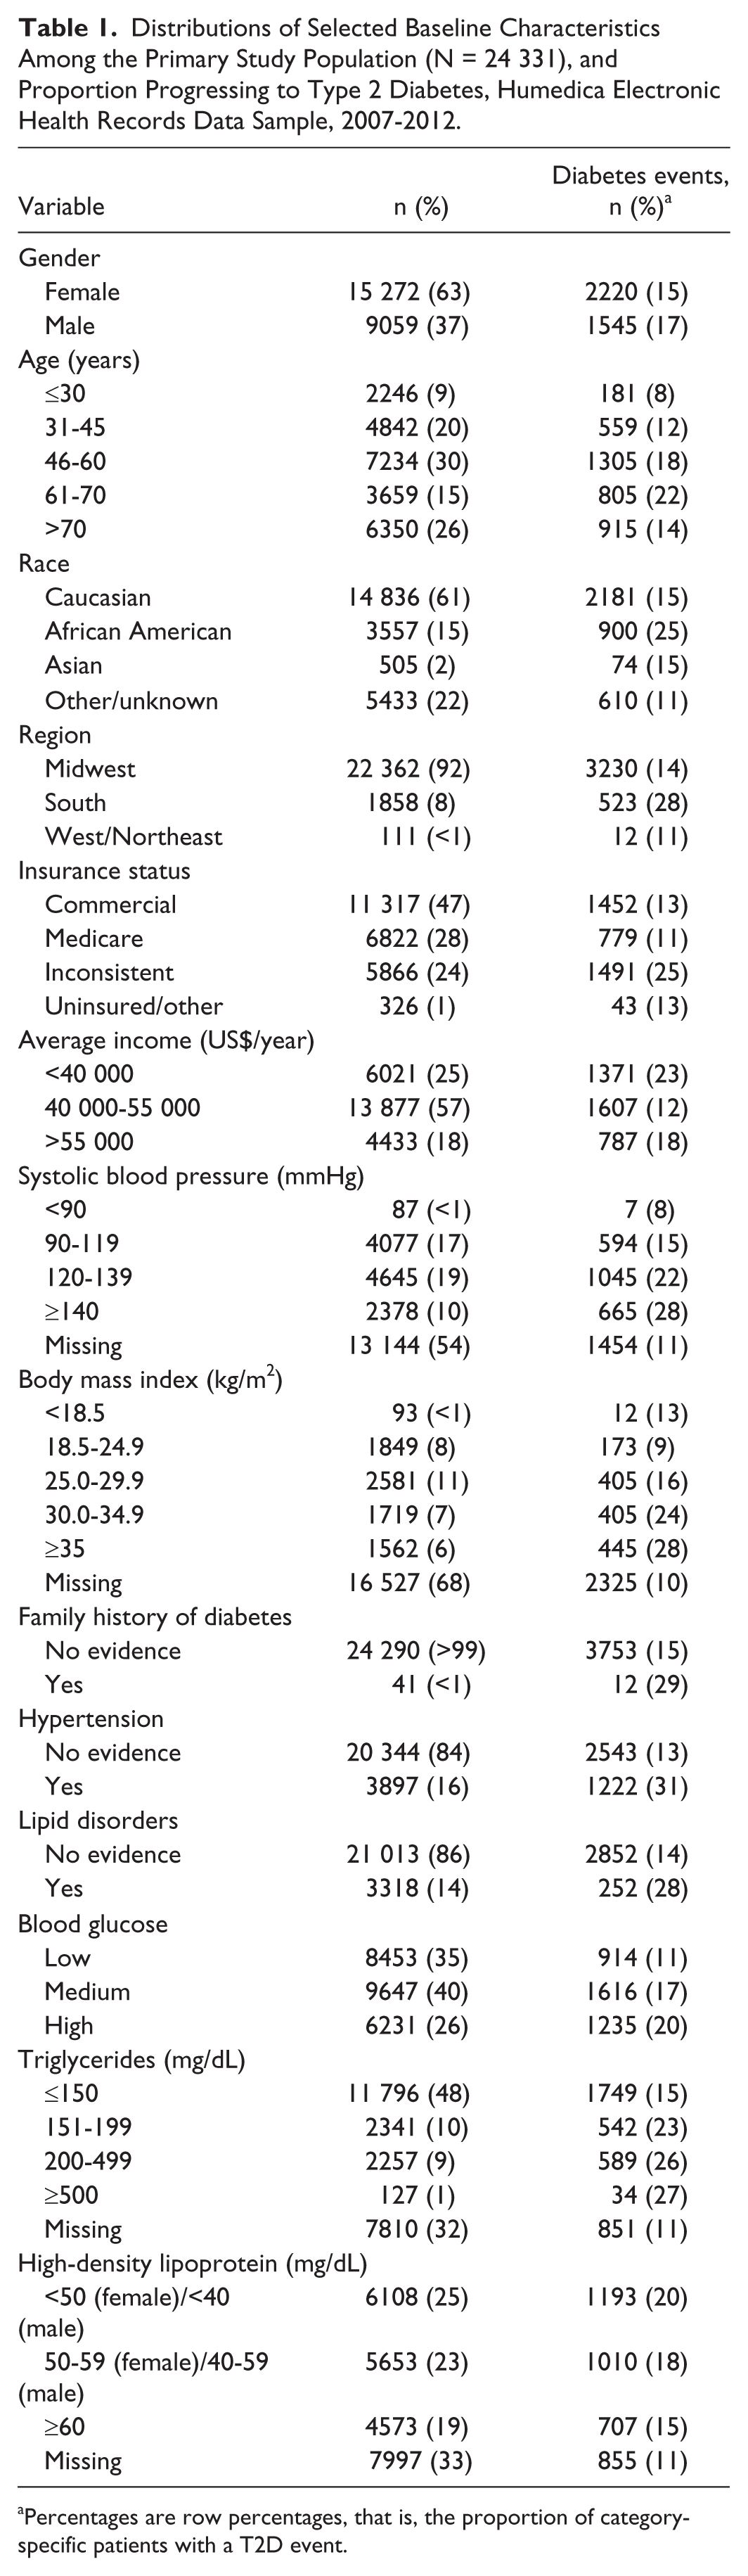
Percentages are row percentages, that is, the proportion of category-specific patients with a T2D event.
Consistent predictors for the 3 progression model ensembles are summarized in Table 2. We first evaluated predictors in each REFS ensemble by identifying the proportion of models that include each factor (selection frequency). For progression from normoglycemia to T2D, factors that were selected in every component model included blood glucose (test-specific tertiles), hypertension, income, insurance status, race, and triglycerides. Additional factors frequently selected were lipid disorders (97%), and systolic blood pressure (77%). Those with high baseline blood glucose progressed to T2D nearly 3 times faster on average, relative to those in the lowest category (HR = 2.95, 95% CI: 2.69, 3.23; Table 2, Figure 2). We observed a dose-response relationship between triglycerides and progression to T2D (Table 2, Figure 2). Patients with hypertension (HR = 1.33, 95% CI: 1.23, 1.44) or lipid disorders (HR = 1.18, 95% CI: 1.08, 1.29) progressed faster, and self-reported race (African American vs Caucasian, HR = 1.60, 95% CI: 1.47, 1.75) predicted progression to T2D (Table 2).
Variable Selection Frequency and Effect Estimates for Selected Patient Factors Across 3 Models of Progression to Prediabetes or T2D, Humedica Electronic Health Records Data Sample, 2007-2012.
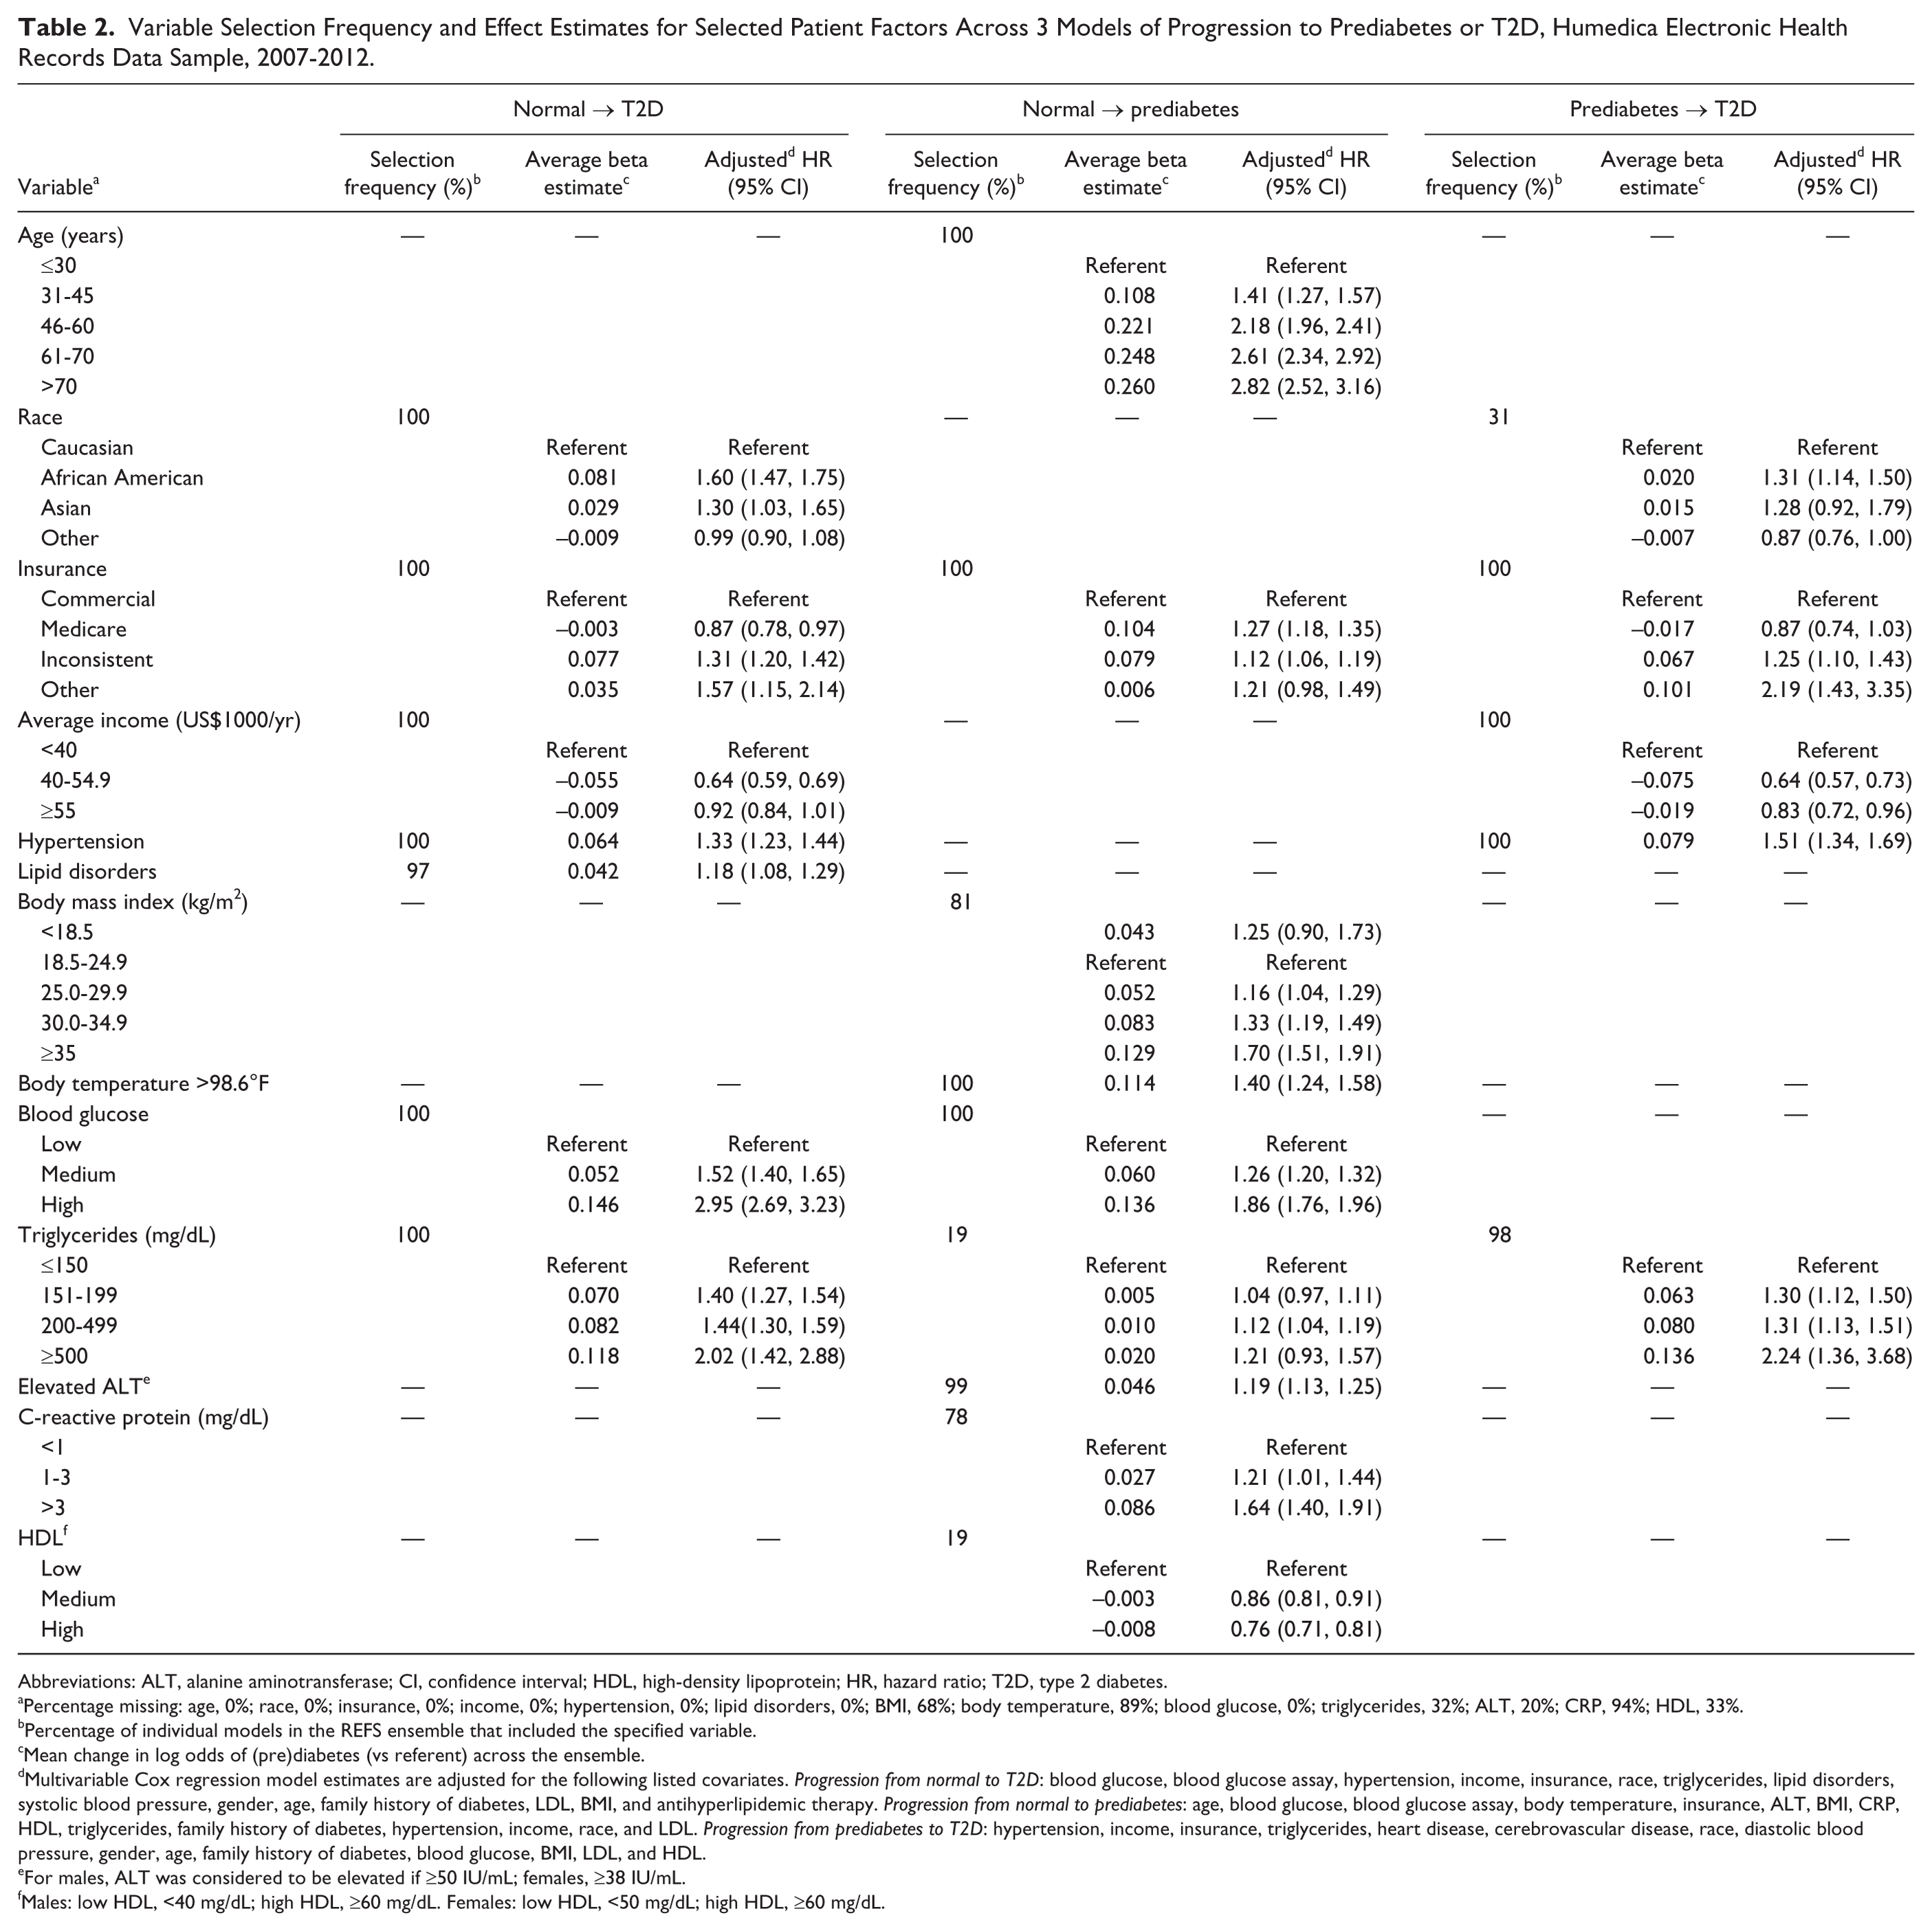
Abbreviations: ALT, alanine aminotransferase; CI, confidence interval; HDL, high-density lipoprotein; HR, hazard ratio; T2D, type 2 diabetes.
Percentage missing: age, 0%; race, 0%; insurance, 0%; income, 0%; hypertension, 0%; lipid disorders, 0%; BMI, 68%; body temperature, 89%; blood glucose, 0%; triglycerides, 32%; ALT, 20%; CRP, 94%; HDL, 33%.
Percentage of individual models in the REFS ensemble that included the specified variable.
Mean change in log odds of (pre)diabetes (vs referent) across the ensemble.
Multivariable Cox regression model estimates are adjusted for the following listed covariates. Progression from normal to T2D: blood glucose, blood glucose assay, hypertension, income, insurance, race, triglycerides, lipid disorders, systolic blood pressure, gender, age, family history of diabetes, LDL, BMI, and antihyperlipidemic therapy. Progression from normal to prediabetes: age, blood glucose, blood glucose assay, body temperature, insurance, ALT, BMI, CRP, HDL, triglycerides, family history of diabetes, hypertension, income, race, and LDL. Progression from prediabetes to T2D: hypertension, income, insurance, triglycerides, heart disease, cerebrovascular disease, race, diastolic blood pressure, gender, age, family history of diabetes, blood glucose, BMI, LDL, and HDL.
For males, ALT was considered to be elevated if ≥50 IU/mL; females, ≥38 IU/mL.
Males: low HDL, <40 mg/dL; high HDL, ≥60 mg/dL. Females: low HDL, <50 mg/dL; high HDL, ≥60 mg/dL.
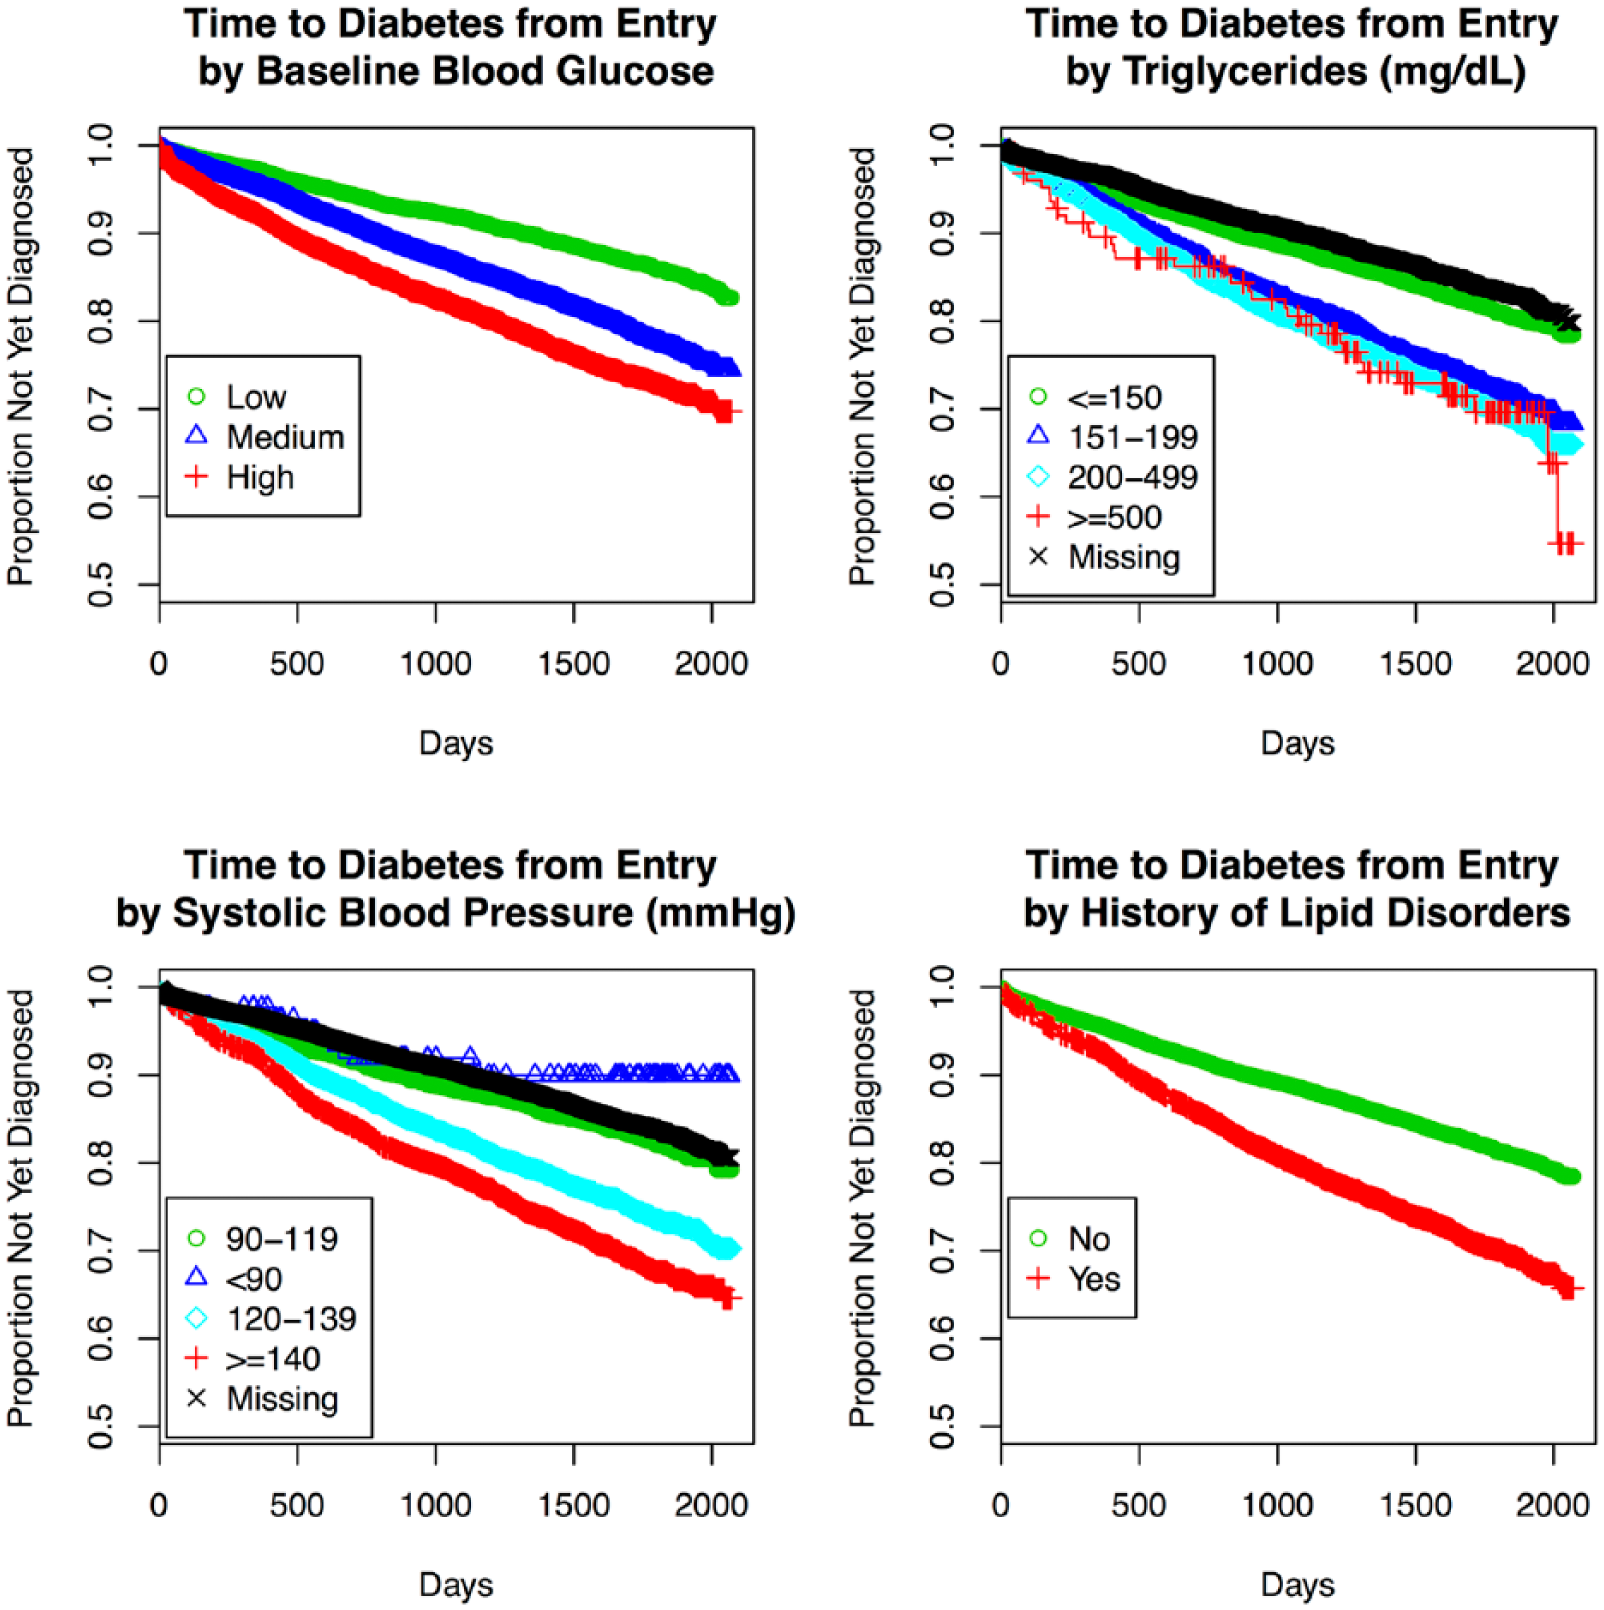
Kaplan–Meier plots for time to T2D by selected (potentially modifiable) patient factors: baseline blood glucose measures, triglycerides, systolic blood pressure, and history of lipid disorders, Humedica electronic health records data sample, 2007-2012.
To evaluate predictive performance of the ensemble, we calculated AUC statistics. For the ensemble predicting progression from normoglycemia to T2D, AUC was 0.76, reflecting moderately strong accuracy in predicting T2D (Figure 3). To assess performance of the model outside of the training data, we tested the ensemble in a separate data set (the non-IDN population; N = 189 082). In this testing set, AUC of the ensemble predicting progression to T2D from normoglycemia was 0.78, indicating consistency with the training data. For context, investigators of the Framingham Offspring Study reported an AUC of 0.72 for their “personal model” (consisting of variables that would generally be known to a patient, ie, age, sex, parental history of diabetes, BMI), and an AUC of 0.85 when clinical variables (oral glucose tolerance, fasting insulin, CRP, and indexes indicating insulin sensitivity/resistance) were included. 6 Our ensemble of prediction models exhibited comparable performance, using EHR data, even though some key predictors used by the Framingham investigators were not uniformly available (ie, family history of diabetes, waist circumference).
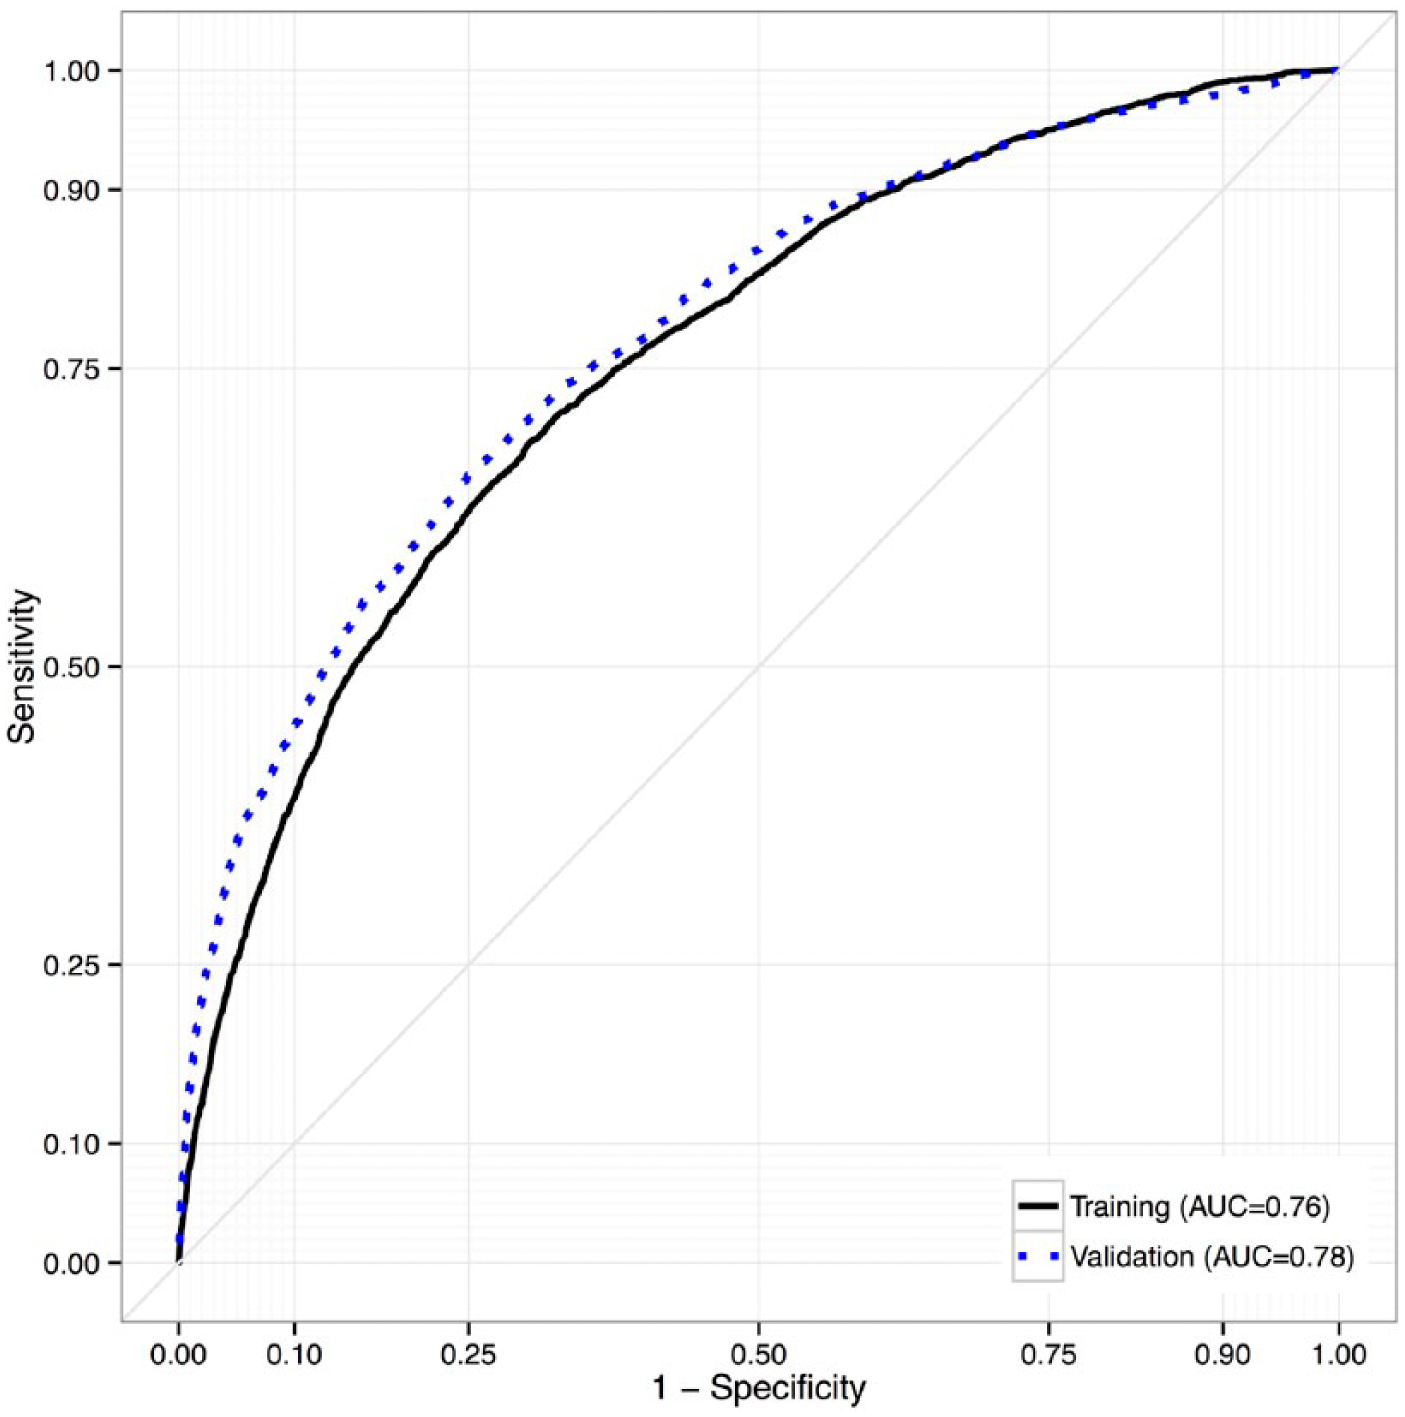
Receiver operating characteristic curves for accuracy of the REFS ensemble in predicting progression to diabetes (from normoglycemia) in the training and testing data sets, Humedica electronic health records data sample, 2007-2012.
In addition, we generated individual diabetes risk distributions for 2 patients with contrasting covariate profiles (Figure 4). Patient 59 was a 48-year-old Caucasian female from a high-income area (mean = $68 000/year), with a baseline random glucose of 81 mg/dL, low triglycerides (73 mg/dL), without hypertension or a lipid disorder. Her corresponding 3.5-year risk of progressing to T2D ranged from 6% to 10%, with a mean of 9.2%. Patient 5076 was a 46-year-old African American female from a low-income area (mean = $32 000/year), with a baseline random glucose of 128 mg/dL, high triglycerides (508 mg/dL), hypertension, and a lipid disorder. Her predicted 3.5-year risk of progressing to T2D ranged from 70% to 84% (mean = 77.0%). During follow-up, patient 5076 progressed to T2D, while patient 59 did not.
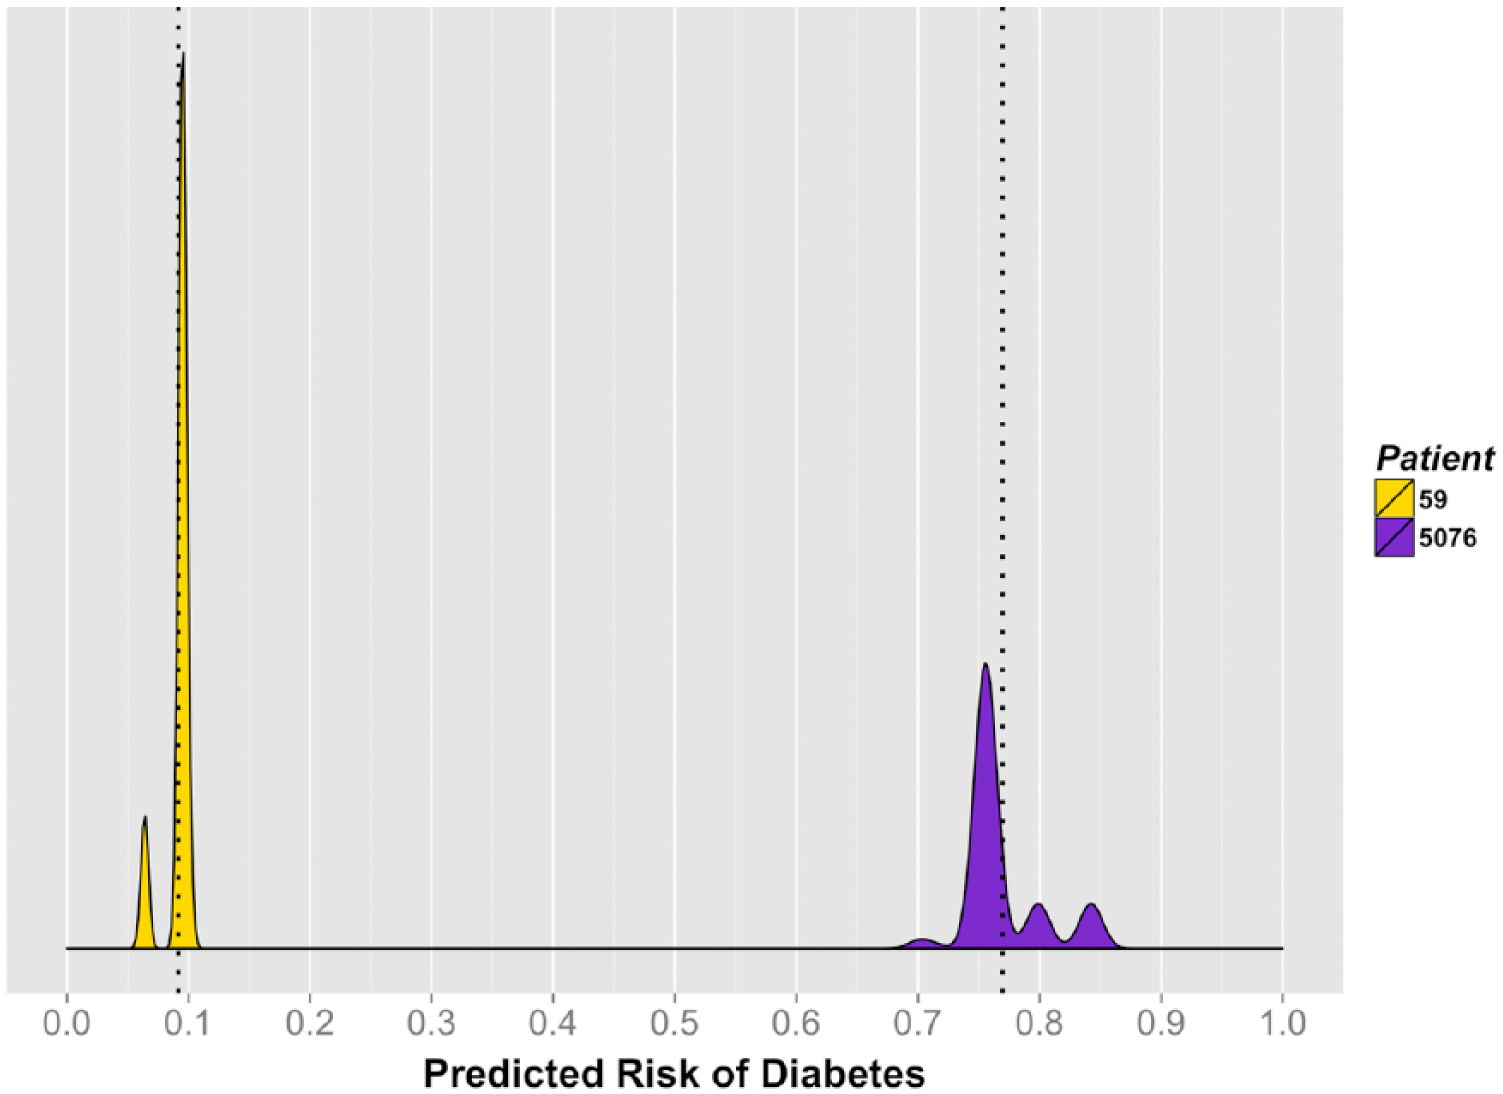
Individual 3.5-year risk of diabetes for 2 selected patients, Humedica electronic health records data sample, 2007-2012.
A summary of the predictors of progression to prediabetes can be found in Table 2. Consistent with the T2D model, baseline blood glucose and insurance status were selected in every component model. Additional predictors of prediabetes included age (100%), body temperature (100%), ALT (99%), BMI (81%), CRP (78%), triglycerides (19%), and HDL (19%; Table 2). Specifically, positive dose-dependent associations with prediabetes were identified for age, baseline blood glucose, BMI, and CRP. We also observed a negative association between rate of progression to prediabetes and HDL (Table 2). In addition, higher baseline body temperature, Medicare coverage, and elevated ALT were associated with faster progression to prediabetes (Table 2). Of note, missingness of some variables (ALT, BMI, CRP, HDL, triglycerides) appeared to be associated with progression (Table 2). Whereas many of the selected predictors are recognizable as established risk factors for diabetes, others (ALT, HDL, CRP, and body temperature) may be novel in that they represent plausible but still emerging areas of diabetes research and targets for intervention. Kaplan–Meier plots for time to prediabetes by these factors are displayed in Figure 5. The corresponding AUC for the ensemble predicting progression from normoglycemia to prediabetes was 0.70 (testing set, AUC = 0.72).
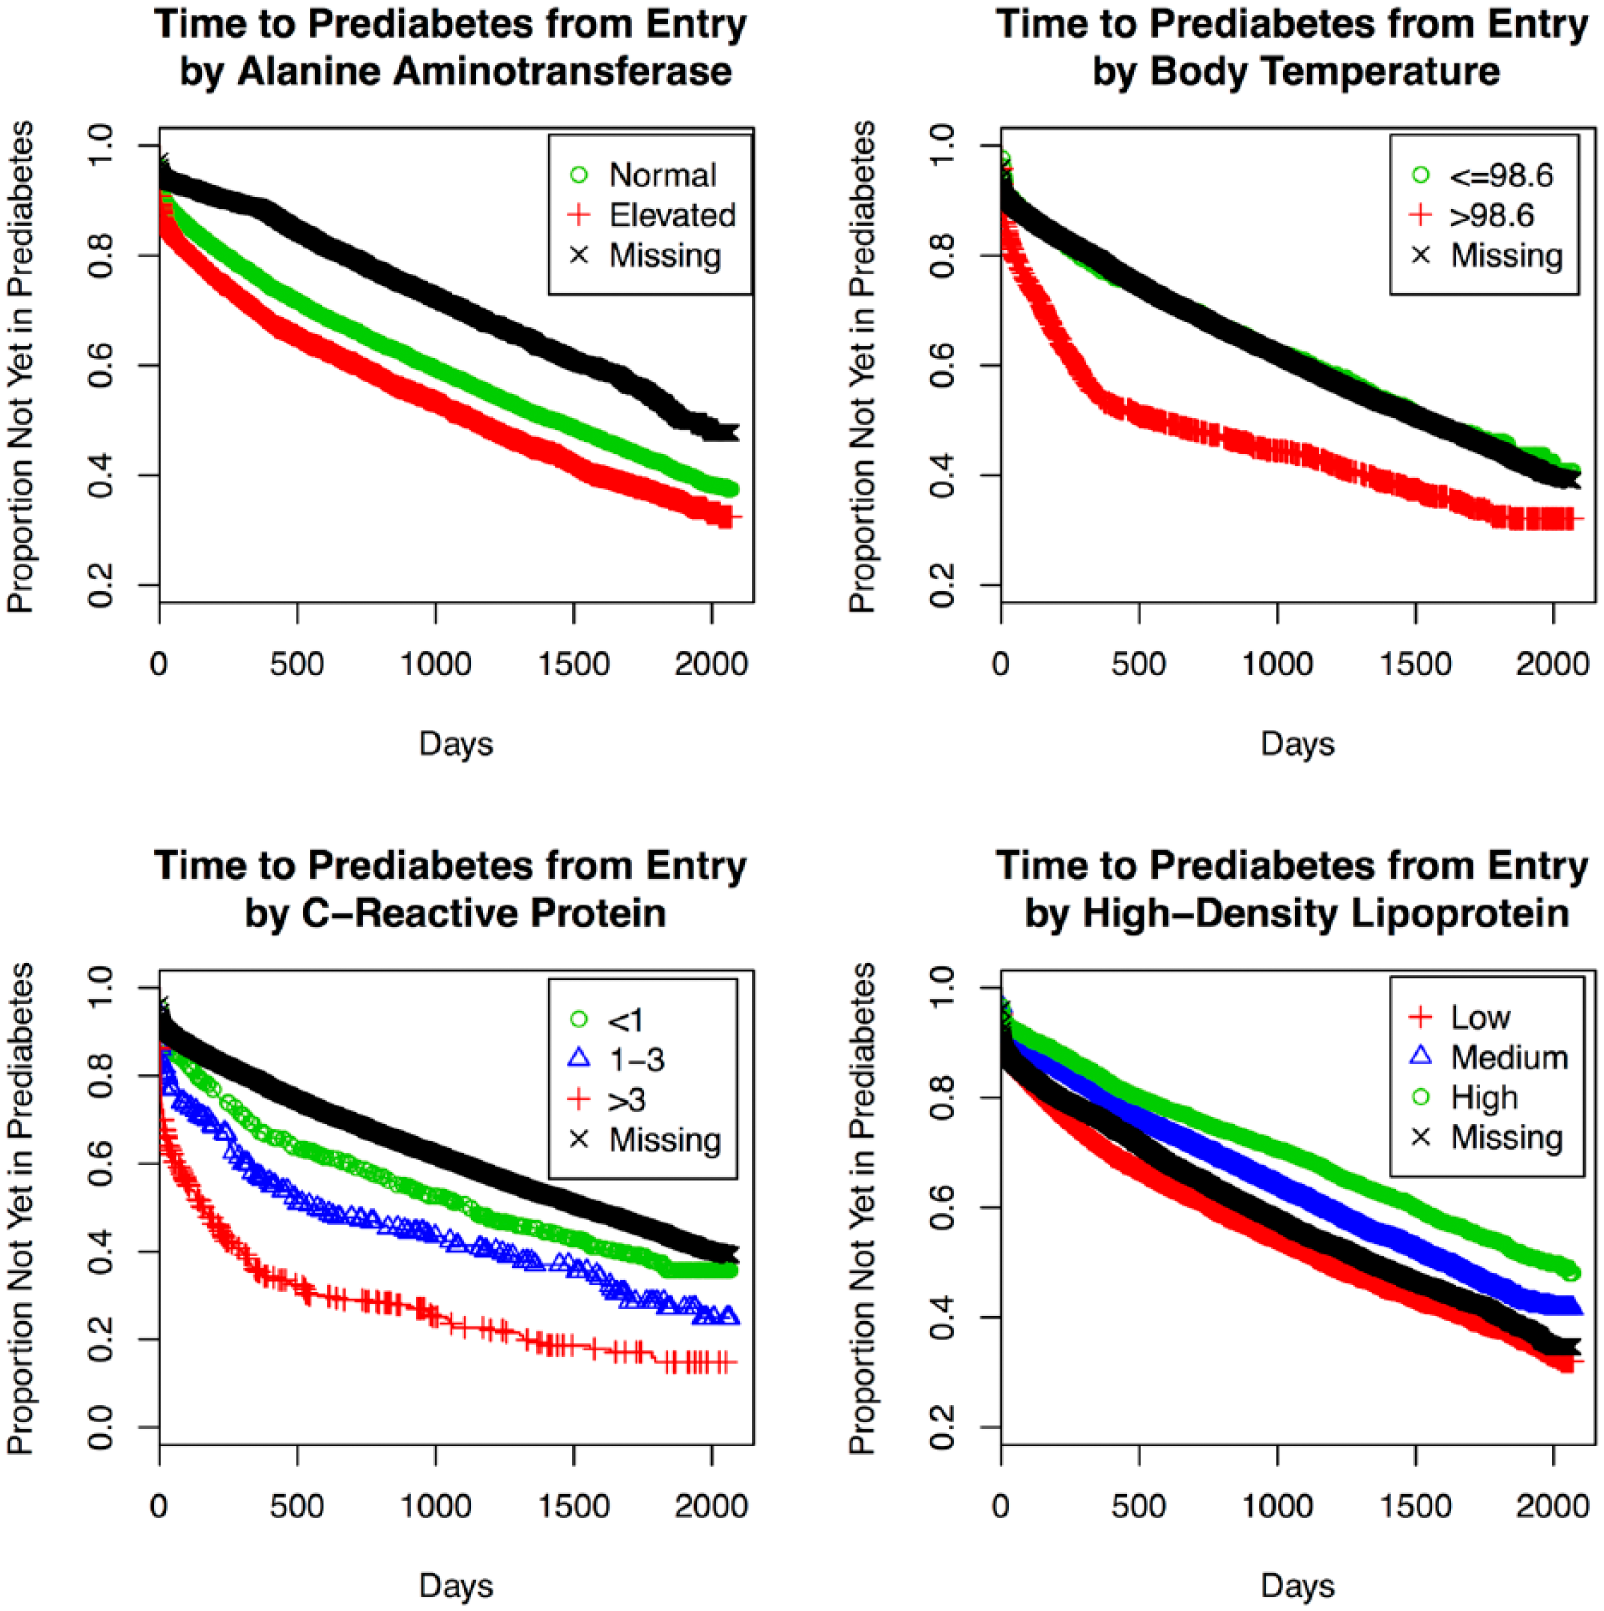
Kaplan–Meier plots for time to prediabetes by selected patient factors, Humedica electronic health records data sample, 2007-2012.
Table 2 also summarizes the prediction model ensemble for progression from prediabetes to T2D (n = 10 616). Hypertension, income, and insurance status were uniformly represented. Additional predictors included triglycerides (98%), heart disease (92%), cerebrovascular disease (73%), race (31%), and diastolic blood pressure (29%). Positive associations with progression from prediabetes to T2D were observed for hypertension, low income, triglycerides, and African American race. Whereas this baseline model ensemble performed reasonably well in predicting progression within the training set (AUC = 0.71), it was not replicated in the testing set (AUC = 0.58). A possible explanation for this phenomenon could be a higher proportion of unspecified information on race in the non-IDN study population (51% vs 24%).
Discussion
Using a hypothesis-free machine learning ensemble approach, we have constructed a series of prediction models that identify the patient factors most associated with progression to T2D in real-world EHR data. Despite inherent noise that generally afflicts such data, predictive accuracy was relatively strong. The ensemble for progression from normoglycemia to T2D showed high predictive value in particular, and was replicated in the testing data set. Performance of our models was comparable to prediction models that have previously been reported (range, 0.71 to 0.88), though a validation study conducted by Abbasi et al suggested that nearly all models considered had overestimated T2D risk. 5 Given the size of our data sample, we expect that accuracy would be stable across external data sets, though further validation is warranted.
Although the REFS platform learns models directly from data without prespecified hypotheses, several patient factors considered to be established correlates of T2D were selected. Specifically, blood glucose measures, age, race, triglycerides, BMI, and blood pressure/hypertension have consistently been identified as risk factors for development of T2D, and were confirmed to varying degrees in our study. 3 Identification of such factors serves to qualitatively validate both the analytical methods and the source data, while strengthening the body of evidence that these factors are mechanistically linked to diabetes progression. Conversely, other factors previously thought to associate with T2D were not replicated here. Some of these variables may not have been selected because they were not widely available (ie, family history, lifestyle factors); others may not have additional explanatory value once other factors are accounted for (ie, gender). We expect that more complete data on relevant covariates would further improve the accuracy of similar prediction models.
In addition to established risk factors, relatively novel predictors were also identified, particularly in prediabetes models. First, HDL was consistently selected throughout progressive iterations of modeling. Although HDL only appeared in 19% of primary ensemble models for progression to prediabetes, results from survival analysis suggested a moderate inverse relationship between HDL and rate of progression to prediabetes, including a 24% slower rate of progression among those within the highest level of HDL versus the (gender-specific) lowest HDL category. This finding is consistent with emerging evidence for a role for HDL in diabetes pathophysiology, with several plausible mechanisms of action having been proposed. 14 An association between the B1B1 Taq1B genotype, which leads to marked decrease in HDL levels, and T2D has been reported (odds ratio, 1.83; 95% CI, 1.12, 2.99). 15 In a post hoc analysis of the ILLUMINATE trial, a lower proportion of participants on atorvastatin plus torcetrapib (a drug that elevates HDL levels) developed T2D, relative to those on atorvastatin alone. 16 This difference was only marginally significant (P = .09), likely due to few events. Taken together, HDL represents an intriguing opportunity for identification of individual diabetes risk and for clinical intervention.
Elevated ALT was also selected as a predictor of prediabetes, associated with a 19% faster rate of progression. A hepatic enzyme, ALT is used as a biomarker to assess severity of liver dysfunction, and some investigators have suggested a link with T2D. Vozarova et al reported a nearly 2-fold increased hazard of diabetes associated with the 90th versus 10th percentile of ALT (HR = 1.9, 95% CI: 1.1, 3.3). 17 In a recent meta-analysis, investigators calculated a pooled adjusted relative risk of diabetes of 1.26 (95% CI: 1.14, 1.41) per standard deviation change in log-transformed ALT. However, after a statistical correction for publication bias was applied, this estimate became nonsignificant. 18 Thus the role of ALT in diabetes is not yet established. ALT is a marker of nonalcoholic fatty liver disease, which has been associated with insulin resistance, therefore the connection is plausible. 19 Our findings suggest that the magnitude of the effect of ALT may be low, and may be unique in having a large enough sample size to detect this association.
Two other factors, CRP and body temperature, also emerged as predictors of prediabetes, although these measures were not consistently documented (6% and 11% respectively). CRP, a marker of systemic inflammation, may be elevated in obese individuals, and has been linked to T2D. Investigators in the Rotterdam Study reported a 67% increased hazard of T2D in individuals with elevated CRP, consistent with our findings (>3 vs <1 mg/dL, HR = 1.63, 95% CI: 1.39, 1.90), and estimated that one-third of diabetes in the Dutch population may be attributable to CRP. 20 Evidence for a mechanistic role of body temperature in diabetes is currently limited. A recent study in a rodent model demonstrated that direct injection of insulin into the hypothalamus resulted in dose-dependent increases in core body temperature. 21 As progressive declines in insulin sensitivity lead to greater levels of circulating insulin, a link between diabetes pathophysiology and higher core body temperature is plausible. Further research is warranted to establish the clinical significance of CRP and body temperature in diabetes.
Limitations of our study were primarily related to the availability of data. First, patients were not observed uniformly. Changes in status are not always recorded, and availability of clinical data itself may not be a random process. In some cases, variables that are likely to be associated with diabetes (ie, family history, smoking, adiposity measures) were not widely available in the data sample. For others (ie, BMI, CRP), available measures were not frequently updated. It is likely that a similar analysis in a more comprehensive data set would result in improved accuracy for resulting prediction models. Still, our prediction model ensembles performed strongly in an EHR sample that is representative of real-world clinical data. Last, interpretation of our baseline prediction models may be somewhat limited in that they were not designed to assume direct causality, and patient measures were not updated in follow-up.
Although specific to diabetes, our study illustrates the value of applying machine learning to identify and characterize risk factors for health care outcomes from EHR data. These methods could be especially valuable in contexts where disease processes or interventions are not well established. Last, our method of real-world data-driven modeling could have an impact on health care by identifying at-risk patients early enough to present opportunities for prevention and clinical management. For example, in this report we closely examined 2 patients, and projected their individual risk profiles. Incorporation of personalized risk profiles such as these into standard clinical evaluation could have potential for increasing the specificity and success of targeted interventions.
Conclusions
We constructed accurate prediction model ensembles for progression to T2D using a novel machine learning platform based on Bayesian mathematics and an extensive EHR database. These results confirmed established risk factors for T2D and identified novel factors, for which roles in diabetes pathophysiology are plausible. Our approach has potential wide-ranging applications in several disease areas, and could be developed into powerful tools for health care research, as well as for clinical applications related to personalized risk assessment and targeted interventions.
Footnotes
Appendix
Acknowledgements
The authors would like to thank Ngoc Thai and Karl Runge for technical assistance.
Abbreviations
ALT, Alanine aminotransferase; AUC, area under the curve; BMI, body mass index; CI, confidence interval; CRP, C-reactive protein; EHR, electronic health record; HbA1c, hemoglobin A1c; HDL, high-density lipoprotein; HR, hazard ratio; IDN, integrated delivery network; LDL, low-density lipoprotein; REFS, Reverse Engineering and Forward Simulation; T2D, type 2 diabetes.
Declaration of Conflicting Interests
The author(s) declared the following potential conflicts of interest with respect to the research, authorship, and/or publication of this article: All authors were employed by either GNS Healthcare or Pfizer at the time this research was conducted.
Funding
The author(s) disclosed receipt of the following financial support for the research, authorship, and/or publication of this article: The research described in this report was funded by Pfizer, Inc. No financial support was received from any public or not-for-profit agency.