
Abstract
Keywords
Metformin is recommended as the preferred initial pharmacologic agent for treatment of type 2 diabetes (T2D), provided there are no contraindications to its use.1-4 When glycemic goals are not achieved with metformin alone, an individualized approach to intensification of therapy is recommended. Glycemic control is defined as achieving glycated hemoglobin (A1C) levels of ≤ 6.5 to 7% in the majority of individuals with T2D, provided that this can be safely achieved with minimal risk for hypoglycemia and weight gain.1-3 For older adult patients with coexisting comorbidities, these A1C targets can be modified to goals of <8 to 8.5% depending on the severity of the associated chronic illnesses or anticipated life expectancy.5,6
The degree to which these recommendations for therapeutic intensification are implemented in outpatient clinical settings is not known. 7 There are several classes of glucose lowering agents available for therapeutic intensification in T2D. These include insulin secretogogues, thiazolidinediones (TZD), dipeptidyl peptidase-4 (DPP-4) inhibitors, alpha glucosidase inhibitors, noninsulin injectable therapies, and insulin. There are no studies demonstrating the superiority of 1 agent over another for therapeutic intensification.1,8-10 The National Institutes of Health–sponsored study Glycemia Reduction Approaches in Diabetes (GRADE) Study is currently recruiting patients with T2D for a study that will compare glycemic outcomes with a sulfonylurea, DPP-4 inhibitor, a glucagon-like peptide 1 receptor agonist (GLP-1RA), or long-acting insulin added to metformin to determine if there are any advantages to 1 particular approach. Results from this study will not be available for several years. 11
Until these results are available, the emergence of the electronic medical record (EMR) for documentation of patient care provides the opportunity to identify patterns of pharmacologic intensification among patient populations with T2D. The EMR can also provide information on glycemic control over time.12,13 We report the results of a query into a large university-based EMR system that sought to identify patients with T2D with evidence of current therapy with 1 or 2 oral diabetes medications (ODM) who were candidates for intensification based on A1C values above 7%. The purpose of this investigation was to determine the ability of an EMR to identify patterns of therapeutic intensification of diabetes medications and associated changes in glycemic control.
Methods
This study was approved by the Institutional Review Board at the University of Pittsburgh. For this study we identified patients with T2D from the University of Pittsburgh Medical Center (UPMC) general and specialty outpatient clinics between June 2005 and November 2011. UPMC is an integrated health system that operates more than 20 academic, community, and specialty hospitals and 400 outpatient sites and employs more than 3500 physicians. The UPMC EMR data repository includes administrative and clinical data forwarded from the health system’s clinical, administrative, and financial databases. 14 The EMR includes patient demographics, office visits, medication lists, laboratory results, and charges from both inpatient and outpatient settings throughout the health system (EpicCare, Epic Systems Corp, Verona, WI; PowerChart, Cerner Corporation, Kansas City, MO). An interface (dbMotion, Inc, Pittsburgh, PA) connects and shares key information between systems.
Ambulatory EMRs from the UPMC data repository were searched to identify any patient visit that listed an ODM as an active medication. Simultaneously, all patients with an A1C during this time period were also identified (Figure 1). Patients identified as having A1C values ≥ 7.0% while on therapy with 1 or 2 ODM were grouped according to evidence of therapeutic intensification with any insulin therapy, a GLP-1RA (exenatide, liraglutide), an ODM in a class different from what was already being taken, or no intensification. Chart review was performed on all patients identified as receiving GLP-1RA to determine accuracy of the database query to verify the prescribing of this group of agents.
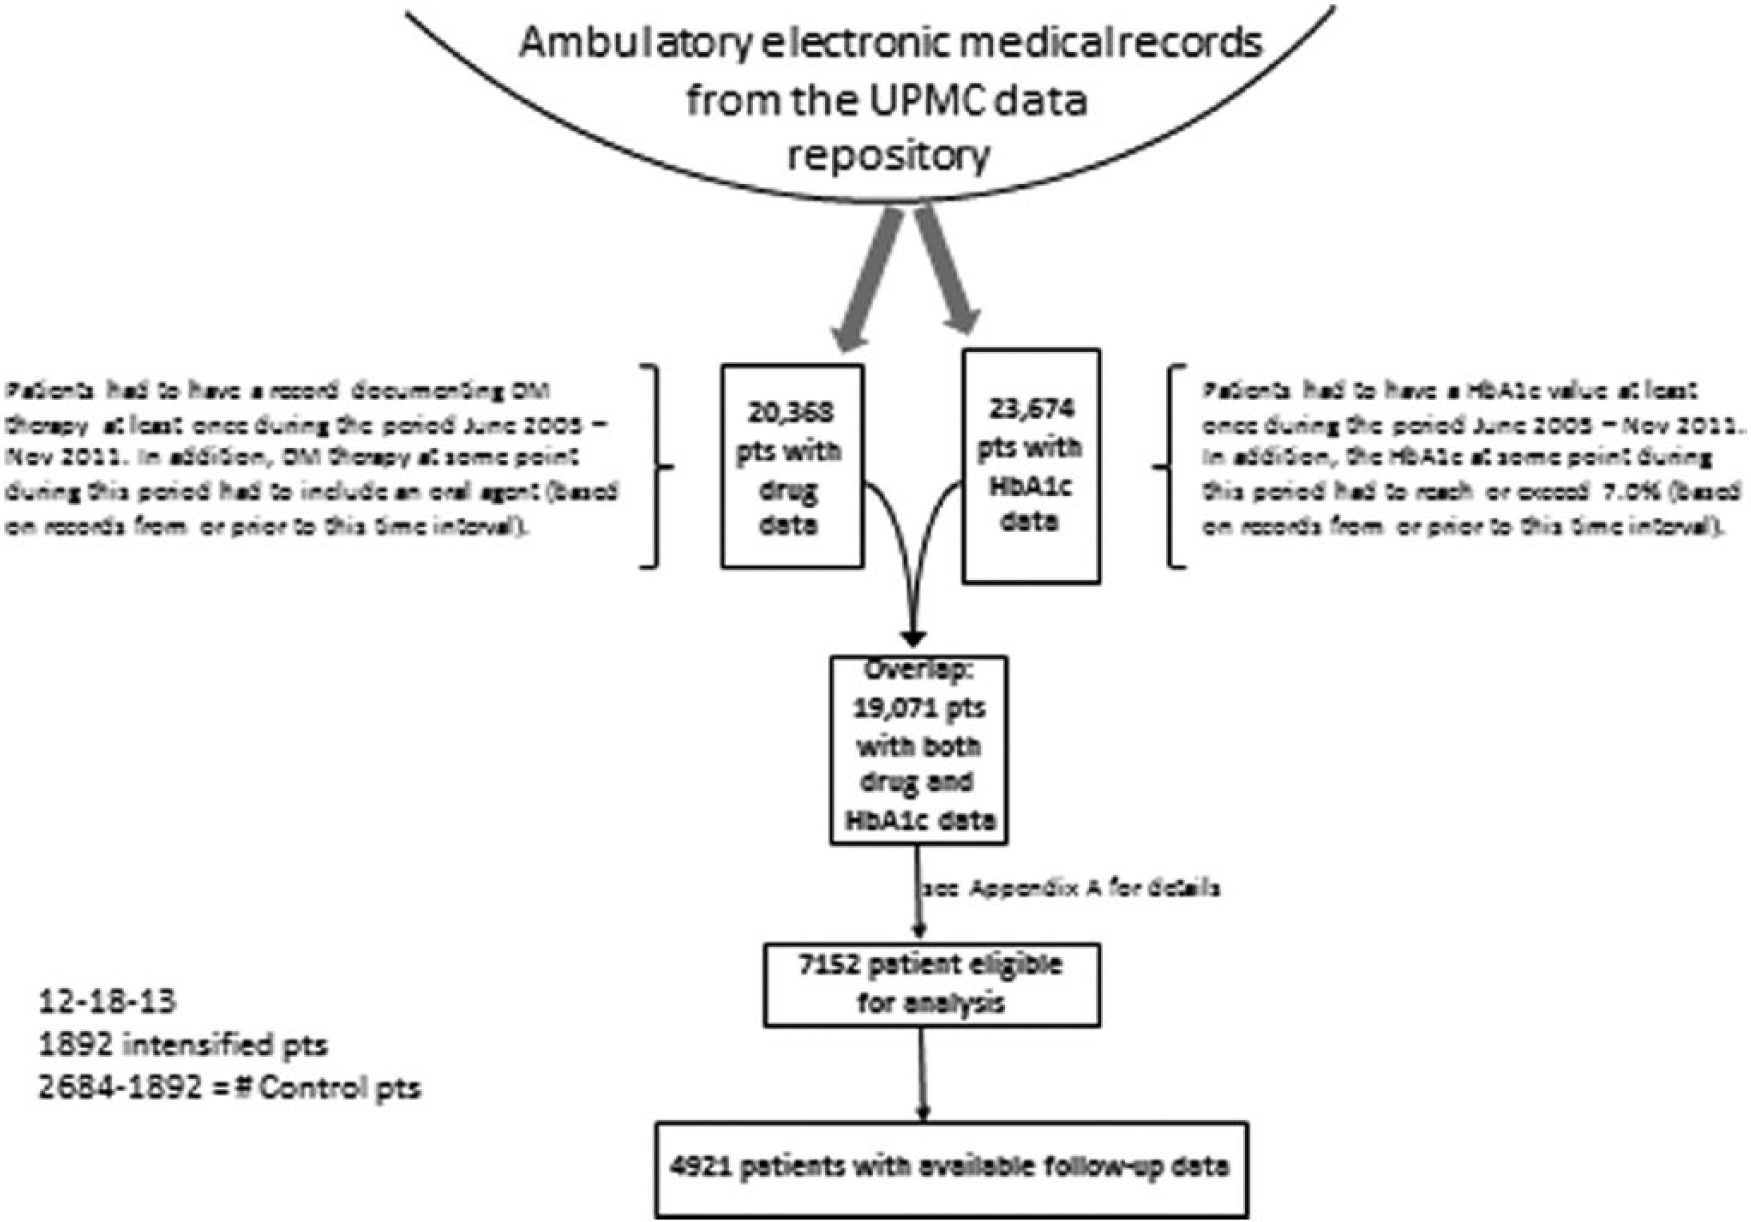
Scheme for identification of subjects meeting inclusion criteria for the study. Ambulatory EMRs from the UPMC data repository were searched to identify any patient visit that listed an ODM as an active medication between June 2005 and November 2011. Simultaneously, all patients with an A1C during this time period were also identified.
The first record following documentation of an A1C ≥ 7% with current prescriptions for ODM was identified as the index date, and the A1C at that time was identified as the baseline A1C. Patients identified as taking insulin, a GLP-1 RA, or a third ODM within a 6-month period prior to the index A1C were excluded (n = 36). Patients intensified with ≥ 2 agents at the time of the index A1C were also excluded (Appendix A).
Glycemic outcomes following intensification were defined as percentage reductions in A1C, the percentage of patients achieving A1C < 7%, and the percentage of patients who achieved ≥0.5% reductions in A1C at a median time point of 8 months following therapeutic intensification.
We also sought to determine the percentage of patients receiving intensification who remained on the assigned therapy without the addition of an agent from another group at 1 year. Patients were further grouped according to evidence of remaining on the intensification drug with the addition of ≥1 additional agent(s) or discontinuation of the intensification drug with or without the start of another agent (Figure 2).

Percentage of patients continuing intensified therapy (IT) at 1 year with insulin (black bars), GLP-1RA (hatched bars), or a third ODM. Data are presented as the percentage of patients remaining on the assigned IT without the addition of an agent from another group or with the addition of ≥ 1 additional agent(s); or discontinuation of the IT with or without the start of another agent.
Additional measures included changes in BMI (kg/m2), systolic (SBP) and diastolic (DBP) blood pressure, lipid parameters (HDL, non-HDL cholesterol, log transformed triglycerides), and renal function (serum creatinine). Changes in lipid parameters were defined as differences in mean concentrations obtained at baseline and follow-up, and changes in the percentage of patients with non-HDL cholesterol < 130 mg/dl and triglycerides < 150 mg/dl. Changes in renal function were defined as the average annual increase in serum creatinine, the percentage of patients experiencing ≥50% increase in serum creatinine, and the percentage of patients with an initial serum creatinine ≤ 2.0 mg/dl who progressed to a value >2.0 mg/dl.
Statistics
Comparisons were conducted among the 3 groups receiving therapeutic intensification and between the intensified and nonintensified subjects. Categorical variables were compared with chi-square tests and continuous variables were compared with either ANOVA or t tests, depending, respectively, on whether more than 2 or exactly 2 groups were being compared. Adjusted changes in continuous variables, such as A1C and BMI, were analyzed with linear regression models adjusting for baseline differences in age, sex, race (black vs nonblack), baseline A1C, BMI, systolic and diastolic blood pressure, triglycerides (log scale), HDL, non-HDL, and creatinine. The number of subjects with baseline and follow-up data varied according to each measured variable (Appendix B). To adjust for variables with missing values, the missing values were replaced by an arbitrary numeric value (0), and a separate indicator variable (0/1) was included in the model, where the numeric value of 1 represented the records with missing values. Through this technique, all records were kept in the regression models.
Results
There were 7152 patients identified who met inclusion criteria (Figure 1). Of these, 4921 patients had both baseline and follow-up A1C measurements (Table 1). The majority of patients did not receive therapeutic intensification. These patients were older and more metabolically healthy with lower BMI, A1C, and triglyceride values and higher HDL cholesterol than the intensified groups (Tables 1 and 2).
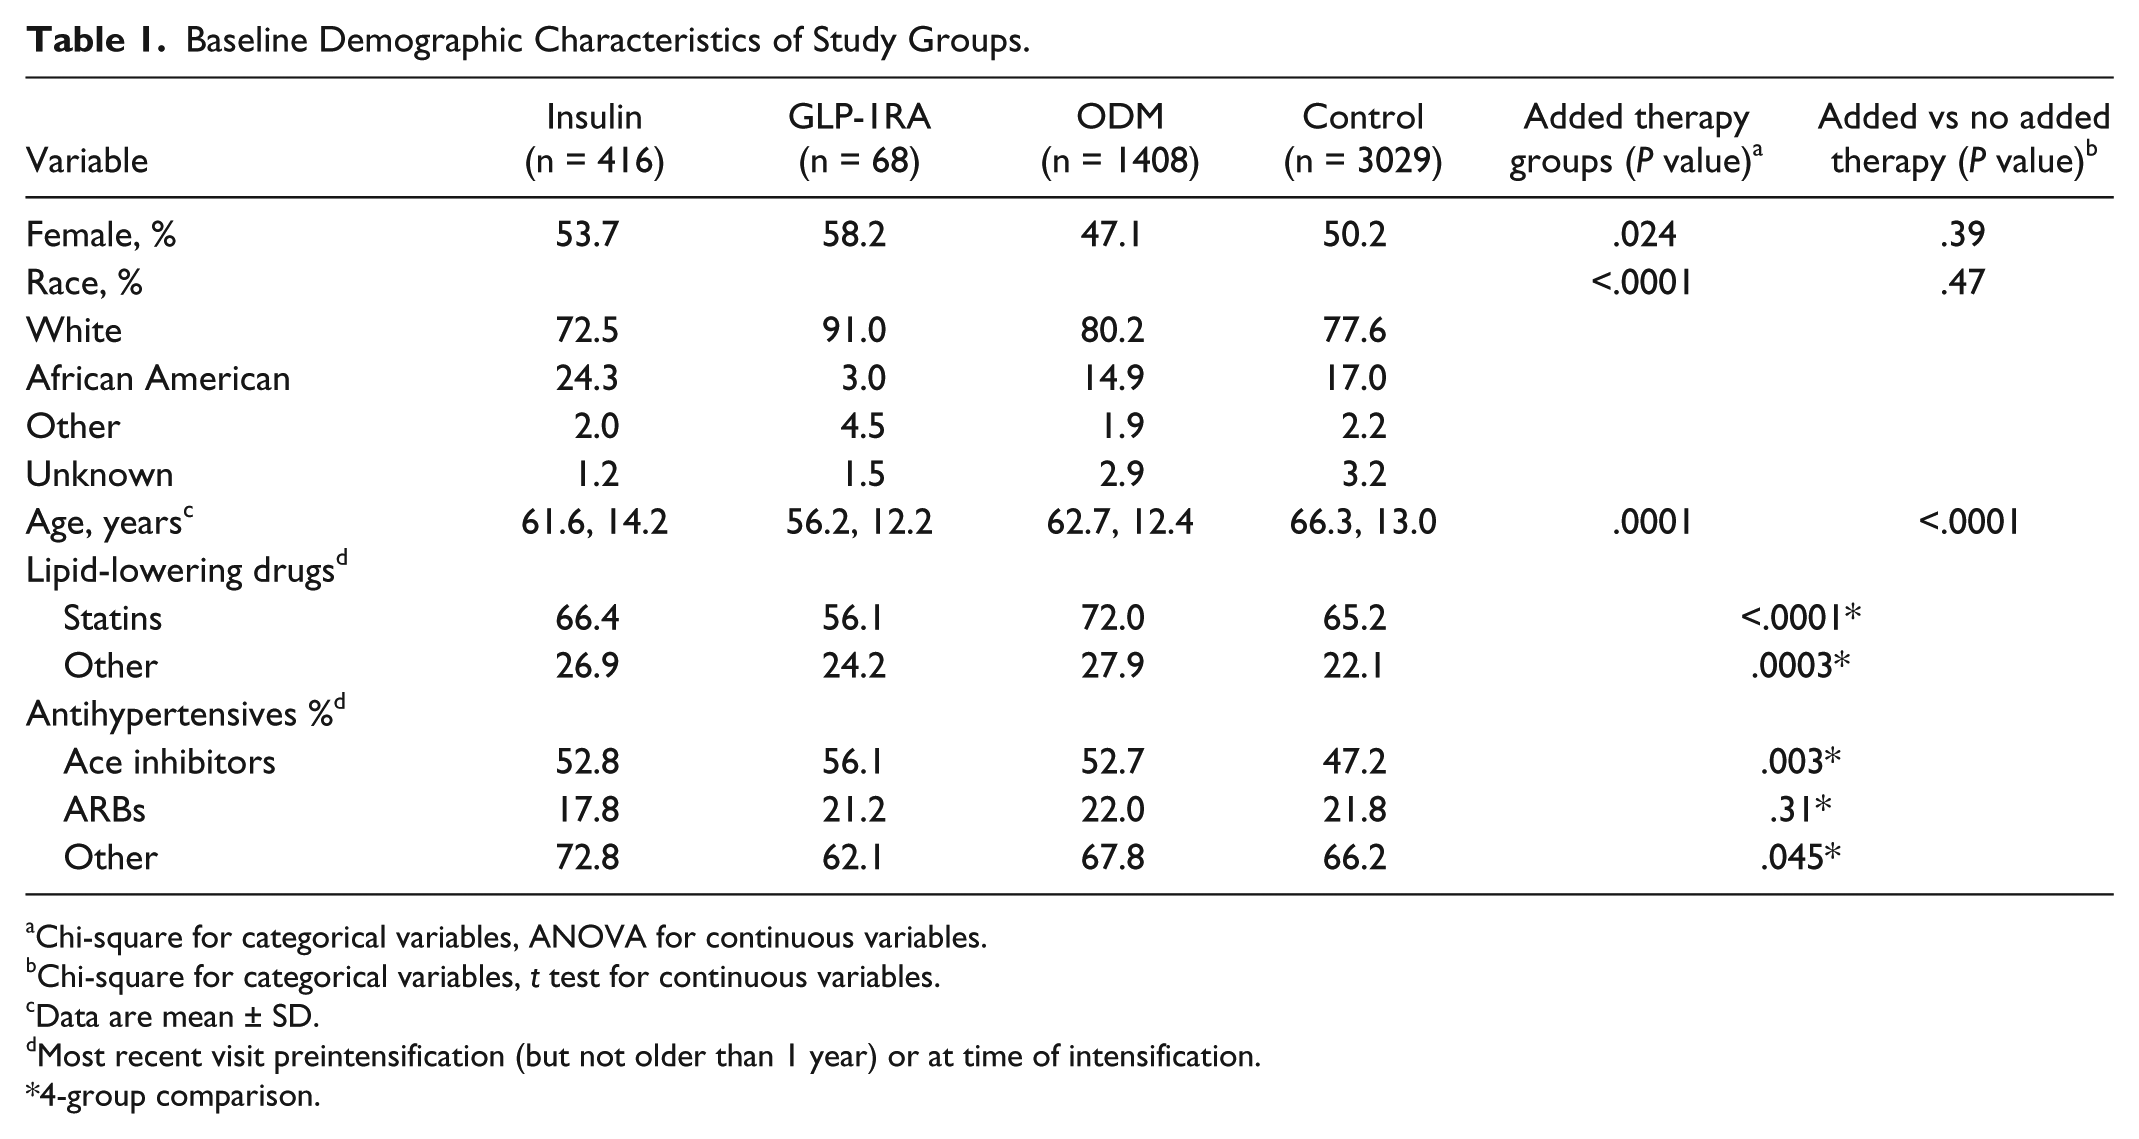
Baseline Demographic Characteristics of Study Groups.
Chi-square for categorical variables, ANOVA for continuous variables.
Chi-square for categorical variables, t test for continuous variables.
Data are mean ± SD.
Most recent visit preintensification (but not older than 1 year) or at time of intensification.
4-group comparison.
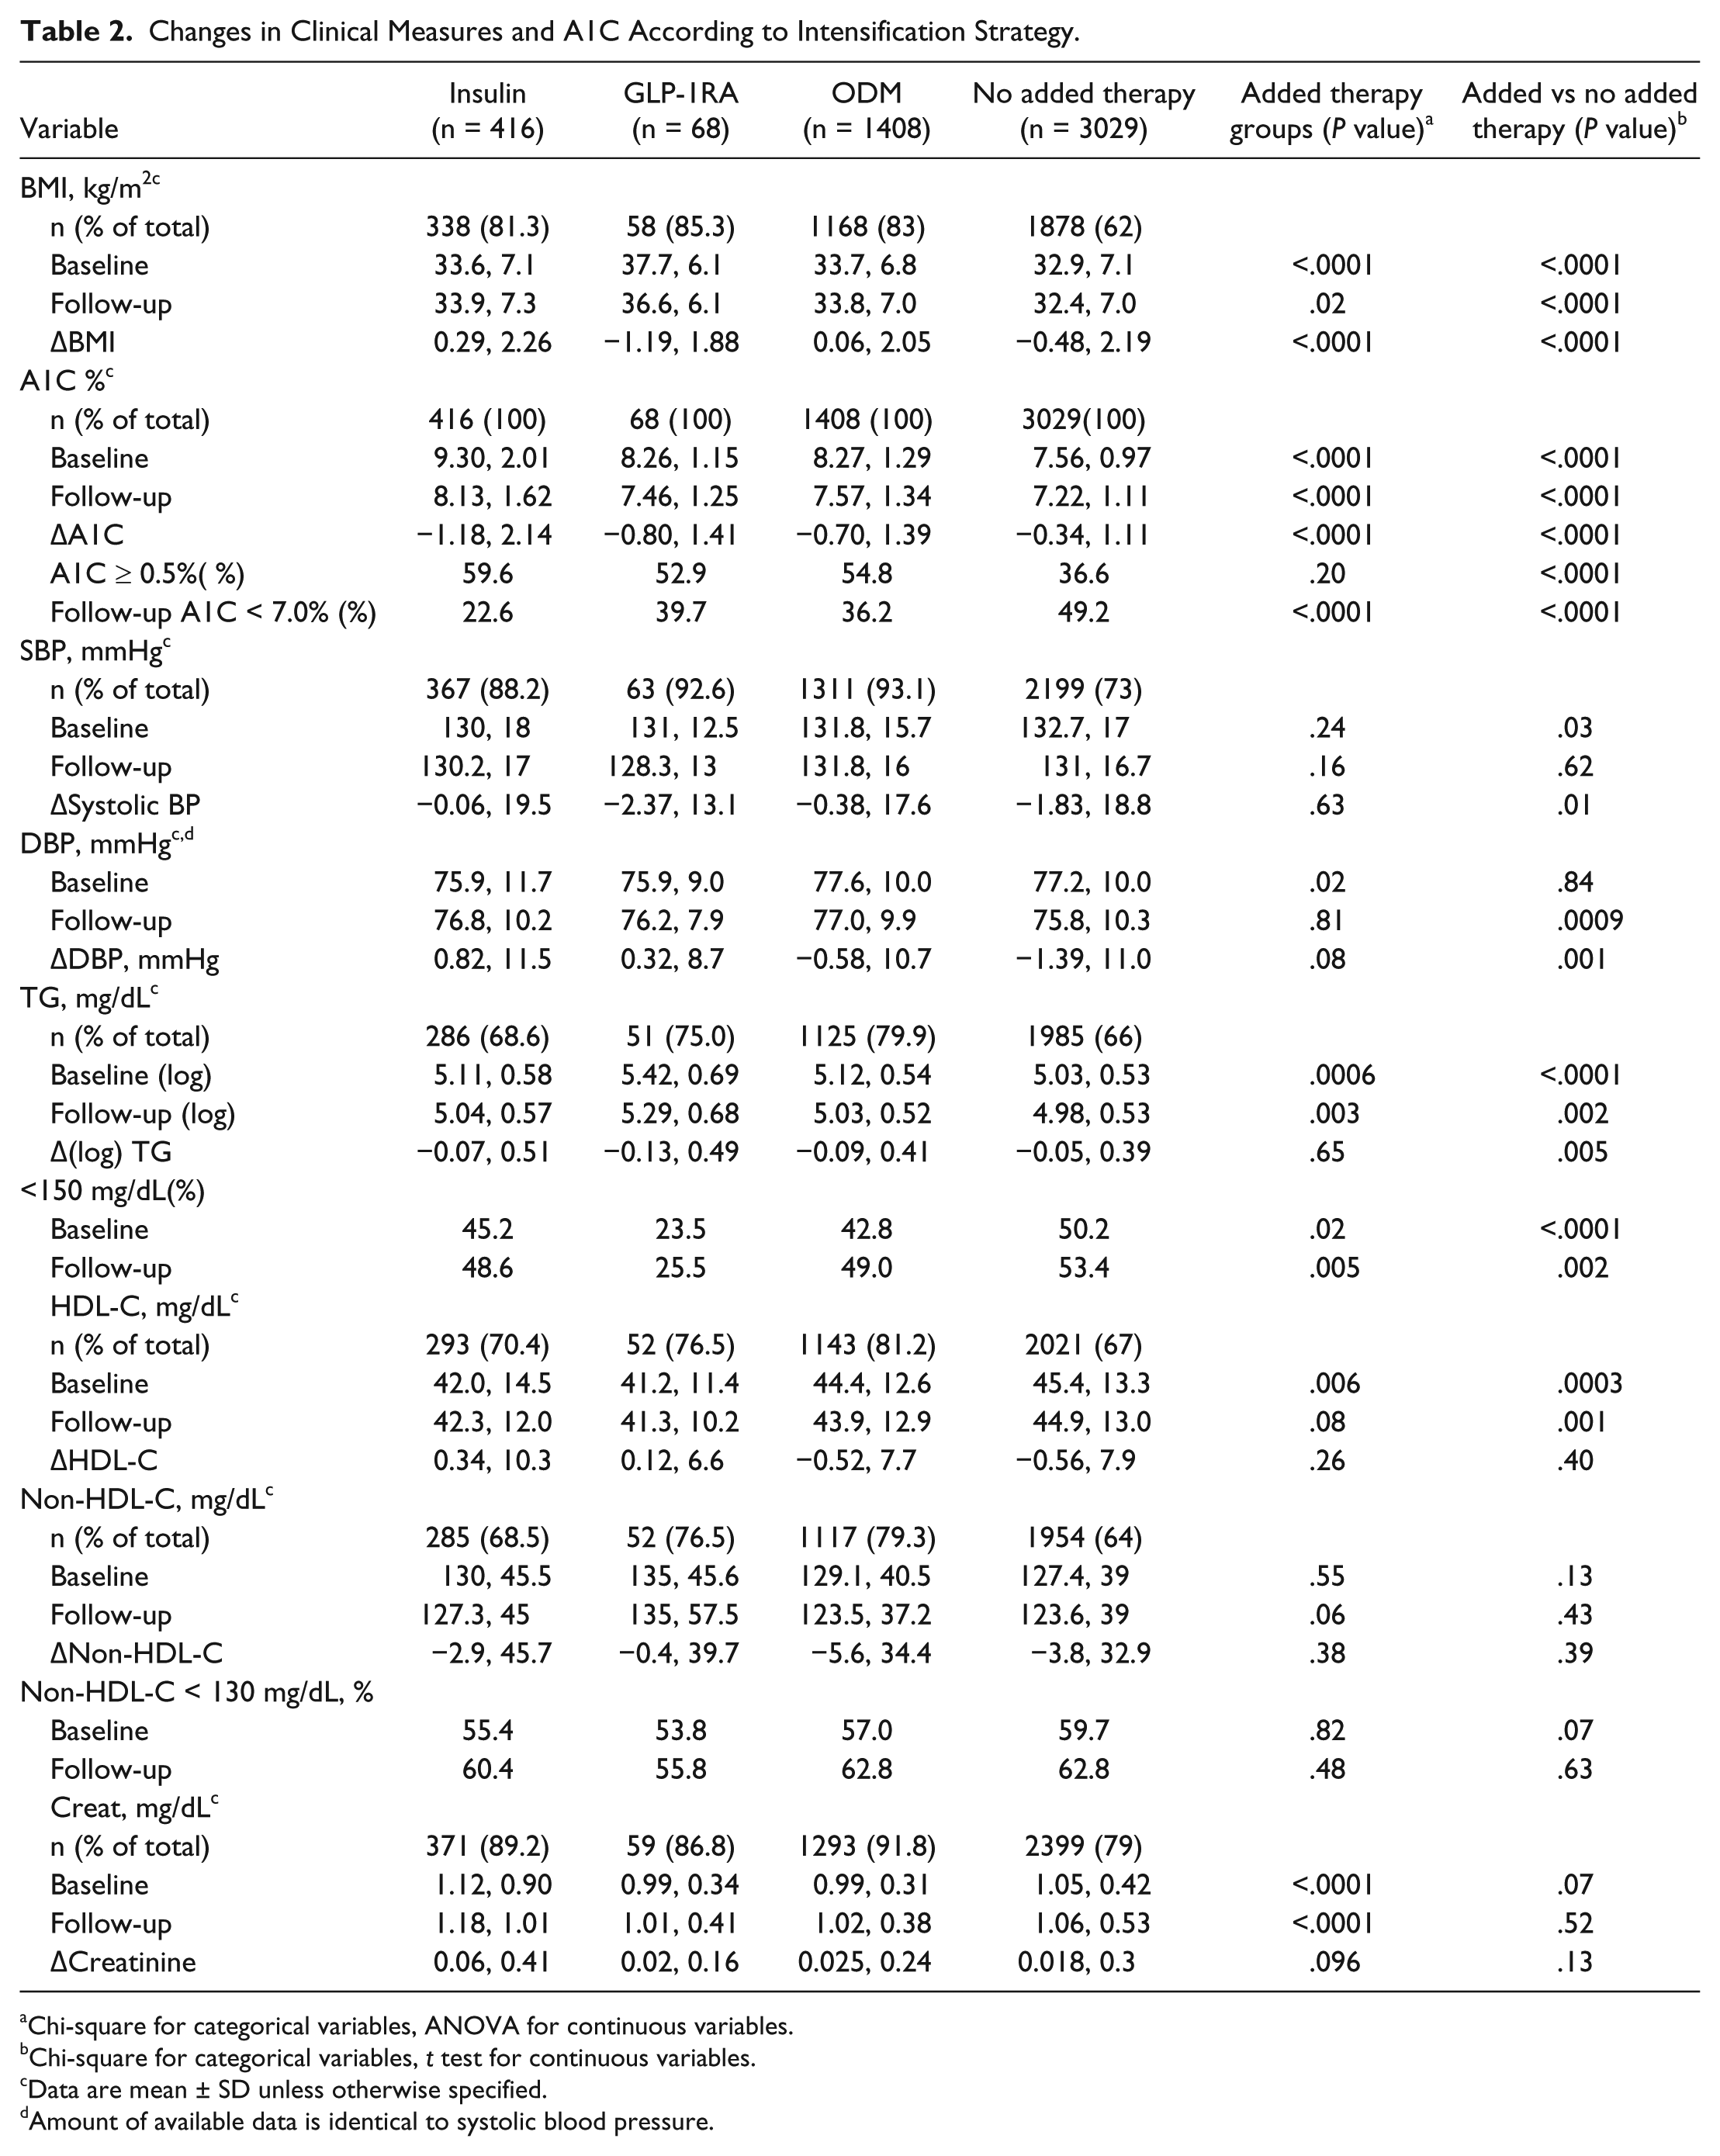
Changes in Clinical Measures and A1C According to Intensification Strategy.
Chi-square for categorical variables, ANOVA for continuous variables.
Chi-square for categorical variables, t test for continuous variables.
Data are mean ± SD unless otherwise specified.
Amount of available data is identical to systolic blood pressure.
Among the 1892 patients receiving therapeutic intensification, the addition of an ODM in a different class was the most frequently used and addition of a GLP-1RA the least frequently used strategy. The insulin group had a higher percentage of African American patients with higher baseline A1C and creatinine than those intensified with GLP-1RA or ODM (Tables 1 and 2). Those intensified with an additional ODM were older and more likely to be male, with higher HDL than the insulin or GLP-1RA groups (Tables 1 and 2). The GLP-1RA group was younger, more obese, more likely to be female and white, and more likely to be receiving ACE inhibitors. Those receiving GLP-1RA had a lower percentage of patients on lipid-lowering therapy, which may have accounted for their higher TG and lower HDL than the other groups (Tables 1 and 2).
Patients intensified with insulin were the most likely to remain on this therapy at 1 year following escalation of glycemic therapy (Figure 2). Relative to insulin therapy, the unadjusted odds ratio for continuing GLP-1RA was 0.20 (confidence interval [CI], 0.12-0.35) and for ODM was 0.35 (CI, 0.26-0.46) (P < .0001). The significance of these odds ratios persisted when adjusting for baseline A1C (P < .0001) alone or in combination with age, gender, race, or BMI (P < .0001).
Reductions in A1C were observed in all groups receiving therapeutic intensification, with the greatest absolute reduction occurring in those receiving insulin (Table 2). This group had the highest percentage of patients who experienced A1C reductions of ≥ 0.5% (P = ns), but persisted as having the highest mean A1C and the lowest percentage of patients with A1C values < 7.0%. Patients intensified with GLP-1RA experienced more weight loss than other groups (Table 2). No group differences were observed for changes in SBP, DBP, HDL, or non-HDL. Those receiving GLP-1RA maintained higher TG with the smallest percentage of patients having TG values < 150 mg/dl. Those receiving insulin had higher serum creatinine at baseline and follow-up, without any group differences in the mean change for this measure. A larger percentage of patients intensified with insulin experienced ≥50% increases in serum creatinine (insulin vs GLP-1RA vs ODM vs control: 5.0 vs 0.0 vs 1.8 vs 1.9%, respectively) and in the percentage of patients with follow-up creatinine values > 2.0 mg/dl in those with baseline values ≤ 2 mg/dl (1.9 vs 0.0 vs 0.9 vs 0.8%).
When compared to the intensified groups, patients who received no additional glucose lowering agents experienced lower absolute reductions in A1C with a lower percentage of patients experiencing A1C reductions of ≥ 0.5% (Table 2). However, this group had the lowest mean A1C values at follow-up with more patients achieving values < 7%. The nonintensified group also maintained a lower BMI, with lower TG and higher HDL (Table 2).
When controlling for baseline differences in age, sex, race, A1C, BMI, SBP and DBP, lipids, or creatinine between the groups receiving and not receiving therapeutic intensification, the finding of more weight loss in patients receiving GLP-1RA remained significant (Table 3).
Adjusted Changes in Clinical Measures in Intensified Compared to Nonintensified Groups.
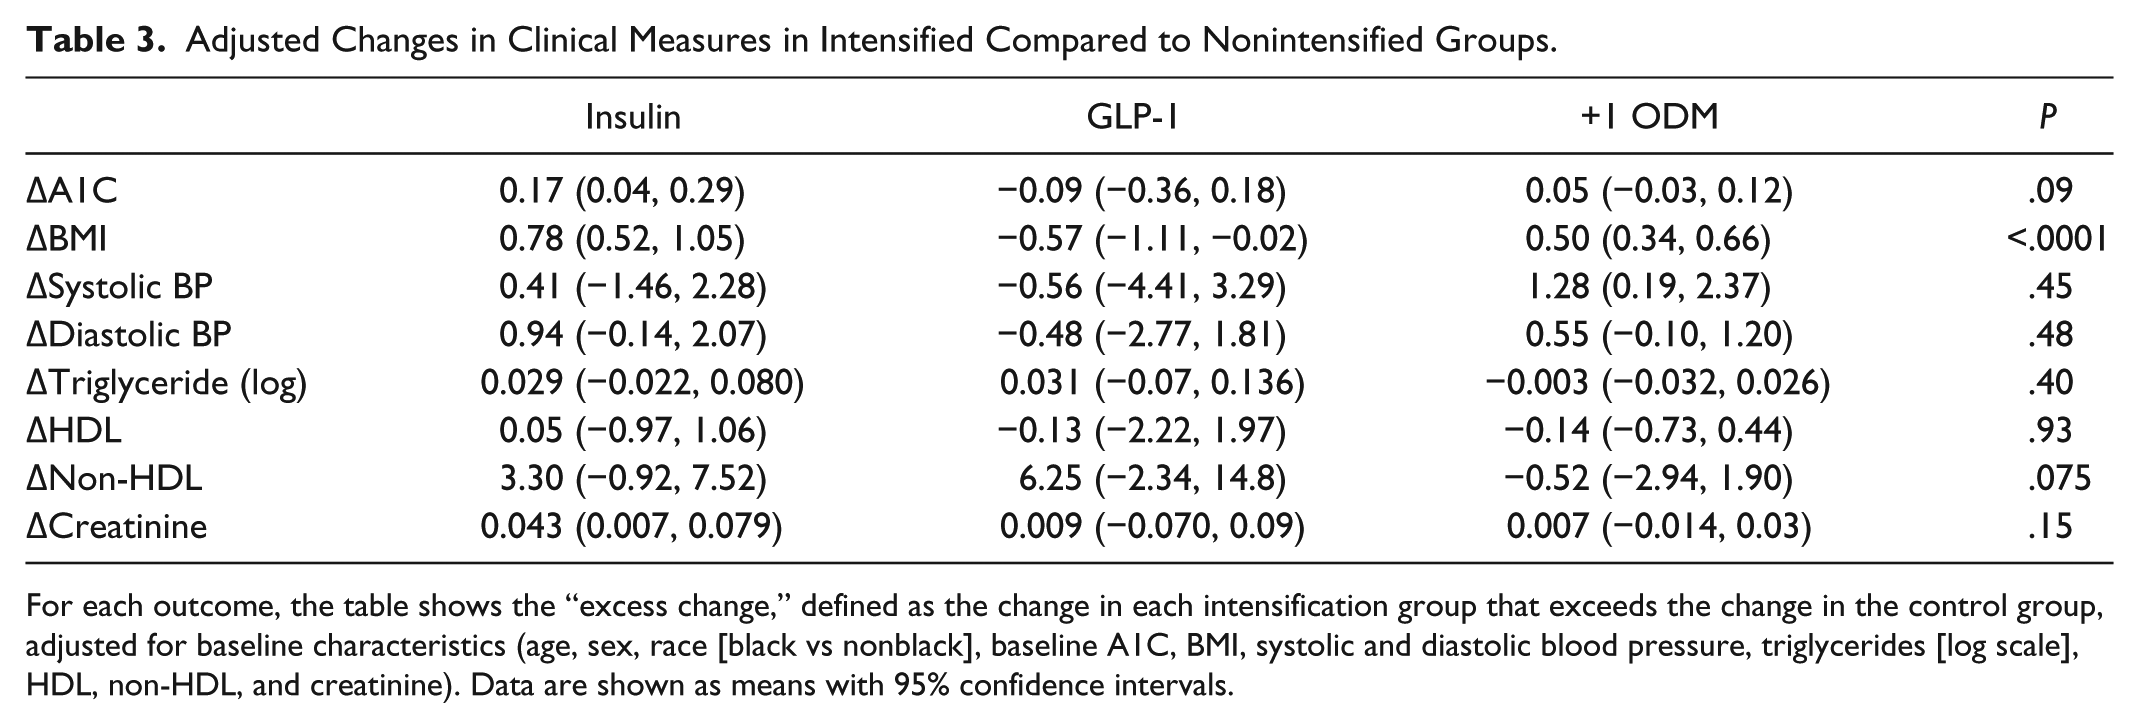
For each outcome, the table shows the “excess change,” defined as the change in each intensification group that exceeds the change in the control group, adjusted for baseline characteristics (age, sex, race [black vs nonblack], baseline A1C, BMI, systolic and diastolic blood pressure, triglycerides [log scale], HDL, non-HDL, and creatinine). Data are shown as means with 95% confidence intervals.
Discussion
These results support the ability of the EMR to provide information regarding prescribing practices and intensification strategies among patients with T2D meeting A1C criteria for additional glucose lowering therapies. We observed that the majority of patients do not receive intensification of their diabetes therapy despite documentation of A1C ≥ 7%. The mean A1C levels among patients who received additional therapy exceeded 8%, which is well above the threshold recommended for the majority of patients.1,2 There are several potential explanations for this observation that cannot be easily captured from an EMR. These include reinforcement of nonpharmacologic interventions with lifestyle modifications, patient or physician reluctance to add additional medications, or concerns regarding hypoglycemia. A1C values > 7% but < 8% in the nonintensified group support the suggestion that physicians and other care providers may be reluctant to advance therapy in this group of patients, particularly since almost 50% of patients in the nonintensified group had A1C values < 7% at follow-up (Table 2). 15
The findings in this report also suggest that current guidelines for glycemic management are not being followed in clinical practice.1,3,4,16 The mean A1C > 9% in the group intensified with insulin supports prior studies demonstrating clinical inertia among care providers for intensifying therapy when patients are already taking diabetes medications.17,18 These values exceed even what is recommended for older adults with significant comorbidities, where an upper limit for A1C values is defined as 8.5%, as levels above this are associated with increased risk for diabetes-related complications and mortality.5,19-22
This report adds to the available literature exploring the use of large EMR databases to investigate questions related to the clinical care of patients with diabetes.10,23-26 There is no protocol-based implementation strategy for glycemic management in this population, meaning that this investigation reflects individual rather than protocol-driven practice. This provides data that extend beyond those limited to 1 particular insurance plan, where therapeutic interventions and data collection strategies may be more homogeneous. 10
An EMR provides the opportunity to investigate clinical questions relating to compliance with care guidelines, tracking population changes in metabolic measures, as well as determining changes in other clinical parameters according to a specific therapeutic strategy. 27 An EMR can also serve as an adjunct to the randomized controlled clinical trial for clinical research and quality improvement initiatives.8,10,28-31
It is not surprising that insulin was the strategy most likely to be continued at 1 year, as insulin is often used only when all other treatment strategies are exhausted or contraindicated. 29 What is surprising is the observation that approximately 40% of patients intensified with GLP-1RA had discontinued therapy at 1 year (Figure 2). This percentage approximates the percentage of subjects reporting gastrointestinal side effects with these agents in other studies. 8 The absolute reasons for discontinuation of any of the medications in this report are likely embedded within clinical notes and are not necessarily amenable to data extraction methods employed. Future investigations using more sophisticated word and phrase recognition software may help in identifying reasons for discontinuation of a particular medication in the future.32,33
There are several limitations to this study. One is that the EMRs used in this study may not include all medical information on participants as individual patients are free to obtain their medical care from a variety of sources. Similar to other reports using EMR data, there is no standardization of visit frequency for this patient population.10,25,26 Another limitation is that the prescribing of a medication does not necessarily mean that it was taken by a patient. 34 EMR data have been demonstrated as often being prone to error and incomplete. 35 To address this, chart review was performed on patients identified as receiving GLP-1RA to verify the prescribing of this group of agents.
The number of subjects intensified with a GLP-1RA was very small in this study, creating disproportionate comparisons with the other groups. However, the infrequent use of GLP-1RA using the criteria specified for this investigation is also informative, suggesting that the clinical use of these agents may fall outside current recommended guidelines.1,2 It is possible that GLP-1RA are being prescribed to subjects who may have lower A1C values, or who have failed 3 or more ODM, populations that were not included in this study. 23 The population for this study was limited to those receiving no more than 2 ODM as it was felt that the use of 3 or more ODM would prompt a higher likelihood of intensification with insulin. It is also possible that insurance coverage for these newer and more expensive GLP-1RA may have influenced prescribing patterns and patient willingness to comply with treatment, information that is not easily extracted from an EMR.
In prior studies using a commercial EMR (GE Centricity) to investigate therapeutic strategies in T2D, a larger percentage of the population received prescriptions for GLP-1RA.23,25 The inclusion criteria in these earlier studies differed from what was used in this report in that inclusion was independent of baseline A1C and included patients new to pharmacologic therapy or already taking ≥4 ODM. These differences likely accounted for the larger percentage of subjects. Similar to the current study, baseline A1C levels were higher in those assigned to insulin therapy, while BMI was higher in those assigned to GLP-1RA.23,25
Changes in traditional cardiovascular risk factors were examined as part of this investigation. With the exception of more weight loss in those intensified with GLP-1 agents, no significant group differences were observed in changes in any of these measures when controlling for baseline differences in age, sex, race, A1C, BMI, SBP and DBP, lipids, or creatinine (Table 3). While it is difficult to draw any conclusions from these observations given the very small number of patients who received GLP-1RA agents, the fact that the majority of patients in each group were receiving antihypertensive and lipid-lowering therapies may have contributed.
Conclusions
In conclusion, this report supports the ability of an EMR to identify prescribing practices and compliance with current guidelines in a population of patients already receiving pharmacologic therapy for T2D. Further investigations into the ability of an EMR to identify clinical outcomes, including diabetes-related complications, are planned.
Footnotes
Appendix A
Appendix B
Abbreviations
ACE-I, angiotensin converting enzyme inhibitors; A1C, glycated hemoglobin; ARB, angiotensin receptor blockers; BMI, body mass index; CI, confidence interval; creat, creatinine; DBP, diastolic blood pressure; EMR, electronic medical record; GLP-1RA, glucagon-like peptide 1 receptor agonists; ODM, oral diabetes medications; SBP, systolic blood pressure; TG, triglycerides; T2D, type 2 diabetes; UPMC, University of Pittsburgh Medical Center.
Authors’ Note
Some of the data from this study have been previously presented in abstract form at the annual meetings of the American Diabetes Association and the Diabetes and Cardiovascular Disease EASD Study Group.
Declaration of Conflicting Interests
The author(s) declared the following potential conflicts of interest with respect to the research, authorship, and/or publication of this article: MTK, MB, ML, JK, TO, and LS received salary support for their role in this funded project from Sanofi-Aventis. MTK has also served as a consultant with Sanofi-Aventis.
Funding
The author(s) disclosed receipt of the following financial support for the research, authorship, and/or publication of this article: Financial support for this study was provided through an investigator-initiated award from Sanofi-Aventis.