
Abstract
Background:
Physical activity is recommended for patients with type 1 diabetes (T1D). However, without proper management, it can lead to higher risk for hypoglycemia and impaired glycemic control. In this work, we identify the main factors explaining the blood glucose dynamics during exercise in T1D. We then propose a prediction model to quantify the glycemic drop induced by a mild to moderate physical activity.
Methods:
A meta-data analysis was conducted over 59 T1D patients from 4 different studies in the United States and France (37 men and 22 women; 47 adults; weight, 71.4 ± 10.6 kg; age, 42 ± 10 years; 12 adolescents: weight, 60.7 ± 12.5 kg; age, 14.0 ± 1.4 years). All participants had physical activity between 3 and 5
Results:
The blood glucose at the beginning of exercise (
Conclusions:
The main factors explaining glucose dynamics in the presence of mild-to-moderate exercise in T1D have been identified. The clinical parameters are formally quantified using real data collected during clinical trials. The multiple linear regression model used to predict blood glucose during exercise can be applied in closed-loop control algorithms developed for artificial pancreas.
Physical activity is recommended by the American Diabetes Association for all people with diabetes, including those with type 1 diabetes (T1D), because of its various beneficial effects.1,2 Exercise has been proven to ameliorate the quality of life, body composition, blood pressure and possibly decreases the risk of diabetes-related complications and mortality. 1
However, in terms of benefits associated with exercise, a paradox exists for T1D patients. Indeed, there is no clear evidence about its benefits on glucose control.3-4 On the contrary, severe hypoglycemia may occur during, immediately after or several hours after physical activity.1,5
Exercise-induced hypoglycemia leads to impaired glucose control and requires patients to adopt strategies and actions to prevent these potentially severe events. In this regard, clinical guidelines recognize that patients with T1D using short acting insulin therapy have to regularly check their blood glucose levels and modify their insulin therapy while taking into account their carbohydrate intake. 6 This might be a difficult task since prevention of hypoglycemia must be compatible with the leading objective of tight glycemic control to prevent long-term complications. 7
In recent years, researchers have made significant advances in the development of an artificial pancreas (AP). 8 Based on subcutaneous glucose measurements from a continuous glucose monitoring device, the control algorithm of an artificial pancreas calculates and orders the appropriate amount of insulin through an insulin infusion pump. 9 These smart insulin delivery systems have been proven to prevent hypoglycemia for T1DM patients. 1 0-16 Other investigators have also suggested that the use of dual hormone delivery (insulin and glucagon) is more effective to prevent hypoglycemia.17-25 While such systems have been proven successful in steady states, their success has been limited with the presence of disturbances such as meals and physical activity.
Thanks to the availability of specific body sensors (eg, heart rate, galvanic skin temperature, accelerometers) and multisensory devices (eg, Zephyr Bioharness™, Bodymedia armband™), some closed loop control algorithms including their inputs have reduced the occurrence of immediate or late onset exercise-induced hypoglycemia.26-29 However, due to the complexity of the effect of exercise on the glucose dynamics, artificial pancreas models still show limited progress in preventing hypoglycemia during and immediately after engaging in a physical activity.
Most information that is commonly delivered to T1D patients by health care professionals regarding exercise management is not evidence based. 16 In this work, we try to reduce this gap. We conducted a meta-analysis on data collected during clinical trials with T1D patients. We applied multiple linear regression techniques to identify the main parameters impacting the glucose dynamics during and immediately after mild to moderate exercise. We then used the multiple linear regression model to predict the glycemic drop induced by exercise and ultimately better inform a closed loop artificial pancreas algorithm.
Materials and Methods
Participants
Fifty-nine patients with T1D were enrolled in 4 different randomized cross-over studies (NCT01418703, NCT01390259, NCT01582139, 2009-A00421-56, 2010-A00538-31) at the University of Virginia Clinical Research Unit (Charlottesville VA) and Montpellier University Hospital Clinical Investigation Center (Montpellier, France). Demographics are presented in Table 1.
Demographics of the Participants of the Clinical Trials Used for the Meta-Analysis of Glucose Evolution at Exercise in Patients With Type 1 Diabetes.
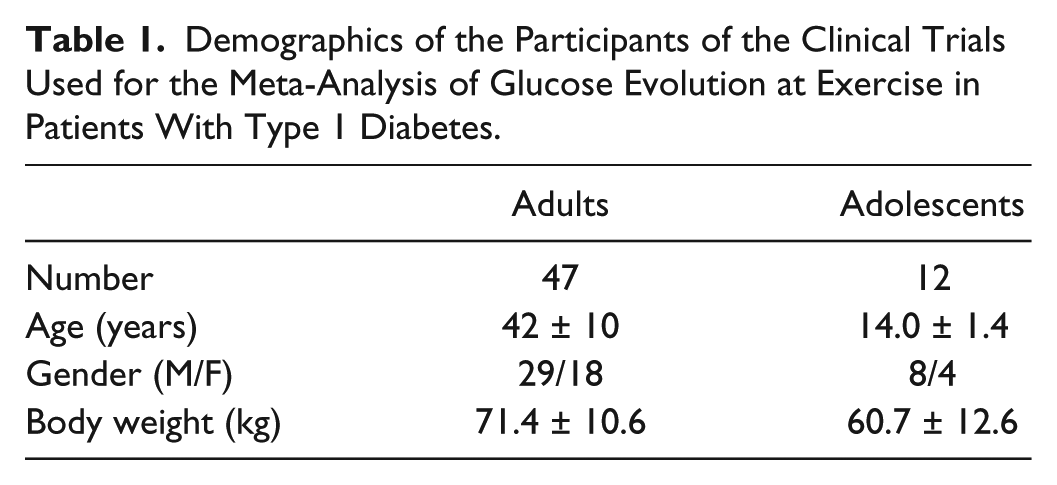
In all 4 studies, the participants exercised on an ergometer at 50 % of VO2 max. All exercise sessions were between 3
Protocols
Study 1
This study was designed to establish the feasibility of a control-to-range (CTR) closed loop system informed by heart rate (HR) and assess the effect of the HR information on the risk of hypoglycemia during and after exercise. Subjects were randomized to determine the order of each admission (control: CTR, experimental: CTR+HR). Each subject was admitted twice. Each admission lasted for 26 hours (24 hours in closed loop) with 30 minutes of mild exercise on a cycle ergometer at a rate of perceived exertion of 9-10 on the Borg scale
17
between 3
Study 2
This study was designed to compare the glycemic control by 2 different closed loop control algorithms to the glycemic control in open loop mode in patients with T1D. Each patient was admitted 3 times. The admissions were randomized and each one lasted for 24 hours (23 hours of closed-loop if it was a closed-loop admission) with 30 minutes of exercise on a cycle ergometer at 50 % level of VO2 max between 3
Study 3
This study was designed to evaluate an automated glycemic control by an algorithm limiting prolonged hypoglycemia and hyperglycemia episodes by maintaining the blood glucose in a secure interval in patients with T1D. The system to be evaluated used an insulin pump to manage insulin delivery during meals and moderate physical activity to demonstrate its capacity to avoid important glycemic excursions. The admissions were randomized. Each participant was admitted twice, each admission lasted for 24 hours (22 hours of closed-loop if it was a closed-loop admission) with 30 minutes of exercise on a cycle ergometer at 50 % of VO2 max between 4
Studies 4 and 5
These 2 studies were designed to demonstrate the feasibility of a modular control to range system in T1D. The system was based on continuous glucose monitoring and targeted to avoid hypoglycemia and prolonged hyperglycemia episodes. Each participant was admitted 6 times (in the MDB003 study) or 5 times (in the MDB005 study), each admission lasted for 24 hours, and all admissions were randomized. The management of insulin delivery was challenged by meals (breakfast at 8
Data Cleaning
We eliminated every admissions where the patient has received a hypoglycemia treatment within the 4 hours preceding the beginning of exercise and/or during the 1 hour postexercise. Hence, 83.2% of the initial data were retained. The total final data set includes 94 admissions, 52% of which were in closed-loop using 3 different control algorithms.
The data were then separated to two-thirds for training and one-third for testing.
Methods
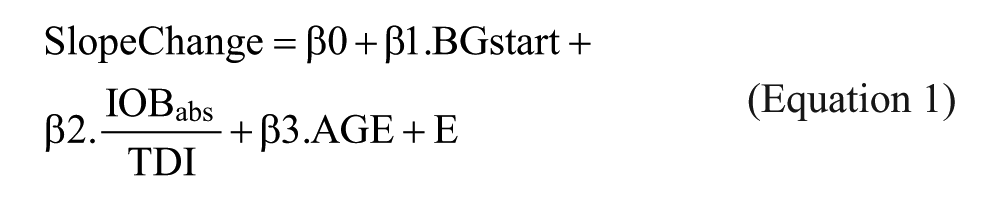
We conducted a multiple linear regression analysis on the clean data set. The list of predictors used in the regression includes blood glucose level at the beginning of exercise (BGstart), the slope of blood glucose for 1 hour before exercise (S0), the relative insulin on board (IOB) as an indicator of the remaining insulin in the bloodstream (calculated by taking into account the 4-hour insulin bolus history and subtracting the basal infusion), the absolute insulin on board (IOBabs, absolute refers to the fact that all insulin delivery is taken into account in the 4-hour insulin delivery history), the total daily insulin delivery (TDI), the ratio
The response variable used in this meta-analysis is the slope change

The slope is calculated based on the regression of the YSI values on time, using least square minimization.
To diagnose whether including both open and closed loop admissions would introduce a bias in the results, we included a categorical predictor indicating the control mode in the multiple regression analysis.
To identify the most significant predictors, we used a backward stepwise selection that starts with a full model and sequentially deletes the predictor that has the least impact on the fit. 30 Akaike’s information criterion (AIC)31,32 was used to compare the models. AIC accounts for the prediction error but also includes a penalty that is proportional to the complexity of the model measured by the number of parameters to be estimated in the model.
Results
The observation of the relationship between the exercise-induced slope change and the blood glucose at the beginning of exercise (Figure 1) shows a clear linear relationship with an R-squared of .5 and a Pearson correlation factor of .73.
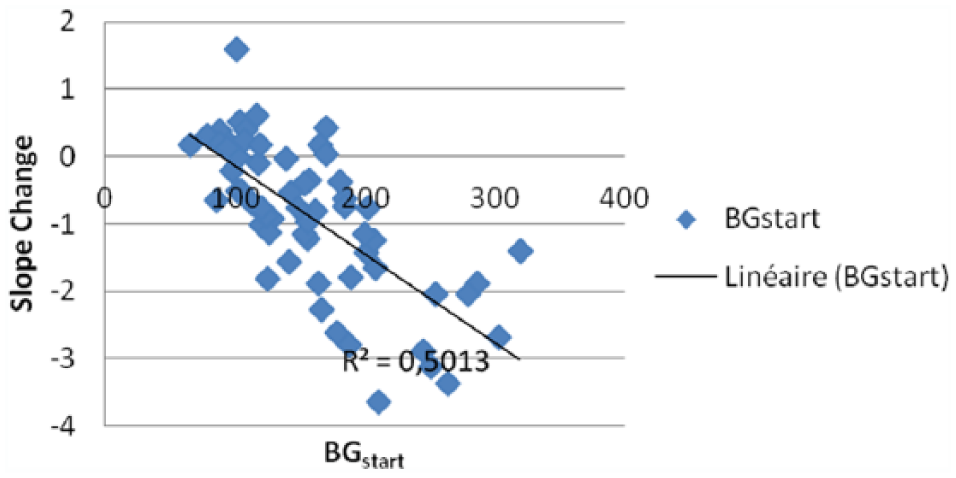
Correlation between the slope change of blood glucose levels at exercise and the blood glucose levels (BG start) at the beginning of exercise in patients with type 1 diabetes.
The observation of the relationship between the exercise-induced slope change and the body exposure to insulin (Figure 2) also shows a linear relationship with a Pearson correlation factor of 0.55.
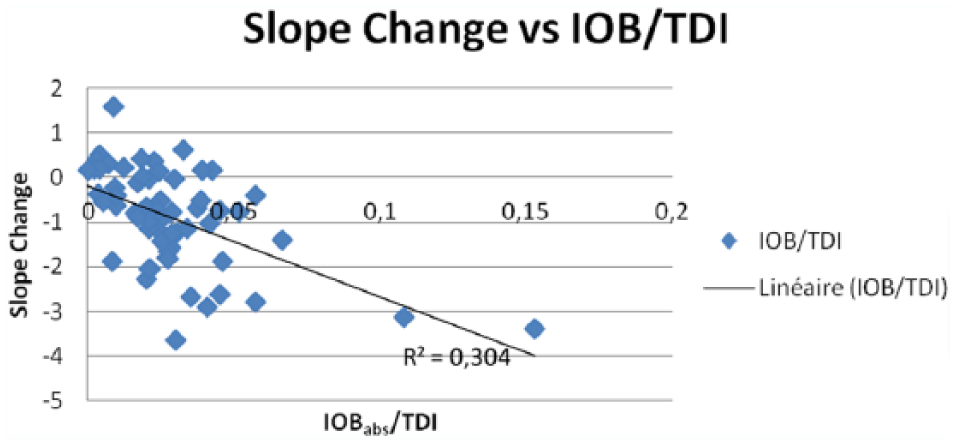
Correlation between the slope change of blood glucose levels at exercise and the body exposure to insulin, expressed as IOBabs/TDI, at the beginning of exercise in patients with type 1 diabetes. IOBabs, absolute insulin on board, referring to insulin delivery for the 4 hours preceding start of exercise; TDI, total daily insulin dose.
As shown in Table 2, the blood glucose at the beginning of exercise (BGstart), the body exposure to insulin (
Stepwise Regression Results for the Identification of Factors Determining Slope Change of Blood Glucose Levels at Exercise in Patients With Type 1 Diabetes.
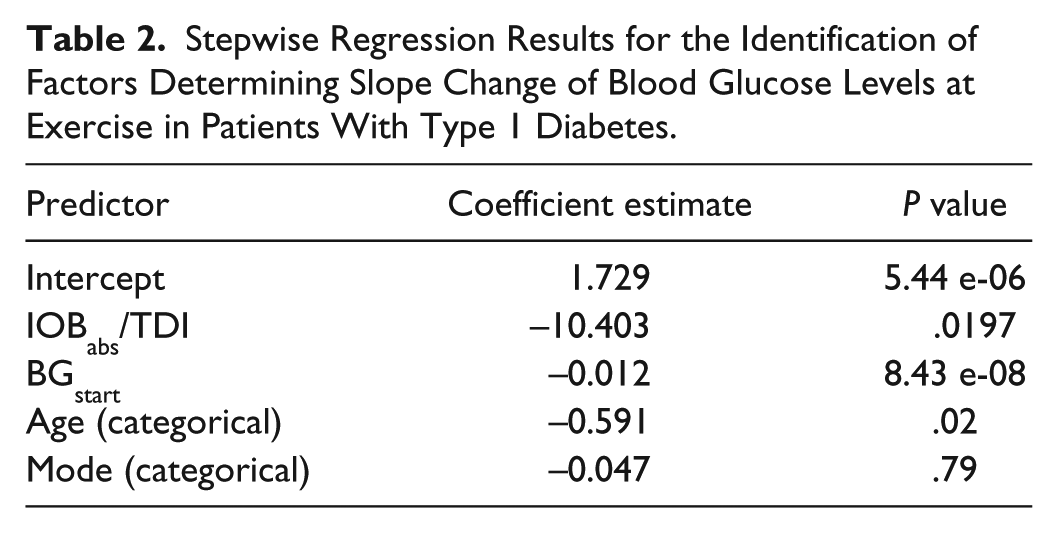
The residuals of the multiple linear regression model have a normal distribution. Furthermore, the residuals versus fitted plot (Figure 3, top right plot) shows a nonsignificant heteroscedasticity (which occurs when the variance of the error terms differ across observations) in the data.
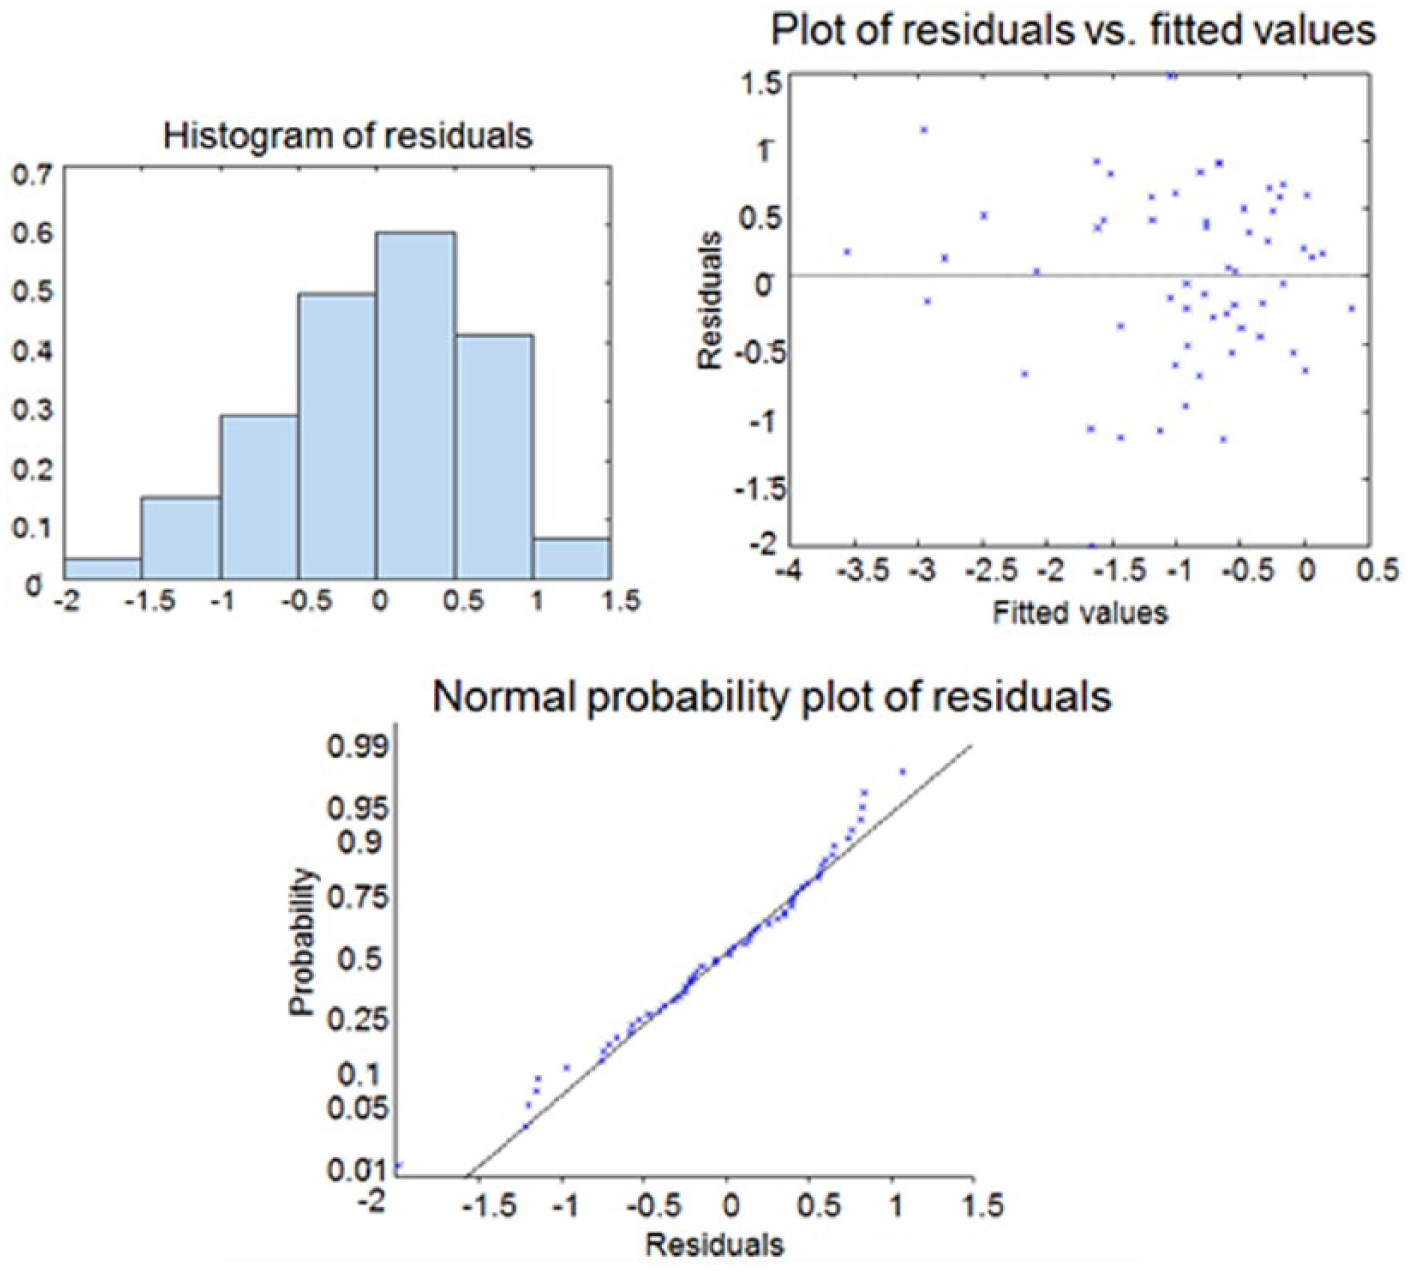
Model diagnosis of the multiple linear regression for the identification of factors determining slope change of blood glucose levels at exercise in patients with type 1 diabetes.
Assuming that the change in glucose is linear in 5-minute intervals, we can use the result

In Figure 4, we predict blood glucose during exercise. These patients were selected based on their positions in regions on Figure 2 (slope change vs IOB/TDI).
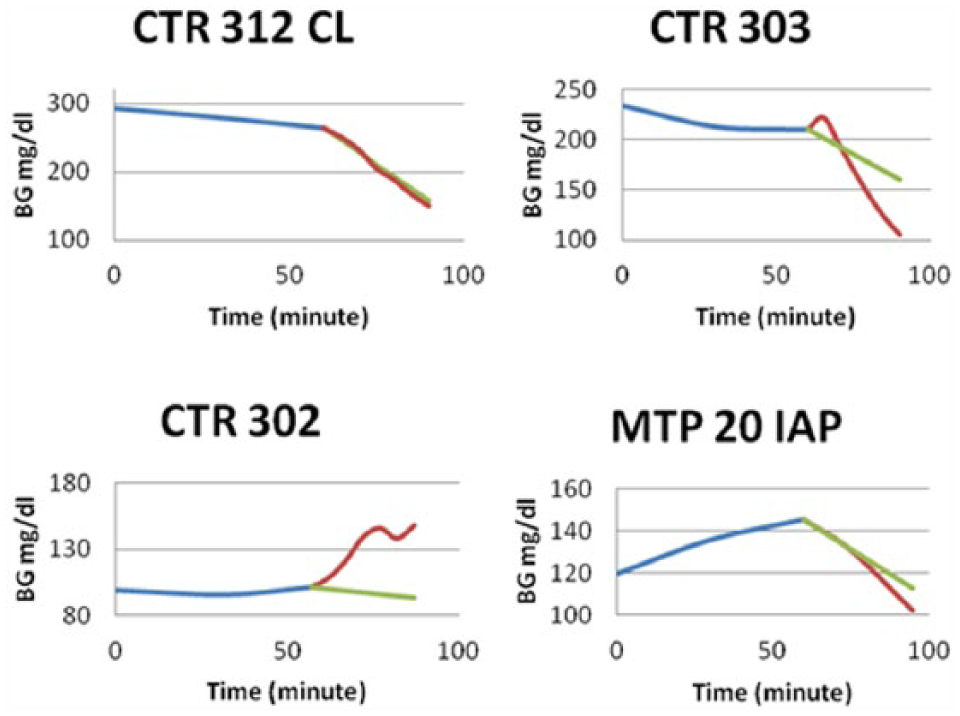
Prediction of blood glucose based on the multiple linear regression model obtained in the identification of factors determining slope change of blood glucose levels at exercise in patients with type 1 diabetes.
Based on some patients’ data from the testing set (Figure 4), the blood glucose prediction is good when the slope change is negative. However, the increase in blood glucose is not detected in patients situated in the top left corner of Figure 2 (very low IOB). An example is patient CTR 302 (Figure 2, bottom left). This might be due to the fact that the increase might not be the effect of the exercise (preceding unregistered CHO intake during the clinical studies due to the low initial BG), or to higher intensity exercise than initially planned.
Discussion
We demonstrated the relationships of BGstart,
BGstart reflects the metabolic state of the patient right at the beginning of exercise. The ratio
We recognize some limitations in this work. In fact, we were not able to identify the impact of the time, duration or type of physical activity on the glucose dynamics. We also assume that the relationships between the parameters are linear, which is not the case due to the complexity of the metabolic changes induced by exercise. In addition, the models presented in this article do not take into account the delayed glucose lowering effect of exercise and do only account for the change in glucose consumption during exercise. Finally, since all bouts of exercise across all studies started at least 4 hours after meals, the effect of CHO intake in this analysis was minimized. However, we were able to identify these main parameters and quantify their effects. Of note, the multiple linear regression was only successful in predicting the glycemic drop induced by exercise but was limited in predicting the rise in blood glucose. For this reason, it will only be applied to closed-loop algorithmic control to prevent hypoglycemia during and immediately after mild to moderate physical activity.
In the context of artificial pancreas development, researchers have been working on various strategies to design control algorithms: proportional integral derivative (PID),9,33 model predictive control (MPC),34-37 fuzzy logic (FL),38,39 and safety supervision modules. Most of these approaches are based on either predicting the blood glucose or the rate of change of the blood glucose. Whatever the chosen strategy for closed-loop control, the results provided by the multiple linear regression could be used to estimate directly the rate of change at the beginning of exercise. It can also be used to estimate the blood glucose levels during and immediately after exercise. In the safety supervision module introduced in the UVA system,40,41 the insulin delivery is in inverse proportion to the predicted risk of hypoglycemia using a T1D physiological model to estimate the patient’s metabolic state. In such a system, the use of the blood glucose prediction described in this article would result in more conservative insulin infusion rates.
The respective roles of the blood glucose level and the body exposure to insulin at the beginning of exercise will be prospectively assessed in a forthcoming clinical trial to validate these factors as the key determinants of glucose drop at exercise in T1D patients.
Footnotes
Abbreviations
AIC, Akaike information criterion; AP, artificial pancreas; BG, blood glucose; BW, body weight; CHO, carbohydrates; CTR, control to range; FL, fuzzy logic; HR, heart rate; IOB, insulin on board; MPC, model predictive control; PID, proportional integral derivative; TDI, total daily insulin; T1D, type 1 diabetes; T1DM, type 1 diabetes mellitus; UVA, University of Virginia; VO2 max, maximum volume of oxygen.
Declaration of Conflicting Interests
The author(s) declared no potential conflicts of interest with respect to the research, authorship, and/or publication of this article.
Funding
The author(s) disclosed receipt of the following financial support for the research, authorship, and/or publication of this article: Funding from the Juvenile Diabetes Research Foundation (grant 17-2013-498) and the Jayne Koskinas Ted Giovani Foundation for Health and Policy is gratefully acknowledged.