
Abstract
Background:
Early detection of exercise in individuals with type 1 diabetes mellitus (T1DM) may allow changes in therapy to prevent hypoglycemia. Currently there is limited experience with automated methods that detect the onset and end of exercise in this population. We sought to develop a novel method to quickly and reliably detect the onset and end of exercise in these individuals before significant changes in blood glucose (BG) occur.
Methods:
Sixteen adults with T1DM were studied as outpatients using a diary, accelerometer, heart rate monitor, and continuous glucose monitor for 2 days. These data were used to develop a principal component analysis based exercise detection method. Subjects also performed 60 and 30 minute exercise sessions at 30% and 50% predicted heart rate reserve (HRR), respectively. The detection method was applied to the exercise sessions to determine how quickly the detection of start and end of exercise occurred relative to change in BG.
Results:
Mild 30% HRR and moderate 50% HRR exercise onset was identified in 6 ± 3 and 5 ± 2 (mean ± SD) minutes, while completion was detected in 3 ± 8 and 6 ± 5 minutes, respectively. BG change from start of exercise to detection time was 1 ± 6 and −1 ± 3 mg/dL, and, from the end of exercise to detection time was 6 ± 4 and −17 ± 13 mg/dL, respectively, for the 2 exercise sessions. False positive and negative ratios were 4 ± 2% and 21 ± 22%.
Conclusions:
The novel method for exercise detection identified the onset and end of exercise in approximately 5 minutes, with an average BG change of only −6 mg/dL.
Physical activity can have a significant effect on glucose metabolism in individuals with and without type 1 diabetes mellitus (T1DM). Moderate aerobic exercise can significantly increase the skeletal muscle uptake of glucose. 1 For someone with T1DM this increase in glucose uptake without adjustment of insulin infusion and/or carbohydrate ingestion can result in potentially dangerous hypoglycemia. 2 In these individuals the normal physiologic counter-regulatory responses to an exercise-induced decrease in blood glucose (BG) are either nonexistent or blunted. 3 As a result, exercise for individuals with T1DM involves extensive education, careful planning, and close monitoring. Adjustments to insulin doses and/or insulin infusion rates are common, and rapid-acting glucose drinks or snacks must be available to prevent or treat hypoglycemia before, during, and after exercise.
The detection of physical activity is not a new field of development.4-10 Exercise detection is in principle the same for those with and without T1DM and has been explored using heart rate monitors, accelerometers, and with sports armbands that detect activity and galvanic skin response.11-15 The difference is that most techniques in use today have not been studied to determine if they are able to detect the start and stop of exercise prior to the occurrence of a significant change in BG in persons with T1DM. Thus existing attempts to use automated detection of exercise to inform insulin dosing, as could be used in an artificial pancreas (AP) system, may be limited by a lack of understanding of how this detection relates to change in BG and the delays in detection seen when solely relying on continuous glucose monitors (CGMs).15,16 Recently, adaptive multivariable techniques have been used in exercise detection and future glucose prediction when integrated in AP use with very promising results in simulator models and in a small number of patients.11,12,14,17
The primary goal of this study was to develop a novel, simple and reliable method to detect the start and end of exercise that could rapidly perform detection before any significant change in BG occurred in people with T1DM. We used a combination of heart rate and acceleration data to design a novel exercise detection algorithm, and then subsequently tested the algorithms performance by analyzing the results from planned exercise sessions.
Methods
Clinical Trial Design
After IRB approval, 18 subjects (10 women, 8 men) with T1DM were recruited for the study. Inclusion criteria included age 18 to 75 years, T1DM duration of at least 1 year, use of an insulin pump for at least 6 months, and free of major micro- and macro-vascular complications of diabetes. Exclusion criteria included pregnancy, hemoglobin HbA1c > 9.0% and concomitant disease or medication use affecting metabolic control.
Subjects wore a Dexcom G4™ Platinum CGM (Dexcom Inc, San Diego, CA) and an ActiGraph wGT3X-BT wireless activity monitor (ActiGraph, Pensacola, FL) with its compatible Polar® heart rate monitor (Polar Electro Inc, Lake Success, NY) for a 4- to 5-day period. Data were collected from the activity monitor, CGM, insulin pump, and glucose meter at the end of the week. Subjects also completed activity, diet, and stress record sheets each day during the study week.
For the first 2 days, subjects performed outpatient ambulatory data collection. The data collected were used to develop the novel exercise detection scheme, as described below. The next day subjects returned to the clinic for 2 monitored exercise sessions. The first exercise session occurred in the morning and the second in the afternoon; for both exercise sessions, no special intervention such as adjustment of insulin basal rate was done. If the subject’s BG level was >270 mg/dL on arrival to the clinic, the exercise session was cancelled and rescheduled. Subjects whose glucose levels were below 120 mg/dL before exercise were given 16 g of carbohydrate (CHO)—fruit juice, glucose tablets, or nutrition bar—and then they waited for 30-40 minutes for their BG to be >120 mg/dL. If the glucose level was <70 mg/dL during exercise, exercise was discontinued and the subject was given 16 g of CHO (fruit juice or glucose tablet) and treatment with 16 g CHO was repeated as necessary until BG was above 80 mg/dL.
On arrival to the clinic, subjects checked their BG with their meter and rested for a half hour. Subjects then exercised, either on a recumbent stationary bicycle or by walking on a motorized treadmill, for 1 hour at 30% predicted maximal heart rate reserve (HRR) with BG checks every 15 minutes. Subjects then rested for 2 hours with BG checks every half hour. Lunch with known carbohydrate, fat, and protein content was served at approximately noon, and the subjects gave themselves an insulin bolus based on their usual insulin to carbohydrate ratio. Capillary BG was checked every half hour for 2-4 hours until BG had returned to the prelunch level. In the afternoon, the subjects exercised at 50% HRR for 30 minutes with BG checks every 15 minutes. Following the second exercise segment, subjects were monitored for approximately 2 hours in-clinic. If BG was stable and between 80-180 mg/dL, the subject was discharged, and activity, heart rate, and CGM data were collected for 2 more days.
Exercise Detection Methodology
The ActiGraph wGT3X-BT wireless activity monitor, a commercially available continuous activity measuring system, uses piezoelectric sensors to assess acceleration of the body. The acceleration signal was sampled at 30 Hz and filtered using a band-pass filter for noise reduction. These data were integrated over 1-minute intervals to get the average values and make them compatible with the heart rate data, which were obtained at every 1 minute. Most of the time heart rate and acceleration data were highly correlated, as expected, and their covariance matrix was nearly singular. Therefore, principal component analysis (PCA) was used to analyze the heart rate and acceleration data for the purpose of activity detection. 18 Hotelling’s T2 statistic, calculated from the PCA model, and confidence limits were used to identify activity.18,19 The traditional T2 statistic has many issues when the variables are highly correlated and their covariance is very ill conditioned. 20 These problems can be minimized from calculating T2 value from a PCA model. CGM data were used to evaluate the performance of the detection method, with glucose change calculated as the CGM glucose measurement at the end of exercise compared to the beginning. Capillary BG measurements were not used. The calculation of the confidence limit for the PCA model is included in section 2 of the Supplemental Material. Two days of nonexercise data collected at ambulatory conditions were used to develop the PCA model and to compute the confidence limit for detection. Then in-clinic data were used to validate the detection method.
For each subject the 90% T2 confidence limit was calculated from ambulatory data. The proposed detection method flags an activity if the T2 statistic exceeds this threshold for 5 consecutive samples. The false positive ratio is defined as tFP/(tFP+tTN), where tFP and tTN denote the time periods that the algorithm classified as exercise and no-exercise, respectively, during nonexercise periods. Similarly, the false negative ratio is defined as tFN/(tFN+tTP), where tFN and tTP denote the time periods that the algorithm classified as no-exercise and exercise, respectively, during exercise periods.
Results
Eighteen subjects completed the study; however, 2 subjects (1 woman and 1 man) were excluded from the analysis because of technical difficulties during the data collection. The reported results are based on the remaining 16 subjects. Detailed subject information is given in Supplemental Table S1. The mean ± standard deviation (range) for age was 49.2 ± 16.3 years (18-73), height 173.4 ± 10.3 cm (157-193), weight 75.6 ± 15.3 kg (53-104), years of diabetes 27.6 ± 18.6 years (3-62), and average total daily insulin dose over 2 weeks 40.8 ± 22.3 units (22.7-98.1). The average resting heart rate was 63.9 ± 8.8 beats per minute (bpm) (42-80) and the predicted HRR was 173.9 ± 12.8 bpm (157-200). The target heart rate at 30% HRR was 96.8 ± 7.6 bpm (82-116), and the target heart rate at 50% HRR was 118.9 ± 8.3 bpm (109-140). Due to decreasing BG indicated by both fingerstick and CGM, 1 subject ended the 30% HRR session at 47 minutes, 1 subject at 49 minutes, and 1 subject at 55 minutes. One other subject ended the 50% HRR session at 22 minutes due to decreasing BG. All other subjects completed both exercise sessions. Five subjects had a BG ≤60 mg/dL by fingerstick and 2 by CGM at the end of the 30% HRR session. No subject had a BG ≤60 mg/dL by fingerstick or CGM at the end of the 50% HRR session. All subjects had some intervention, such as carbohydrate before exercise or carbohydrate after exercise. One subject was given extra insulin after the second exercise session and 1 subject was given a correction bolus prior to the second exercise session due to high BG levels ≥180 mg/dL.
Figure 1 presents representative data collected during in-clinic sessions for subjects 2 and 6 (complete data are shown in the Supplemental Material). When both the heart rate and accelerometer sensors are working properly, rapid detection of exercise occurred, as is illustrated in Figure 1. For subject 2, both 30% HRR and 50% HRR exercise sessions were detected in 8 and 4 minutes, respectively, with glucose change of −18 and −4 mg/dL. For subject 6, the 2 exercise sessions were detected in 4 and 3 minutes with glucose change of 0 and −7 mg/dL. For all 16 subjects, the detection method was able to identify the mild 30% HRR exercise in 6 ± 3 minutes (range 2-13 minutes), and the moderate 50% HRR exercise in 5 ± 2 minutes (range 3-12 minutes).
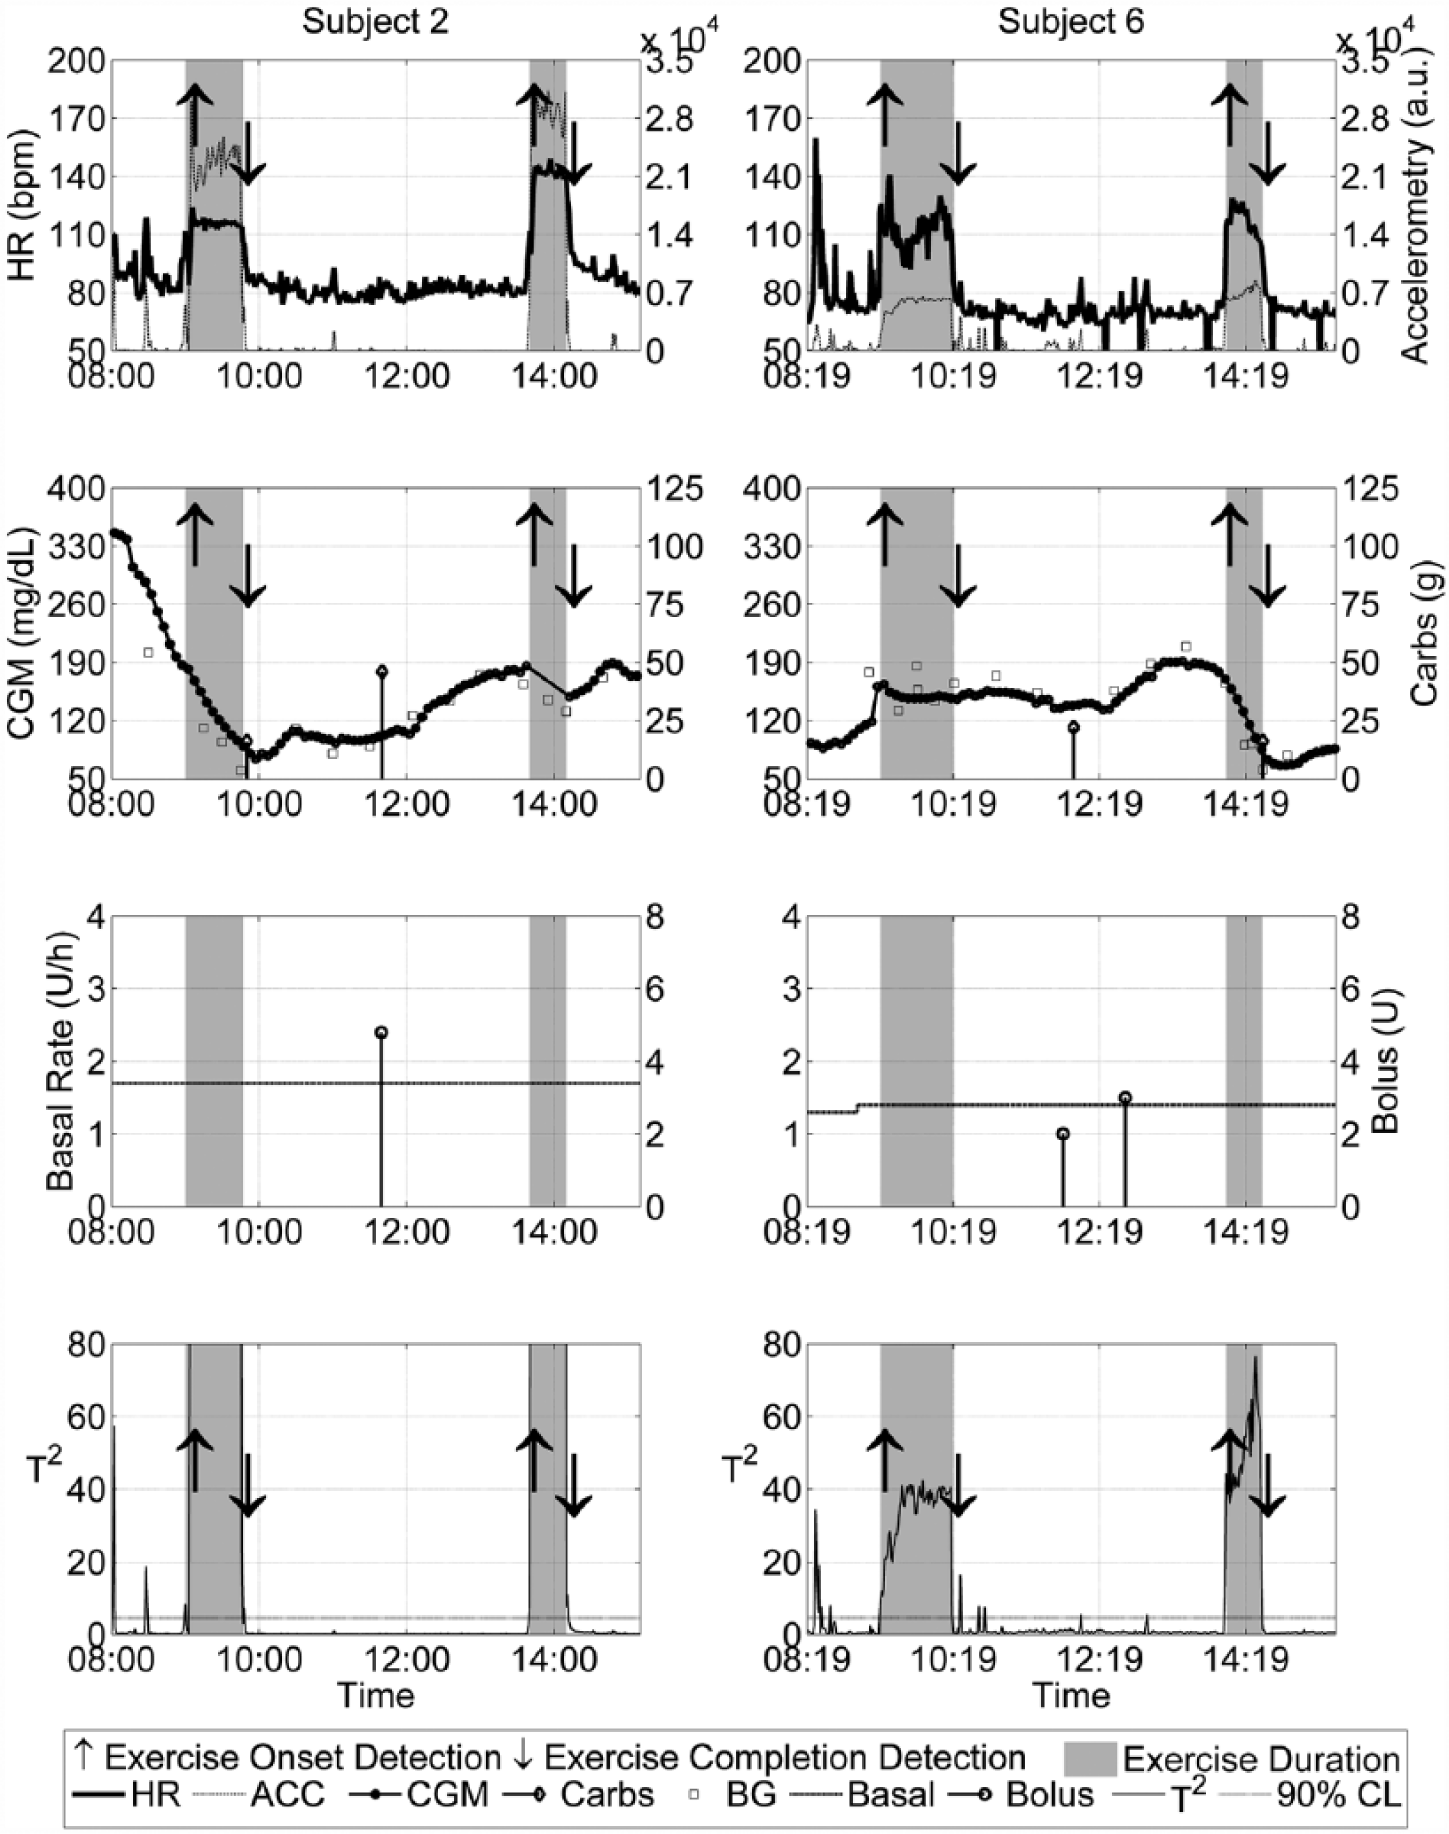
Data for subjects 2 and 6 with exercise onset and completion detection by the PCA-based detection method. The first row shows acceleration and heart rate data, while the second row shows the CGM data, blood glucose data, and meal information. The third and fourth rows show the insulin delivery data and the calculated values of the T2 statistic.
Detection of exercise by the proposed PCA method using heart rate and acceleration measurements is presented in section 2 of the Supplemental Material. This method was compared with detection using the individual sensors, heart rate alone, and accelerometer alone. The results are summarized in Table 1. The PCA-based detection method had a low false positive ratio of 4 ± 2% and moderate false negative ratio of 21 ± 22%.
Summary of the Exercise Detection Results by Heart Rate Monitor, Acceleration Sensor, and the PCA-Based Detection Method (Mean ± SD), Which Shows Very Low False Positive Ratios.
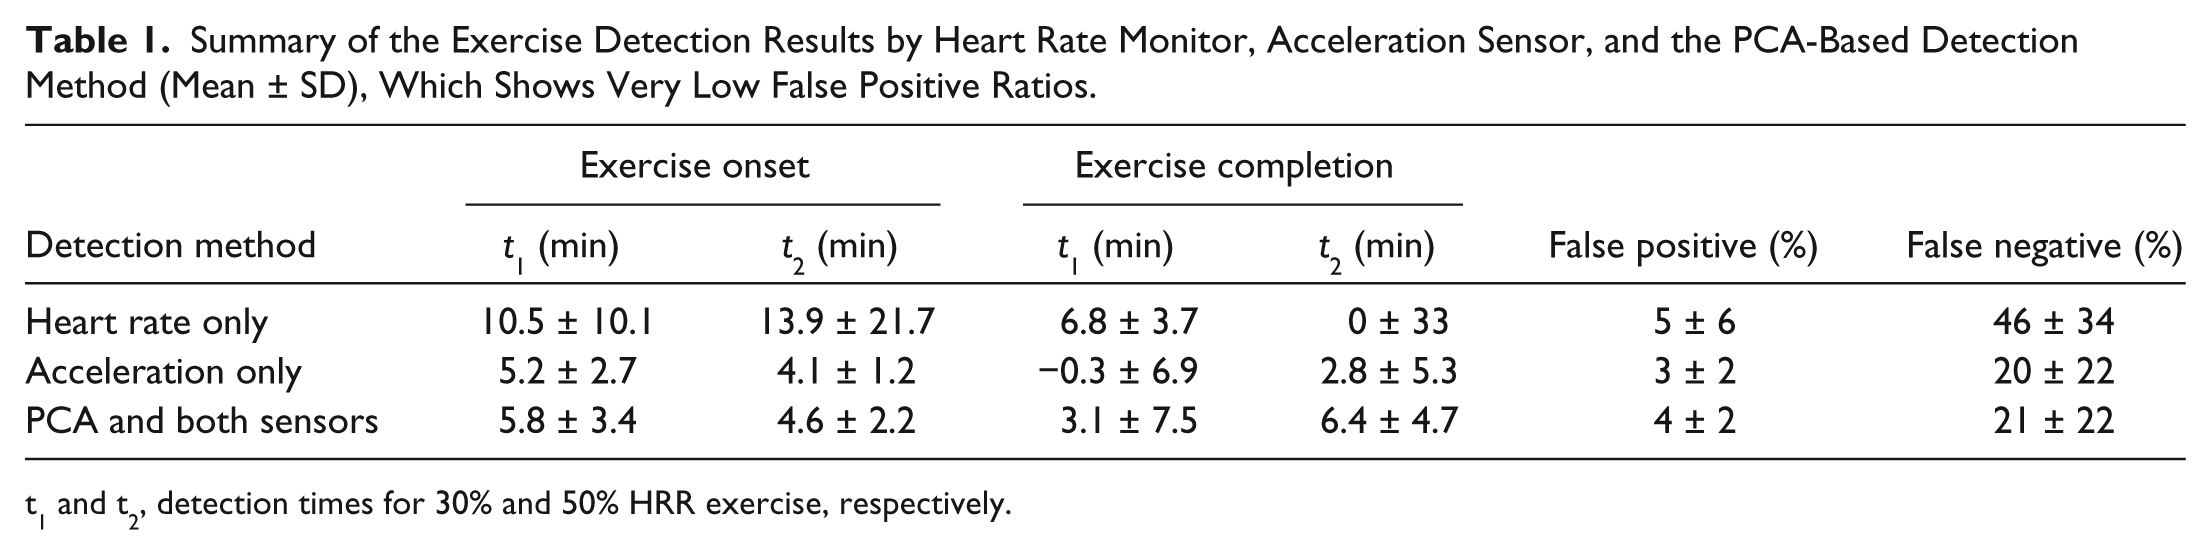
t1 and t2, detection times for 30% and 50% HRR exercise, respectively.
From Table 1 it is evident that the acceleration sensor provides slightly better, but not statistically significant, detection results compared to the PCA-based detection methods. This is due to outliers in the heart rate data. One of the current challenges in using a heart rate sensor is the loss of conductivity due to sensor movement during activity. As a result, an erroneous default heart rate reading of either 0 or 72 bmp was recorded. Six out of the 16 subjects had a heart rate sensor dropout for a significant period of time during the in-clinic sessions, while the acceleration sensor only had significant dropouts for subject 16. The acceleration and heart rate dropouts for subjects 12 and 16 during exercise sessions are illustrated in Figure 2. The acceleration sensor dropouts resulted in a negative mean detection time of t = −0.3 minutes, as shown in Table 1.
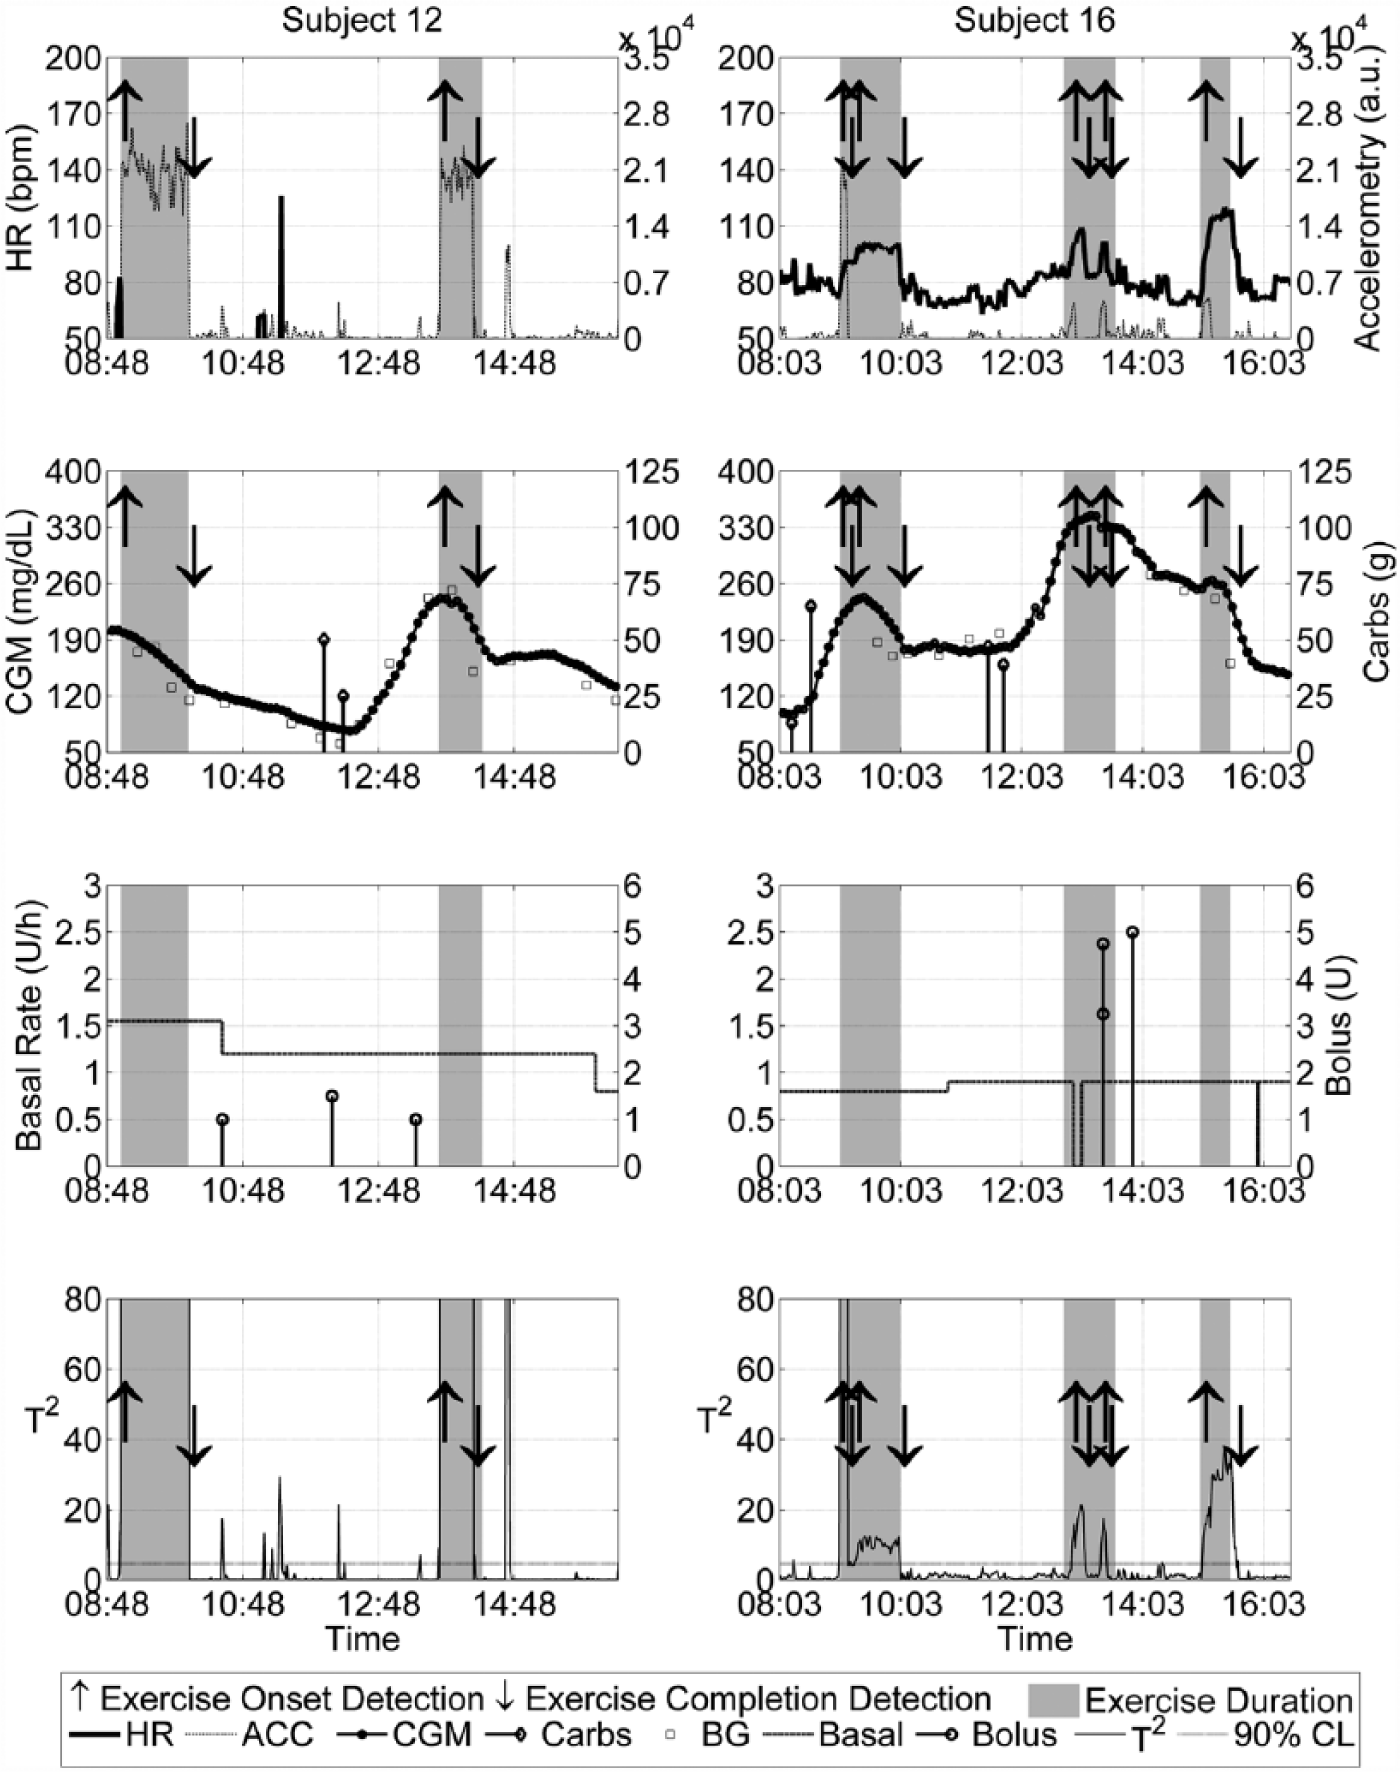
Data for subjects 12 and 16 showing sensor failures. Subject 12 has a heart rate sensor failure and subject 16 has an acceleration sensor dropout during the exercise sessions, but PCA was able to detect these events with low false rates. Subject 12 has the false positive and false negative ratios of 1.69% and 13.13%, and subject 16 has ratios of 3.57% and 31.94%, respectively. Note that subject 16 had an extra exercise session.
Relying on a single sensor can cause false exercise detections or long detection times. By using the PCA analysis and the 2 sensors, exercise periods can be detected reliably. Tables 2-5 show a detailed analysis of the 3 methods and a univariate statistical detection method that uses upper 90% confidence limit of both sensors for exercise detection. Two exercise sessions at 30% HRR for subjects 11 and 15 were not identified by the PCA method due to significant periods of heart rate sensor failures. However, for 4 other cases where the heart rate sensor was unable to identify exercise due to sensor dropouts, the PCA method and the acceleration sensor were able to detect the exercise activity. Detection times for the acceleration sensor and PCA were compared using a pairwise t-test to determine statistical significance. The P values for all 4 detection events (starts and completion of 30% and 50% HRR exercise periods) were not significant. However, the PCA-based method has the advantage of detecting events in the case of 1 sensor failure. Furthermore, it is applicable for situations where more than 2 types of sensors are available.
Time Taken to Detect Events Using Only Acceleration Sensor, Glucose Change During Each Detection Time, and False Rates.
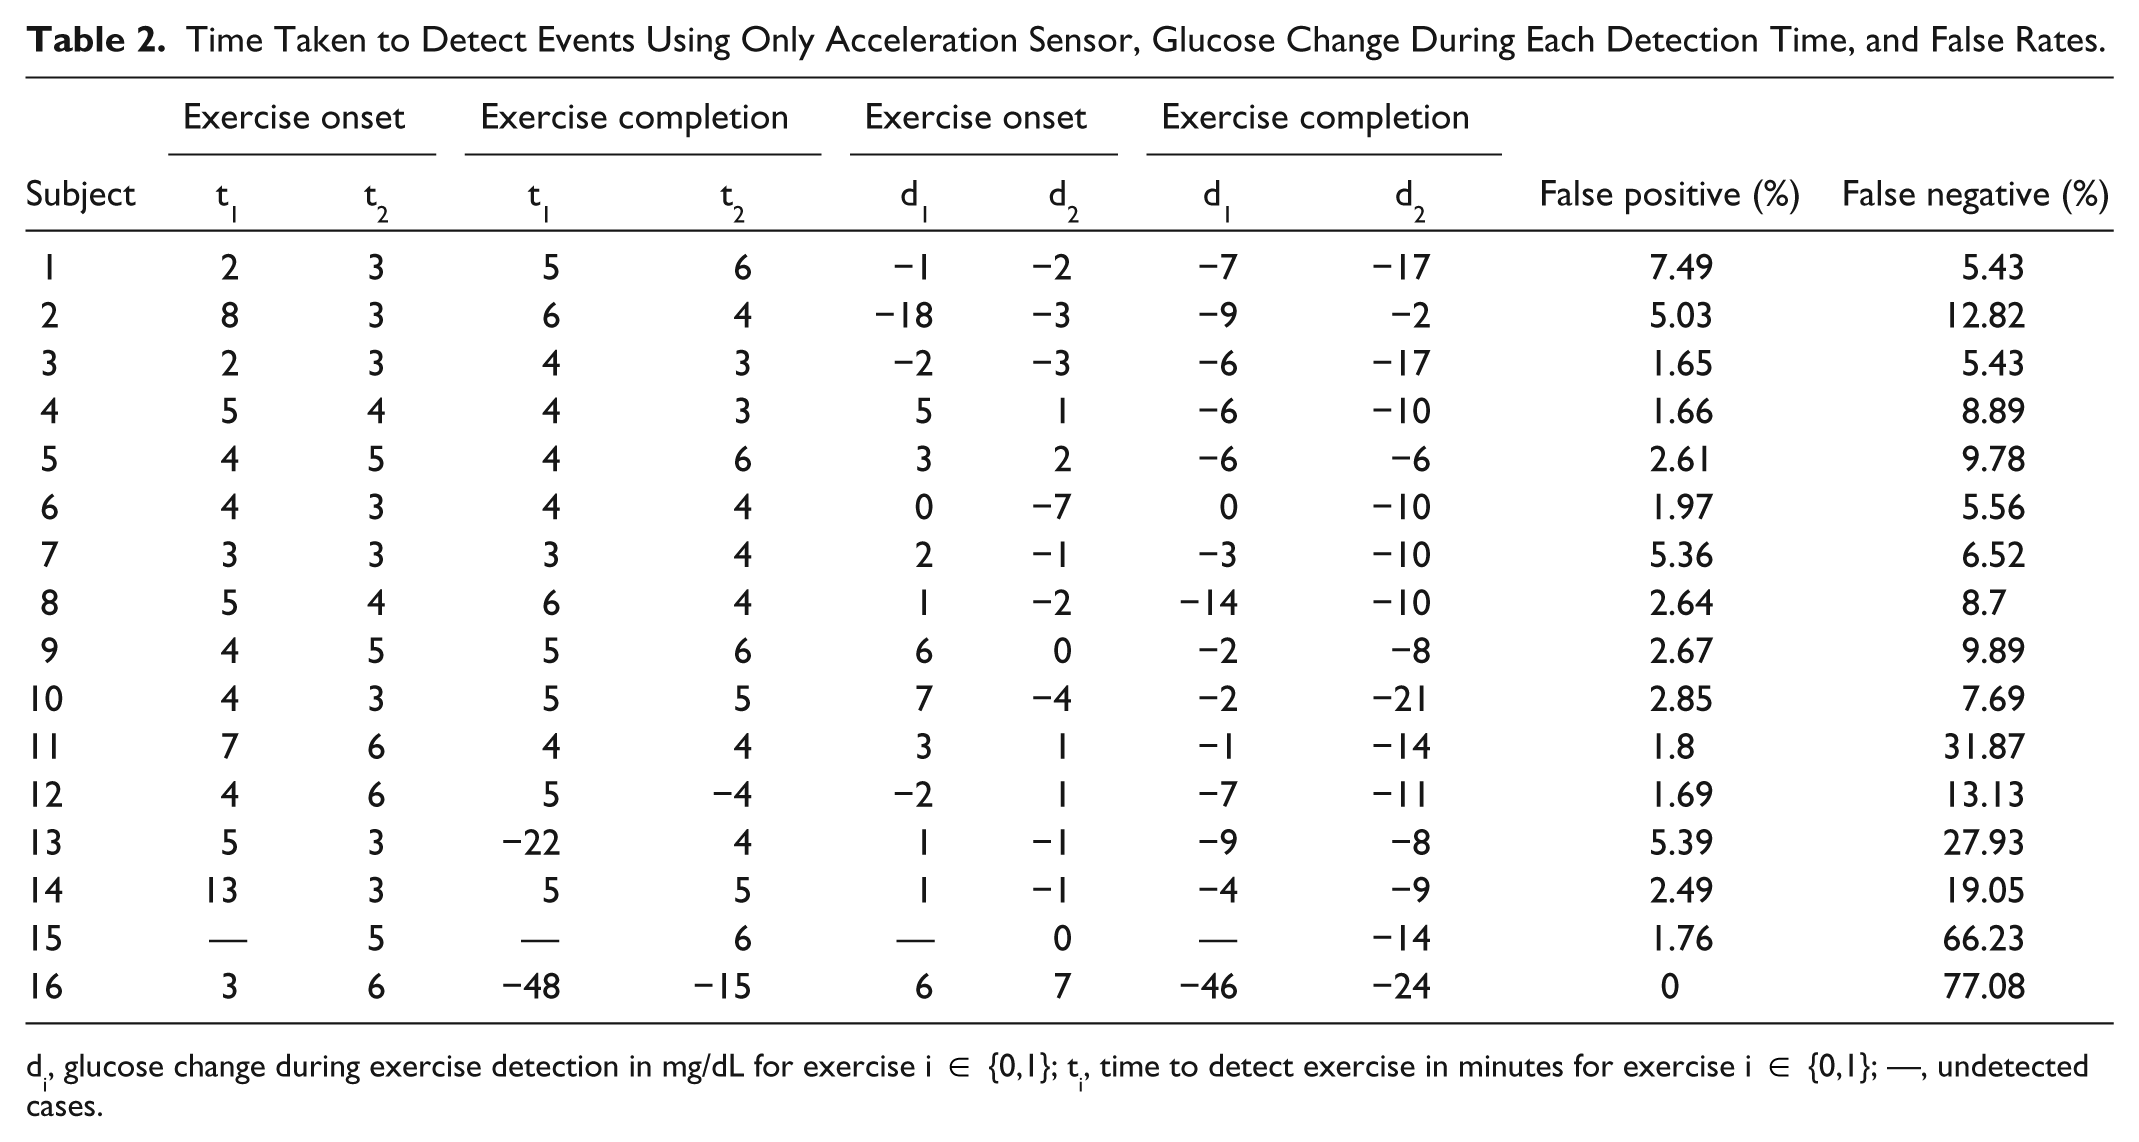
di, glucose change during exercise detection in mg/dL for exercise i ∈ {0,1}; ti, time to detect exercise in minutes for exercise i ∈ {0,1}; —, undetected cases.
Time Taken to Detect Events Using Only Heart Rate Monitor, Glucose Change During Each Detection Time, and False Rates.
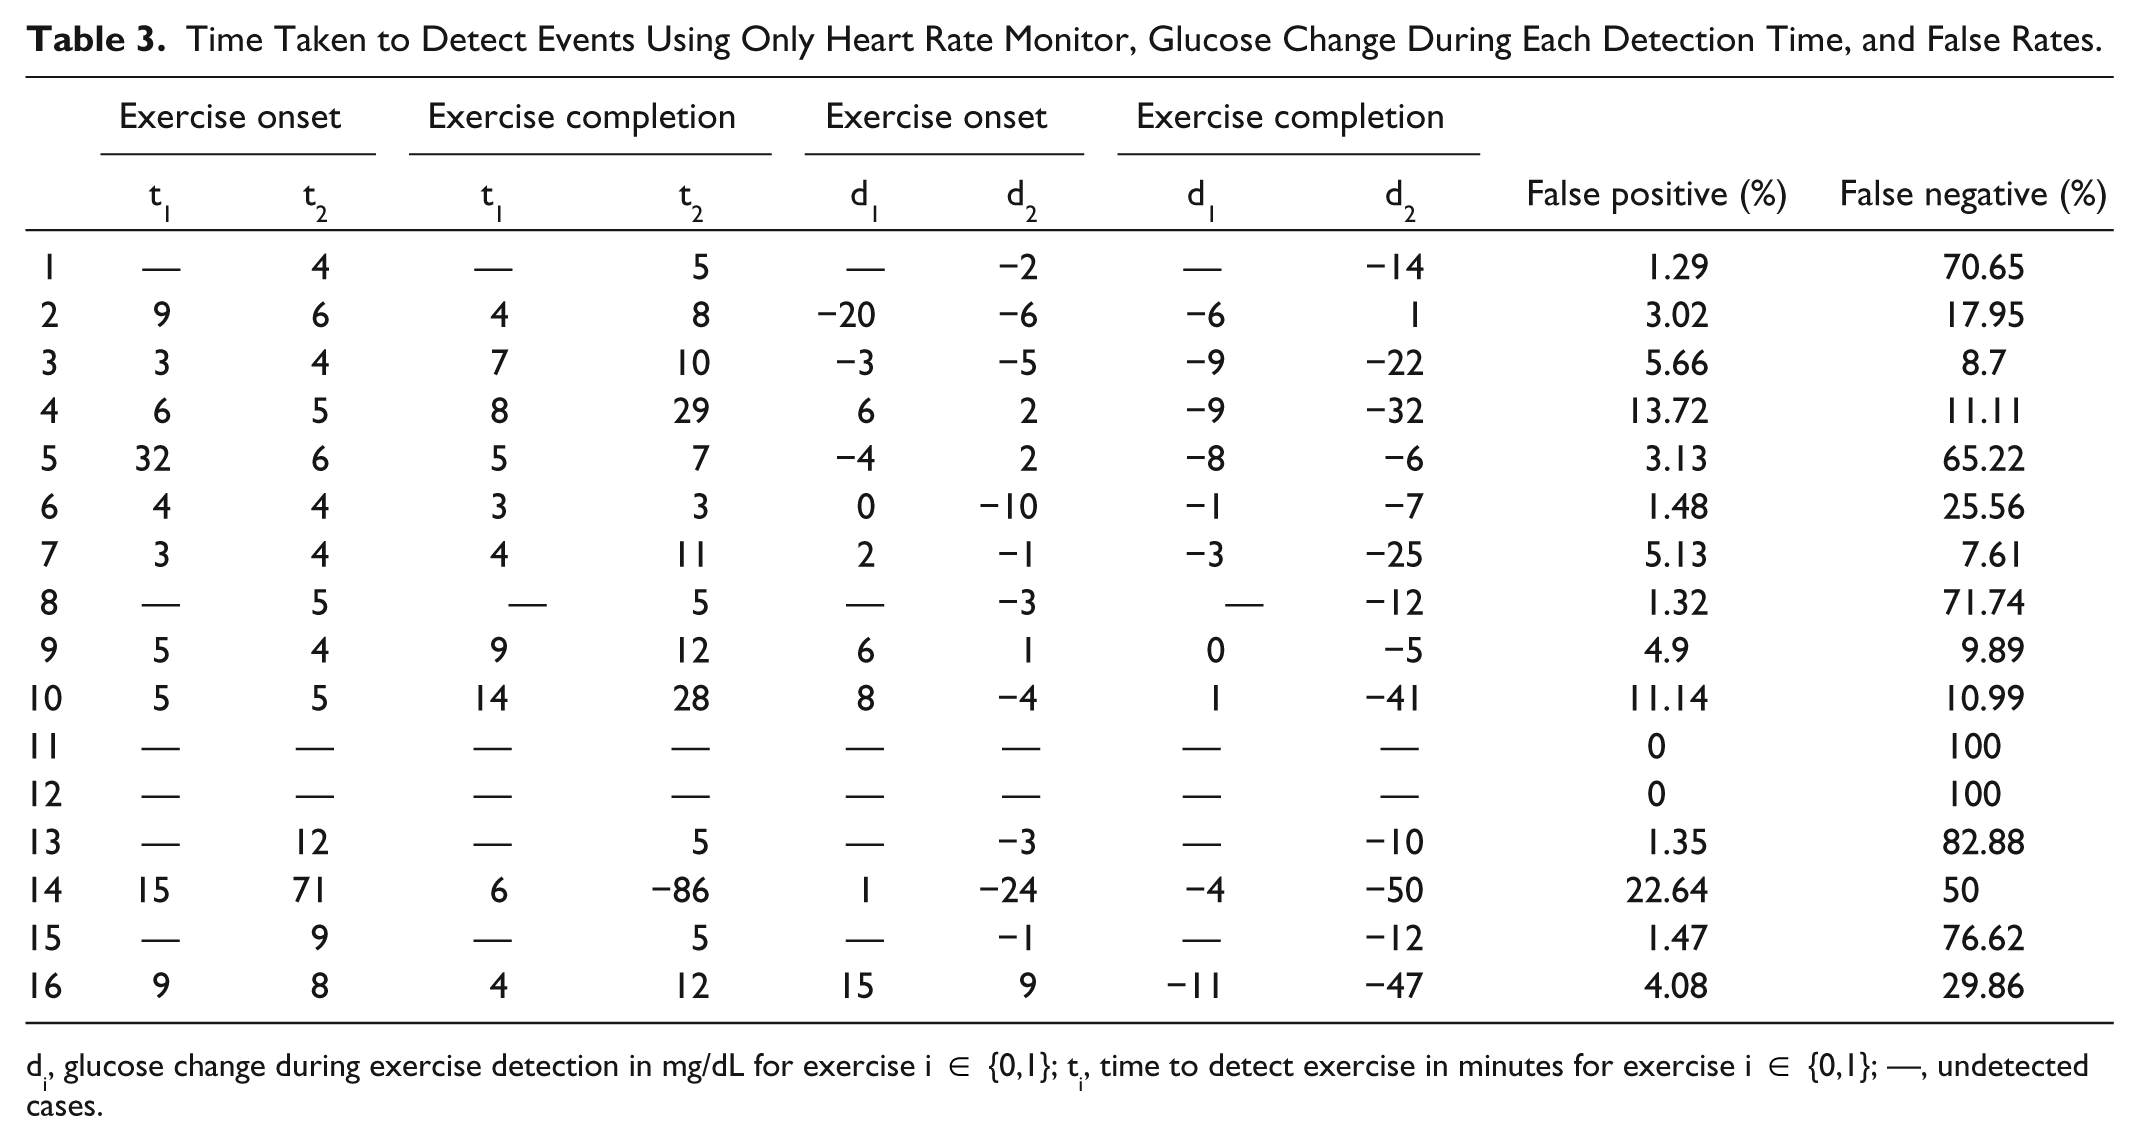
di, glucose change during exercise detection in mg/dL for exercise i ∈ {0,1}; ti, time to detect exercise in minutes for exercise i ∈ {0,1}; —, undetected cases.
Time Taken to Detect Events Using the PCA-Based Detection Method, Glucose Change During Each Detection, and False Rates.
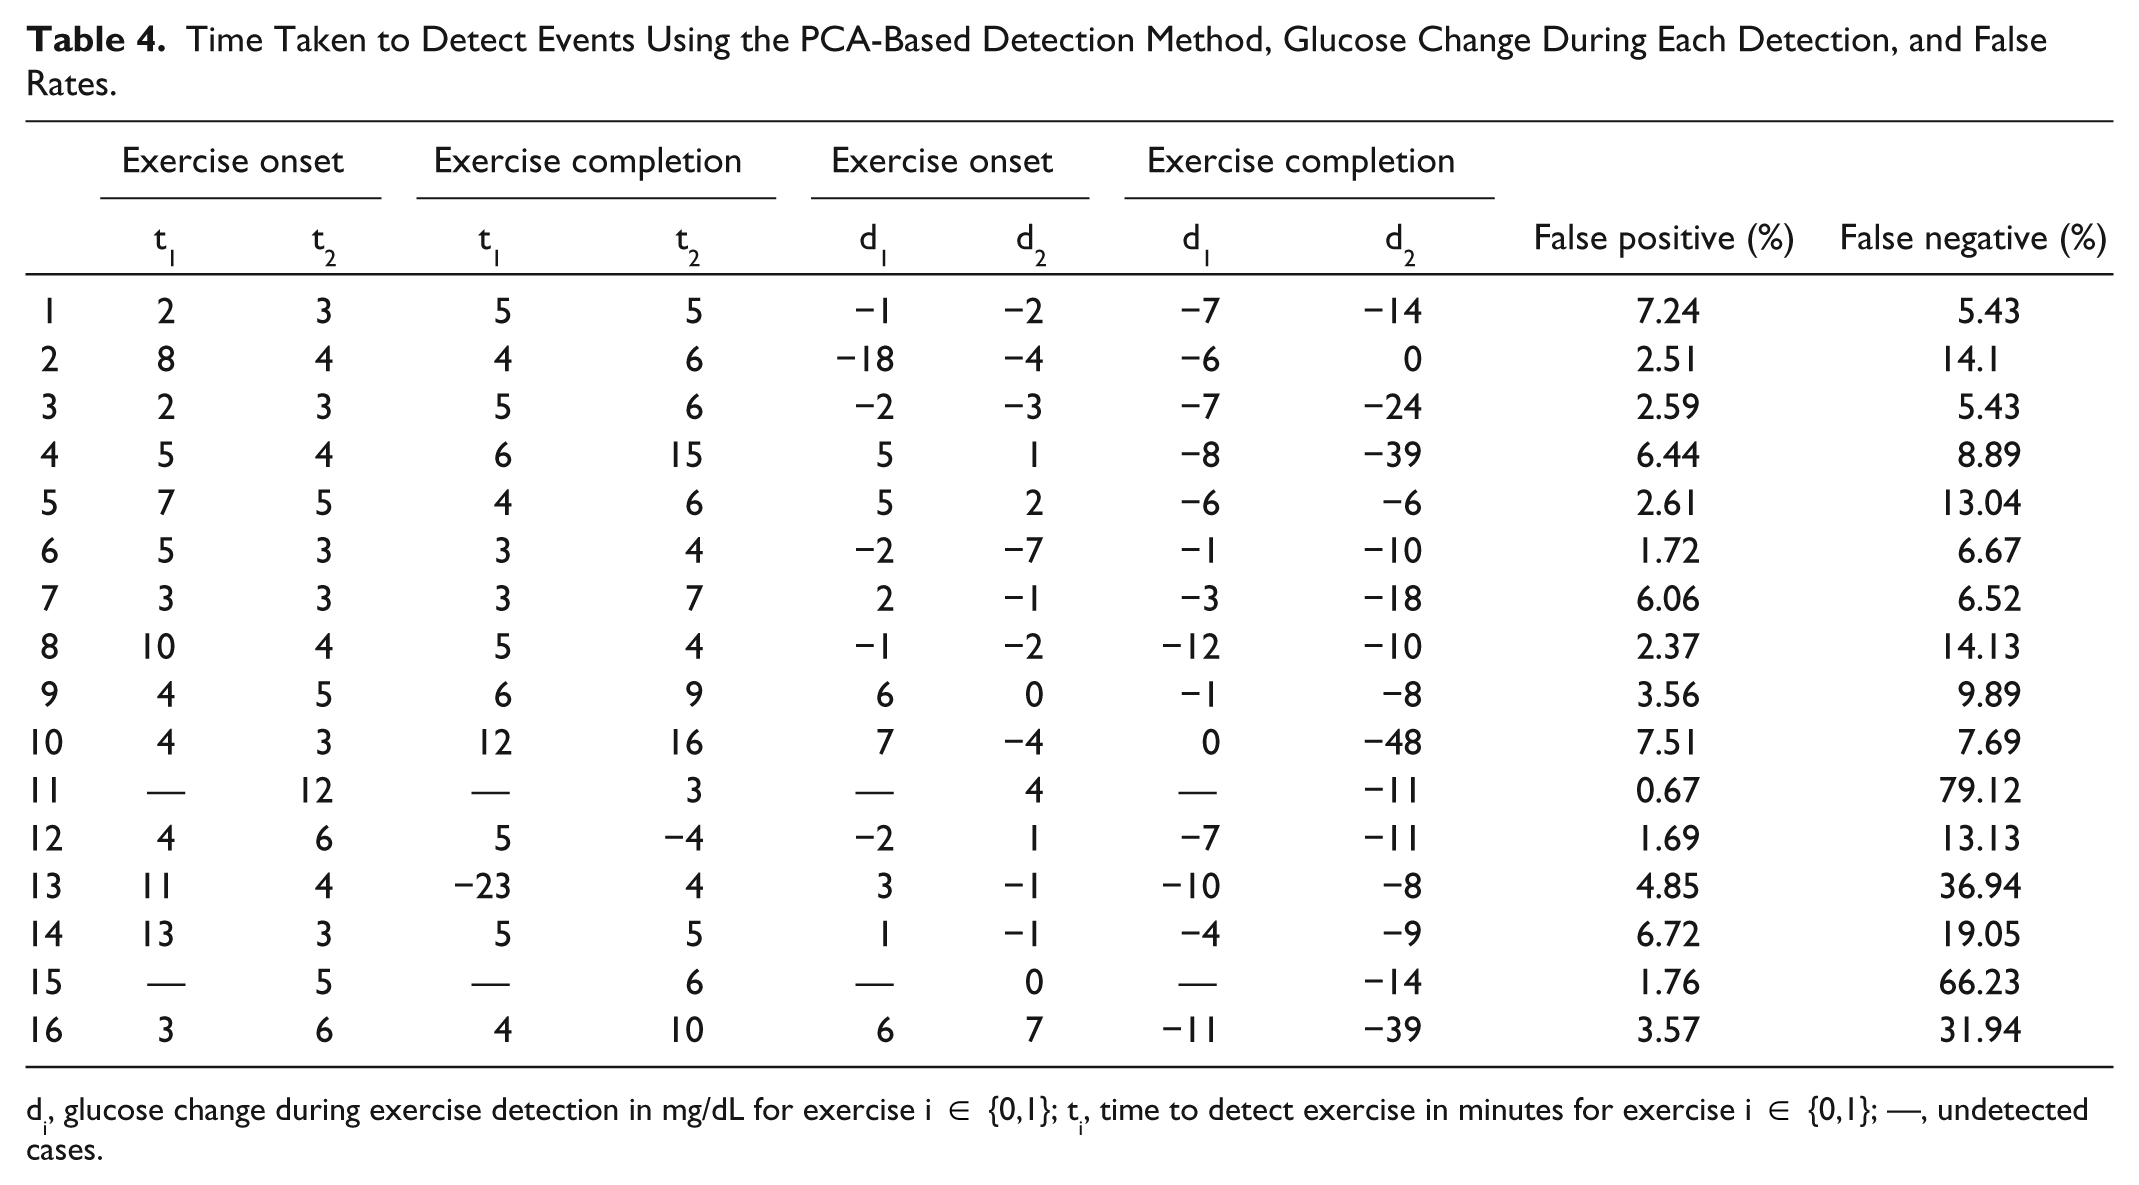
di, glucose change during exercise detection in mg/dL for exercise i ∈ {0,1}; ti, time to detect exercise in minutes for exercise i ∈ {0,1}; —, undetected cases.
Time Taken to Detect Events Using Both Heart Rate Monitor and Accelerometer in Univariate Setting, Where Exercise Was Flagged When Both Sensors Exceed 90% of Their Confidence Limit, Glucose Change During Each Detection, and False Rates.
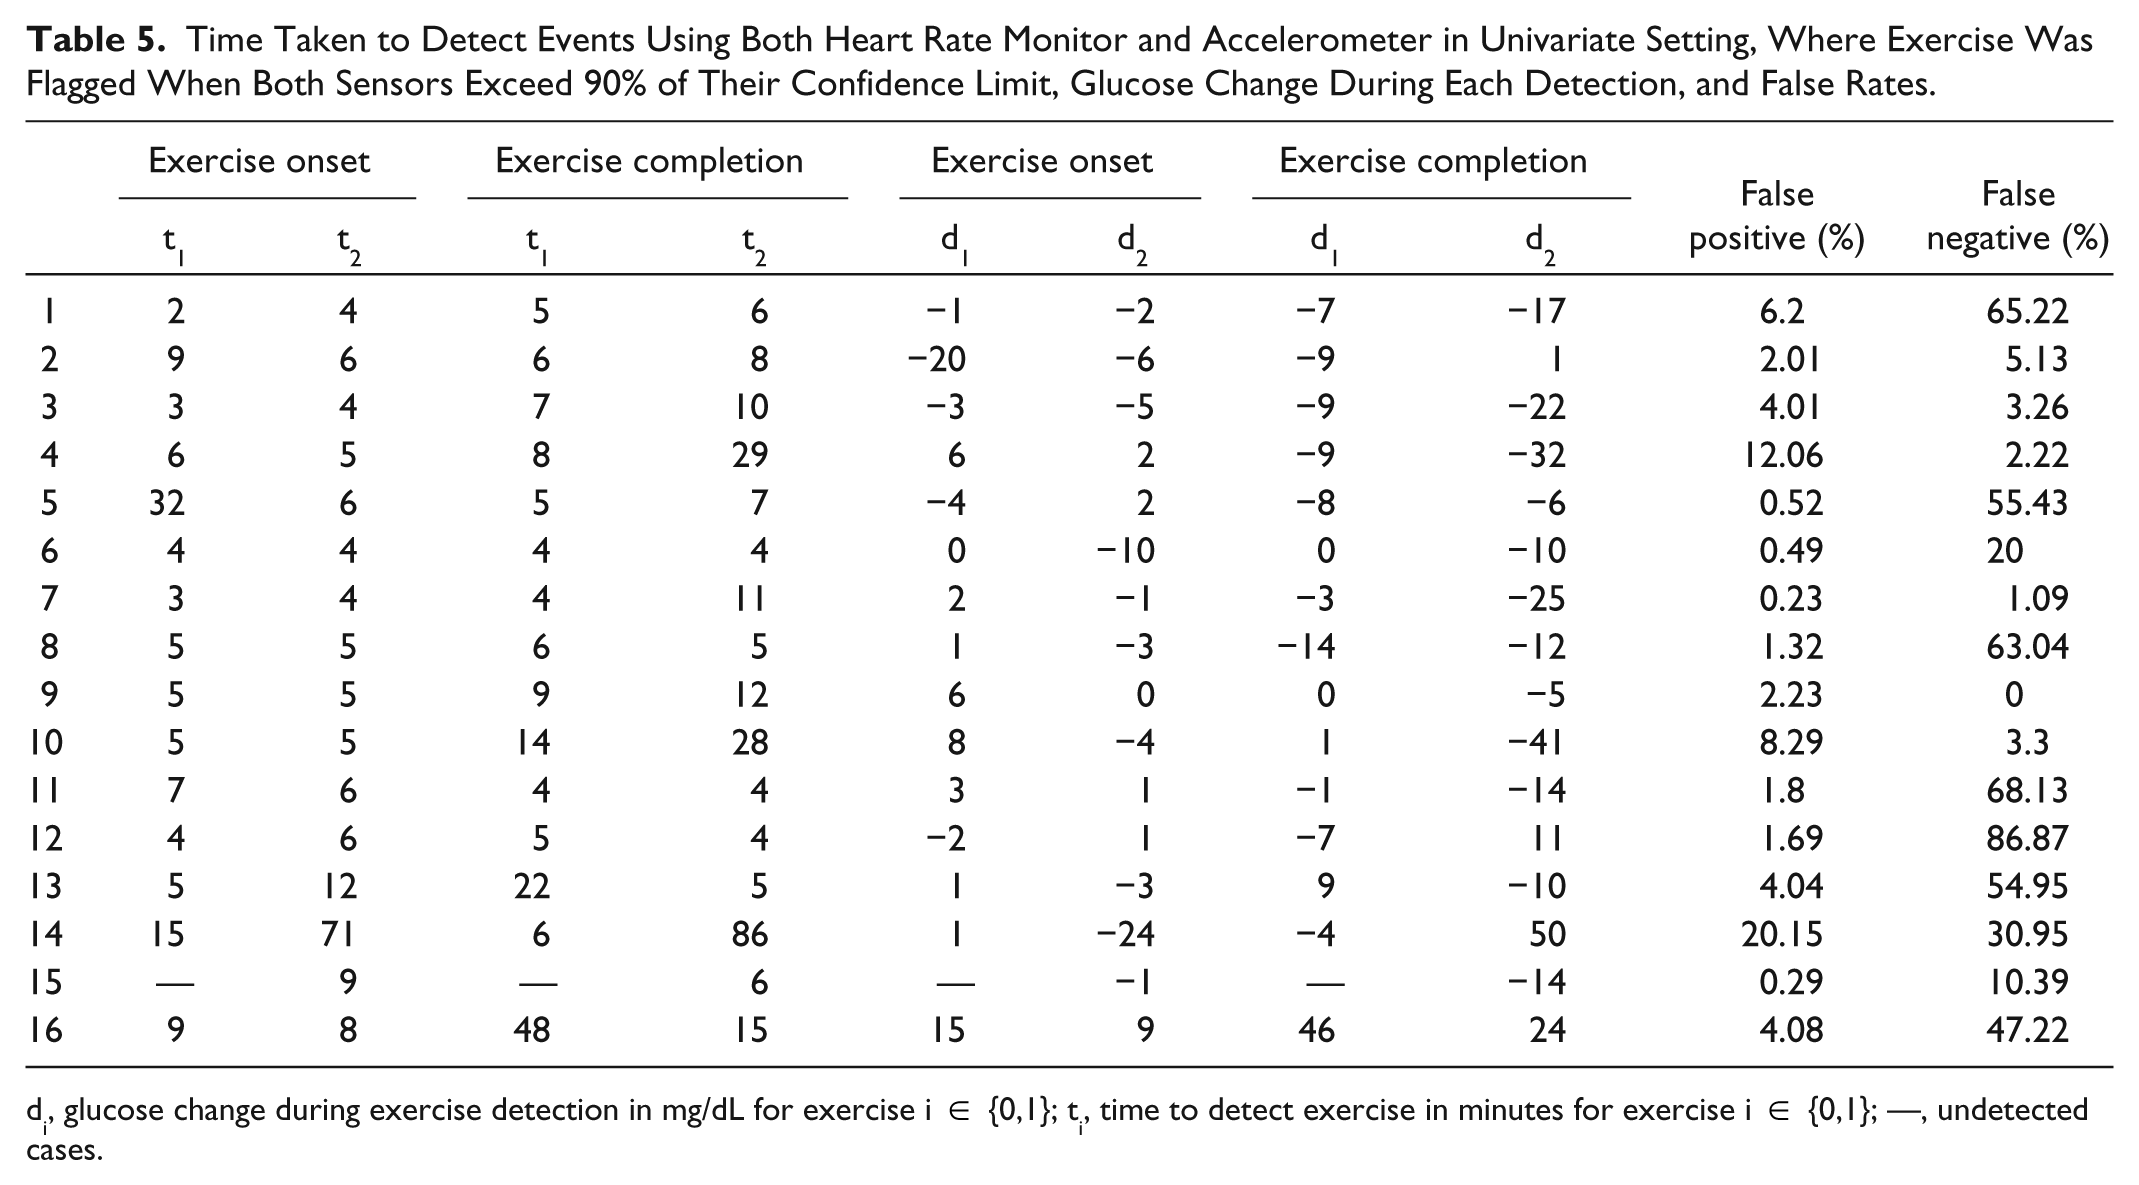
di, glucose change during exercise detection in mg/dL for exercise i ∈ {0,1}; ti, time to detect exercise in minutes for exercise i ∈ {0,1}; —, undetected cases.
Figure 3 depicts the magnitude of glucose changes during exercise sessions at both the time of detection and at 1 hour after the exercise period ended. Glucose change during the detection period refers to the time that the method takes to flag an exercise activity from the actual start time of the exercise. Similarly, glucose change during the end of exercise detection is measured by the time that the method takes to flag the end of exercise from actual exercise end time. The glucose concentration change from the start of exercise to the detection time was 1 ± 6 mg/dL, range −18 to +7 mg/dL, for 30% HRR exercise. For 50% HRR exercise, it ranged from −7 to +7 mg/dL with −1 ± 3 mg/dL. The total BG concentration change from the start of exercise to its completion time was −69 ± 31mg/dL, range −126 to −16 mg/dL, for 30% HRR exercise and −43 ± 29 mg/dL, range −99 to −4 mg/dL, for 50% HRR exercise. Note that duration of the 30% HRR exercise session (60 minutes) is larger compared to the 50% HRR exercise session (30 minutes). This is the reason for larger glucose drop during 30% HRR exercise even though its intensity is lower compared to 50% HRR exercise. The PCA-based method was able to detect both exercise onset and completion for glucose changes that were relatively small compared to the overall glucose change that was recorded during the exercise and 1 hour after the exercise ended.
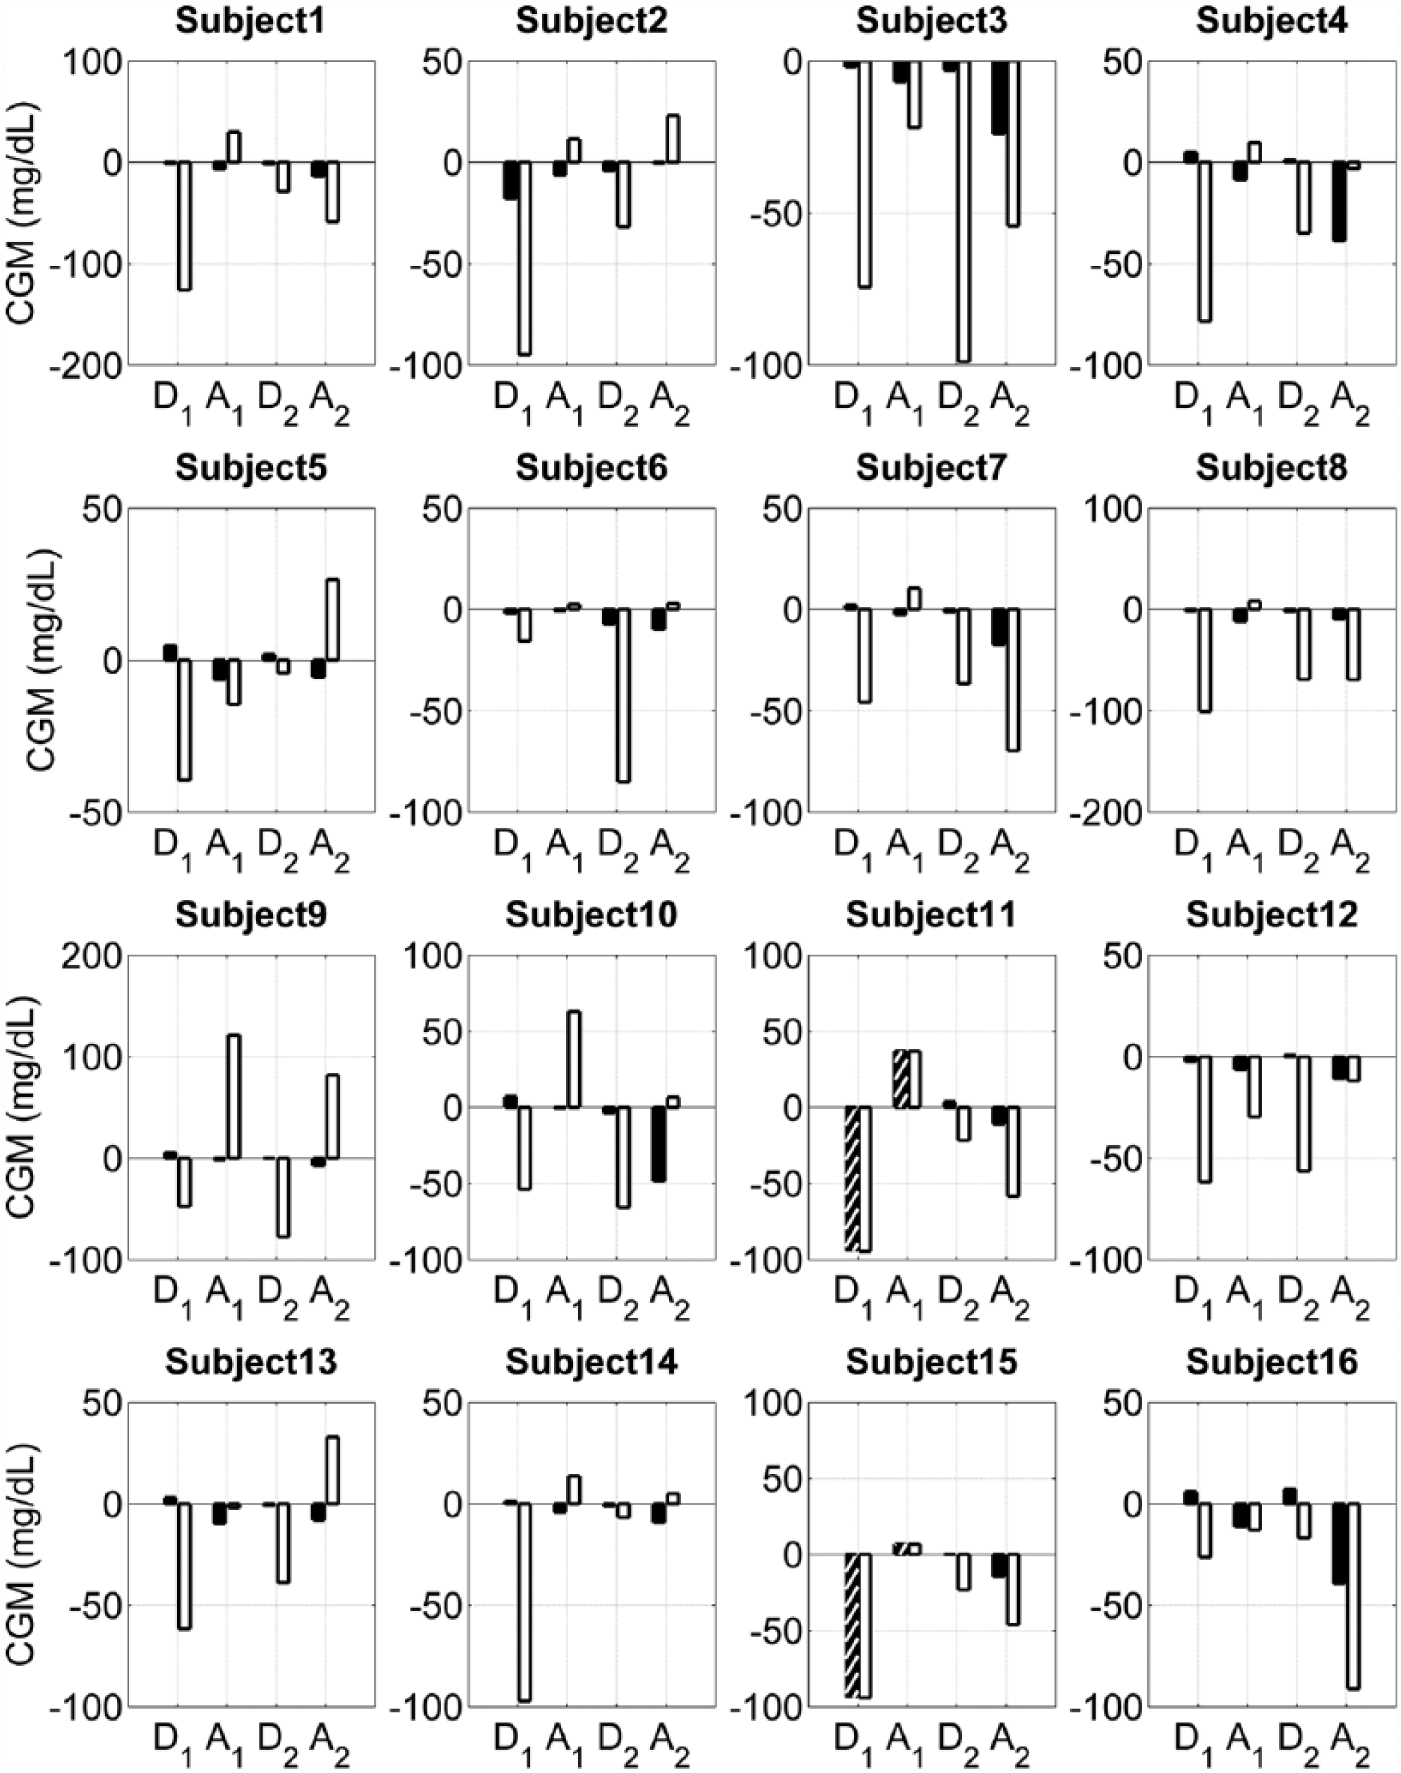
Glucose change during and after exercise sessions. D1 and D2 show the glucose change during the 2 exercise sessions of 30% HRR and 50% HRR, respectively. Black and white indicate the glucose change during the detection period and the glucose change during the entire exercise time, respectively. Similarly, A1 and A2 show the glucose change after the exercise sessions, where black and white indicate the glucose change during the end of exercise detection period, and the glucose change after 1 hour from the exercise end time, respectively. The hatched bars indicate the cases where PCA-based detection method fails to detect exercise.
Discussion
We developed a novel method for detecting physical activity using heart rate and accelerometer data in adults with T1DM and showed rapid detection of start and end of exercise prior to any significant change in BG. The method was able to quickly identify the onset and cessation of exercise with minimal false positive and false negatives. It accurately identified the onset and conclusion of exercise periods in approximately 5 minutes with a relatively small BG change even at a relatively low intensity of exercise (30% HRR). The detection method exhibited good robustness to outliers and sensor dropouts.
The methodology we have developed has important implications for clinical treatment, as early and reliable notification of glycemic changes related to exercise can allow an individual with T1DM to alter their treatment plan, whether that is by changes in carbohydrate intake or adjustments to insulin dosing. The importance of early detection of exercise prior to significant changes in BG has also been shown by recent publications that tested automatic adjustment of insulin dosing after detecting exercise using an AP device. Very promising results from Turksoy et al showed that a multivariable adaptive model with multiple inputs to adjust insulin delivery could improve glucose control in a small number of patients.11,12,14,17 Breton et al used heart rate measurements as an indicator for exercise during closed-loop insulin delivery trials. 13 During this study, the AP algorithm was manually informed that exercise had started whenever the subject’s heart rate reached a specified percentage above resting heart rate; the algorithm was informed again when the measured heart rate was reduced at the end of exercise. This approach successfully demonstrated that adjusting insulin delivery during and at the end of exercise could improve glycemic control.
The best sensors for use with our PCA algorithm, whether heart rate, accelerometer or another sensor, remain to be determined. Heart rate monitors have been used for many years during exercise training to help people improve aerobic fitness, 21 and can be a fast and easy indicator of activity or exercise. 13 However, heart rate monitors are not always reliable 15 and heart rate can change for reasons other than activity, such as during stress. 22 In addition, individuals with T1DM can have autonomic dysfunction with resting tachycardia, impairing heart rate response to exercise.23-25 Accelerometers have been used for several years for physical activity detection, and many types are now on the market to aid people in monitoring their activity levels. However, placement of the accelerometer(s) on the body for accurate detection and classification of exercise is important. Finally, using CGM alone is not sufficient as the CGM signal still lags behind the actual BG value when BG is changing rapidly. Combining accelerometer and heart rate monitors with CGM may potentially offer the best outcome.
Exercise detection using a combination of sensors is not a new field. Some previous studies have relied on custom devices for exercise detection.9,10 More recent attempts to classify activity detection have shown classification accuracy as high as 86%.8,26 Models have also been developed to account for known changes in glucose dynamics during exercise. 27 The advantage of the technique we have developed for exercise detection is that in addition working rapidly and accurately, it detects the onset and end of exercise before any significant change in glucose readings occurs as measured by CGM. If integrated into AP control systems, this will allow for informing the system that exercise activity has occurred before any changes in glucose are detected. By accurately determining the duration of exercise, as we have done, we hope to use this technique to inform AP control systems in future studies of when to respond and not to respond to exercise detection, as informing on the duration of exercise will have significant treatment implications.
Strengths of our study include the use of commercially available devices for heart rate and activity monitoring. This will be important for exercise detection outside of a clinic or a research setting, as many systems used in exercise detection research today still rely on a significant amount of customized equipment.28,29 As demonstrated in many industrial applications of PCA, our PCA-based detection method has the potential to be applicable when there are more than 2 sensors. 20 It could be used for fault detection and classification to identify sensor failures. Similar to other studies, we encountered sensor dropouts for several subjects and the data for those subjects’ dropout periods were omitted in model calibration and replaced with means in model validation. 27 We also found that acceleration detectors were more sensitive for low to moderate activity than were heart rate sensors. This result will be important for detection of less intense activity or activities of daily living. Also similar to other studies, we found that accelerometer placement was very important for exercise detection and that the heart rate detection method was not always reliable. 16
It should be noted that this study had a small sample size and focused on only 2 types of exercise. Although acceleration and heart rate signals are usually correlated, they can be affected differently during various physiological conditions, for example the physiologic response to anaerobic exercise or stress. Aerobic exercise should increase both heart rate and acceleration of the body, but resistive-type anaerobic exercise may only increase the heart rate. Stress can cause an increased heart rate without any acceleration. 22 A combination of sensors may be needed to distinguish exercise from other conditions. Furthermore, utilization of 2 or more sensors provides an additional robustness to sensor failures and outliers.
Conclusions
Using PCA, we were able to analyze heart rate and accelerometer data to reliably detect the onset and completion of physical activity prior to any significant changes in BG. The next step is to use this detection analysis method with real-time integration into an AP system for automatic control of BG during and after different types of exercise.
Footnotes
Acknowledgements
Product support was received from Dexcom Inc and LifeScan, Inc.
Declaration of Conflicting Interests
The author(s) declared no potential conflicts of interest with respect to the research, authorship, and/or publication of this article.
Funding
The author(s) disclosed receipt of the following financial support for the research, authorship, and/or publication of this article: This work was supported by the National Institutes of Health (R01 DK-085628 and DP3 DK094331).
Abbreviations
AP, artificial pancreas; BG, blood glucose; CGM, continuous glucose monitor; HRR, heart rate reserve; PCA, principal component analysis; T1DM, type 1 diabetes mellitus.