
Abstract
Background:
The oral glucose tolerance test (OGTT) is the only method to diagnose patients having impaired glucose tolerance (IGT), but its use has diminished considerably in recent years. Metabolomic profiling studies have identified a number of metabolites whose fasting levels are associated with dysglycemia and type 2 diabetes. These metabolites may serve as the basis of an alternative test for IGT.
Method:
Using the stable isotope dilution technique, quantitative assays were developed for 23 candidate biomarker metabolites. These metabolites were measured in fasting plasma samples taken just prior to an OGTT from 1623 nondiabetic subjects: 955 from the Relationship between Insulin Sensitivity and Cardiovascular Disease Study (RISC Study; 11.7% IGT) and 668 subjects from the Diabetes Mellitus and Vascular Health Initiative (DMVhi) cohort from the DEXLIFE project (11.8% IGT). The associations between metabolites, anthropometric, and metabolic parameters and 2hPG values were assessed by Pearson correlation coefficients and Random Forest classification analysis to rank variables for their ability to distinguish IGT from normal glucose tolerance (NGT). Multivariate logistic regression models for estimating risk of IGT were developed and evaluated using AUCs calculated from the corresponding ROC curves.
Results:
A model based on the fasting plasma levels of glucose, α-hydroxybutyric acid, β-hydroxybutyric acid, 4-methyl-2-oxopentanoic acid, linoleoylglycerophosphocholine, oleic acid, serine and vitamin B5 was optimized in the RISC cohort (AUC = 0.82) and validated in the DMVhi cohort (AUC = 0.83).
Conclusions:
A novel, all-metabolite-based test is shown to be a discriminate marker of IGT. It requires only a single fasted blood draw and may serve as a more convenient surrogate for the OGTT or as a means of identifying subjects likely to be IGT.
Keywords
The pandemic of type 2 diabetes continues unabated, and there remains a great need for early biomarkers of incident diabetes. It is now clear that type 2 diabetes can be delayed or prevented by several means including lifestyle intervention, drug therapy, and bariatric surgery. Intervention efforts such as the Diabetes Prevention Program 1 can be expensive and resource intensive, so it is important to identify subjects with the highest risk for diabetes early and accurately and to intervene selectively.
Prediabetes is currently defined using 1 or more of a trio of glycemic-based criteria: fasting plasma glucose (FPG, 100-125 mg/dl), 2-hour plasma glucose (2hPG, 140-199 mg/dl) from an oral glucose tolerance test (OGTT), and hemoglobin A1c (A1C, 5.7-6.4%). 2 These criteria have been shown to identify only partially overlapping groups of subjects,3-4 and likely reflect different pathophysiological states along the metabolic continuum leading to type 2 diabetes. For example, an elevated 2hPG value may be due to peripheral insulin resistance coupled with a β-cell defect, while elevated FPG may be largely due to hepatic insulin resistance. 5 A1C, on the other hand, provides a measure of average plasma glucose levels. 6 The OGTT has been used widely for the diagnosis of diabetes and impaired glucose tolerance (IGT) but its use has diminished considerably in recent years 7 as it is time-consuming, expensive, and unpopular with both patients and physicians. Due to the greater convenience of measuring FPG and A1C, patients at risk for diabetes are more likely to have these 2 parameters measured in routine examinations at the present time than to undergo an OGTT.8-9 As a consequence, IGT subjects with normal FPG and A1C values may not be identified. This is unfortunate as IGT is a high risk state for type 2 diabetes, with annual progression rates of 5-15%. 10 A more convenient method for identifying IGT subjects other than the OGTT or a method of stratifying risk for IGT could be useful to contemporary diabetes risk assessment.
We recently reported on the ability of 2 circulating metabolites, α-hydroxybutyrate (α-HB) and linoleoylglycerophosphocholine (LGPC), identified by metabolomic screening and validated in 2 separate prospective cohorts, to predict incident dysglycemia/diabetes. 11 When added to multivariate predictive models consisting of FPG, age, sex, BMI, and family history of diabetes, these 2 metabolites had a power comparable to that of 2hPG for improving the AUC of the model. In addition, we have utilized AHB, LGPC, along with oleic acid and insulin as the basis of an insulin resistance test 12 as all 4 serve as biomarkers of insulin sensitivity. Our goal was to utilize these and other metabolites associated with dysglycemia and type 2 diabetes to generate novel metabolite-based models that distinguish IGT from NGT in nondiabetic subjects. This report describes the development and characterization of a novel, metabolite-based IGT test.
Methods
Cohorts
The Relationship between Insulin Sensitivity and Cardiovascular Disease Study (RISC Study) is a prospective, observational cohort study (N = 1308 at baseline) whose rationale and methodology have been published.13,14 In short, clinically healthy participants between the ages of 30 and 60 years were recruited at 19 centers in 13 countries in Europe. A standard 75 g glucose OGTT was performed at the initial examination. A second OGTT was performed at the 3-year follow-up examination. Fasting blood samples were obtained at each examination, and anthropometric and metabolic parameters were measured at the time of each OGTT.
Analyses were carried out on fasted plasma samples from 955 nondiabetic subjects taken just prior to an OGTT at the 3 year follow-up. All available samples having appropriate metadata from nondiabetic subjects were utilized.
The Diabetes Mellitus and Vascular Health Initiative (DMVhi) screening study recruited 29,458 policy holders from a large Irish private health insurance company, Vhi Healthcare Ireland. Between 2009 and 2012, policy holders aged 45-75 years, with no history of diabetes, from 2 large urban areas were screened for diabetes risk based on FPG, followed by a OGTT where FPG was 100-125 mg/dl, and the FINDRISC score. 15 Three-year rescreening commenced in 2012 of the cohort, and a subcohort of 700 participants with biobanked samples taken at baseline were identified for the DEXLIFE study. 16 The DEXLIFE subcohort included all participants with IFG (13%) and/or IGT (7%) at baseline, along with normoglycemic participants with an elevated diabetes risk based on FINDRISC at baseline (80%). A standard 75 g glucose OGTT was performed at the 3 year follow-up.
Analyses were carried out on fasted plasma samples from 668 nondiabetic subjects taken just prior to an OGTT at the 3 year follow-up.
Local Ethics Committee approval was obtained at each recruiting center for each cohort. Subjects were given a written and an oral explanation of the study and all provided informed consent.
Candidate IGT Biomarker Metabolites
Twenty-three candidate metabolite biomarkers for IGT were selected for use in the development of an IGT test (Table 1). These metabolites have been shown to be associated with prevalent or incident dysglycemia and type 2 diabetes in in-house nonbiased global metabolomic profiling studies (including RISC, Botnia, 17 METSIM, 18 and DMVhi) and represent diverse biochemical pathways. In addition, inclusion of several of these metabolites is supported by the literature. These include the branched-chain amino acids 19 and a number of their catabolites, 20 glycine,21,22 tyrosine, 19 2-aminoadipic acid, 23 α-HB, 11 and LGPC.11,21,22 Finally, an unknown compound having a defined mass spectrometric signature but no defined structure, X-12063, which was previously associated with insulin sensitivity, 24 was included. Quantitative assays for each of the 23 metabolites were developed using the isotope dilution method and fasting plasma levels of each of them were measured in the DMVhi and RISC cohorts.
List of Quantitative Assays for Candidate Biomarkers of IGT.
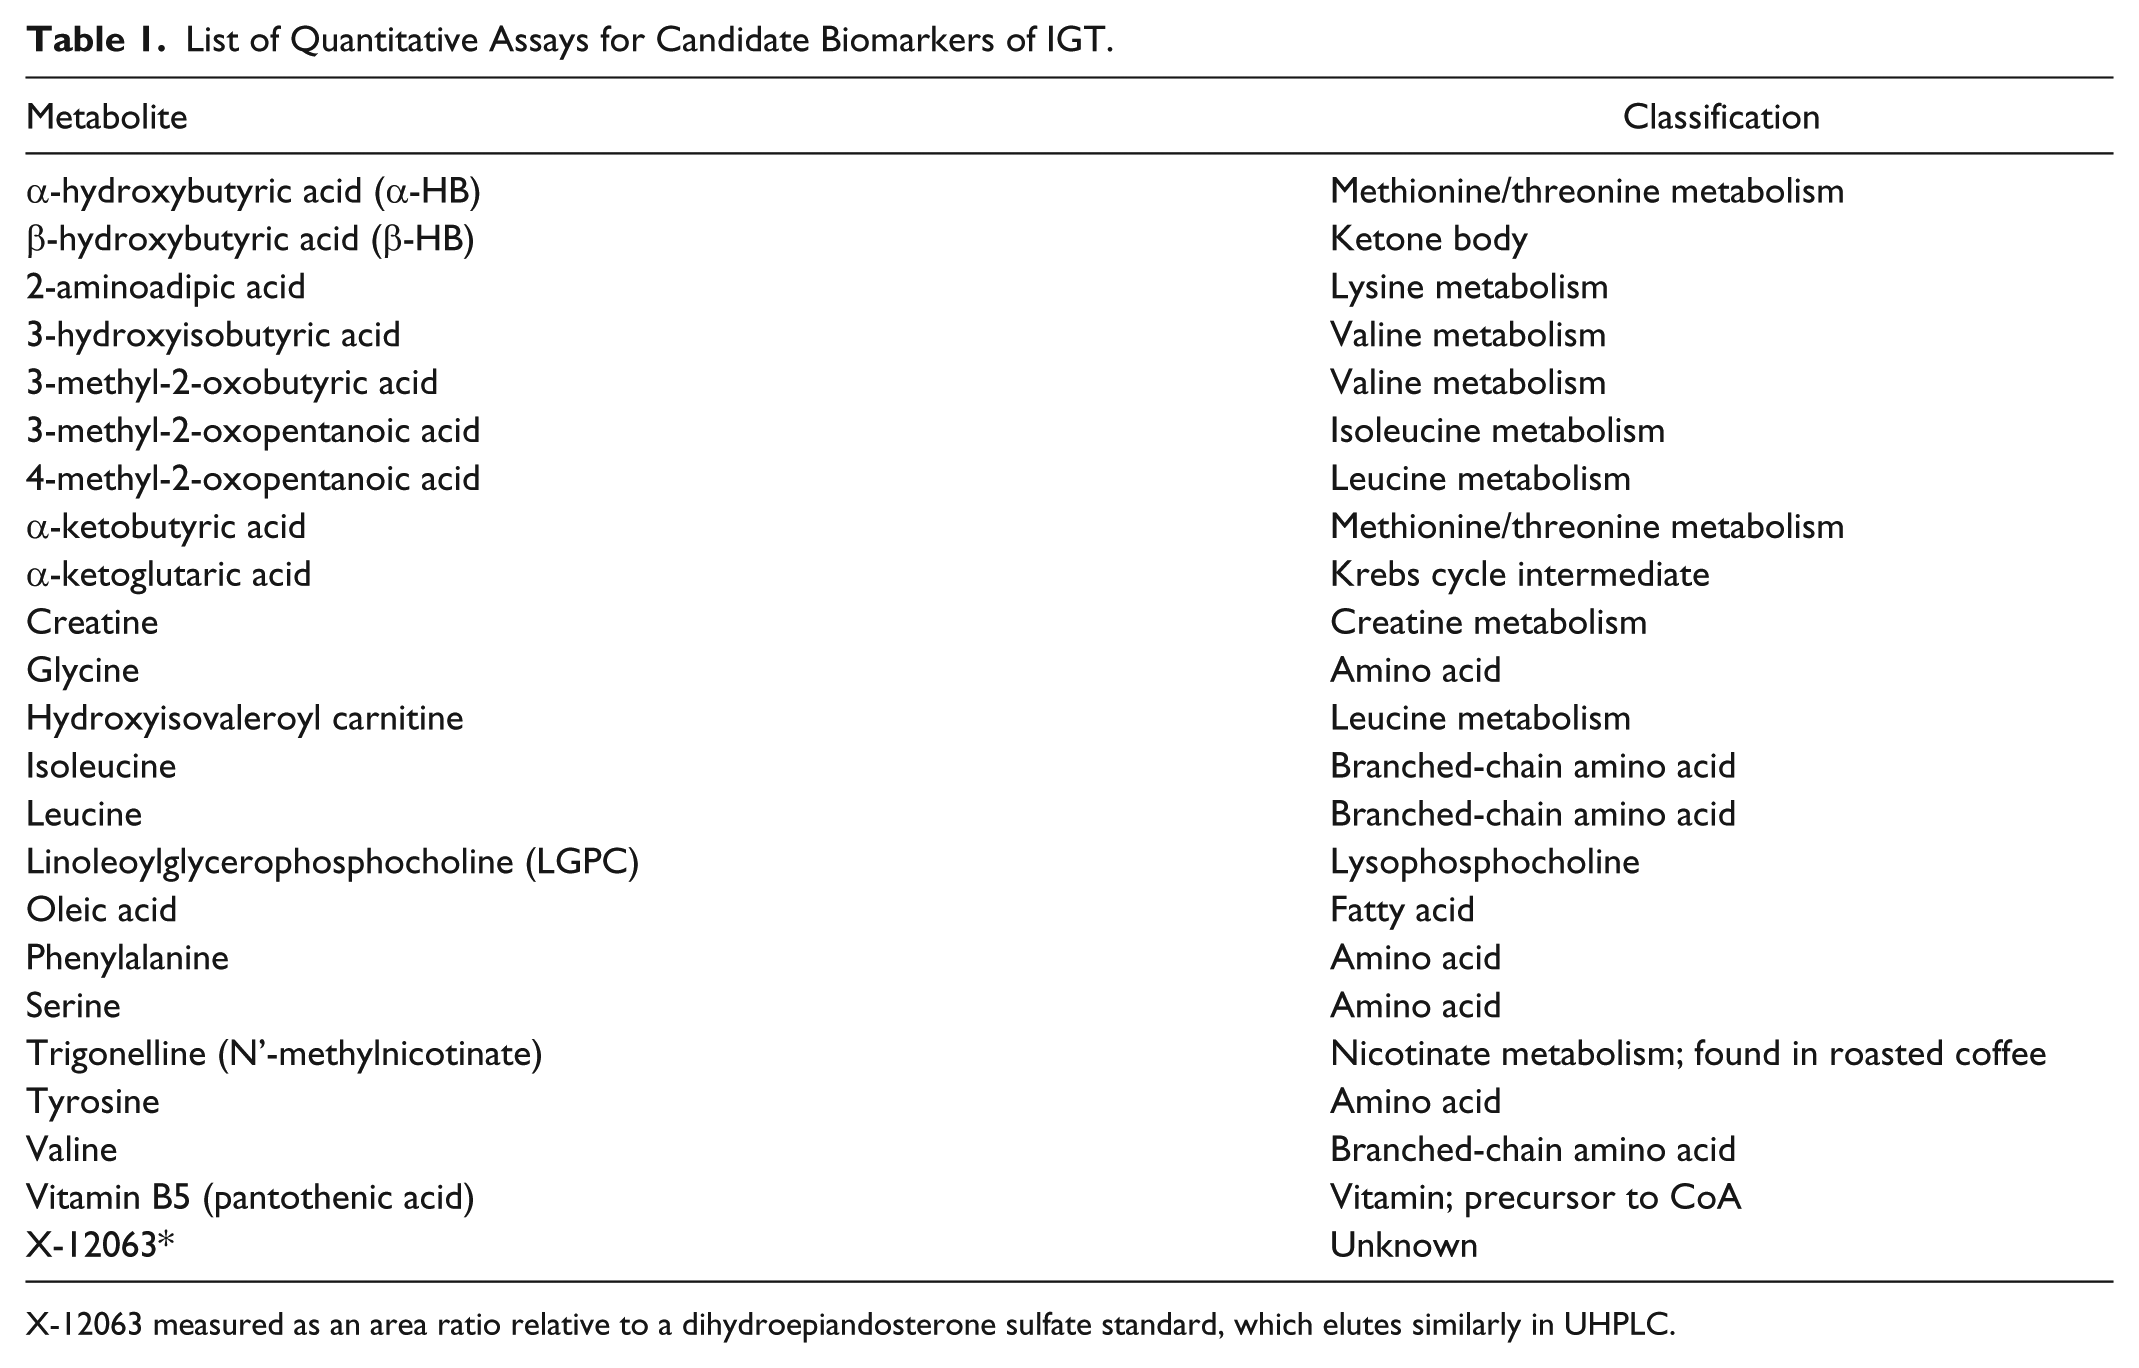
X-12063 measured as an area ratio relative to a dihydroepiandosterone sulfate standard, which elutes similarly in UHPLC.
Analytical Measurements
Metabolite Analysis
For absolute quantitation, metabolites were analyzed by isotope dilution UHPLC-MS-MS assays. In brief, 50 µl of EDTA plasma was spiked with stable labeled internal standards and subsequently subjected to protein precipitation by mixing with 200 µl of 1% formic acid in methanol. Following centrifugation, 60 µl aliquots of clear supernatant were removed and injected onto an Agilent 1290/AB Sciex QTrap 5500 mass spectrometer LC-MS/MS system using 1 of 2 different chromatographic systems (column/mobile phase combinations). α−HB, L-GPC, β-HB, 4-methyl-2-oxopentanoic acid, and oleic acid were eluted with a gradient (mobile phase A: 0.01% formic acid in water; mobile phase B: acetonitrile/methanol 1:1) on a Waters Acquity C-18 BEH column (2.1 mm × 100 mm, 1.7 mm particle size). Serine and vitamin B5 were eluted with a gradient (mobile phase A: 0.05% perfluoropentanoic acid in water; mobile phase B: 0.05% perfluoropentanoic acid in acetonitrile) on a Waters Acquity C-18 BEH column (2.1 mm × 50 mm, 1.7 mm particle size). Ionization was achieved by HESI source. Quantitation was performed based on the area ratios of analyte and internal standard peaks using a weighted linear least squares regression analysis generated from fortified calibration standards in water, prepared immediately prior to each run. Stable isotope labeled compounds (α−HB-d3, LGPC-d9, oleic acid- 13 C18, β-hydroxybutyrate-d4, 4-methyl-2-oxopentanoic acid-d3, vitamin B5- 13 C3- 15 N, and serine-d3) were used as internal standards.
Precision
Inter-run precision was evaluated by analyzing 12 samples of a pooled plasma lot per run at endogenous analyte levels over 3 separate runs. Inter-run %CVs for α−HB, LGPC, oleic acid, β-HB, 4-methyl-2-oxopentanoic acid, serine, and vitamin B5 were 5.1%, 5.0%, 6.3%, 4.9%, 5.7%, 5.0%, and 8.6%, respectively.
Glucose was measured using the glucose oxidase method in RISC and the glucokinase method in DMVhi.
Data Analysis
For the data analysis of this study, NGT subjects have FPG < 126 mg/dl and 2hPG < 140 mg/dl, and IGT subjects have FPG < 126 mg/dl and 2hPG ≥ 140 and < 200 mg/dl.
Cohort continuous anthropometric and metabolic parameter data are presented as mean ± standard deviation (SD) or median (interquartile range) and categorical data are summarized as percentage. Continuous variables for IGT vs NGT were evaluated by the Wilcoxon test and categorical variables using χ2 test. The associations between metabolites, anthropometric, and metabolic parameters and 2hPG values were assessed by the Pearson correlation coefficient and Random Forest classification analysis. 25 Multiple logistic regression analyses were generated in R 26 to compare the performance of clinical variables and the metabolites for their ability to distinguish IGT as a categorical variable in mixed NGT and IGT populations. The performance of each model was assessed as the c statistic (the area under the receiver operating characteristic curve, AUC) generated using the package pROC. 27 The estimated AUCs are reported with their 95% confidence intervals. In addition, within each cohort, the performance of the models were compared to FPG alone by implementing the nonparametric method of DeLong et al 28 to test if the models had a significantly improved performance. JMP 9.0 (SAS Institute, Cary, NC, USA) was used for additional statistical calculations and P values ≤ .05 were considered statistically significant.
The new IGT test is called Quantose IGT™, and its score is QIGT. It is calculated from a multiple logistic regression model based on the fasting plasma levels of glucose, α−HB, β−HB, 4-methyl-2-oxopentanoic acid, LGPC, oleic acid, serine, and vitamin B5 and is designed to estimate the risk of being IGT.
Results
Anthropometric and Metabolic Parameters
Table 2 details the anthropometric and metabolic characteristics for NGT and IGT subjects in the DMVhi and RISC studies. Both cohorts are 12% IGT and 88% NGT. Fasting glucose, fasting insulin, BMI, systolic blood pressure, and triglycerides are significantly increased and HDL cholesterol is significantly decreased in the IGT subjects within each cohort. A1C is significantly higher in IGT subjects in DMVhi and was not measured in RISC. In addition, in both cohorts IGT subjects are significantly older than NGT subjects and subjects in the DMVhi cohort are older than those in the RISC cohort (mean age of 63 vs 48; P < .0001). There is no significant difference in sex between the IGT and NGT subjects in either cohort.
Anthropometric and Metabolic Characteristics by Glycemic Status.
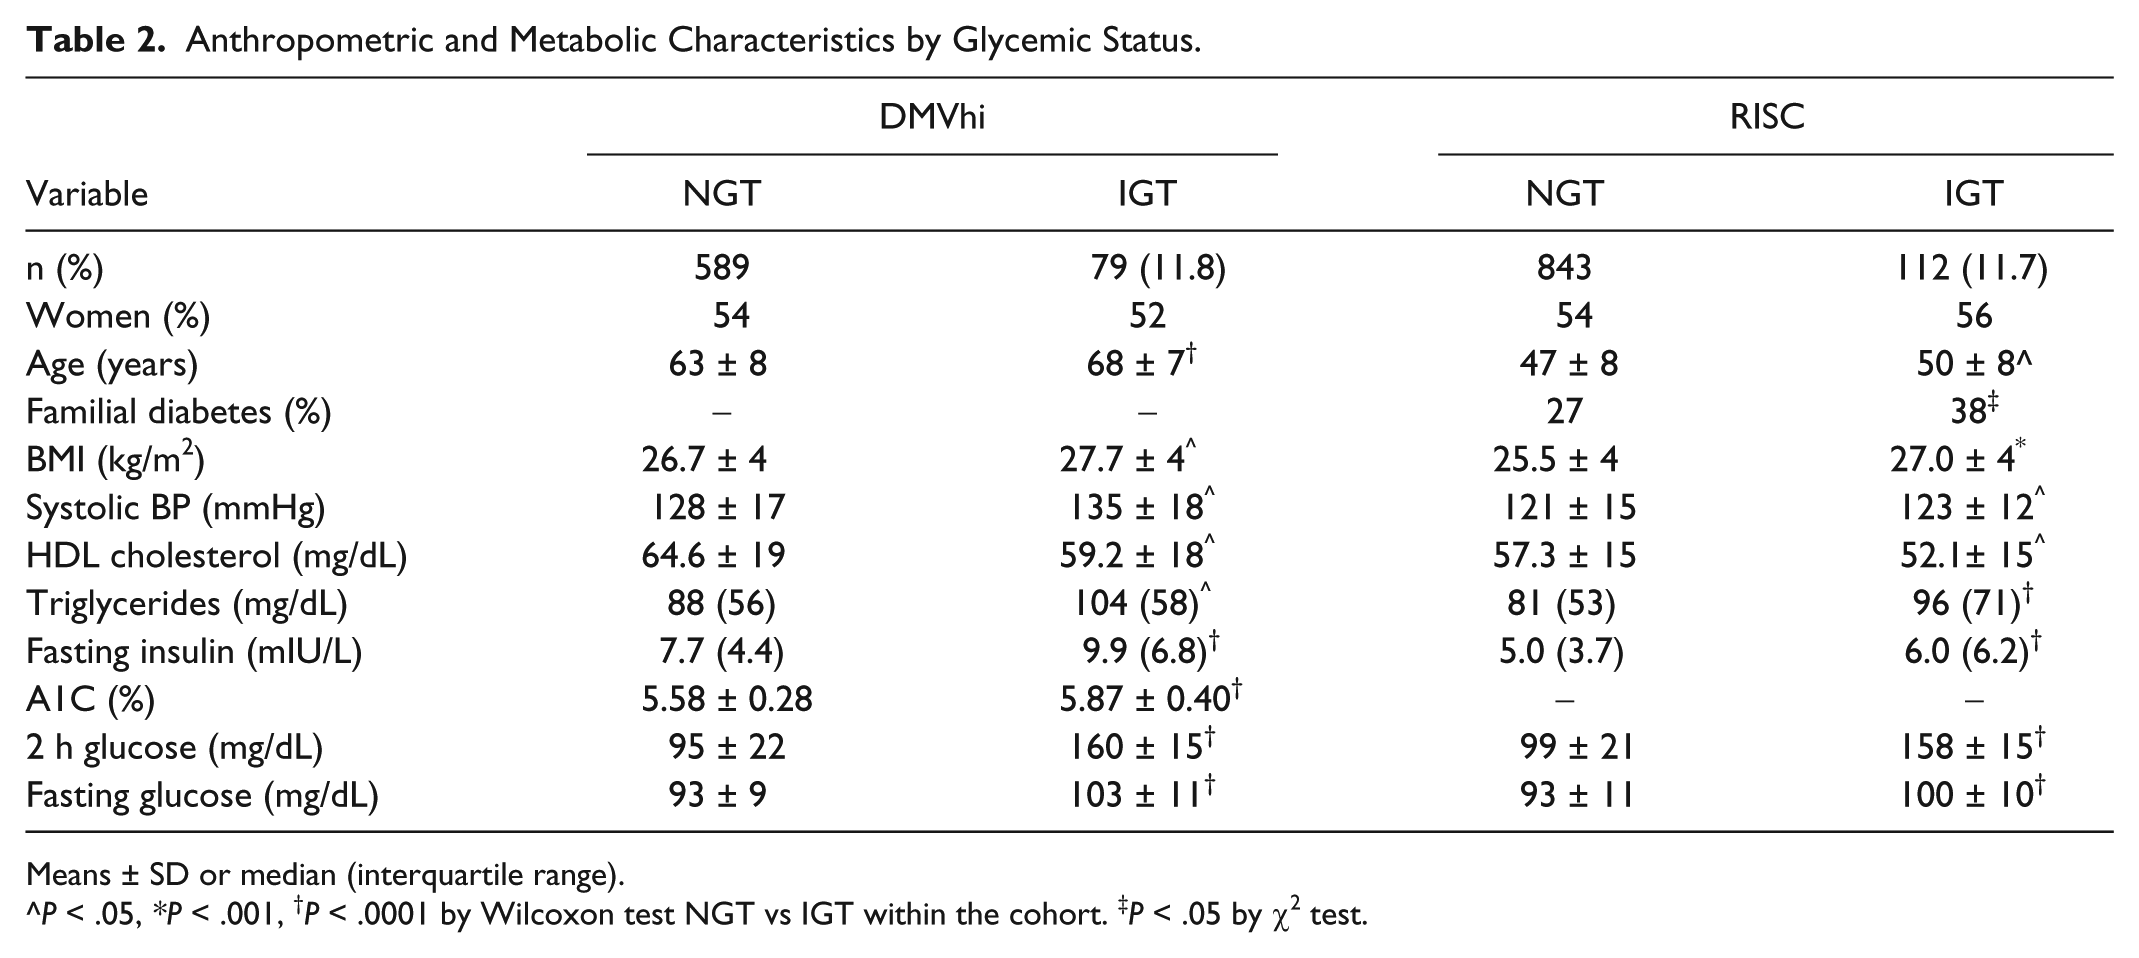
Means ± SD or median (interquartile range).
^P < .05, *P < .001, †P < .0001 by Wilcoxon test NGT vs IGT within the cohort. ‡P < .05 by χ2 test.
Metabolites
Table 3 lists the fasting levels of each metabolite in RISC for NGT and IGT subjects. Nineteeen of the metabolites are significantly different in IGT versus NGT subjects, and 11 of them have P values < .0001. Most of the metabolites are elevated in IGT with the exception of glycine, serine, trigonelline, and LGPC. The 23 metabolites were evaluated, along with age, sex, FPG, insulin, and BMI, for their ability to discriminate between IGT and NGT by Random Forest classification analysis. In RISC, the top 5 variables in the Random Forest importance plot were LGPC, FPG, α-ketobutyric acid, α-HB, and oleic acid (Figure 1). In DMVhi, the top 5 variables were FPG, age, LGPC, α-HB, and α-ketoglutaric acid. Pearson correlations for the levels of the 23 metabolites and anthropometric and metabolic parameters with 2hPG were calculated and are shown in Table 4 for RISC. The top correlating variables were FPG, α-HB, LGPC, oleic acid, and α-ketobutyrate.
Metabolite Levels by Glycemic Category: RISC.
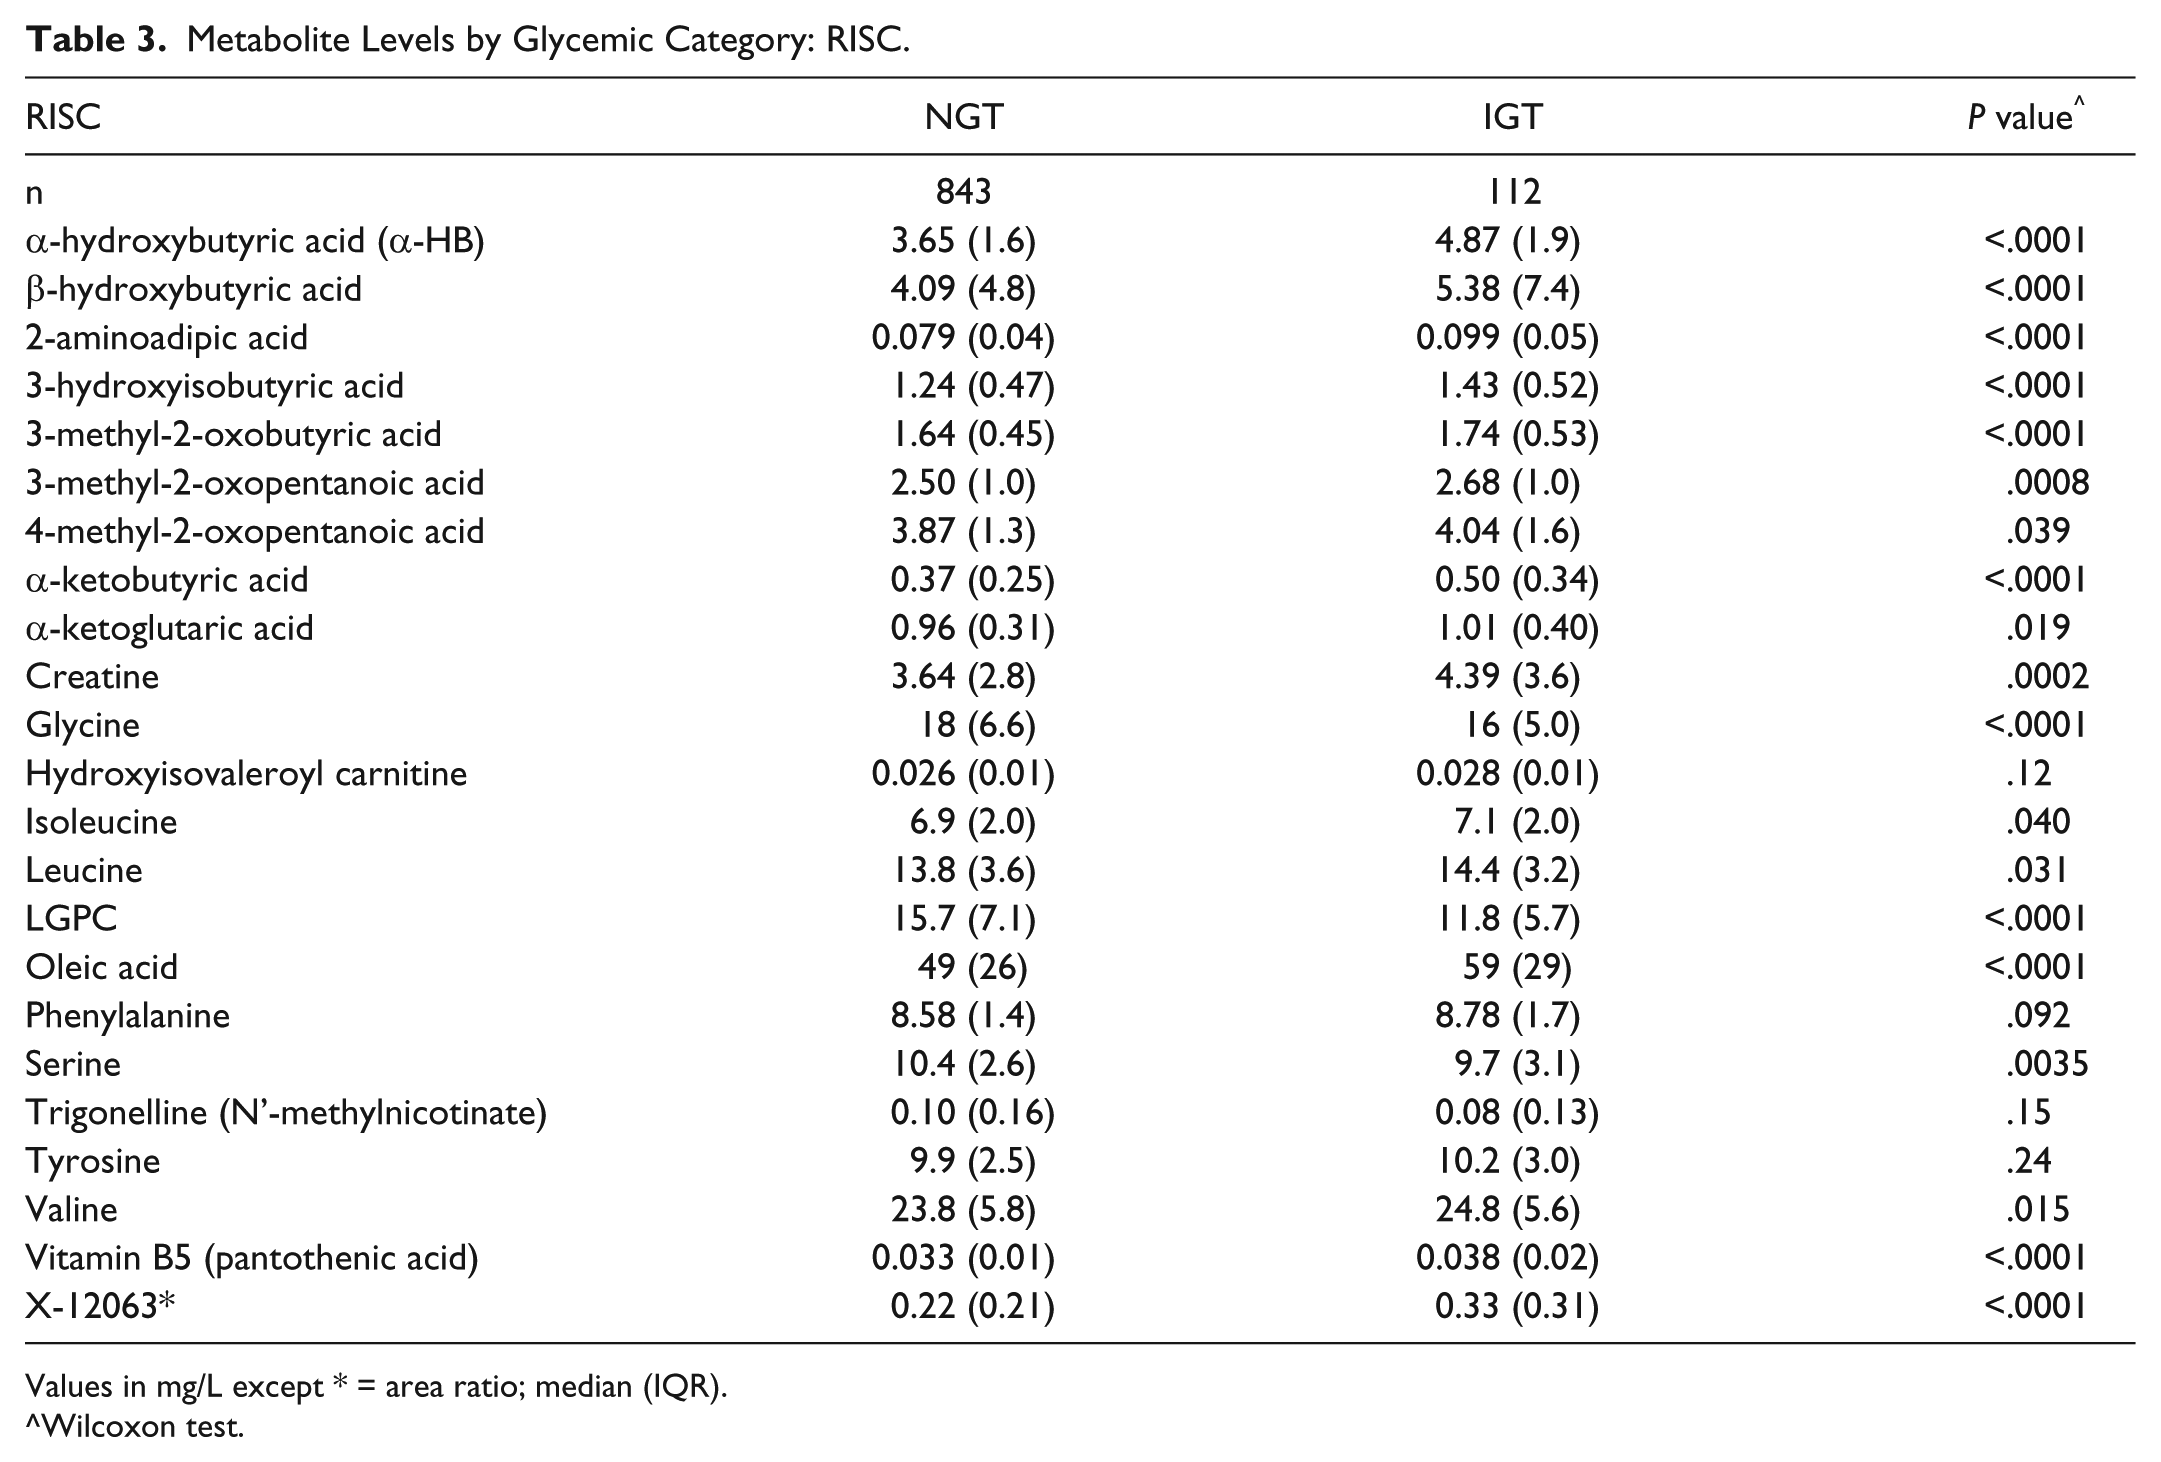
Values in mg/L except * = area ratio; median (IQR).
Wilcoxon test.
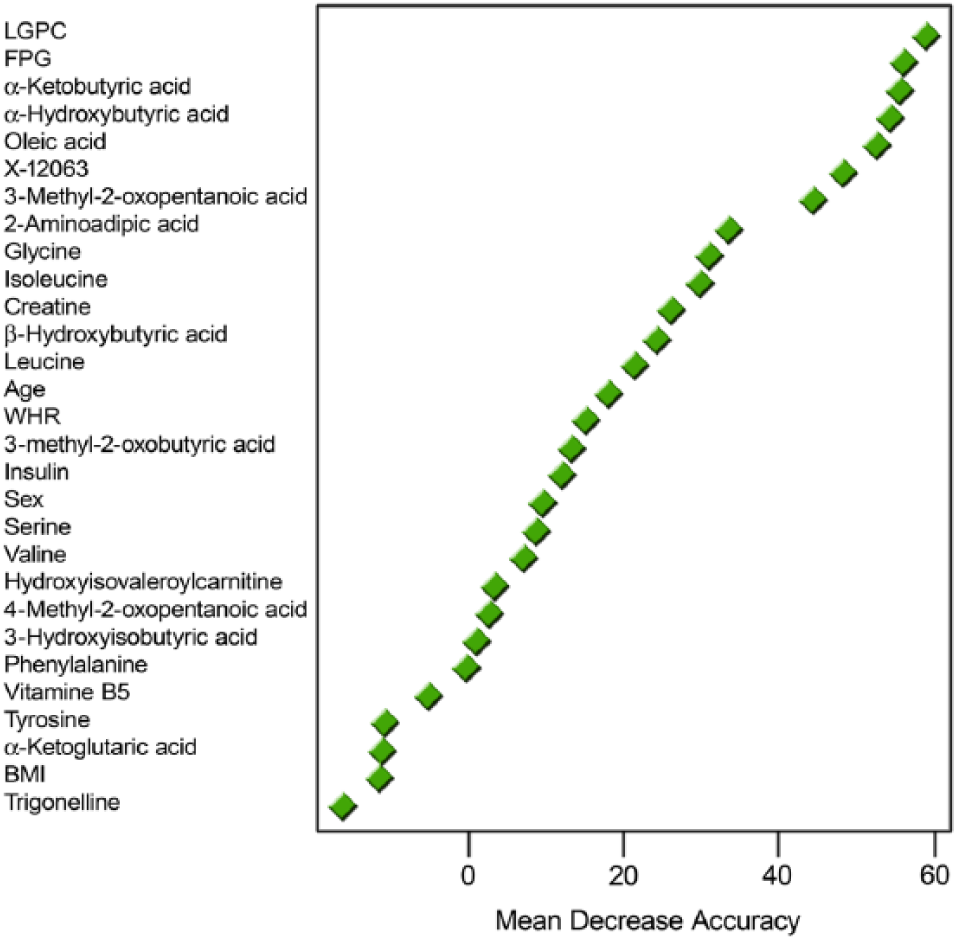
Random Forest importance plot for RISC.
Pearson Correlations of Metabolite, Anthropometric, and Metabolic Values With 2hPG in RISC.
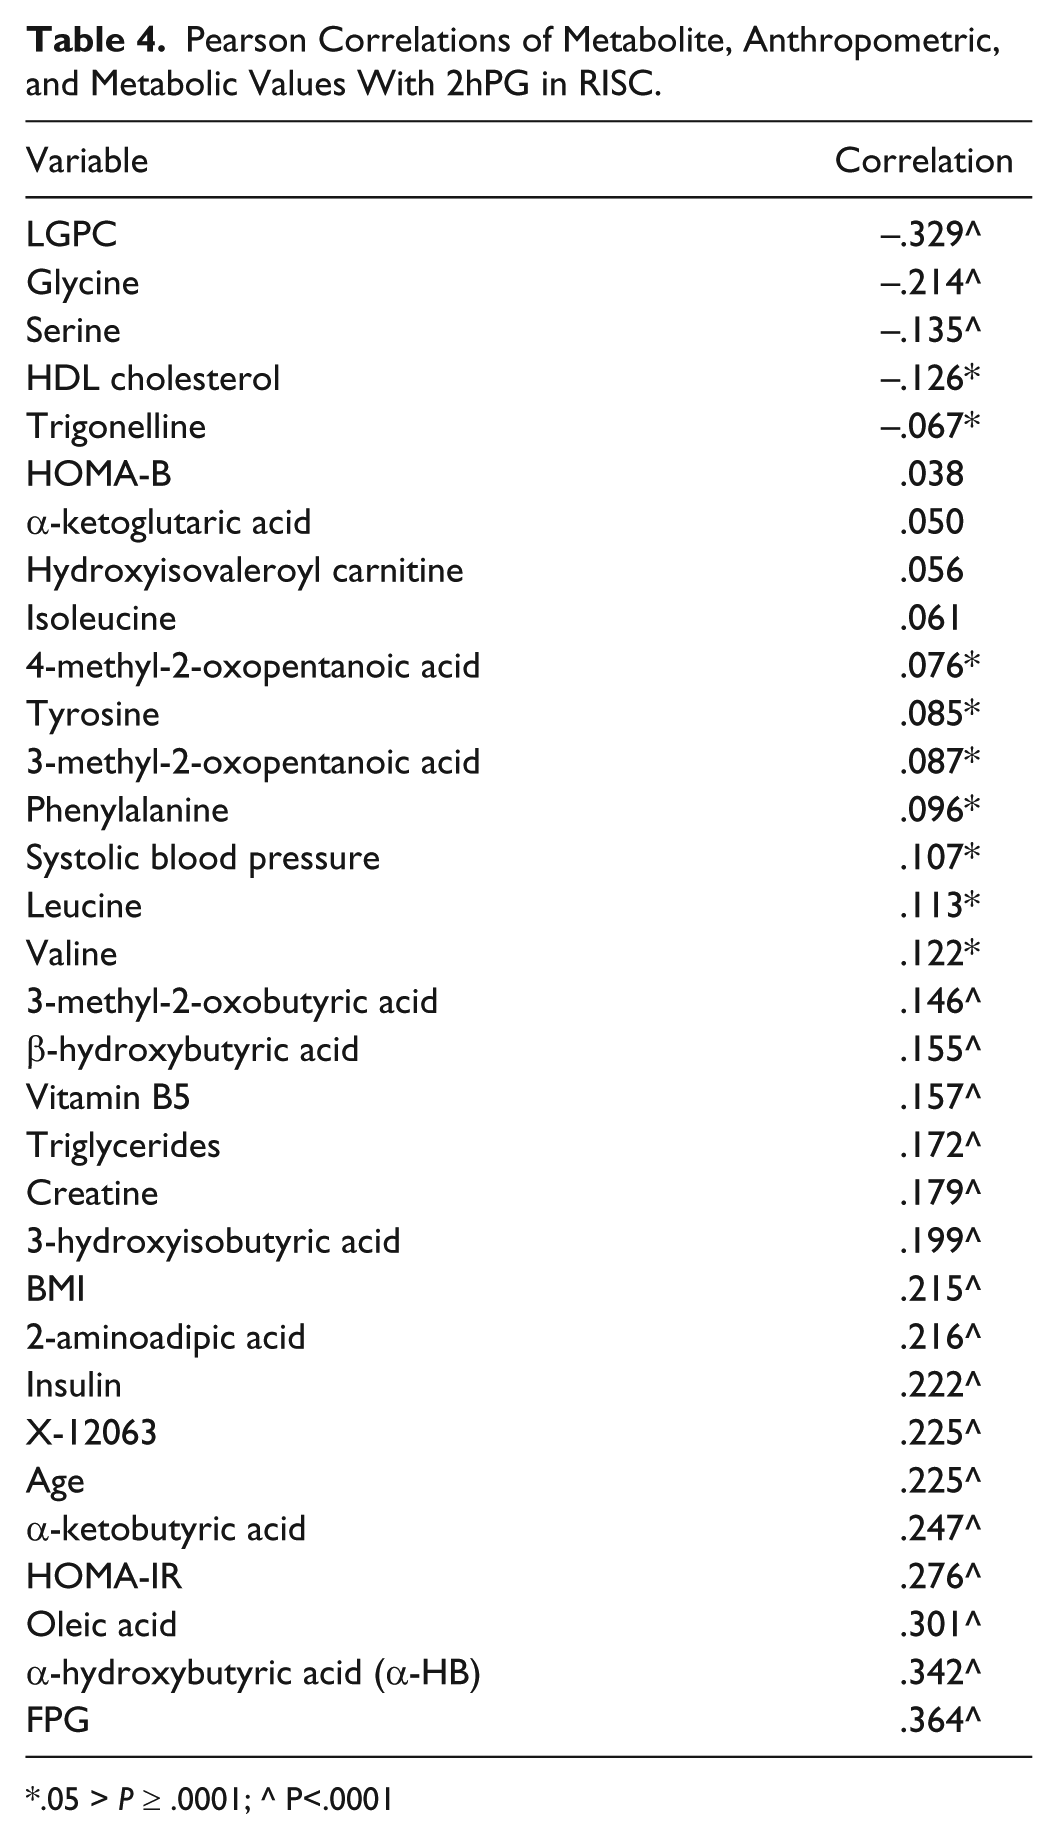
.05 > P ≥ .0001; ^ P<.0001
Algorithm Development
Multivariate logistic regression models were developed using anthropometric, metabolic, and metabolite parameters. In particular, models were focused around the top 3 metabolites identified in the random forest analyses and the Pearson correlations: α-HB, LGPC, and FPG. Forward selection models for predicting the odds of being IGT were generated in a representative subset of the RISC samples (“training set,” n = 636). The models were generated and optimized in an iterative manner in the training set for maximum AUC from the ROC curves for discriminating between NGT and IGT. The best models were then validated with the remaining RISC samples (“test set,” n = 319). The ensuing best model was then refitted to the entire RISC cohort and the resulting final algorithm validated with the DMVhi cohort.
Test Performance
In each case QIGT was compared to FPG for its ability to discriminate between IGT and NGT in a mixed NGT/IGT population (Table 5). In RISC, the AUC for FPG is 0.70 and the AUC for QIGT is 0.82 (P = 1.5 × 10⁻⁷ for FPG vs QIGT). In DMVhi, the AUCs are 0.77 and 0.83 (P = .01) respectively. In an additional comparison, a model consisting of only traditional biomarkers in RISC (age, sex, BMI, waist circumference, insulin, family history of diabetes, and FPG) has an AUC of 0.73 (P = 0.9E-6 vs the same model with FPG replaced by QIGT [AUC = 0.82]). Other measures of test performance are shown in Table 6. In the context of a prevalence of IGT of 12%, using a cutoff of the highest quintile of QIGT values in DMVhi, the sensitivity, specificity, PPV, and NPV for the test are 59%, 85%, 35%, and 94%, respectively. If the highest tertile of QIGT values is used instead, a greater number of IGT subjects are correctly classified, and the sensitivity, specificity, PPV, and NPV for the test are 78%, 72%, 28%, and 96%, respectively. These data in RISC are very similar. Finally, QIGT scores are not different by sex and AUCs in RISC and DMVhi are not significantly different by sex.
QIGT Performance: AUCs for Prediction of IGT in Mixed IGT/NGT Populations.
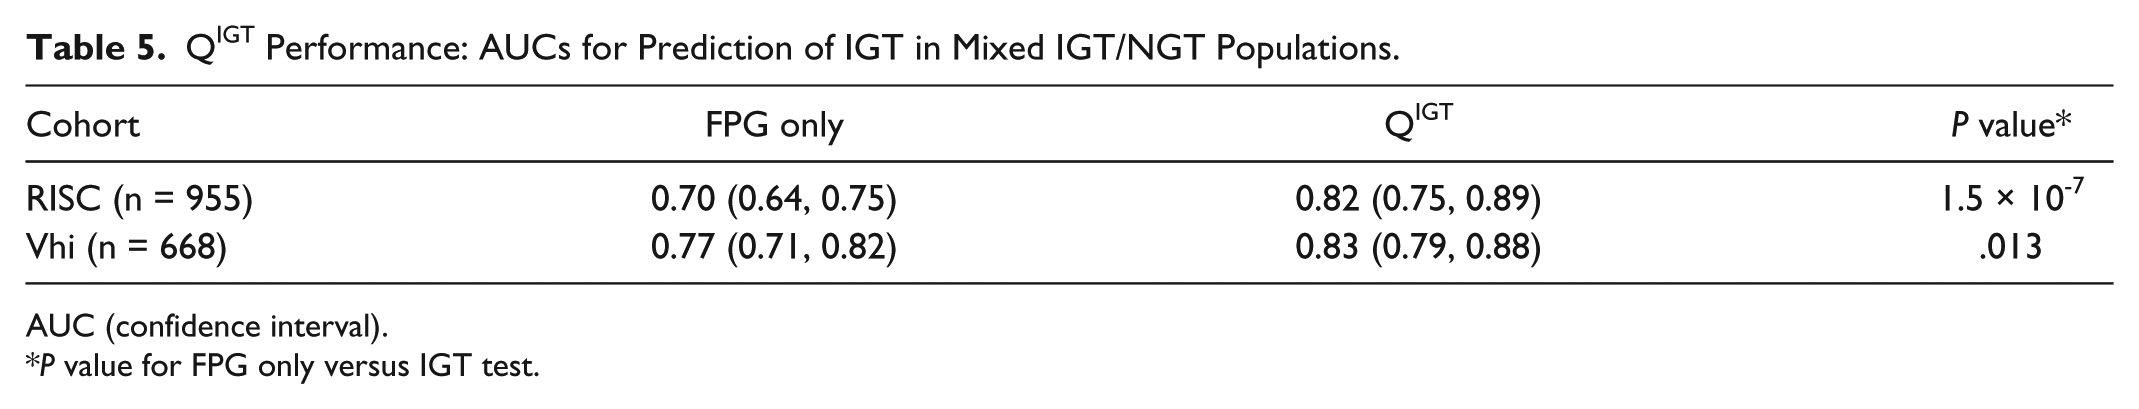
AUC (confidence interval).
P value for FPG only versus IGT test.
Additional Performance Criteria: Sensitivity, Specificity, PPV, NPV (%).

Discussion
IGT is a frequent condition. In 2011, an estimated 14.7% of US adults aged 20 years or older were IGT (27% of those aged 65 years or older), and its prevalence has been following a persistent upward trend. 29 Furthermore, IGT is at high risk of progressing to overt diabetes. 10 For example, in the Mexico City Diabetes study, IGT carried a relative risk of incident diabetes of 4.01 (as compared with NGT subjects), and a population-attributable risk of 29%. 30 Therefore, accurate identification and prediction of IGT in nondiabetic subjects would appear to be a valuable target for the ultimate prevention of type 2 diabetes. Although there are many models for predicting type 2 diabetes, there are only a limited number for predicting or identifying IGT outside of the OGTT and none have been commonly used as a substitute for it. In one simple model based on NHANES III data, an 8-point scale based on FPG, age, triglycerides or obesity, hypertension, and Mexican-American ethnicity was proposed. 31 In this instance, someone scoring above 5 is given the recommendation to undergo an OGTT. Thus, the algorithm is used to flag those most at risk for being IGT. In another study, components of the metabolic syndrome were used to detect IGT 32 in a number of cohorts including Mexico City Diabetes. In particular, impaired fasting glucose, waist circumference, and high triglycerides were found to be associated with IGT. On the other hand, another study 33 found that random plasma glucose values were better for screening for glucose intolerance than were the components of the metabolic syndrome. The Tehran lipid and glucose study 34 reported that risk factors for IGT included age, BMI, systolic blood pressure, and FPG. Finally, in a Turkish study 35 age, hypertension, triglycerides, waist circumference, BMI, and FPG were found to be associated with IGT. In general, the risk factors for IGT are essentially the same as those for type 2 diabetes. Reinforcing this concept, this study found that age, BMI, sex, FPG, fasting insulin, HOMA-IR, A1C, triglycerides, HDL cholesterol, systolic blood pressure, and a family history of diabetes are all associated with IGT although their relative value for identifying subjects with IGT does vary between the DMVhi and RISC cohorts. Of this group of parameters, FPG seems to be the most important predictor of IGT. A1C is also important 36 but the lack of A1C data in the RISC study did not allow for a complete evaluation of it here. HOMA-IR 37 and HOMA-B are less predictive than FPG and do not add additional predictivity in multivariate models containing FPG and insulin.
IGT is characterized by both insulin resistance and ß-cell dysfunction, a combination that impairs one’s ability to dispose of a glucose challenge. In the RISC cohort IGT subjects were substantially more insulin resistant than NGT subjects as measured by the euglycemic clamp. More importantly, within the context of the RISC study NGT subjects who progressed to IGT at the 3-year follow up showed increased insulin resistance at baseline relative to subjects who were NGT at both time points. 14 Thus, insulin resistance is a component of IGT and a risk factor for it. Consistent with this, several of the metabolites associated with IGT in this study have also been linked to insulin resistance as measured by the euglycemic clamp: α-HB, LGPC, oleic acid (and other fatty acids), α-ketobutyrate, glycine, and 3-methyl-2-oxobutyric acid. 24
Of importance in this study, is the finding that there are metabolites that rival FPG in their ability to predict IGT, specifically, α-HB and LGPC. Moreover, there are a number of metabolites that are complementary with and additive to FPG when utilized in multivariate models for the prediction of IGT as exemplified by the novel all metabolite IGT test reported here. In general, our findings from multiple metabolomics studies is that most of the changes in fasting metabolite profiles seen in type 2 diabetes are already present and to a similar degree in IGT. These include increases in most free fatty acids including oleic acid, branched-chain amino acids and their catabolites, tyrosine, phenylalanine, α-HB, α-ketobutyric acid, and 2-aminoadipic acid, and decreases in LGPC, glycine, and serine. Clearly multiple biochemical pathways not involved directly in glucose metabolism are perturbed in type 2 diabetes 38 and IGT, and our data suggest metabolites from these pathways are biomarkers of these changes and can be utilized in models predicting IGT. The IGT test reported here includes a diverse set of metabolites representing a diverse set of biochemical pathways: a ketone body, a fatty acid, a branched-chain amino acid catabolite, an essential vitamin, an amino acid, a lysophosphocholine, and a shunt metabolite from α-ketobutyric acid (α-HB). These metabolites are providing information on the body’s ability to dispose of a glucose load like that seen in an OGTT from multiple perspectives beyond that of purely glycemic parameters.
IGT could conceivably be predicted in the future, or even be redefined, by alternative means, including metabolite profiles, proxies of insulin resistance, and/or ß-cell dysfunction.
Conclusions
The Quantose IGT test score is shown to be a discriminant marker of IGT in a total of 1623 nondiabetic subjects from 2 different cohorts. It requires only a single fasted blood draw and is more convenient than an OGTT. It may serve as a surrogate for the OGTT or as a means of identifying subjects likely to be IGT and to provide a rationale for using the OGTT in a more selective manner in those patients most at risk.
Footnotes
Abbreviations
α-HB, α-hydroxybutyric acid; AUC, area under the receiver operating characteristic curve; β-HB, β-hydroxybutyric acid; BMI, body mass index; DMVhi, Diabetes Mellitus and Vascular Health Initiative; 4-MOP, 4-methyl-2-oxopentanoic acid; HOMA-B, homeostasis model assessment: β-cell function; HOMA-IR, homeostasis model assessment: insulin resistance; IFG, impaired fasting glucose; IGT, impaired glucose tolerance; IR, insulin resistance; LGPC, linoleoylglycerophosphocholine; NGT, normal glucose tolerance; NPV, negative predictive value; OGTT, oral glucose tolerance test; PPV, positive predictive value; QIGT, risk of IGT score from the all metabolite IGT test; RISC Study, Relationship between Insulin Sensitivity and Cardiovascular Disease Study; Ser, serine; T2D, type 2 diabetes.
Declaration of Conflicting Interests
The author(s) declared the following potential conflicts of interest with respect to the research, authorship, and/or publication of this article: JC, AE, RP, JW, MM, K-PA, RW, EB, KL, and RE are full-time employees of Metabolon Inc. BC and MS are full-time employees of Vhi Healthcare. EF: advisory panel: AstraZeneca LP, Bristol-Myers Squibb Company, Boehringer Ingelheim Pharmaceuticals, Inc, Sanofi-Aventis, Johnson & Johnson, GlaxoSmithKline, Novartis Pharmaceuticals Corporation, Merck Sharp & Dohme Limited, Astellas; research support: Boehringer Ingelheim. Pharmaceuticals, Inc, Amylin Pharmaceuticals, Inc, Eli Lilly and Company, Merck Sharp & Dohme Limited.
Funding
The author(s) disclosed receipt of the following financial support for the research, authorship, and/or publication of this article: This work was funded by Metabolon Inc and DEXLIFE (EU FP7 programme, grant agreement 279228).