
Abstract
Background:
It is hypothesized that early detection of reduced insulin sensitivity (SI) could prompt intervention that may reduce the considerable financial strain type 2 diabetes mellitus (T2DM) places on global health care. Reduction of the cost of already inexpensive SI metrics such as the Matsuda and HOMA indexes would enable more widespread, economically feasible use of these metrics for screening. The goal of this research was to determine a means of reducing the number of insulin samples and therefore the cost required to provide an accurate Matsuda Index value.
Method:
The Dynamic Insulin Sensitivity and Secretion Test (DISST) model was used with the glucose and basal insulin measurements from an Oral Glucose Tolerance Test (OGTT) to predict patient insulin responses. The insulin response to the OGTT was determined via population based regression analysis that incorporated the 60-minute glucose and basal insulin values.
Results:
The proposed method derived accurate and precise Matsuda Indices as compared to the fully sampled Matsuda (R = .95) using only the basal assay insulin-level data and 4 glucose measurements. Using a model employing the basal insulin also allows for determination of the 1-day HOMA value.
Conclusion:
The DISST model was successfully modified to allow for the accurate prediction an individual’s insulin response to the OGTT. In turn, this enabled highly accurate and precise estimation of a Matsuda Index using only the glucose and basal insulin assays. As insulin assays account for the majority of the cost of the Matsuda Index, this model offers a significant reduction in assay cost.
Type 2 diabetes mellitus (T2DM) has been declared an epidemic by the World Health Organization. 1 Treatment of T2DM individuals places considerable economic strain on health care systems worldwide.2-4 However, it is hypothesized that early detection of T2DM can prompt intervention to delay the onset of symptoms,5,6 and thus potentially reduce costs and improve quality of life.
Insulin sensitivity (SI) is widely regarded as one of the better measures of the progression of an individual from normal glucose tolerance (NGT) to T2DM.7-9 However, accurate determination of SI usually requires tests that are relatively clinically intense and expensive. 10 The “gold standard” test used to determine SI is the hyper-insulinemic euglycemic clamp test (EIC), which typically takes place over 2.5 to 4 hours, and requires a large number of blood samples (at least 20) to be drawn. 11 Hence other diagnostic tests are recommended in clinical practice. 12 One such test is the 2-hour Oral Glucose Tolerance Test (OGTT), which typically assesses glucose levels 2 hours after ingestion of a glucose drink. If the 2-hour glucose is in excess of 200 mg/dl a preliminary diagnoses of Type 2 Diabetes can be made. 12 However, due to the lack of an SI measurement, this process can only diagnose someone who already has T2DM, or, at lower glycemic thresholds, someone who is already displaying impaired glucose tolerance. Thus, it is not able to estimate increased risk and could not effectively prompt early preventative measures. Means do exist to approximate SI based on OGTT data. The Matsuda Index requires 4 blood samples at t = 0, 30, 60, and 120 to be taken and assayed for both glucose and insulin. 13 As such, it is far more expensive and clinically intensive than the HOMA or 2-hour OGTT tests. The Matsuda Index typically shows good correlations with the EIC ISI of between 0.57 and 0.78.13-16
The Matsuda Index is popular because it provides a good measure of SI that can be determined via an unaltered OGTT, one of the most commonly performed diabetological tests. 13 This contrasts with the typical HOMA test that requires samples on 3 separate days. 17 Furthermore, the Matsuda Index’s use of glucose and insulin samples over the course of the OGTT allows it to capture some of the dynamic response of the body to a glucose bolus, while the HOMA relies solely on the basal state of the body. At the same time, the Matsuda Index does not require the more clinically intense and specialized tests that other SI metrics such as the EIC rely on. 9
The goal of this research was to determine a means of reducing the number of insulin samples, and thus the cost, required to provide an accurate Matsuda Index value. Prediction of the 30-, 60-, and 120-minute insulin assays based off the basal insulin assay would provide the 2-hour glucose Matsuda and HOMA indexes (single-sample) 17 for an overall 75% reduction in cost. Such a model would allow an extremely inexpensive provision of both indexes, and, as such, a higher resolution approximation of an individual’s SI than could typically be provided by a single insulin assay.
Methods
Patients and Ethics
The data used in this analysis were originally obtained for the validation investigation of the Dynamic Insulin Sensitivity and Secretion Test (DISST). 18 The cohort was selected from volunteers in the Christchurch region of New Zealand. Each participant signed informed consent before participating in the study. Ethics approval for this study and use of the data was granted by the Upper South Island Regional Ethics Committee B.
The cohort of 50 people was broken into 6 predefined subgroups. These were 5 lean males and 5 lean females (BMI < 25), 10 overweight males and 10 overweight females (25 < BMI < 30), and 10 obese males and 10 obese females (30 < BMI). An age range of 18 to 70 years of age was permitted. Participants with a diagnosed major illness or disease were excluded. The cohort had a median age of 40 (IQR 19.5), and median BMI of 28.6 (IQR 2.64). Further information pertaining to the cohort can be found in McAuley et al. 18
OGTT Protocol, Assay Techniques, and Standard Indices of SI
The OGTT was performed in the morning after the participant had fasted overnight. The participant was sat in a relaxed position for the duration of the test. Blood samples were taken via a cannula in the antecubital fossa at t = 30, 60, and 120 minutes. The fasting t = 0 sample was followed by the consumption of a 250 mL glucose drink containing 75 g of glucose. The blood samples were assayed for glucose immediately, and then spun and frozen for future insulin assays. Analysis of the glucose assays was conducted using YSI 2300 stat plus Glucose and L-Lactate analyzer (Yellow Springs Instruments, Yellow Springs, OH) using whole blood. Insulin measurement was undertaken by the Endolab, Canterbury Health Laboratories using Roche Elecsys® after Peg precipitation of immunoglobulins (Roche Diagnostics, Mannheim, Germany).
It is worth noting the participants also underwent the DISST and EIC tests within the same week. Details of these protocols are provided in McAuley et al. 18
The Matsuda Index
The Matsuda Index (ISIMAT) is a method of determining SI from OGTT data, and is defined as 13
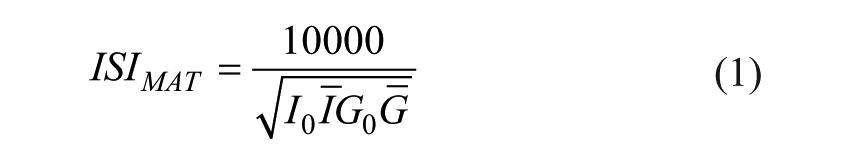
where
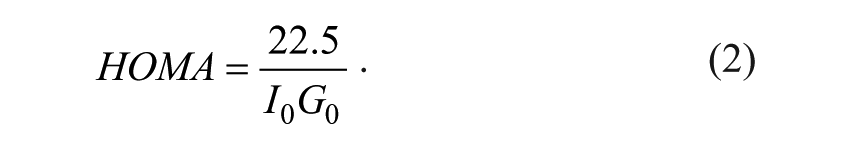
The HOMA Index
The HOMA1 index for SI is defined as 19
DISST Model
The clinically validated DISST model provides a comprehensive model capable of capturing glucose and insulin dynamics.20,21 While the complete DISST model incorporates the behavior of glucose, insulin and C-peptide, only insulin pharmacokinetics model was utilized in this study.
The DISST insulin equations rely on a number of parameters defined a priori from anatomical characteristics.20-22 The pharmacokinetic (PK) model of insulin consists of both interstitial and plasma compartments,
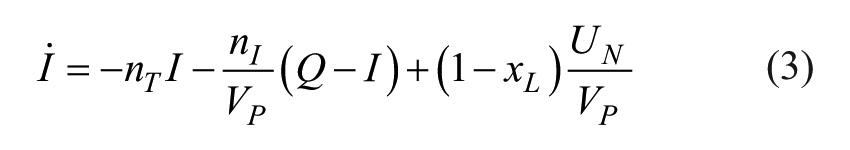
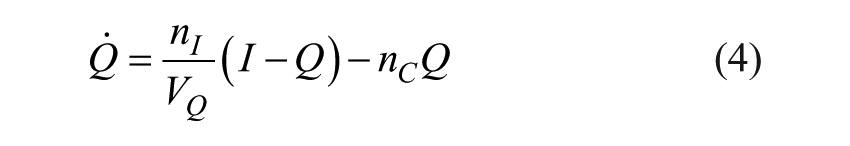
where I is the plasma insulin concentration (mU/L); Q is the interstitial insulin concentration (mU/L); nT is the plasma clearance rate (1/min); VP is the volume of distribution of insulin in the plasma compartment (L); nI is the rate at which transfer between the plasma and interstitial compartments occurs (L/min); xL is the proportional first pass hepatic extraction of endogenously produced insulin; VQ is the volume of distribution of insulin in the interstitial compartment (L); UN is a function describing the pancreatic insulin secretion rate (mU/min) and nC is the rate at which insulin is cleared from the interstitium into the cells (1/min).
Model and Insulin Prediction
The goal of this project was to use forward simulation via the DISST model to predict insulin levels at 30, 60, and 120 minutes. These predictions could then be used to determine the value of
It has been previously determined that there is a relationship between plasma insulin clearance rates and SI from the DISST. 23 Though a posteriori identification of SI was successful for dynamic IV tests, estimating SI a posteriori from OGTT results was ineffective. Thus, a relationship, shown in Figure 1, was found between the 60-minute glucose measurement from the OGTT and the full DISST SI value as a way to estimate nT.
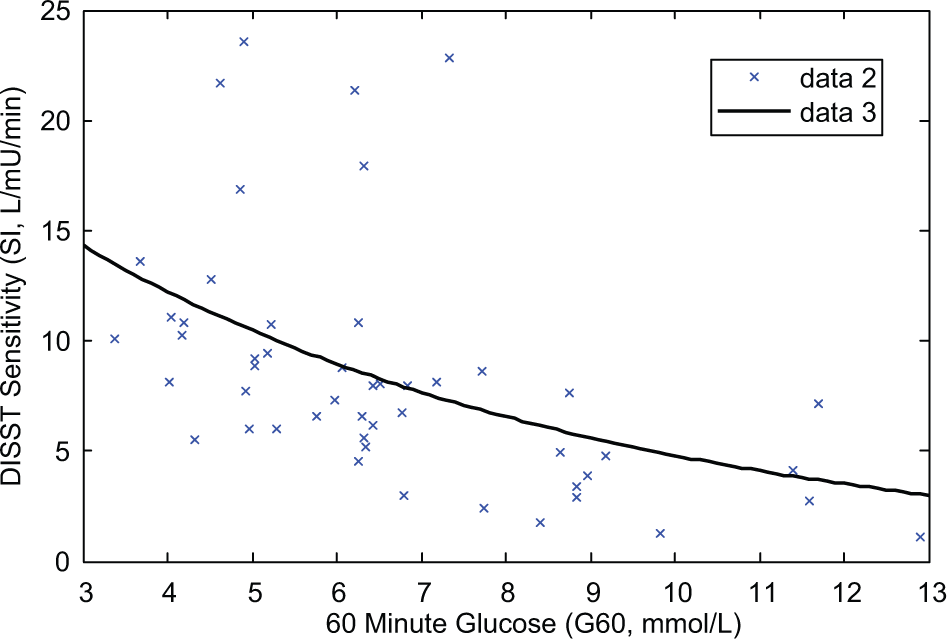
Correlation between DISST sensitivity (SI) and 60-minute glucose (G60).
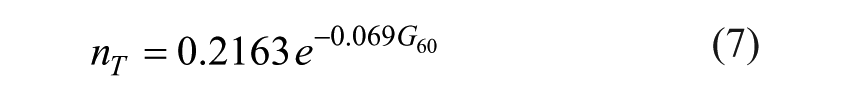
As such, the 60-minute glucose sample (G60) was used to predict SI using the relation:

This was in turn used to predict nT using the relation defined by Docherty et al: 23
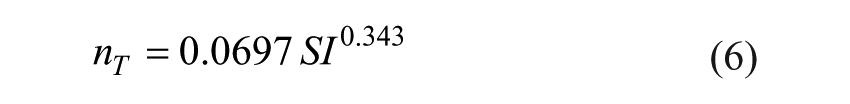
Giving an overall relation between SI and nT defined:
A generic piecewise function was defined for the endogenous insulin reaction (UN) to the OGTT stimulus,

where UB is the basal insulin secretion rate (active from t = 0 to t = 10 minutes), which is defined such that system equilibrium is maintained; U1 is the first phase insulin secretion response (active from t = 10 to t = 30 minutes); U2 is the second phase insulin secretion response (active from t = 30 to t = 60 minutes); and U3 is the third phase insulin secretion response (active from t = 60 to t = 120 minutes).
First, UB was defined such that
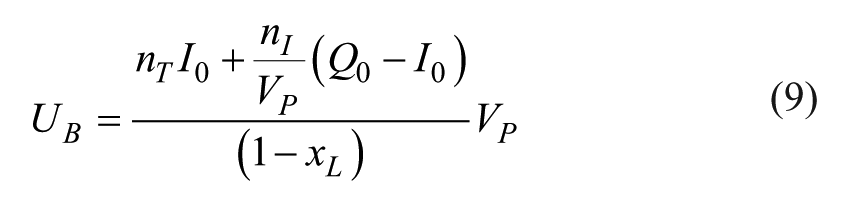
where Q0 was assumed to be equal to
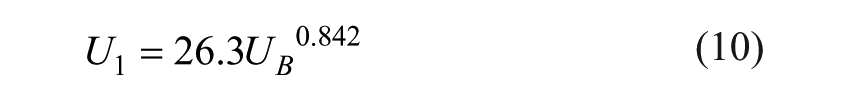
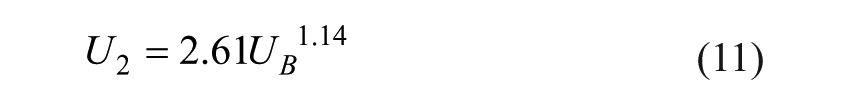
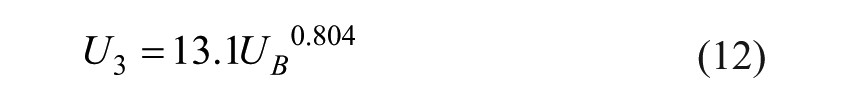
Initially, values for U1-3 were defined for each patient based on the full set of insulin and glucose assays using an integral based identification method.25,26 This allowed relationships to be derived between UB and all of the other UN metrics. As UB could be found analytically from the single insulin sample being taken (I0), U1-3 were each correlated with UB as shown in Figure 2, with corresponding equations:
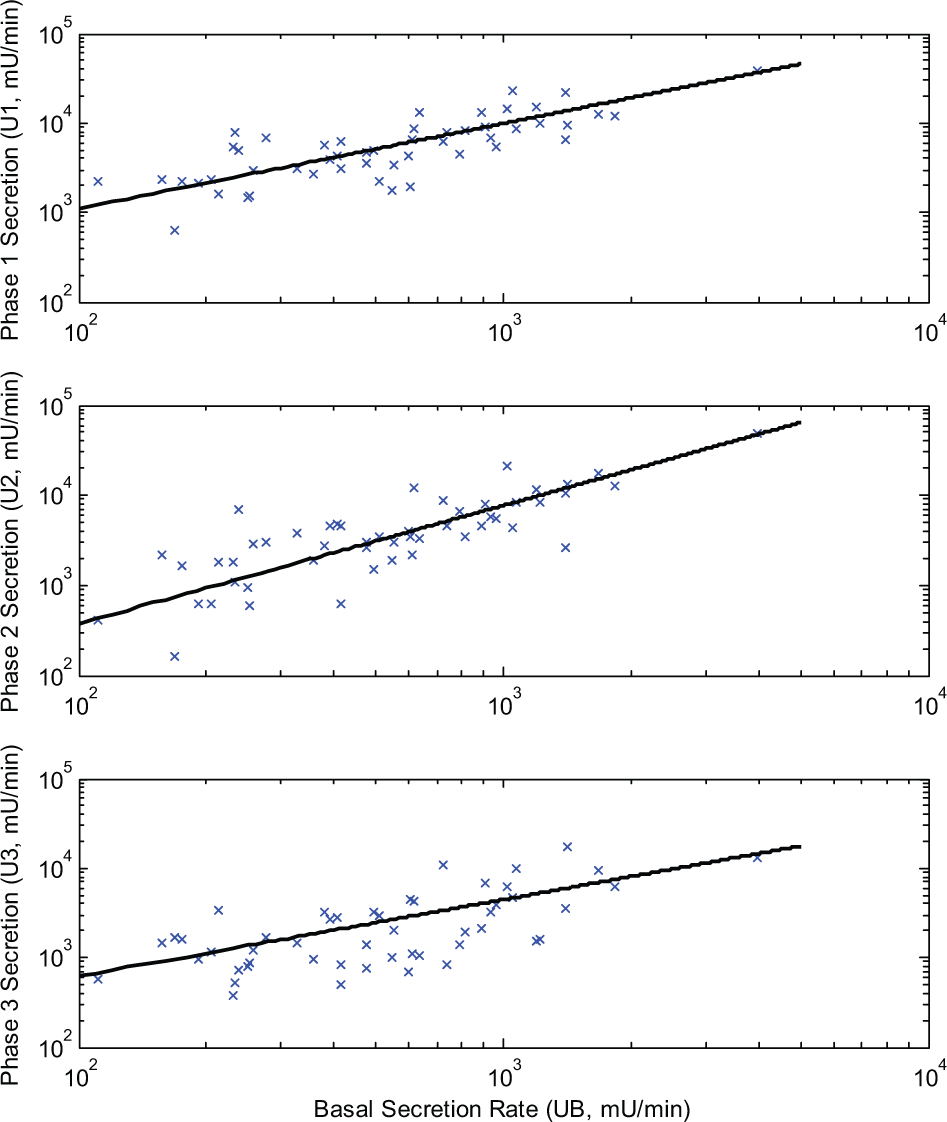
Correlation between UB and U1-3.
The correlations between UB and U1-3 were R = .78, .80, and .66 (P < .0001 in all cases), respectively. These relationships allow relatively good estimation of the 2-hour UN stepwise profile using Equation 6. The I profile, nT estimation and a priori information20,22 is sufficient to forward simulate the patients insulin response to the OGTT protocol. Forward simulation was performed using the Runge-Kutta 4-5 (RK4) process in MATLAB™ (ode45.m). The simulated plasma insulin profile uses “samples” at t = 30, 60, and 120 minutes to allow determination of the Matsuda Index (Equation 3).
This process was performed as follows:
Estimate nT from G60
Identify UB from nT a priori
Estimate U1-3 from UB and Equations 10-12
Forward simulate I and Q, and then “sample” I30, I60, and I120
Determine the Matsuda Index (Equation 3)
Evaluation Methods
The proposed, low-cost Matsuda approach was compared to the original Matsuda and the gold-standard EIC via Pearson correlation coefficients (n = 50). All SI values were transformed prior to correlation to ensure that proportion differences in resistant individuals had the same weighting as the proportional differences of sensitive individuals. Bland-Altman plots between the original and proposed Matsuda Indexes were generated to determine any potential for introduced bias.
Furthermore, to address the issue of designing and validating an approach on the same set of data, a Monte Carlo analysis was conducted. This analysis involved splitting the data into 2 sets: a set consisting of 1 individual from each of the 6 anatomical categories and a set consisting of the remaining 44 individuals. The equations and correlations were then generated using the data from the set of 44 individuals, and used to predict the Matsuda Index values for the set of 6 individuals. This process was repeated 250 times.
Results
There was a strong linear correlation between the average of the 30-, 60-, and 120-minute insulin assay values from the actual OGTT, and those predicted (R = .87, P < .0001). The distribution of sample specific model percentage errors for each insulin assay are shown in Figure 3. Note the large outlier errors in samples 2 and 3 are likely due to individuals with low glucose uptake rates, which results in small actual insulin assay levels and the model overestimating the insulin response. This leads to a large percentage error but relatively smaller absolute error (due to the low actual insulin assay values).
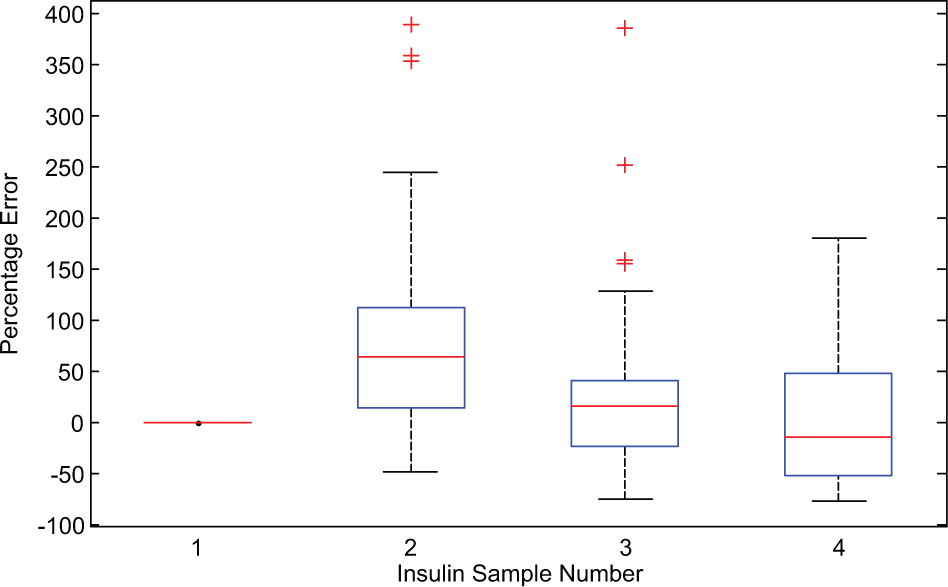
Sample specific model percentage error for insulin assays.
Figure 4 shows an even stronger correlation between the Matsuda Index values provided by the simulation and the clinically assessed Matsuda Index values determined by taking 4 insulin assays during the OGTT (R = .95, P < .0001). The accuracy of the simulated Matsuda Index values varied somewhat, with a median absolute error of 16.5%, minimum of 0.07 % and maximum of 41.9 % as seen in the Bland-Altman Plot of Figure 5.
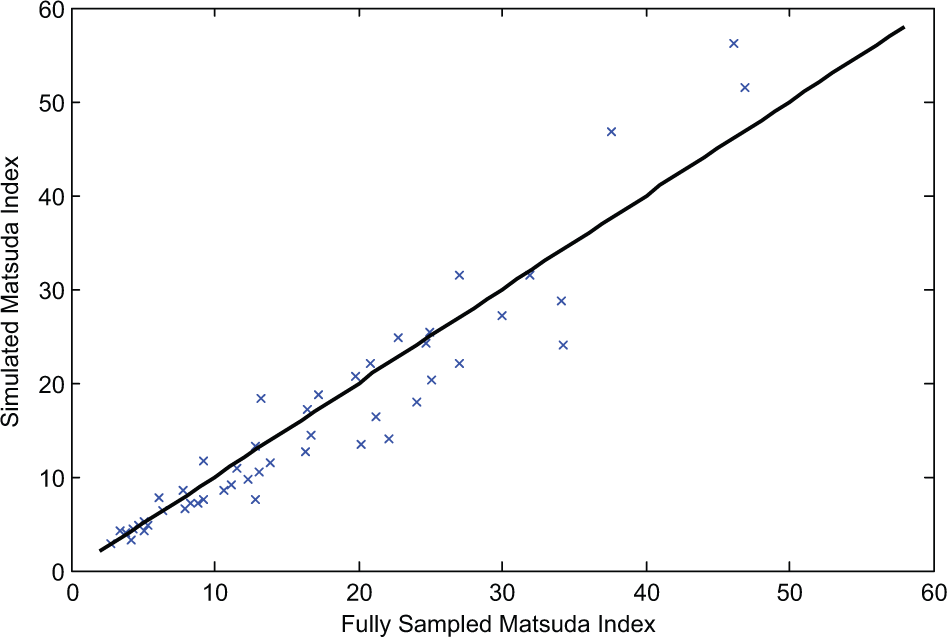
Correlation between simulated and actual Matsuda Index values.
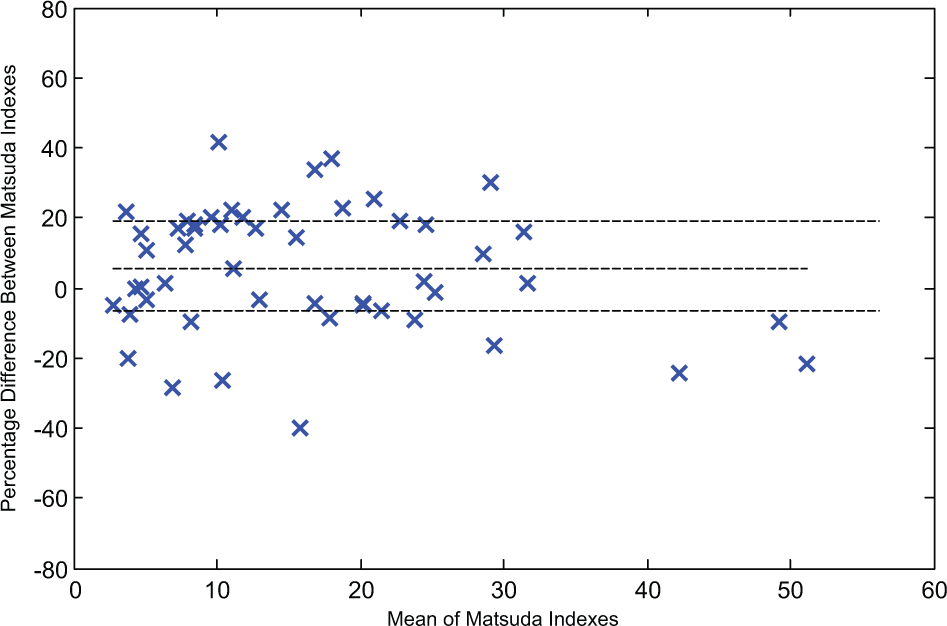
Bland-Altman plot for actual and simulated Matsuda Index values.
The Bland-Altman plot shows a low bias to the model of 5.37% (IQR –6.3% to 18.9%). It is also worth noting that 75% of the simulated indexes had errors of less than ±21.5%. The actual Matsuda Index values showed a logarithmic correlation of 0.82 with the EIC ISI values, 27 while the simulated Matsuda Index values showed a logarithmic correlation of 0.76 with the same EIC ISI values.
The Monte Carlo analysis showed a median linear correlation between the 2 Matsuda Indexes of 0.97, with a lower quartile of 0.94 and upper quartile of 0.98. This analysis was performed a total of 250 times.
Discussion
The very high correlation of R = .95 between the simulated Matsuda and fully sampled Matsuda Indexes shows the model provided an accurate estimate of the Matsuda Index with only a single insulin assay. Furthermore, the SI indices of the novel approach had limited bias with respect the Matsuda Index derived via the fully sampled OGTT. This is further reinforced by the high Monte Carlo correlations (median 0.97) that result when the approach equations are generated from 1 set of individuals and then used to simulate the insulin response of a different set.
While the error in the sample specific model percentage error for insulin assays was large for certain samples, these large outlier errors are likely tied to individuals with abnormally low glucose uptake rates. This means the large percentage error corresponds to a relatively smaller absolute error due to the small actual assay values, and thus relatively smaller absolute error in the calculated Matsuda Index. As such the high correlations (R = .95) between the simulated and fully sampled Matsuda Index occur.
This approach provides a relatively accurate estimate of the value of the Matsuda Index using only a basal insulin measurement and 4 glucose measurements. This insulin measurement is the same required to provide the 1-day HOMA index. 17 As such, it allows both the Matsuda and HOMA indices to be evaluated for the cost of the HOMA Index. The correlation for this model-based Matsuda is higher than for the HOMA and similar to the fully sampled, clinical Matsuda.
The DISST model used in this approach has been clinically validated in the DISST and DISTq protocols.14,18,20,21 The integral method used to determine the value of the 3 insulin secretion rates U1-3 has similarly been widely employed.14,23,26,28 The evaluation methods used have seen widespread use, and are widely accepted means of validation.
However, there were limitations to the approach employed that must be considered. First, the OGTT data used to calculate the simulated and fully sampled Matsuda Index values were from the same test. OGTT results show only moderate repeatability,29,30 meaning correlation between a fully sampled Matsuda Index calculated from an OGTT on a given day and a simulated Matsuda Index calculated from an OGTT on a subsequent day would most likely be lower than that the correlation found in this report. However, it is important to note here that the focus was to investigate the ability of this approach to approximate the insulin assays used in a Matsuda Index. While OGTT results vary day to day, inclusion of such variation would dilute the ability to establish exactly what error contributions arose from the variability in OGTT results compared to model error, thus diluting the ability to clearly asses the capabilities of the approach. Another limitation is the fact that this approach to estimating the Matsuda Index is model based, meaning the index is no longer a simple metric that can be calculated from the raw data by hand. However, the code employed is efficient and could be provided to clinicians in an easily usable format.
This approach also allows estimation of the 1-day HOMA index, as opposed to the preferred 3-day HOMA index. 17 The drawing of 3 blood samples on subsequent days provides an increase in HOMA accuracy relative to the 1-day index, but places a significant burden on the patient. Finally, there were no individuals previously diagnosed with diabetes in the cohort, 18 though a preliminary diagnosis of one was made during the tests performed. This means that a portion of the population, with a distinct response to the tests performed was not represented in the cohort. However low-cost SI tests are often used for studies on the pathogenesis of T2DM and the metabolic syndrome, and thus they are of diminished value for individuals with diagnosed T2DM.
The overall approach is capable of meeting all of the initial goals set out. It provides the results of the Matsuda and HOMA indexes for a cost of only approximately NZ$25 with a high accuracy (R = .95). Individually these tests cost approximately NZ$100 and NZ$25, respectively. As this approach uses the standard OGTT protocol, it can be easily implemented by anyone capable of performing the blood tests. As such, it provides benefits by estimating the insulinemic response to the protocol rather than measuring the 30-, 60-, and 120-minute insulin levels.
Conclusion
The insulin response to the OGTT protocol predicted by the DISST model was successfully modified to allow for the accurate prediction of the 30-, 60-, and 120-minute insulin levels. In turn, this enabled a highly accurate (R = .95) estimation of a Matsuda Index using only the basal insulin assay. As a result, this approach reduces the costs associated with determining the Matsuda Index by 75% and allows both the HOMA and Matsuda Indexes to be provided while taking only 1 insulin measurement.
Footnotes
Abbreviations
DISST, Dynamic Insulin Sensitivity and Secretion Test; EIC, hyper-insulinemic euglycemic clamp test; NGT, normal glucose tolerance; OGTT, Oral Glucose Tolerance Test; SI, insulin sensitivity; T2DM, type 2 diabetes mellitus.
Declaration of Conflicting Interests
The author(s) declared no potential conflicts of interest with respect to the research, authorship, and/or publication of this article.
Funding
The author(s) disclosed receipt of the following financial support for the research, authorship, and/or publication of this article: University of Canterbury.