
Abstract
Background:
Insulin resistance (IR) can precede the dysglycemic states of prediabetes and type 2 diabetes mellitus (T2DM) by a number of years and is an early marker of risk for metabolic and cardiovascular disease. There is an unmet need for a simple method to measure IR that can be used for routine screening, prospective study, risk assessment, and therapeutic monitoring. We have reported several metabolites whose fasting plasma levels correlated with insulin sensitivity. These metabolites were used in the development of a novel test for IR and prediabetes.
Methods:
Data from the Relationship between Insulin Sensitivity and Cardiovascular Disease Study were used in an iterative process of algorithm development to define the best combination of metabolites for predicting the M value derived from the hyperinsulinemic euglycemic clamp, the gold standard measure of IR. Subjects were divided into a training set and a test set for algorithm development and validation. The resulting calculated M score, MQ, was utilized to predict IR and the risk of progressing from normal glucose tolerance to impaired glucose tolerance (IGT) over a 3 year period.
Results:
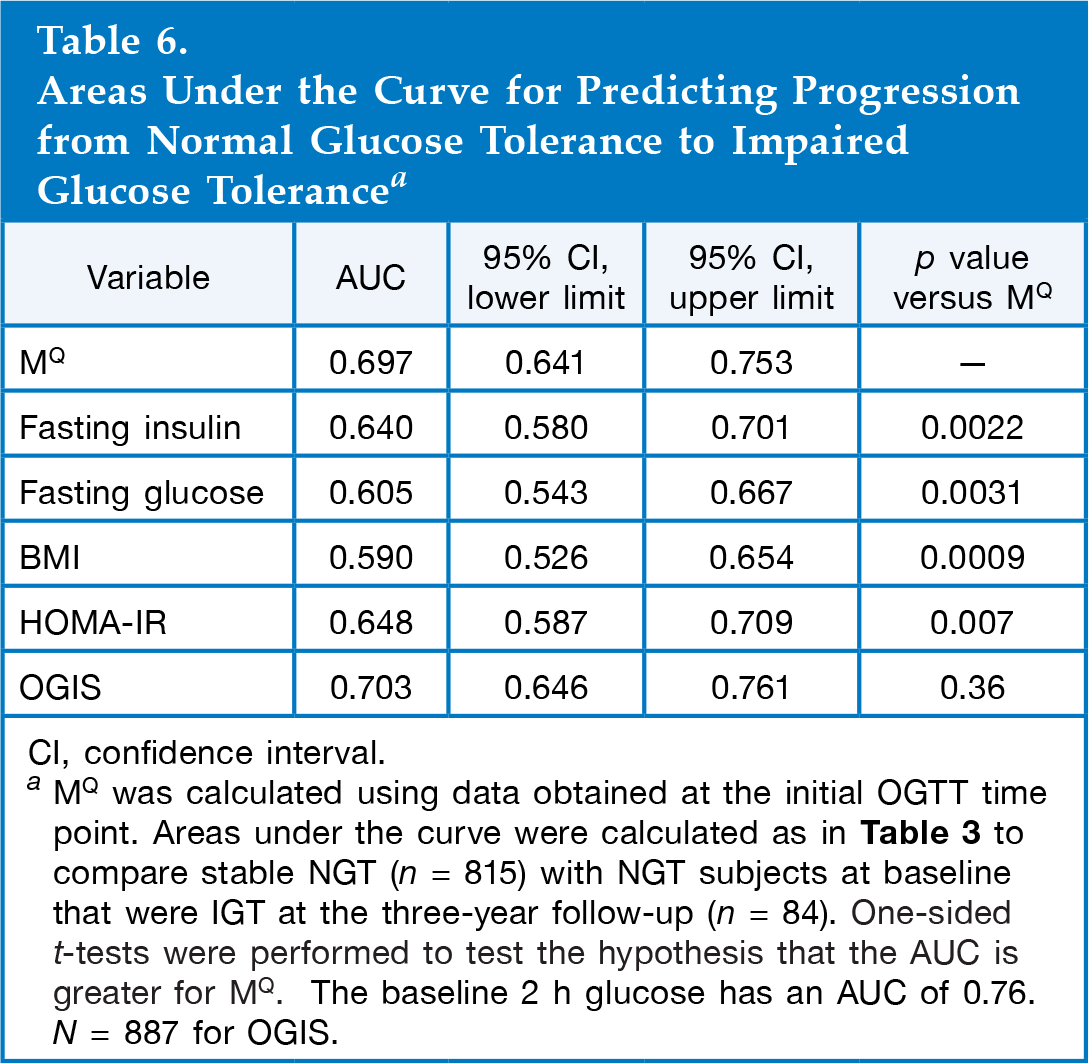
MQ correlated with actual M values, with an r value of 0.66. In addition, the test detects IR and predicts 3 year IGT progression with areas under the curve of 0.79 and 0.70, respectively, outperforming other simple measures such as fasting insulin, fasting glucose, homeostatic model assessment of IR, or body mass index.
Conclusions:
The result, Quantose™, is a simple test for IR based on a single fasting blood sample and may have value as an early indicator of risk for the development of prediabetes and T2DM.
Introduction
Insulin resistance (IR) is an early and important factor in the development of type 2 diabetes mellitus (T2DM) and may be present for years before the emergence of any changes in glycemic control.1–3 A practical measure of IR would be valuable for early identification of individuals at risk for T2DM and cardiovascular disease in the general population and as a tool for monitoring progress in intervention strategies to prevent or delay these diseases. The gold standard measure of insulin sensitivity is the hyperinsulinemic euglycemic clamp. 4 The clamp has been used to demonstrate the range of insulin sensitivities within a population, and IR has generally been defined as the lower end of this distribution (e.g., bottom tertile). 5 The clamp is an important research tool but is not practical for routine assessment of insulin sensitivity. A simple surrogate for insulin sensitivity in nondiabetics is the fasting insulin level, but this measure loses value in the context of β-cell decompensation as T2DM progresses and does not capture the level of insulinemia needed to dispose of a glucose load.6,7 Obesity is closely linked to IR, with body mass index (BMI) and waist circumference being good predictors of IR. 8
A number of models have been proposed and utilized as simplified measures of insulin sensitivity. 9 Several steady-state (fasting) models based only on insulin and glucose levels have been generated, including the homeostatic model assessment of insulin resistance (HOMA-IR),10,11 quantitative insulin sensitivity check index (QUICKI), 12 and fasting insulin resistance index. 13 Related models use fasting insulin plus various lipids measures, such as free fatty acids (revised QUICKI), 14 triglycerides (McAuley index), 15 or high-density lipoprotein/total cholesterol and free fatty acids. 16 These models are simple, requiring only a single blood sample, but it is not clear that they offer advantages over fasting insulin alone. Other models are based on the oral glucose tolerance test (OGTT) and use various combinations of glucose and insulin values from the fasting state and during the OGTT, including the Matsuda index, 17 the Stumvoll index, 18 and oral glucose insulin sensitivity (OGIS). 19 More complex methods include the insulin tolerance test and the frequently sampled intravenous glucose tolerance test. 20 These latter methods all require multiple blood samples, are complicated, and, like the clamp, are not practical for routine screening purposes. Therefore, there remains a need for a simple IR test for routine screening, prospective studies, risk assessment, and therapeutic monitoring.21,22
We reported a nontargeted metabolomics study using fasting plasma samples obtained from a healthy, nondiabetic population [Relationship between Insulin Sensitivity and Cardiovascular Disease (RISC) Study], searching for novel biomarkers of insulin sensitivity. 23 A number of small molecule metabolites were identified that correlated with the M values derived from the hyperinsulinemic euglycemic clamp. This work details subsequent efforts to utilize these findings to create a model for predicting the clamp M value using only data derived from a single fasting blood sample. The development, testing, validation, and utility of the Quantose™ IR diagnostic are reported herein.
Methods
Clinical Study Design
The RISC Study subjects were utilized to generate and validate the diagnostic test. The methodology and objectives of this study and the 3 year follow-up data have been published.24,25 In brief, RISC is a prospective, observational, cohort study in clinically healthy people between the ages of 30 and 60 years recruited from 13 European countries. An OGTT was performed at the initial examination followed by a hyperinsulinemic euglycemic clamp within 1 week. A second OGTT was performed at a 3 year follow-up examination. Fasted blood samples were obtained at each examination.
Local ethics committee approval was obtained at each recruiting center. Subjects were given a written and an oral explanation of the study, and all provided informed consent.
Hyperinsulinemic Euglycemic Clamp
Insulin was infused at a rate of 240 pmol/min−1/m−2 along with a simultaneous 20% dextrose infusion, whose rate was adjusted every 5–10 min to maintain plasma glucose within ±15% of the targeted range of 81–99 mg/dl. Insulin-mediated whole body glucose disposal was reported as the value Mwbm (mg/kg−1/min−1, whole body mass) derived from the mean of the glucose infusion rate over the final 40 min of the 2 h clamp. The values for Mwbm ranged from 0.89 to 23.86 mg/kg−1/min−1. The RISC cohort was divided into tertiles based on Mwbm, and the members of the lowest tertile, T1, were defined as being insulin resistant
Relationship between Insulin Sensitivity and Cardiovascular Disease Study: Baseline Anthropometric and Metabolic Parameters by Mwbm Tertile a
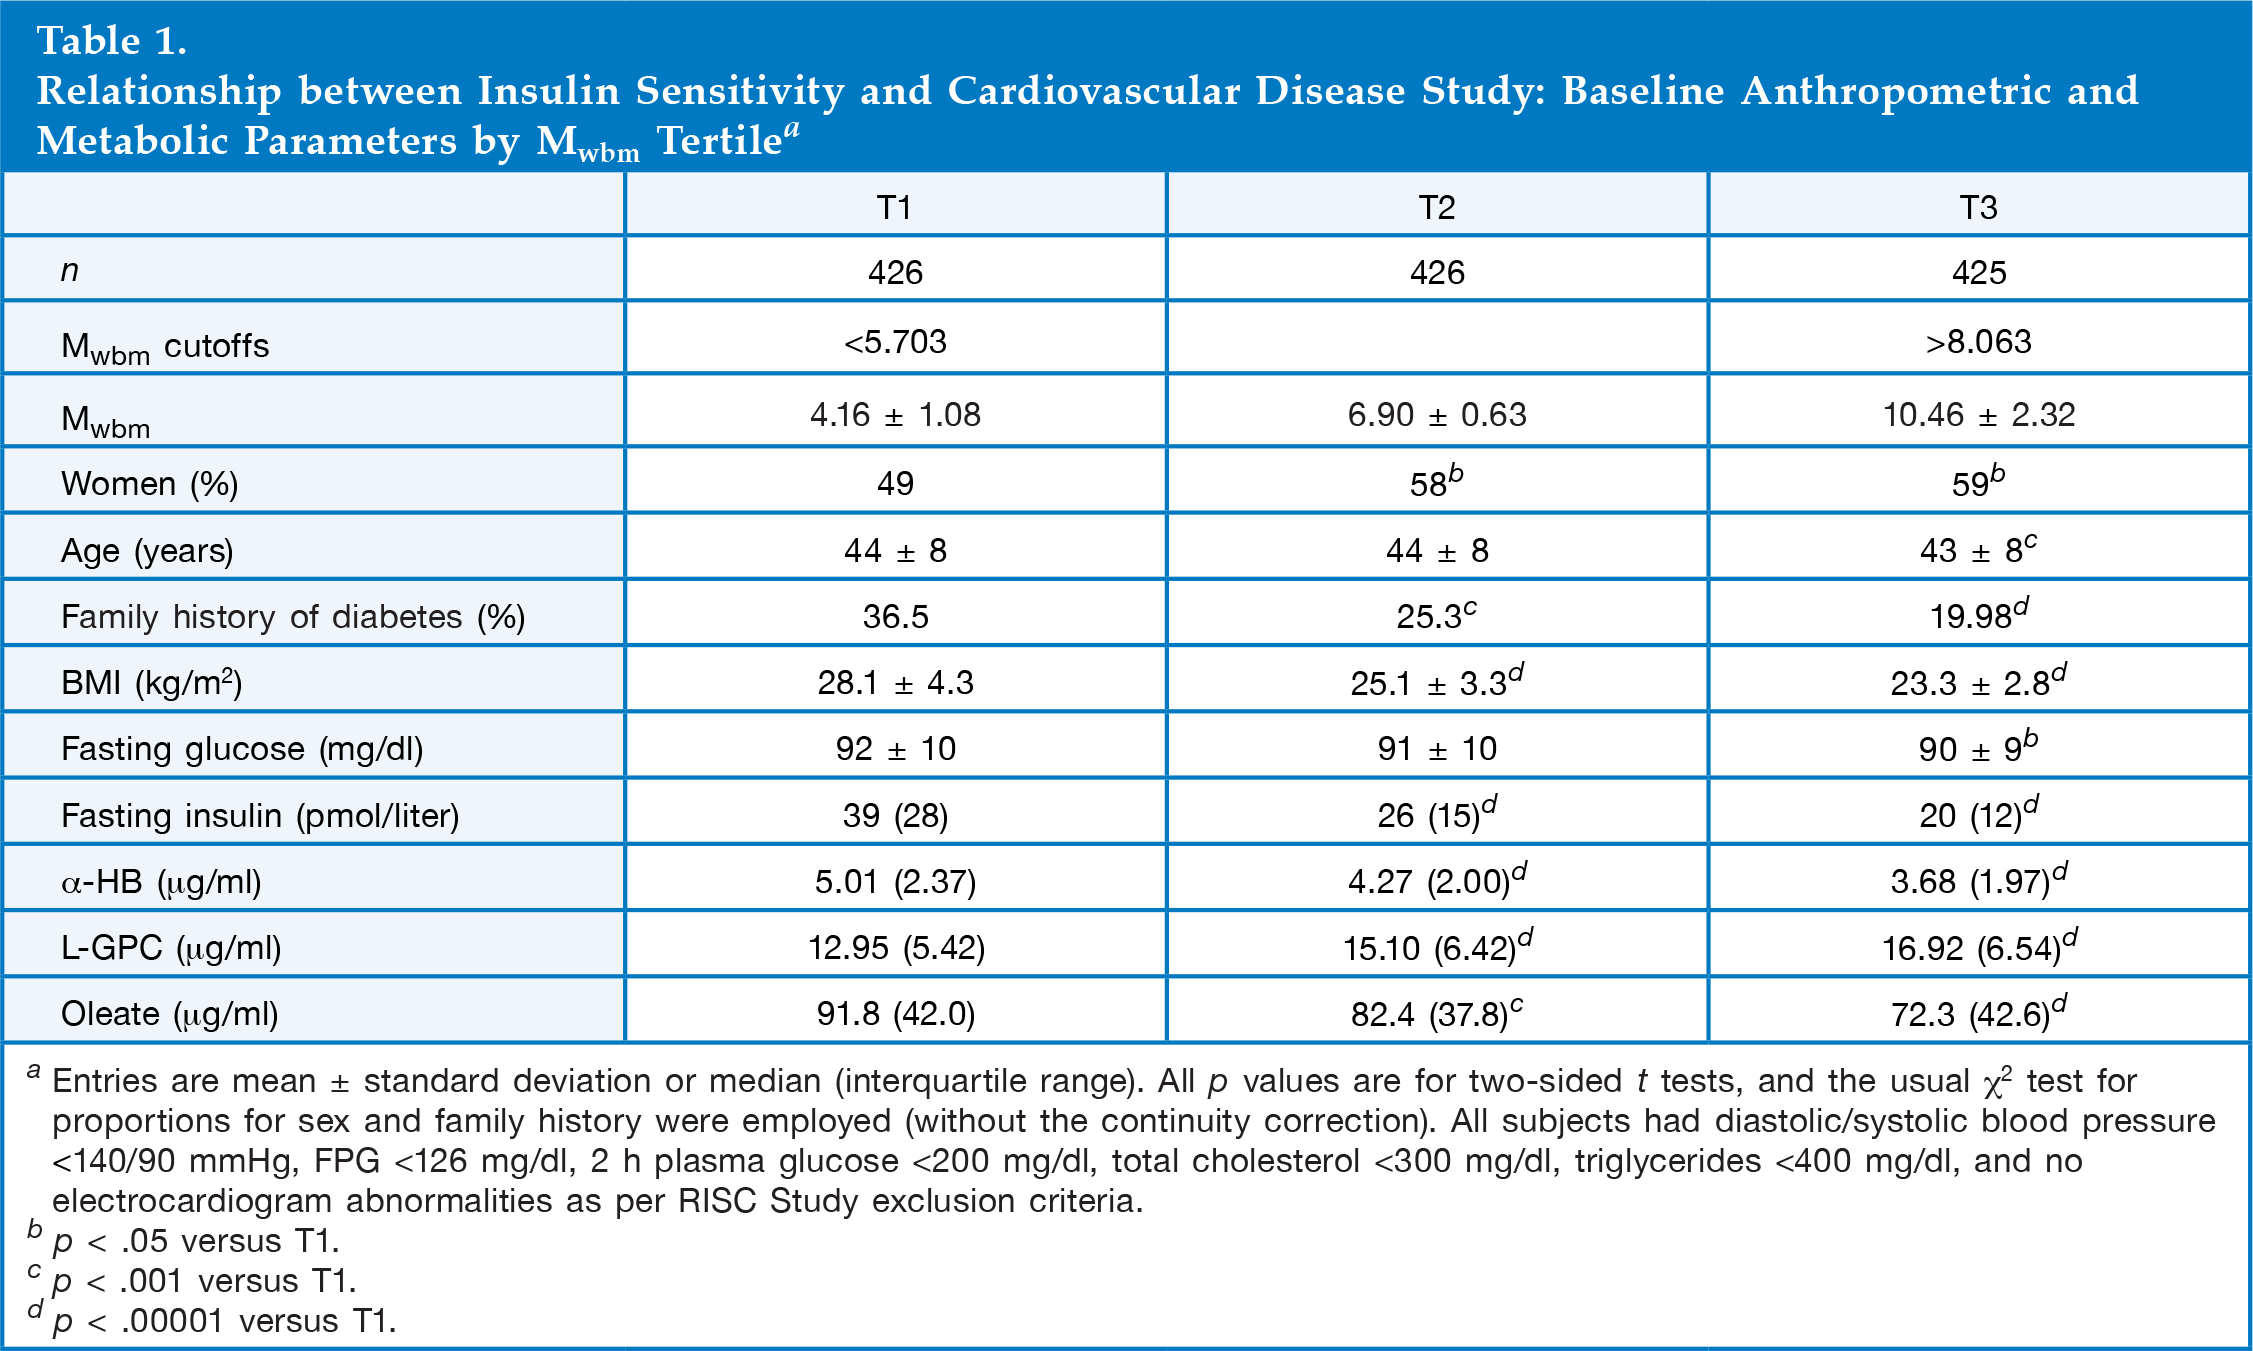
Entries are mean ± standard deviation or median (interquartile range). All p values are for two-sided t tests, and the usual χ 2 test for proportions for sex and family history were employed (without the continuity correction). All subjects had diastolic/systolic blood pressure <140/90 mmHg, FPG <126 mg/dl, 2 h plasma glucose <200 mg/dl, total cholesterol <300 mg/dl, triglycerides <400 mg/dl, and no electrocardiogram abnormalities as per RISC Study exclusion criteria.
p < .05 versus T1.
p < .001 versus T1.
p < .00001 versus T1.
Analytical Procedures
Blood samples were divided into both plasma and serum fractions, aliquoted, and stored at −80 °C. Plasma glucose was measured using the glucose oxidase method. Serum insulin was measured using a dissociation enhanced lanthanide fluoroimmunoassay (AutoDELFIA insulin kit, Wallac, Turku, Finland).
Targeted Metabolite Analysis
Metabolites were analyzed by isotope dilution ultra-high performance liquid chromatographic tandem mass spectroscopy (UHPLC-MS-MS) for absolute quantitation. Fifty microliters of ethylenediaminetetraacetic acid plasma samples were spiked with internal standard solution and subsequently subjected to protein precipitation by mixing with 250 μl of methanol. Following centrifugation, an aliquot of the clear supernatant was injected onto an UHPLC-MS-MS system consisting of a Thermo TSQ Quantum Ultra Mass Spectrometer and a Waters Acquity UHPLC system equipped with a column manager module and two different columns. α-Hydroxybutyric acid (α-HB) was eluted with a 0.01% formic acid in water/acetonitrile-methanol (1:1) gradient on a Waters Acquity BEH C18 column (100 × 2.1 mm2, 1.7 μm) at a mobile phase flow rate of 0.4 ml/min at 40 °C. Ionization was achieved by negative heated electrospray ionization (HESI) mode. 1-linoleoylglycerophosphocholine (L-GPC) was eluted with a 0.01% formic acid in water/ acetonitrile-water-ammonium formate (700:300:2.7) gradient on a Thermo BioBasic SCX column (50 × 2.1 mm2, 5 μm) at a mobile phase flow rate of 0.5 ml/min at 40 °C. Ionization was achieved by positive HESI mode. Oleic acid was eluted isocratically with 15% 5 mM ammonium bicarbonate in water and 85% acetonitrile-methanol (1:1) on a Waters Acquity BEH C18 column (100 × 2.1 mm2, 1.7 μm) at a mobile phase flow rate of 0.4 ml/min at 40 °C. Ionization was achieved by negative HESI mode. Quantitation was performed based on area ratios of analyte and internal standard peaks using a weighted linear least squares regression analysis generated from fortified calibration standards in an artificial matrix prepared immediately prior to each run. The following corresponding stable labeled compounds were used as internal standards: α-HB-D3, oleic acid-13C18, and L-GPC-D9.
Algorithm Development Background
In a previous study, fasting plasma samples from a representative subset of the RISC cohort (n = 399) underwent nontargeted metabolomic26,27 profiling using mass spectrometry. 23 A number of metabolites were identified whose plasma levels correlated with IR as measured by Mffm (M normalized by fat-free mass; Mwbm gave similar correlations) obtained from the hyperinsulinemic euglycemic clamp. The highest correlating metabolite was α-HB. Other highly correlated metabolites included L-GPC, glycine, and creatine. A total of 26 metabolites from this study were collated and investigated for potential inclusion into an IR (M-predicting) algorithm along with BMI and insulin. These 26 metabolites were chosen based on statistical and biological relevance and analytical characteristics.
A total of 1277 subjects from the RISC Study had complete baseline values for Mwbm, insulin, glucose, BMI, age, sex, and the 26 candidate metabolite biomarkers. This group was divided into a training set (n = 894) and a test set (n = 383) for algorithm generation and validation, respectively
Pearson Correlation of the Metabolites to Mwbm a
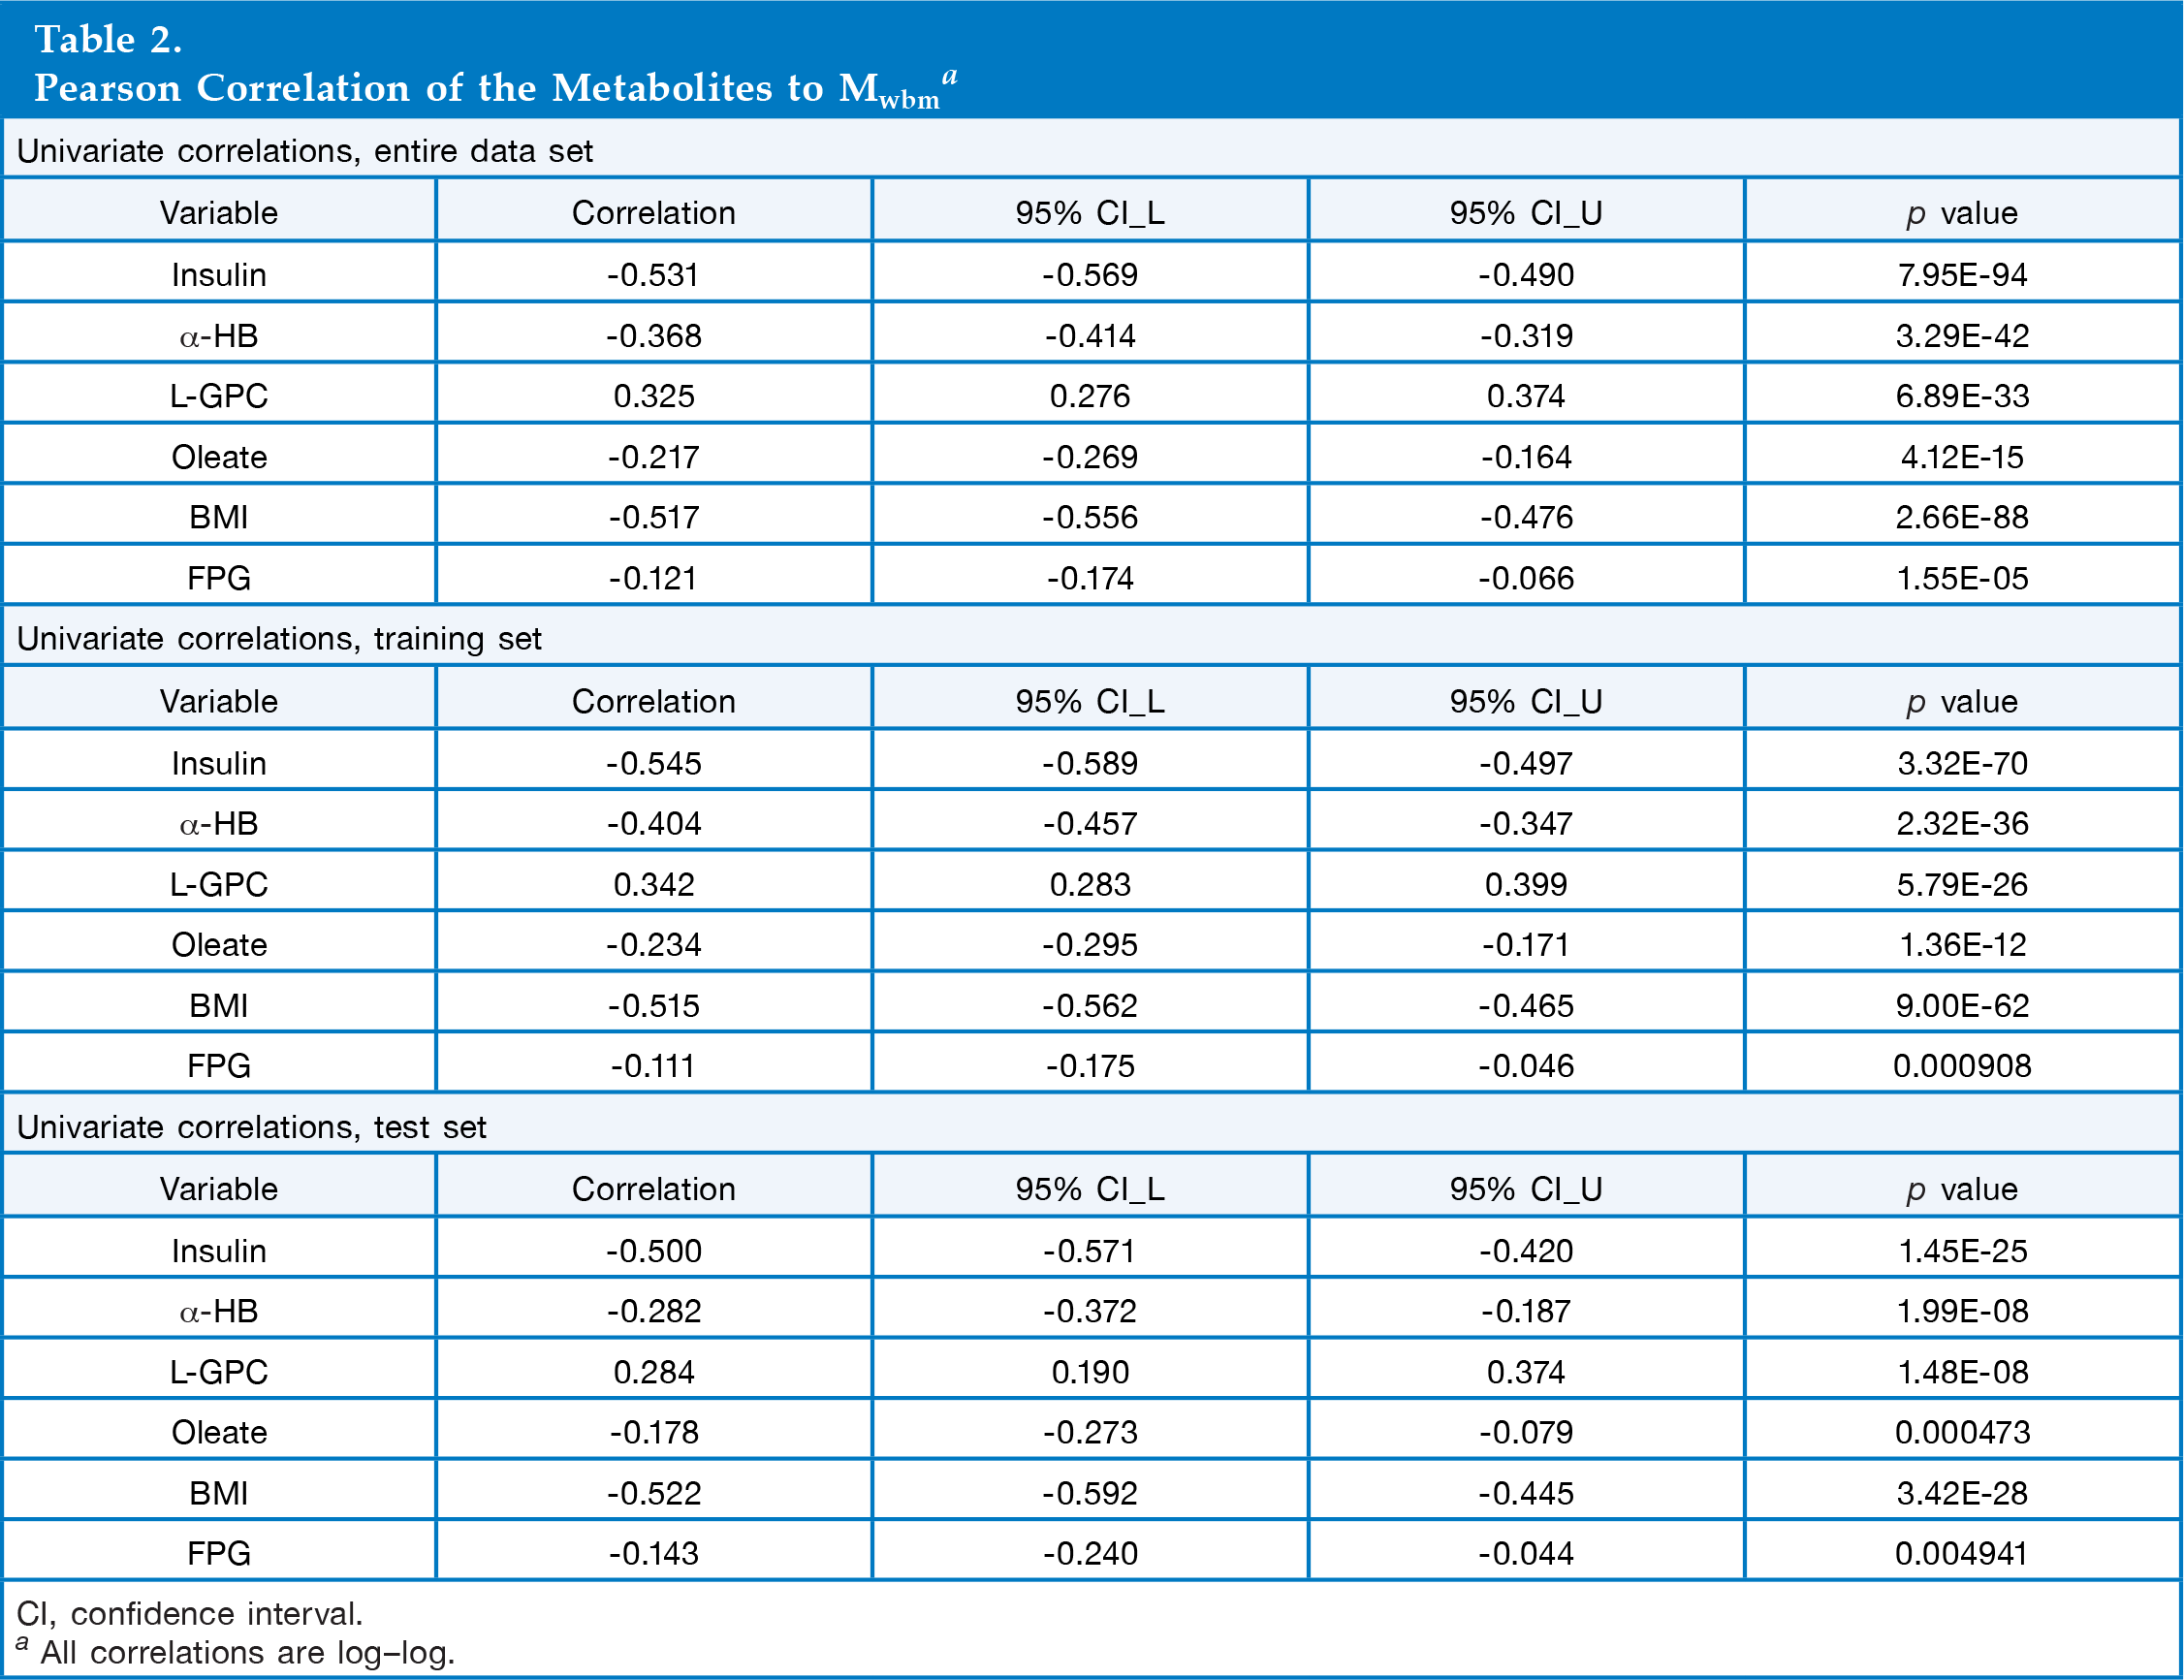
CI, confidence interval.
All correlations are log-log.
Results
Algorithm Development Using the Training Set
A small set of variables were examined to see what transformations were best suited for use in the algorithm. Leverage plots suggested a natural log transformation of the input metabolite variables and a Box-Cox transformation suggested a log transformation of the response variable, Mwbm. Forward-selection models for predicting Mwbm were generated in R with the lars package. 28 Many models were generated and cross validated in an iterative manner, and the optimal number of variables was determined to be four. The final model was developed and optimized using forward selection limited to four variables. The following variables were selected in this order: fasting insulin, α-HB, L-GPC, and stearate. Stearate was later found to have the undesirable analytical property of high background levels, and interestingly, the related fatty acid oleate was determined to be a suitable replacement. Individually, insulin, α-HB, and oleate are negatively correlated with Mwbm and L-GPC is positively correlated with it. The Quantose algorithm consists of a multiple linear regression (natural log transformed) on insulin, α-HB, L-GPC, and oleate used to calculate ln(M). At this point, the test's calculated M (MQ) correlated with Mwbm with an r value of 0.68.
Test Performance: Estimating Mwbm with the Test Set
Without refitting the coefficients from the training set, the algorithm's performance for estimating Mwbm was evaluated using the test set. Regression analysis on the results of these calculations showed an r value of 0.62. In contrast, fasting insulin, BMI, fasting glucose, HOMA-IR, and the OGTT-derived OGIS19,25 index were all significantly less correlated with Mwbm when compared with MQ
Pearson Correlations to the Actual ln(Mwbm) Values in the Test Set a
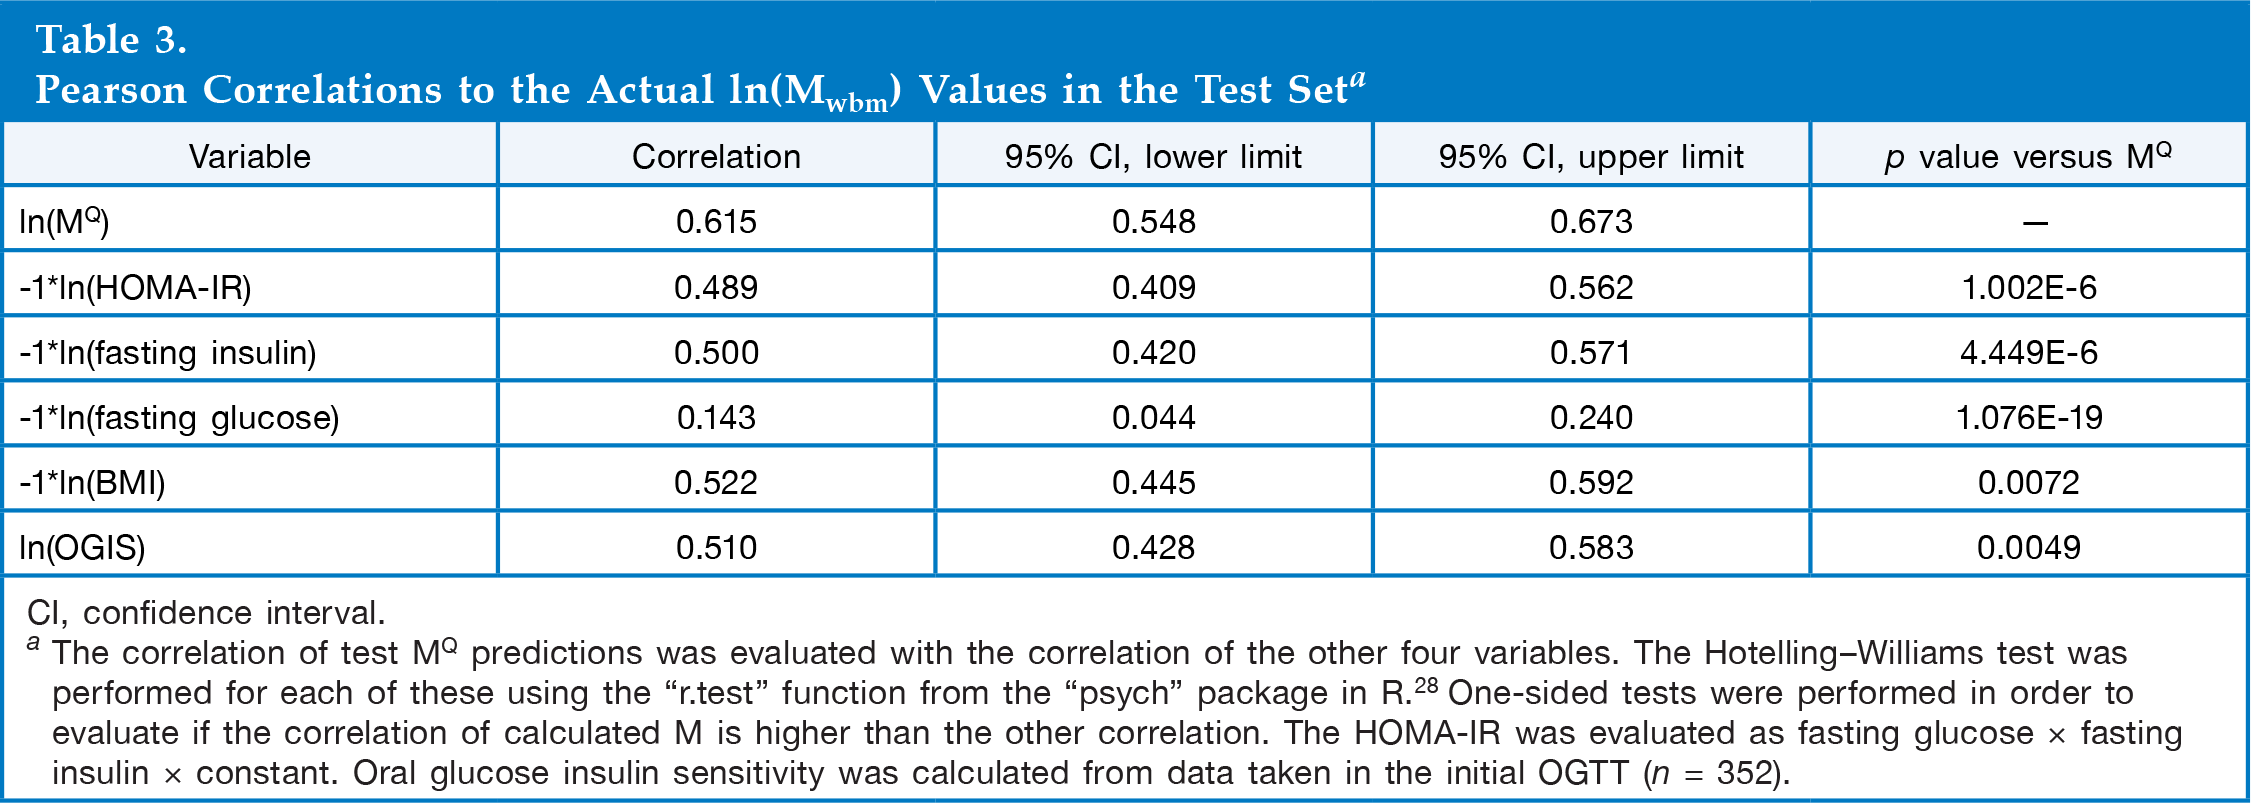
CI, confidence interval.
The correlation of test MQ predictions was evaluated with the correlation of the other four variables. The Hotelling-Williams test was performed for each of these using the “r.test” function from the “psych” package in R. 28 One-sided tests were performed in order to evaluate if the correlation of calculated M is higher than the other correlation. The HOMA-IR was evaluated as fasting glucose × fasting insulin × constant. Oral glucose insulin sensitivity was calculated from data taken in the initial OGTT (n = 352).
Predicting Insulin Resistance in the Test Set
The areas under curve (AUCs) for detecting the bottom tertile of Mwbm (<5.703 mg/kg−1/min−1) were computed
Areas under the Curve for Detecting the Bottom Tertile of Mwbm in the Test Set (Predicting Insulin Resistance) a
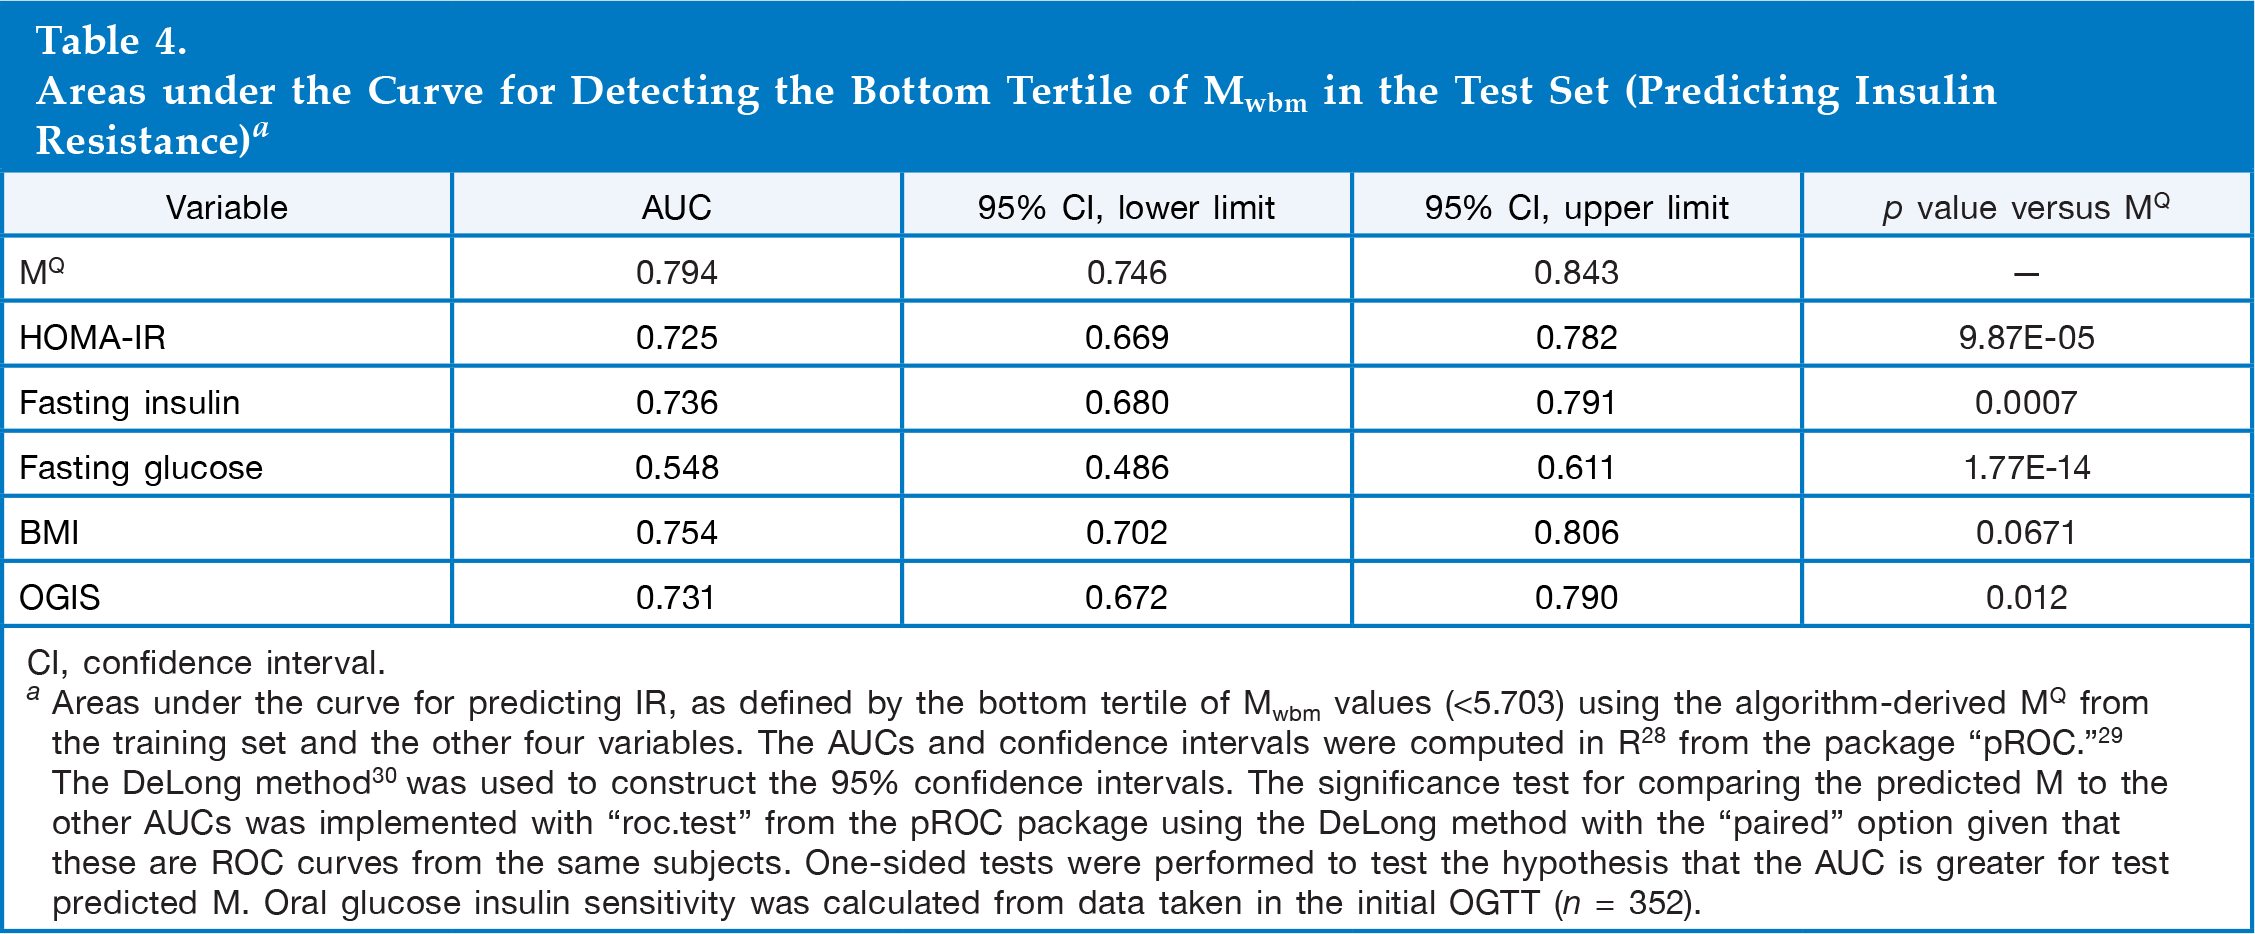
CI, confidence interval.
Areas under the curve for predicting IR, as defined by the bottom tertile of Mwbm values (<5.703) using the algorithm-derived MQ from the training set and the other four variables. The AUCs and confidence intervals were computed in R 28 from the package “pROC.” 29 The DeLong method 30 was used to construct the 95% confidence intervals. The significance test for comparing the predicted M to the other AUCs was implemented with “roc.test” from the pROC package using the DeLong method with the “paired” option given that these are ROC curves from the same subjects. One-sided tests were performed to test the hypothesis that the AUC is greater for test predicted M. Oral glucose insulin sensitivity was calculated from data taken in the initial OGTT (n = 352).
The Final Algorithm
At this point, the algorithm's coefficients were refitted to the entire data set (n = 1277). MQ calculated from the final optimized algorithm correlated with Mwbm, with an r value of 0.66. The correlation plots for MQ (and HOMA-IR) versus Mwbm are shown in
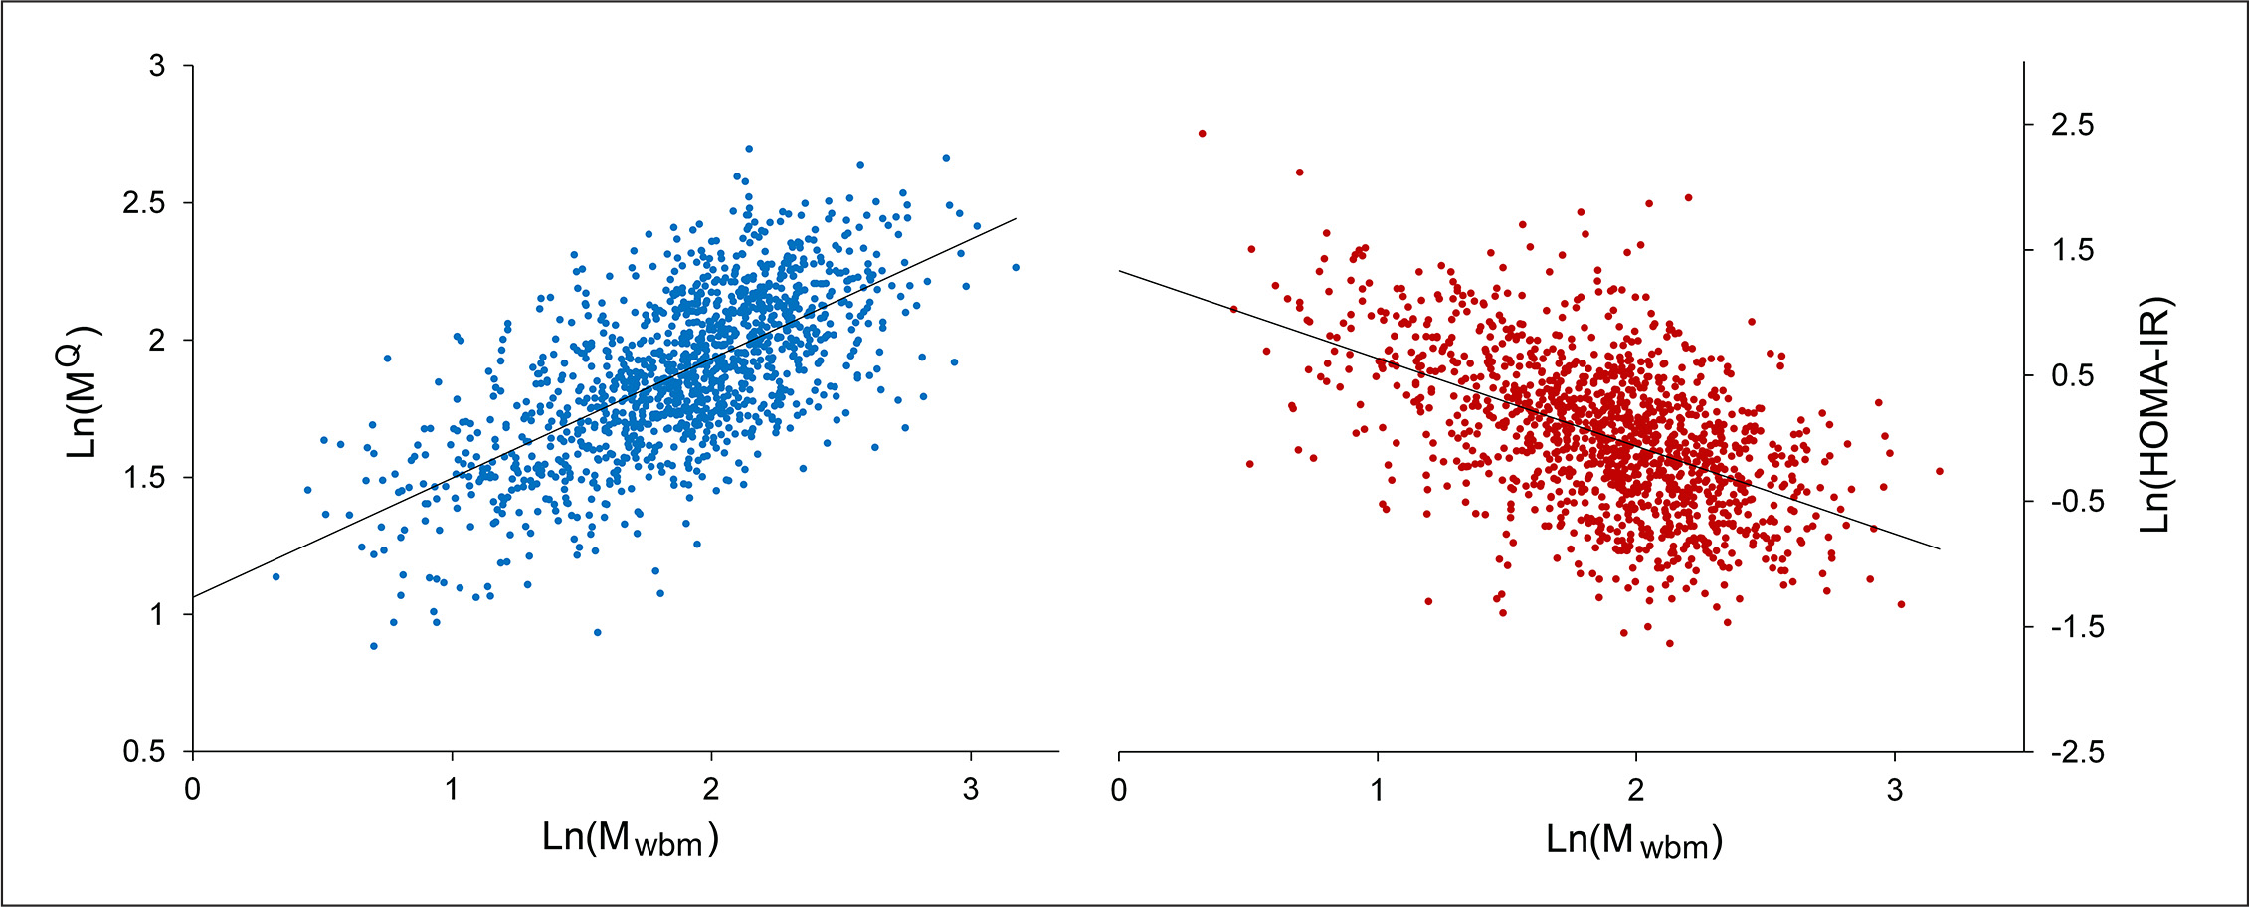
Correlation Plots: Ln(MQ) left or Ln(HOMA-IR) right versus Ln(Mwbm). Ln(MQ): r = 0.66 versus Ln(Mwbm). Ln(HOMA-IR): r = 0.51 versus Ln(Mwbm). N = 1277, and HOMA-IR = (fasting plasma insulin in mU/l × FPG in mM)/22.5.
Predicting Normal Glucose Tolerance to Impaired Glucose Tolerance Progression
In order to determine the ability of the algorithm to identify individuals at risk for developing impaired glucose tolerance (IGT), normal glucose tolerance (NGT) subjects at baseline were evaluated at the three-year follow-up. This analysis included only study participants who had complete values for insulin, glucose, BMI, age, sex, and the three metabolite biomarkers at the 3 year follow-up
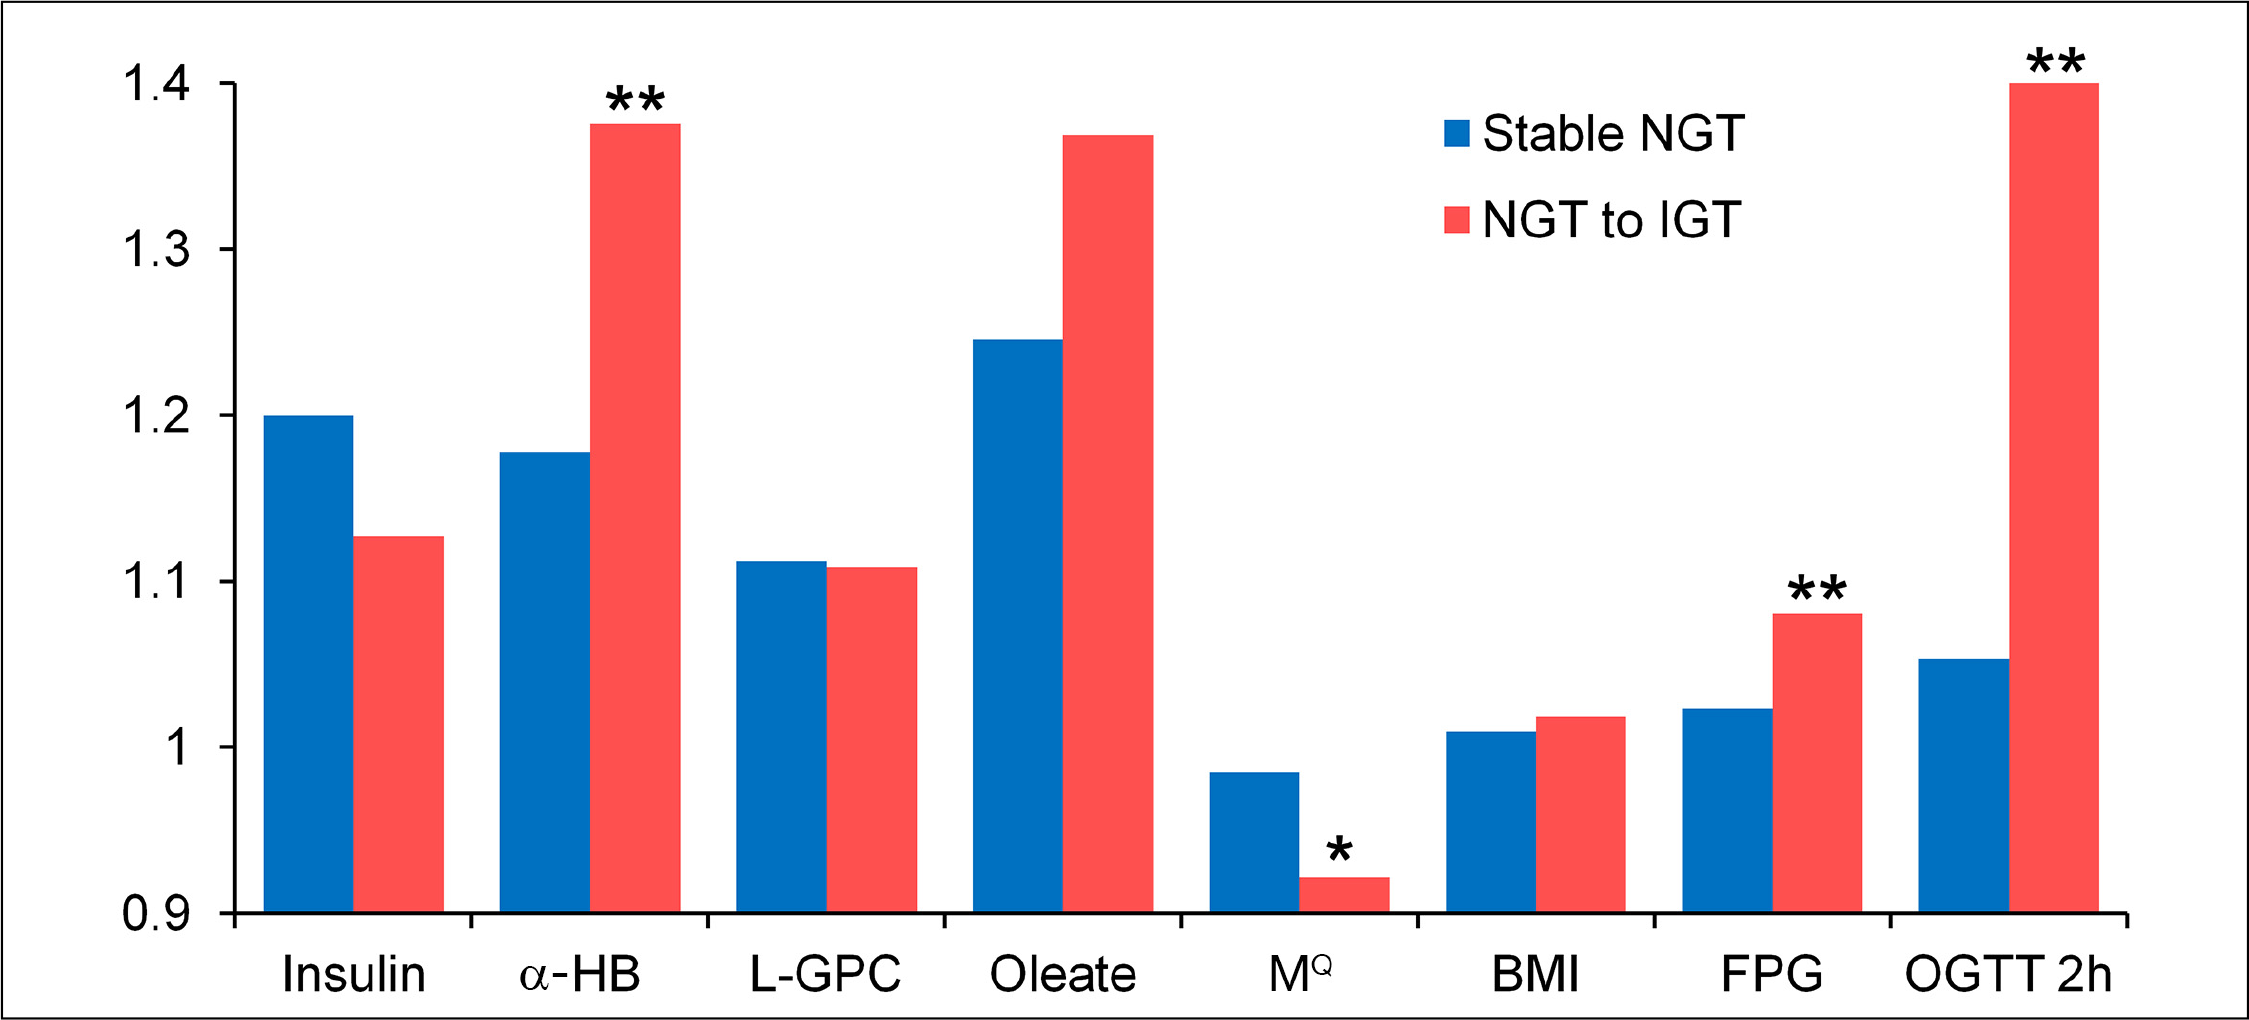
Three-year average individual fold change in baseline parameters: stable NGT versus NGT to IGT progressors. Stable NGT versus NGT to IGT; the single asterisk represents p < .05 and double asterisks represent p < .005 (two-sided t-tests). N = 74 NGT to IGT; n = 759 stable NGT (subjects with complete 3 year data).
Relationship between Insulin Sensitivity and Cardiovascular Disease Study: Baseline Anthropometric and Metabolic Parameters by Outcome a
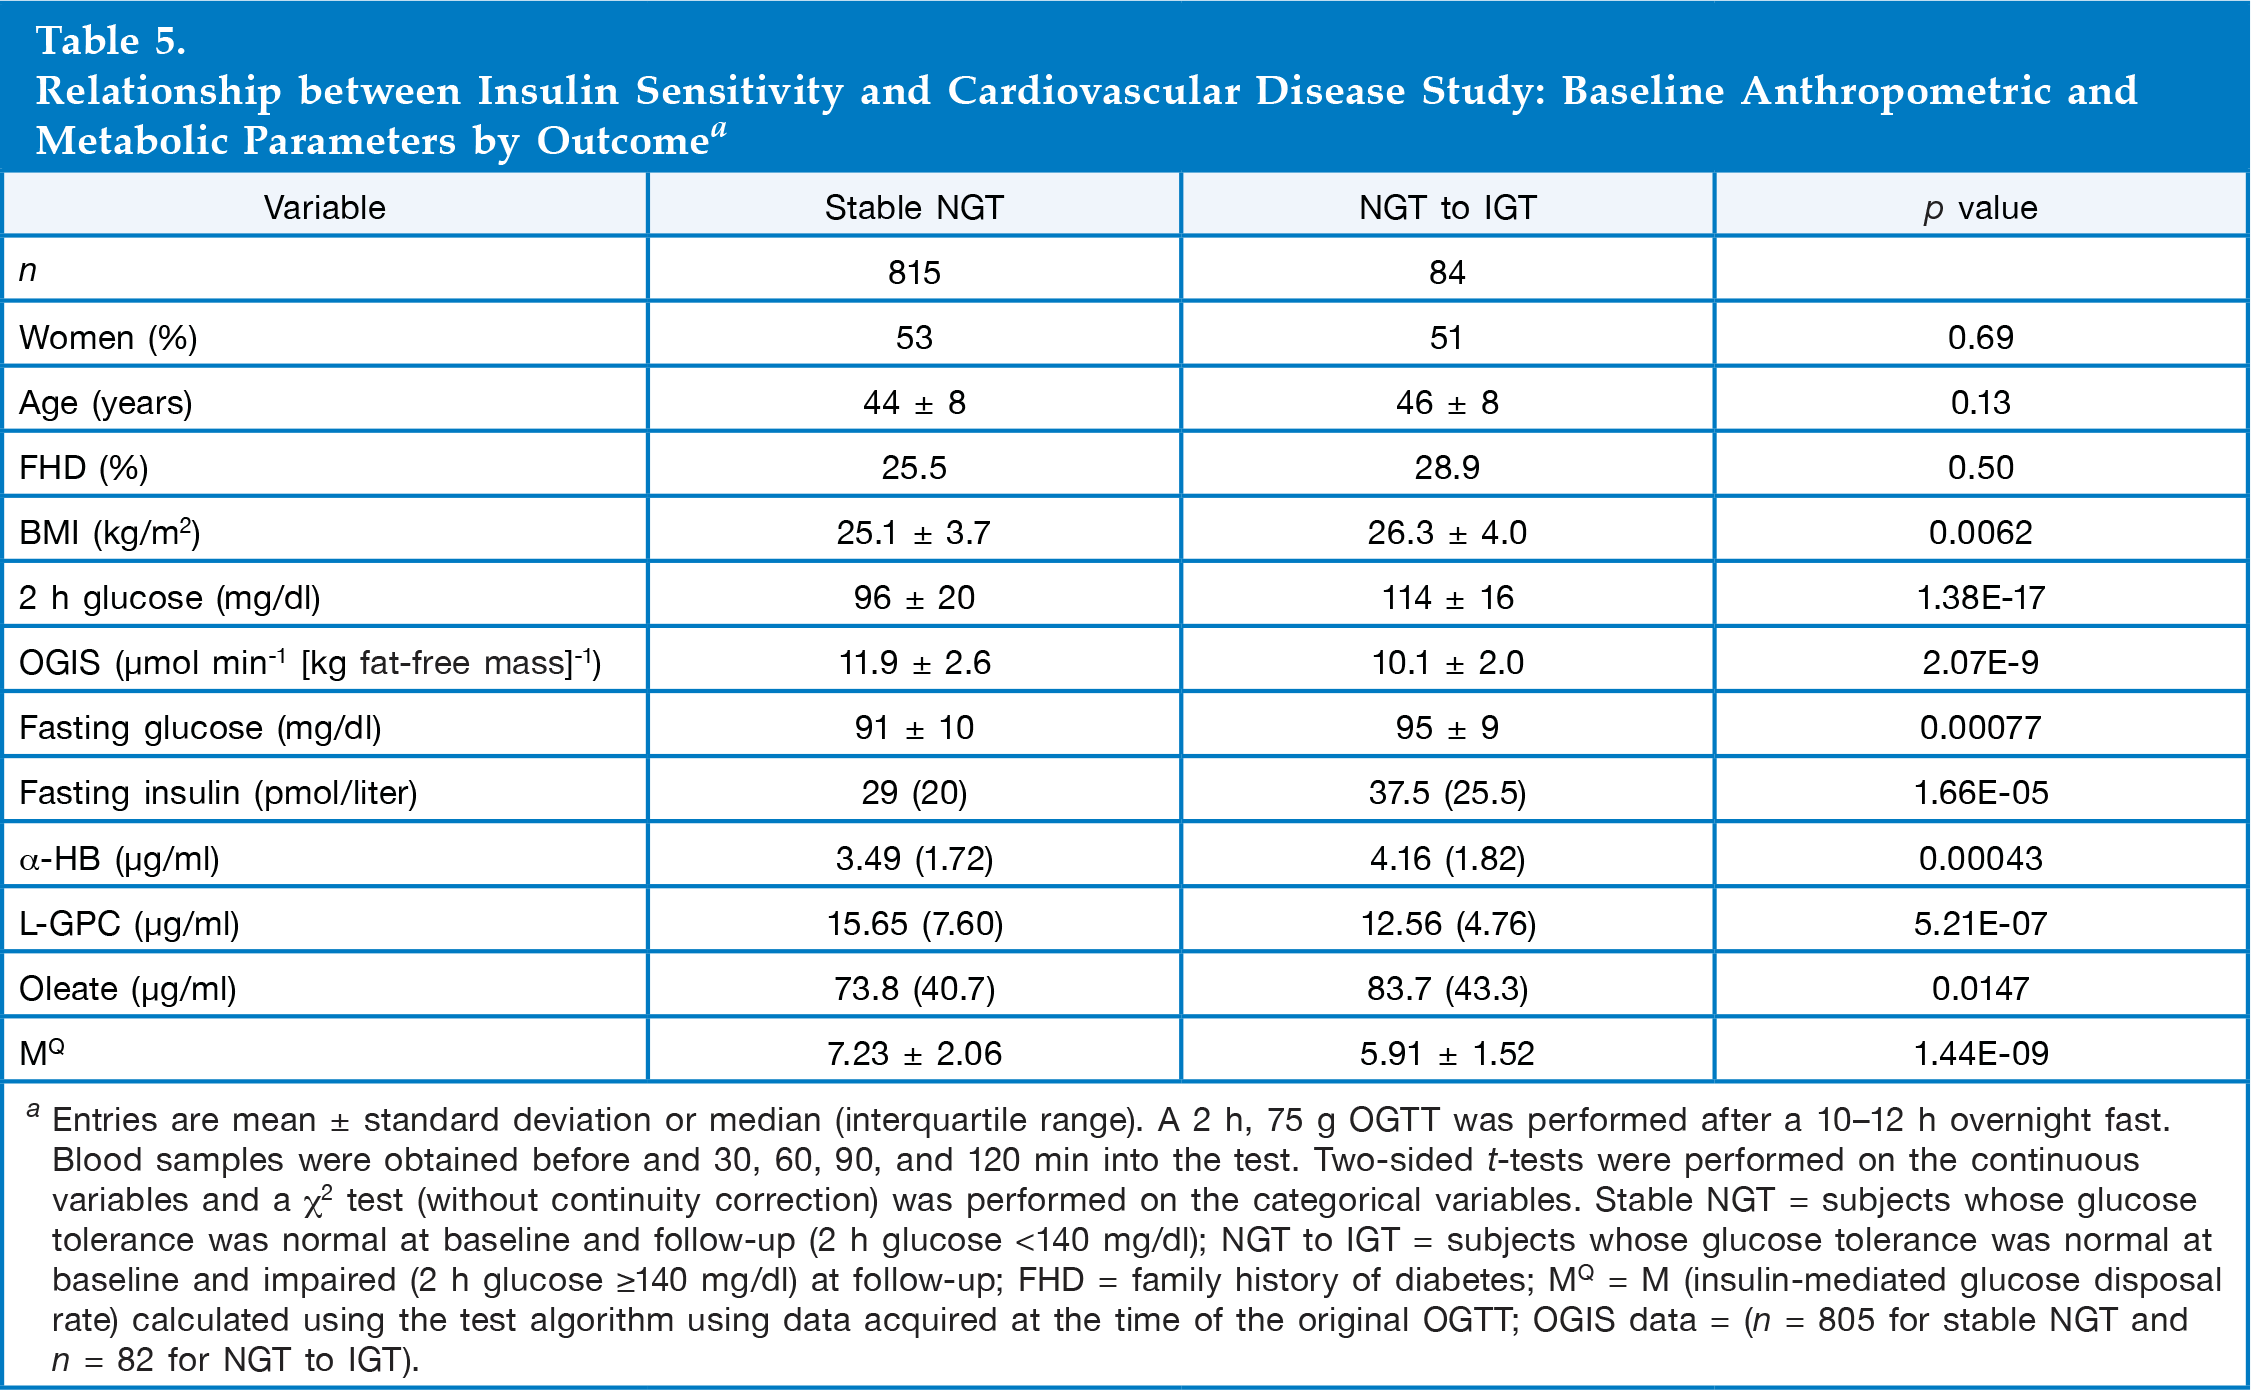
Entries are mean ± standard deviation or median (interquartile range). A 2 h, 75 g OGTT was performed after a 10–12 h overnight fast. Blood samples were obtained before and 30, 60, 90, and 120 min into the test. Two-sided t-tests were performed on the continuous variables and a χ 2 test (without continuity correction) was performed on the categorical variables. Stable NGT = subjects whose glucose tolerance was normal at baseline and follow-up (2 h glucose <140 mg/dl); NGT to IGT = subjects whose glucose tolerance was normal at baseline and impaired (2 h glucose ≥140 mg/dl) at follow-up; FHD = family history of diabetes; MQ = M (insulin-mediated glucose disposal rate) calculated using the test algorithm using data acquired at the time of the original OGTT; OGIS data = (n = 805 for stable NGT and n = 82 for NGT to IGT).
Areas Under the Curve for Predicting Progression from Normal Glucose Tolerance to Impaired Glucose Tolerance a
CI, confidence interval.
MQ was calculated using data obtained at the initial OGTT time point. Areas under the curve were calculated as in
Relative Risk for Progression to Impaired Glucose Tolerance by MQ Value a
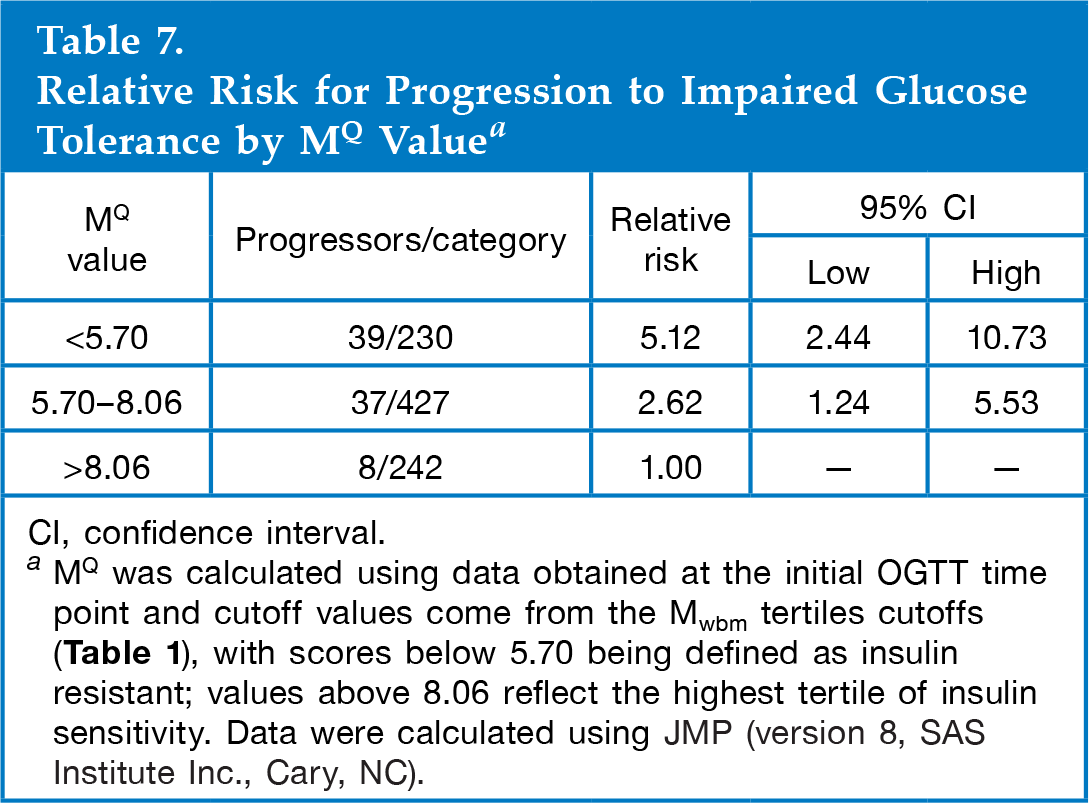
CI, confidence interval.
MQ was calculated using data obtained at the initial OGTT time point and cutoff values come from the Mwbm tertiles cutoffs
Discussion
Predicting Insulin Resistance
The Quantose algorithm was developed within the context of an essentially healthy Caucasian population displaying a wide range of insulin sensitivities indexed as Mwbm. The traditional predictors of IR were evident in this population, with BMI, fasting insulin, and family history of diabetes all being significantly different in the lowest tertile of insulin sensitivity (T1) when compared with the other two tertiles
Predicting Progression to Impaired Glucose Tolerance
The three metabolite biomarkers and insulin were all significantly different at baseline for NGT to IGT progressors when compared with the stable NGT subjects at the 3 year follow-up. The data suggest that the test score may be an early indicator of risk for progression to IGT, as there were few clear signals of risk in the group at baseline. For example, the mean age and family history of diabetes for the IGT progressors were not significantly different from the NGT group, mean BMI was at the low end of overweight, and mean fasting glucose was in the normal range. In fact, the test identified subjects at risk who were lean and had normal fasting glucose values. MQ score decreased by 8% in the IGT progressors over the course of the 3 year period, which is indicative of worsening IR. In contrast, it decreased by only 2% in the stable NGT group. The test score may be useful for monitoring patient progression toward prediabetes or T2DM and, potentially, improvements in their glycemic status as well.
Metabolite Biomarkers of Insulin Resistance
Metabolomic studies in metabolic diseases 31 have been used to identify novel biomarkers that associate with IR23,32,33 and predict T2DM.34–36 The three metabolites used in the test have a number of potential roles in metabolic pathways relevant to insulin action, insulin secretion, or β-cell function. Insulin resistance is characterized by increased lipolysis, elevated plasma free fatty acids, and increased fatty acid oxidation. 37 Oleic acid may serve as a surrogate for total fatty acids and their pathways; given that other fatty acids such as stearic acid and palmitic acid also correlate similarly with Mwbm lends credence to this concept. α-Hydroxybutyric acid is a shunt metabolite derived from α-ketobutyrate.23,38 High dihydronicotinamide adenine dinucleotide/nicotinamide adenine dinucleotide (NADH/NAD+) levels, which may occur with increased fatty acid oxidation in IR, may steer the metabolic fate of α-ketobutyrate from Krebs cycle oxidation toward conversion to α-HB. α-Ketobutyrate is a product of either threonine catabolism or of methionine metabolism via the cystathionine route, which concomitantly produces cysteine as a precursor for the antioxidant molecule glutathione. Increased flux through the latter route may be a marker of oxidative stress. α-Hydroxybutyric acid has been reported to be elevated 5.4-fold after 36 h of fasting and may serve as a general marker of a catabolic state. 39 Interestingly, α-HB correlated with baseline 2 h glucose values (r = 0.28). L-GPC is a lysophosphocholine formed by the action of phospholipase A2 in the liver and by lecithin-cholesterolacyltransferase in the circulation. Phospholipase A2 activity is increased during inflammation, and related lysophosphocholines have been reported to inhibit phospholipase A2 and have anti-inflammatory activity. 40 Related lysophosphocholines have been reported to activate GPR119, which has a role in glucagon-like peptide-1 and insulin secretion. 41 Thus α-HB, L-GPC, and oleate may each add complementary and nonredundant information from diverse metabolic pathways related to insulin action. This may explain why each metabolite adds value to the test and improves the algorithm's estimation of Mwbm.
Biomarkers correlating with IR may also have value in the prediction of prediabetes (impaired fasting glucose, IGT) and T2DM. Previous reports have already noted metabolites associated with future T2DM. These include branched-chain amino acids (valine, leucine, isoleucine), aromatic amino acids (tryptophan, phenylalanine), and uric acid.42–44 A combination of three amino acids has been used to predict T2DM. 43 In the Botnia study, α-HB was found to be a positive predictor and L-GPC a negative predictor of progression to T2DM. 45
Body Mass Index and Insulin
In the development of the test, both insulin- and BMI-containing models were evaluated. Each gave qualitatively similar results, but the insulin algorithm was more accurate at predicting IR and identifying those at risk for IGT. Models containing both provided little additional value. The insulin-containing model was chosen with the goal of identifying at-risk, insulin-resistant individuals who may be lean or modestly overweight, 46 where a BMI-based model might not perform well. 2 Moreover, the insulin-containing model may predict changes in insulin sensitivity that are not accompanied by decreases in BMI as occurs in T2DM patients treated with thiazolidinediones. The inclusion of insulin in the test creates some challenges with respect to comparing samples that have measured insulin using different insulin assays, and this may require cross-calibration work to adjust insulin results from different studies.47–49 Future work using the test will use a single insulin assay carried out in a consistent manner under validated conditions.
Conclusions
Quantose is a test for IR based on a single fasting blood sample developed and validated within the RISC Study population. It has shown utility in the prediction of progression from NGT to IGT (one form of prediabetes) and is superior to other simple baseline measures (fasting insulin, BMI, fasting glucose, HOMA-IR) in this regard. Prediabetes is a high-risk state for T2DM, which is currently defined in terms of glycemic variables (FPG, hemoglobin A1c, 2 h glucose) that increase relatively late in disease progression. This test may have value as an earlier predictor of prediabetes or T2DM risk when compared with these traditional glycemic markers. Such information could be used for earlier implementation of lifestyle changes or drug therapy that have been shown to be successful in the prevention of T2DM. 50 In the light of the ongoing global T2DM pandemic, such preventative actions are extremely important, and this test may have value in monitoring the progress of these interventions. Finally, clinical outcome data from diverse, longitudinal study populations are currently being analyzed to demonstrate the full clinical potential of this novel test for IR and prediabetes.
Footnotes
Abbreviations:
This work was funded by Metabolon Inc., Durham, NC.
Jeff Cobb, Matthew Mitchell, Klaus-Peter Adam, Pam Nakhle, Eric Button, James Hathorn, Kay Lawton, Michael Milburn, Regis Perichon, and Walter Gall are full-time employees of Metabolon Inc. Ele Ferrannini serves on advisory panels for AstraZeneca LP, Bristol-Myers Squibb Company, Boehringer Ingelheim Pharmaceuticals Inc., Sanofi-Aventis, Johnson & Johnson, GlaxoSmithKline, Novartis Pharmaceuticals Corporation, Merck Sharp & Dohme Limited, and Astellas and receives research support from Boehringer Ingelheim. Pharmaceuticals Inc., Amylin Pharmaceuticals Inc., Eli Lilly and Company, Merck Sharp, and Dohme Limited.