
Abstract
Background:
There is need for a method to describe precision and accuracy of glucose measurement as a smooth continuous function of glucose level rather than as a step function for a few discrete ranges of glucose. We propose and illustrate a method to generate a “Glucose Precision Profile” showing absolute relative deviation (ARD) and /or %CV versus glucose level to better characterize measurement errors at any glucose level.
Method:
We examine the relationship between glucose measured by test and comparator methods using linear regression. We examine bias by plotting deviation = (test – comparator method) versus glucose level. We compute the deviation, absolute deviation (AD), ARD, and standard deviation (SD) for each data pair. We utilize curve smoothing procedures to minimize the effects of random sampling variability to facilitate identification and display of the underlying relationships between ARD or %CV and glucose level.
Results:
AD, ARD, SD, and %CV display smooth continuous relationships versus glucose level. Estimates of MARD and %CV are subject to relatively large errors in the hypoglycemic range due in part to a markedly nonlinear relationship with glucose level and in part to the limited number of observations in the hypoglycemic range.
Conclusions:
The curvilinear relationships of ARD and %CV versus glucose level are helpful when characterizing and comparing the precision and accuracy of glucose sensors and meters.
Keywords
The precision and accuracy of glucose measurement using continuous glucose monitoring (CGM) or self-monitoring of blood glucose (SMBG) depend on the glucose level, typically with a progressive increase in absolute deviation but with a decrease in mean absolute relative deviation (MARD) as one moves from hypoglycemia to the target range, to hyperglycemia.1-10 Problems with calibration can lead to inaccuracies with systematic biases that vary with glucose level. 11 In the literature characterizing CGM systems, it has been customary to report an overall MARD and a MARD for a few ranges of glucose, and to use these values to compare the performance of sensors and meters.1-10 Individual estimates of ARD based on 2 measurements have also been displayed graphically versus glucose level, showing the results for pairs of individual glucose values.9,10 Such estimates of ARD are subject to extremely large random sampling errors.9,10 This sampling error makes it difficult or impossible to reliably characterize the systematic nonlinear relationship of ARD to glucose level. 10 Estimating ARD or %CV based on a single pair of measurements corresponds to an attempt to measure a standard deviation based on 2 observations so that one has only 1 degree of freedom (df). The chi-square distribution for 1 df shows enormous variability such that it becomes extremely difficult to identify the underlying relationship between MARD, SD, or %CV versus glucose unless one pools data and uses curve smoothing.
We have previously developed and applied a number of statistical methods to address a closely related problem of quantifying the empirically observed errors in the measurement of hormone levels in terms of a smooth continuous relationship of %CV versus hormone levels.12-14 This relationship was designated as a “Precision Profile.” 15 In the present report we apply the Precision Profile concept and methodology to estimation of the accuracy and precision of glucose sensors and meters. In principle, this method should be applicable to data obtained using CGM and SMBG, as well as reference laboratory methods for measurement of glucose and other analytes.
Methods
We assume that lengthy time series of glucose measurements are available wherein the test method and the comparator method are frequently and periodically measured simultaneously. The data are then sorted according to the glucose value of the reference or comparator method, or according to the mean values of the 2 methods. We utilized several synthetic datasets with known characteristics to illustrate and evaluate the Precision Profile methodology to describe several measures of bias and precision (AD, ARD, SD, %CV) as smooth continuous functions of glucose level. We created multiple data sets with true or reference glucose with a large number of independent glucose values ranging from 40 to 500 mg/dL at 1 mg/dL intervals. We selected 2 sets of measurements, where each glucose value was equal to the true value plus an independent, Gaussianly distributed error term. For one set of these illustrative data, there was a bias of +10 mg/dL at 40 mg/dL which gradually and linearly transitioned to a bias of –10 mg/dL at 400 mg/dL. This observed glucose value was subject to a 10% proportional Gaussian error combined with a random Gaussian error of 5.0 mg/dL. The comparator glucose data set was subject to less bias (–2 mg/dL at 40 mg/dL and +5 mg/dL at 400 mg/dL), with a 5% proportional error and a smaller minimum error of 2.5 mg/dL relative to the true value. This corresponds to the fact that comparator and reference methods are also subject to bias and imprecision that is usually expected to be smaller than those of the method being evaluated.
We then applied a number of statistical analyses, including (1) linear regression for the observed (test) and comparator glucose values, (2) evaluation of the dataset for bias overall 16 and as a function of glucose level, and (3) characterization of the error structure of the data by examining the deviations of measurements for the test method and the comparator as a function of glucose level. We calculated the deviation, the absolute deviation (AD), 17 absolute relative deviation (ARD),1-10 and the local point estimate of variance, Var(x) = (x1 – x2)2/2 for each pair of glucose measurements. 18 We then applied curve smoothing as follows. We smoothed the relationship of AD and glucose using linear and polynomial models. The linear model failed to provide a satisfactory fit in the hypoglycemic region for several of the cases studied. We also used running averages of 10 to 30 values after sorting by glucose level, and used median values in narrow ranges. 12 Alternatively, one can use cubic smoothing splines, 19 or local regression. 20 The predicted AD for any given glucose level can be converted to an ARD simply by expressing it as a percentage of the glucose level. Alternatively, one can calculate the ARD for each data pair, and apply smoothing with running averages, splines, 19 or local regression. 20 One can also calculate the variance for any narrow range of glucose levels by averaging the “contrasts” in that range, 18 taking the square root to obtain an estimate of the sample standard deviation, calculating the %CV, and applying curve smoothing. For comparison, we calculated the average of the individual estimates of ARD for specified ranges of glucose, for example, 3 ranges (40-70, 70-180, and 180-500 mg/dL), or 4 ranges (40-70, 70-125, 125-180, and 180-500 mg/dL). We evaluated the extent to which the ARD vary systematically for narrow ranges of glucose, especially in the hypoglycemic range.
Results
Figure 1 shows a representative data set. More than 100 other similar data sets were generated and evaluated. There is an excellent correlation (r = .97). The average or root mean square error (RMS) of the observations around the line of identity was 33.2 mg/dL. There was an overall negative bias which was highly statistically significant. Using unweighted least squares linear regression, the intercept (a = 21.45) was statistically significantly different from zero and the slope (b = 0.90) was statistically significantly different from unity. For data with marked nonuniformity of variance as in the present case, it would be advantageous to utilize weighted regression 21 with iterative reweighting. 22 When errors in the 2 variables are comparable, it would be desirable to use special forms of regression.23,24
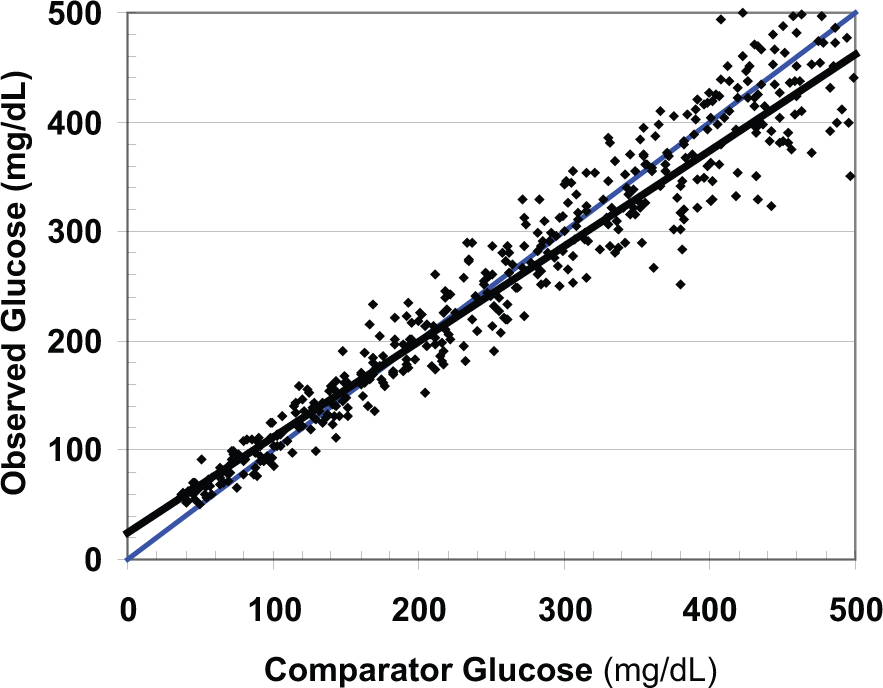
Relationship of observed glucose to comparator showing the least-squares regression line (black) and line of identity (blue).
Figure 2 shows the signed deviations between the observed (measured) glucose and the comparator glucose. Again, there is marked nonuniformity of variance: the magnitude of the error increases in direct proportion to the glucose level, as expected based on the models used to generate the data. Positive and negative bias are present for different ranges of glucose.
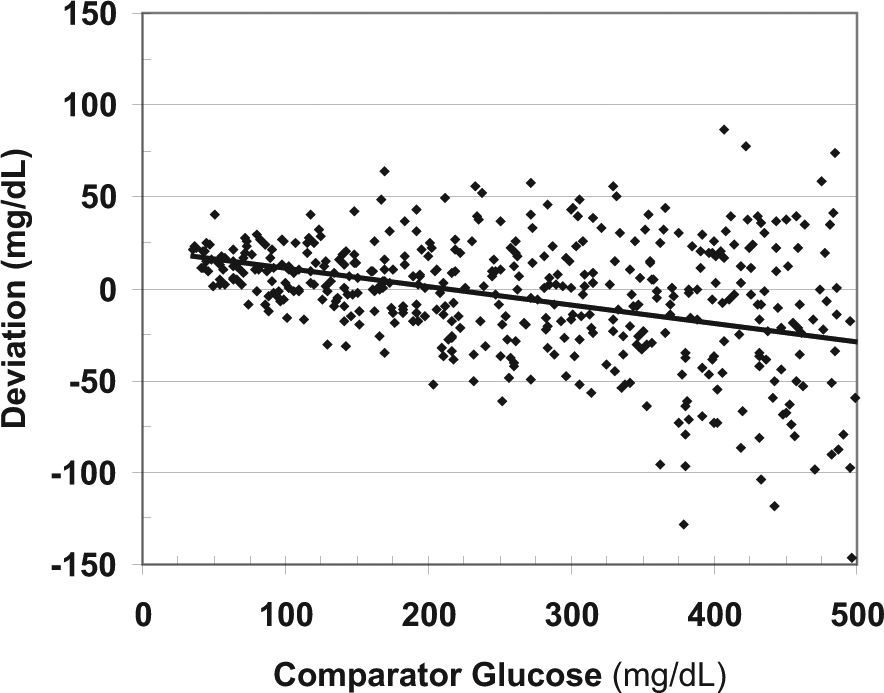
Relationship of deviations versus comparator glucose. The arithmetic (signed) deviations can vary in magnitude (bias) and in terms of their own variability depending on glucose level.
Figure 3 shows the ADs for each individual observation as a function of glucose level: AD =|observed glucose – comparator glucose|. There is considerable scatter in the estimates of absolute deviation based on single pair of data points, consistent with the theoretically expected distribution. The relationship of absolute deviation versus glucose level may be nonlinear. A polynomial regression, cubic smoothing spline 19 or local regression 20 shows the underlying relationship and makes it possible to estimate the expected AD for any given glucose level.
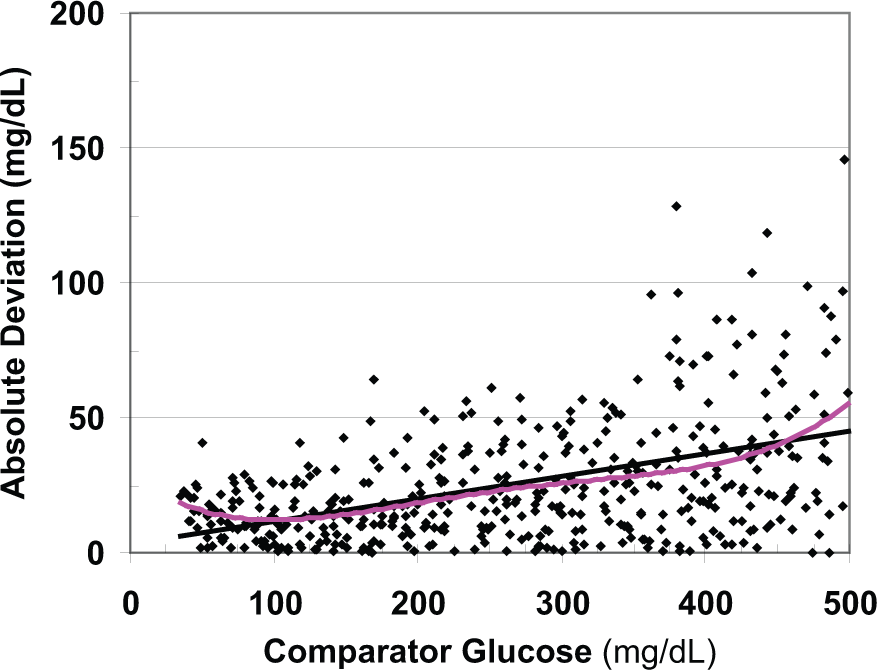
The absolute deviation (AD) of the test method from the comparator shows large random sampling variability. The magnitude of the AD and its own variability depend on glucose level. The least squares regression line (black) and a third order polynomial (pink) are shown. In this example, the expected AD reaches a nadir when glucose is ~100 mg/dL and the linear relationship does not provide a satisfactory curve fit below that level.
At this point in the calculations, we have several options: we can apply curve smoothing to AD, ARD, SD, or %CV.
One can first smooth the relationship of AD versus glucose using a polynomial (Figure 3) or other curve smoothing methods. Having found a smooth relationship, one can then convert the smoothed AD into the corresponding ARD for each glucose level:

One can convert the individual estimates of AD to ARD by dividing by glucose level, and then apply curve smoothing to ARD vs glucose.
One can use the empirically confirmed theoretical relationship (applicable to variables with a Gaussian distribution) between SD and AD 17 to calculate the SD:

This calculation may be done using either the individual estimates or smoothed estimates of AD. Alternatively, the SD can be calculated directly from the pairs of observed and comparator glucose using the method of contrasts:
18
These individual estimates of variance can be averaged (eg, using running averages), and then the SD can be calculated as the square root of the pooled estimate of variance. After the SD has been calculated and curve smoothing has been applied, one can calculate the %CV, where %CV = 100 × SD/glucose, which can be displayed as a function of glucose level.

One can calculate the individual estimates for %CV and then apply curve smoothing using the same kinds of approaches as used for AD, ARD, or SD.
These approaches make it possible to generate a Precision Profile showing ARD (alternatively, %CV) as a function of glucose level (Figure 4).
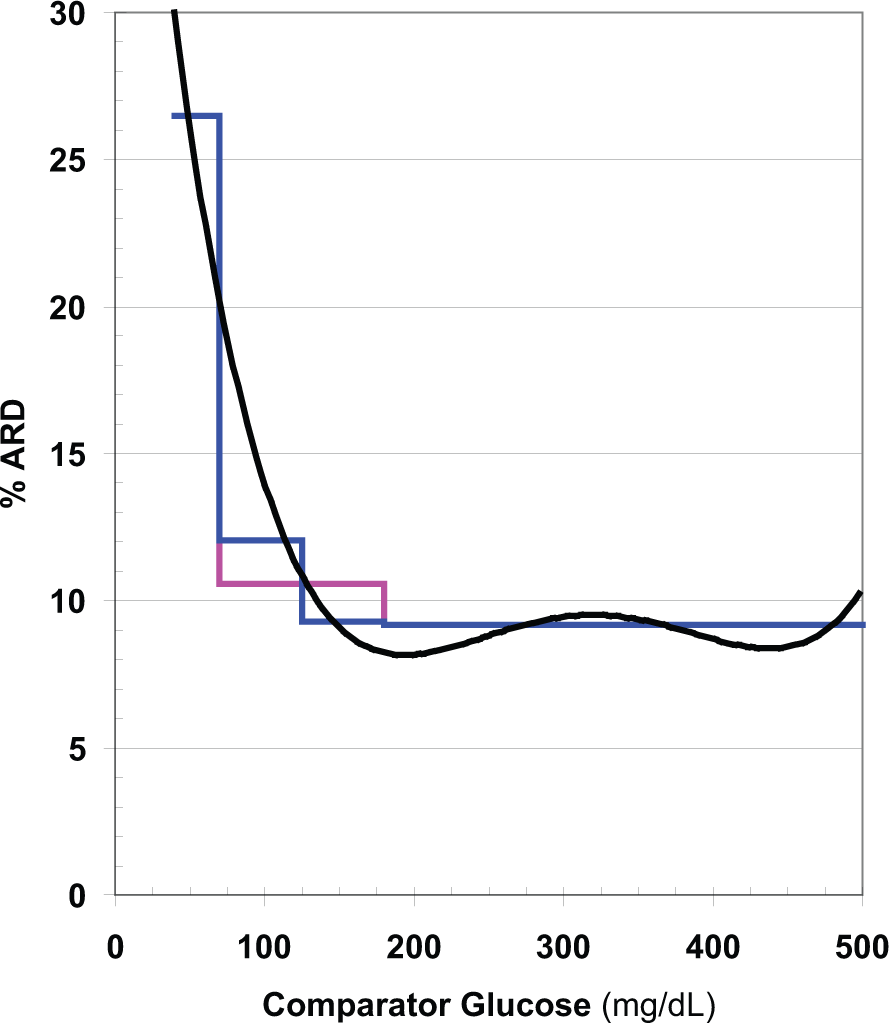
Expected absolute relative deviation (ARD) as a function of glucose level calculated from data displayed in Figures 1-3 (black), after curve smoothing using running average of ARD combined with a fourth order polynomial curve fit. Mean ARD (MARD) is also shown as a step function for 3 ranges of glucose (40-70, 70-180, and 180-500 mg/dL) (pink), and for 4 ranges of glucose when the target range is divided into 2 segments (70-125 and 125-180 mg/dL) (blue).
MARD decreases systematically as the glucose level increases from 40 to 500 mg/dL. Use of 3 or even 4 stepwise segments of the glucose range fails to provide an adequate approximation to the underlying smooth, continuous relationship. Similar results were obtained whether curve smoothing was applied to AD, ARD, SD, or %CV, reflecting the robustness and consistency of properly selected and implemented smoothing procedures.
In the present example (Figure 4), MARD is nearly constant throughout the hyperglycemic region, approximately 9%. In the target range (70-180 mg/dL), MARD increases from 8% to 20%, a 2.5-fold increase. The mean value for ARD (MARD) for this range of glucose, 10.5%, is a poor approximation except near the midpoint of this segment at 125 mg/dL. If one divides the target range into 2 segments, 70-125 and 125-180 mg/dL, similar to what was done by Weinstein et al, 25 then the MARD for each segment provides a better approximation to the value shown by smooth curve. In the hypoglycemic range (40-70 mg/dL), ARD ranges from 20% to 30%, a 1.5-fold range. Accordingly, it would be inaccurate to utilize a single average value such as 25% for MARD for this segment. Small variations in the number and levels of glucose values falling within the hypoglycemic range can seriously affect the estimates of AD, SD, and %CV and the corresponding values for ARD and MARD.
Discussion
The present study demonstrates that the mean and median ARD and related estimates of measurement errors vary consistently and systematically as smooth functions of glucose level.
ARD values calculated from individual pairs of observed and reference values are subject to very large random sampling errors, making it difficult to obtain a reliable estimate of the local average MARD value and identify the curvilinear relationship between ARD and glucose level (Figure 4). If there are only a small number of observations in the hypoglycemic range (especially at the low end of the hypoglycemic range), one can expect to obtain a value of MARD that falls closer to the values observed in the target range (Figure 4).
One can use a smoothed value for ARD as in the present example, based on a large number of data points spaced as uniformly as possible over as wide a range as possible (eg, between 40 and 400 mg/dl), obtained using a running average of ARD with additional smoothing as needed to minimize random sampling variability without excessive loss of resolution. Alternatively, and with nearly indistinguishable results, one can estimate the AD of glucose measurement, apply smoothing (e.g., using a a polynomial or smoothing cubic spline 19 of AD and comparator glucose level), and then calculating the expected ARD for any desired glucose level. This permits construction of a Precision Profile (Figure 4) which should be more informative than simply using MARD—the mean ARD—for 3 or 4 segments of the glucose range. Because the relationship of AD of glucose to glucose level (Figure 3) is often nearly linear, in some cases it may be easier to perform the smoothing in terms of AD versus glucose rather than in terms of the hyperbolic relationship of ARD versus glucose. Both approaches give closely comparable results if properly performed with adequate data. The method is easy to apply, and most of the calculations can be readily performed using popular spreadsheets.
The continuous Precision Profile (Figure 4) is one of the best ways to compare the precision of measurement of two or more types of sensors or meters. The Precision Profiles for the devices can be compared by overlaying them. In some cases, one device may provide superior precision and accuracy for one range of glucose, while another device may give better precision and accuracy for a different range of glucose.
In view of the nonuniformity of variance for glucose, which can be expected when measuring glucose over a range from 40 to 400 or 500 mg/dL, it would be desirable to use weighted regression when characterizing data similar to that shown in Figures 1 to 3 using a weighting function based on the relationship of AD and SD of glucose to glucose level (Figure 3).21,22
If bias (Figure 2) and precision (Figures 3 and 4) are known as a function of glucose level, and if the distribution of the true or comparator glucose values are known, then in principle one could predict the distribution of glucose values in various zones of the Clarke 26 or Parkes 27 error grids. This should enable one to evaluate the compatibility of the empirical findings based on the error grids and the values predicted from analyses characterizing the errors in glucose measurement (Figures 1-4).
When averaging MARD values for a series of ranges of glucose, as commonly done,1-10,25 one is utilizing information derived from only a single, specified narrow range of glucose. By taking advantage of the theoretically predicted and empirical observation that precision is a smooth continuous function of the glucose level, then data from adjacent segments impose constraints that improve the ability to estimate the location of the curve more precisely. These methods are also applicable to the precision absolute relative deviation. 28
The methods described here were designed for application to data from a single experiment, involving a single subject. There remains the task of identifying possible heterogeneity in results during different phases or stages of the study, and the task of pooling results over multiple subjects, days, or experiments.
Conclusions
The methods described here should be useful additions to the usual armamentarium of methods used for validation and characterization of glucose sensors. These include construction of the scattergram (Figure 1), use of linear regression and correlation (Figure 1), use of the Bland–Altman plot 16 and related approaches (cf Figure 2), the use of the Clarke error grid 25 and the Clarke CGM error grid, 29 the use of the Parkes or consensus error grid, 26 and the use of mean or median ARD for specified ranges of glucose.1-10,27 The present method helps to reduce problems related to large random sampling errors when dealing with an AD, ARD, SD, or %CV, and potentially enables the user to characterize ARD and %CV more precisely, accurately, and reliably than the use of a MARD or a mean %CV for a few specified ranges of glucose.
Footnotes
Abbreviations
AD, absolute deviation; ARD, absolute relative deviation; CGM, continuous glucose monitoring; %CV, % coefficient of variation; df, degrees of freedom; MAD, mean absolute deviation; MARD, mean absolute relative deviation; RMS, root mean square error; SD, standard deviation; SMBG, self-monitoring of blood glucose; Var(y), variance of the variable y.
Declaration of Conflicting Interests
The author(s) declared no potential conflicts of interest with respect to the research, authorship, and/or publication of this article.
Funding
The author(s) disclosed receipt of the following financial support for the research, authorship, and/or publication of this article: Biomedical Informatics Consultants, LLC, Potomac MD, USA.