
Abstract
Background:
Continuous glucose monitoring (CGM) devices measure interstitial glucose concentrations (normally every 5 minutes), allowing observation of glucose variability (GV) patterns during the whole day. This information could be used to improve prescription of treatments and of insulin dosages for people suffering diabetes. Previous efforts have been focused on proposing indices of GV either in time or glucose domains, while the frequency domain has been explored only partially. The aim of this work is to explore the CGM signal in the frequency domain to understand if new indexes or features could be identified and contribute to a better characterization of glucose variability.
Methods:
The direct fast Fourier transform (FFT) and the Welch method were used to analyze CGM signals from three different profiles: people at risk of developing type 2 diabetes (P@R), T2D patients, and type 1 diabetes (T1D) patients.
Results:
The results suggests that features extracted from the FFT (ie, the localization and power of the maximum peak of the power spectrum and the bandwidth at 3 dB) are able to provide a characterization for all the three populations under study compared with the Welch approach.
Conclusions:
Such preliminary results can represent a good insight for futures investigations with the possibility of building and using new indexes of glucose variability based on the frequency features.
Keywords
The use of continuous glucose monitoring (CGM) devices is a relatively new approach in the management of patients with diabetes. These devices measure interstitial glucose concentration continuously (normally every 5 minutes) over a period of 7 days.1,2 They are used both in open-loop—eg, to detect hypo/hyperglycemic events3,4—and closed-loop modalities—as a key element for artificial pancreas devices.5-7 The analysis of CGM data allows obtaining more detailed information on glucose variability (GV) patterns during the whole day, for example by highlighting unhidden excursions of hyperglycemia, hypoglycemia, pre/postprandial and before-sleep glucose measurements. This information can be used to improve prescription of treatment and insulin dosages.8-10 In a recent literature research, it was highlighted that many works are focused on the use of the CGM signal identifying indexes to characterize GV. 11 The assessment of GV is important, since it has been proved that abnormal GV could be a risk factor for the development of microvascular complications in diabetes patients. 12 However, a golden standard for GV metric is not available. Tens of GV indices have been proposed in the literature, mainly focused on the evaluation of GV either in time or glucose domains, while the frequency domain, which intuitively seems to be the most related to the concept of variability, has been partially explored. Miller and Strange 13 applied Fourier transform to CGM data of T1D subjects, showing that the frequency domain allows for noise and dimension reduction without loss of relevant information. Breton et al 14 focused on harmonic decomposition, always on T1D subjects, analyzing the frequency content of glucose signal, observing presence of different dynamics between blood and interstitial glucose and consequent need for accuracy studies of CGMS. When looking for studies not using CGM, we have found only a few that analyzed the frequency domain on different target groups using BG samples, in hospitalized subjects,15,16 plasma glucose,17,18 presenting promising but isolated results in terms of explanation of unknown mechanisms of blood glucose regulation.
The aim of this work is to explore the characterization of CGM signal in the frequency domain to understand if new indexes or features could contribute to a better characterization of GV. In particular, a direct fast Fourier transform (FFT) and the Welch method were applied to extract a set of features (frequency and power of the maximum and second peaks, bandwidth using a 3dB threshold as well as the frequency at which the 75% of the signal power is concentrated), using datasets from three different populations, that is, type 1 diabetes mellitus (T1D), type 2 diabetes mellitus (T2D), and people at risk (P@R) of T2D.
Methods
Data Collection
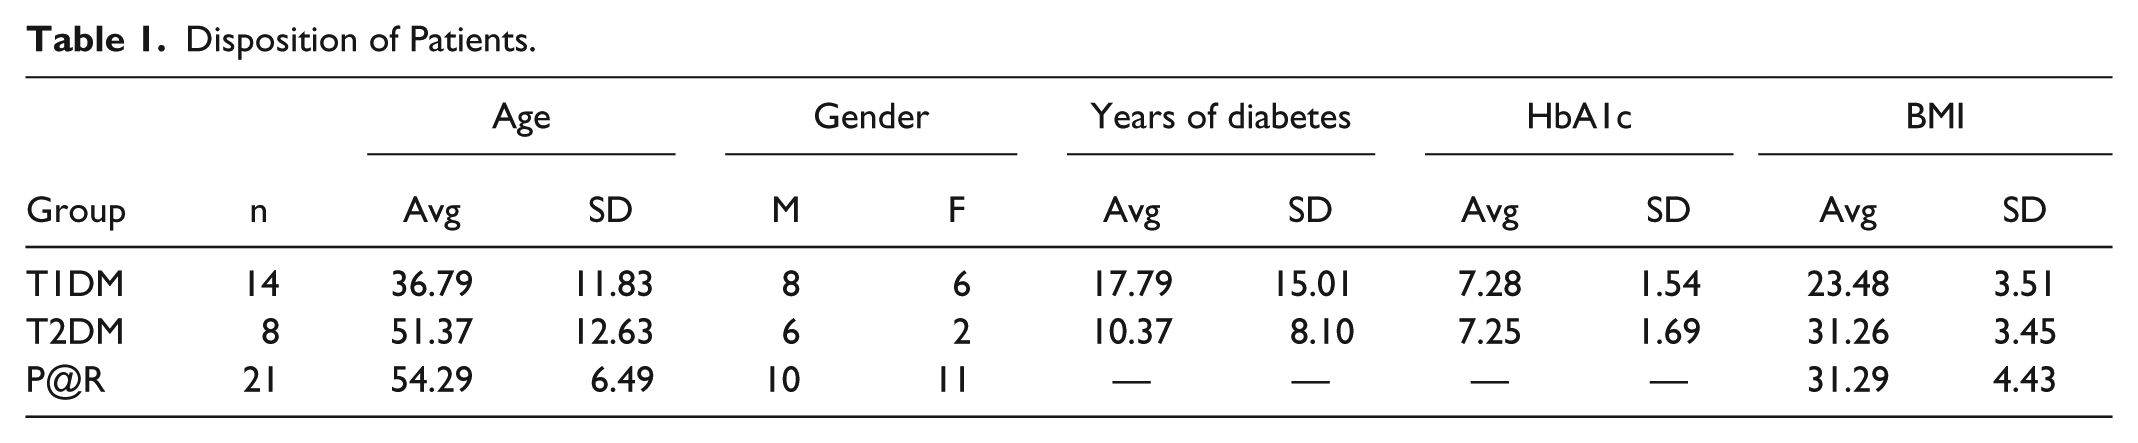
Three different populations have been included in this study: patients suffering T1D, T2D, and P@R of developing T2D. The demographic profile of the subjects are described in Table 1. These subjects have been monitored with CGM in the framework of two research studies, METABO and Healthy Breakfast. The Healthy Breakfast was funded by the Spanish Agency of Health Research Instituto de Salud Carlos III (PI09/90178). It consisted of a tolerance test with a standard breakfast food versus classic test of oral glucose tolerance in people with high risk of developing T2D. A subgroup of these subjects (n= 50) was monitored with CGM. They were people without the presence of Diabetes, not under pharmacological treatment. METABO was an EU research project (EU-FP7-ICT-2007-1- 216270) aiming at designing, building and testing a technological platform to monitor glucose values and lifestyle/pharmacological factors affecting blood glucose concentrations in patients with diabetes mellitus in real-life situations to provide structured information and therapeutic decision support to patients with diabetes and their care givers. A small pilot study was carried out to validate the IT platform developed in the project. The aim of this study was to provide an explanatory analysis of the usability of the METABO system and its acceptability by the patient, and its impact on clinically relevant parameters in patients with type 1 and 2 of diabetes (in both cases without the presence of important complications), in comparison with the standard diabetes care (without the use of METABO) for four consecutive weeks. All subjects (n = 51) were monitored at baseline with CGMS. The subjects included in METABO study were patients with diabetes type 1 or type 2, diagnosed following American Diabetes Association criteria, BMI < 35 kg/m2, both genders, age ≥ 18 years, HbA1c < 9% (based on the latest available laboratory exams within the last 6 months), with absence of significant micro- and macro-vascular complications and a variety of drug therapy including low-acting insulin, fast-acting insulin, and oral antidiabetic medications. Exclusion criteria were age < 18 years, gestational diabetes or other forms of diabetes not included in the inclusion criteria, severe, chronic concomitant diseases that are invalidating or life-threatening (ie, acute or chronic inflammatory or autoimmune diseases, chronic treatment with systemic corticosteroids, psychiatric diseases or low-compliance conditions), pregnant or lactating women, women willing to become pregnant during the study period or carrying childbearing potential without adequate contraceptive measures (based on investigator’s judgment).
Disposition of Patients.
In both cases the datasets consist of CGM time-series collected for an average period of six days under normal life conditions using the Medtronic® Guardian REAL-Time® CGM System (Medtronic, Northridge, CA).
From these datasets, only subjects with at least 1 day of data were included, to have all the “potential” variations that could take place at least in 24 hours (eg, sleeping, breakfast, lunch, dinner, etc). Nevertheless, we were not excluding the patient if this day could be gathered by joining different windows of time from different days. Twenty-one subjects were included from the Healthy Breakfast study, while 26 were from METABO: it is important to highlight that among the T2D individuals of the METABO dataset, only individuals that were insulin dependent fulfil this criteria.
Frequency Domain CGM Analysis
Two different approaches to study the CGM signal in the frequency domain were followed. The first one was the Fourier Transform, which, in our case, decomposes a time-based function (ie, the CGM signal) into a set of frequencies. More specifically, and since our original input signal was not continuous (according the continuous signal definition) but a discrete sequence, a discrete Fourier transform was employed, computed using the FFT method (MATLAB R2014b).
The second approach is based on the Welch’s method, which provides estimates of the spectral density of a signal, making use of a periodogram. The advantage of using this method consists in the reduction of noise although it leads to a worsening of the frequency resolution.
Several features both from the FFT signal and from the Welch signal were extracted. The general scheme of signal processing followed is described in Figure 1. Starting from the temporal CGM signal, the continuous component was removed, then the FFT and the Welch methods were applied.
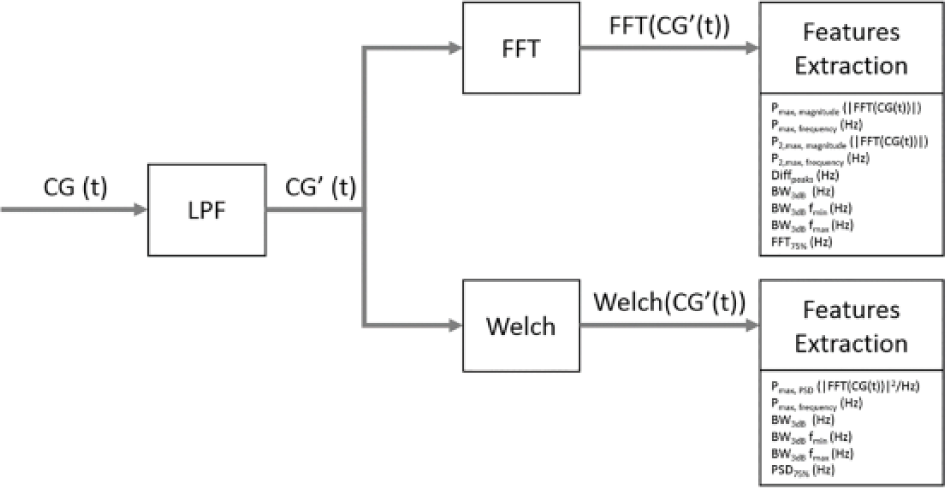
Overview of the signal processing for the CGM signal.
The features extracted are the following:19-21
Fast Fourier transform Pmax, magnitude (|FFT(CG(t))|)—Maximum peak on the magnitude of the continuous glucose signal Pmax, frequency (Hz)—Frequency at which the maximum peak on the magnitude of the continuous glucose signal is located P2,max, magnitude (|FFT(CG(t))|)—Second maximum peak on the magnitude of the continuous glucose signal P2,max, frequency (Hz)—Frequency at which the second maximum peak on the magnitude of the continuous glucose signal is located Diffpeaks (Hz)— The difference between the frequencies at which the maximum peak and the second maximum peaks of the magnitude signal of the continuous glucose signal are located BW3dB (Hz)—The difference between the upper and lower frequencies of the band where the magnitude signal is located using a threshold of 3dB BW3dB fmin (Hz)—The lower frequency of the BW3dB BW3dB fmax (Hz)—The upper frequency of the BW3dB FFT75% (Hz)—Frequency at which the 75% of the magnitude signal is included
Welch method Pmax, PSD (|FFT(CGMS)|2/Hz)—Maximum peak on the power spectrum density (PSD) signal Pmax, frequency (Hz)—Frequency at which the maximum peak on the PSD signal BW3dB (Hz)—The difference between the upper and lower frequencies of the band where the PSD is located using a threshold of 3dB BW3dB fmin (Hz)—The lower frequency of the BW3dB BW3dB fmax (Hz)—The upper frequency of the BW3dB PSD75% (Hz)—Frequency at which the 75% of the PSD signal is included
Figure 2 shows the pattern found for the FFT and Welch methods as well as the graphical representation of the features extracted from them.
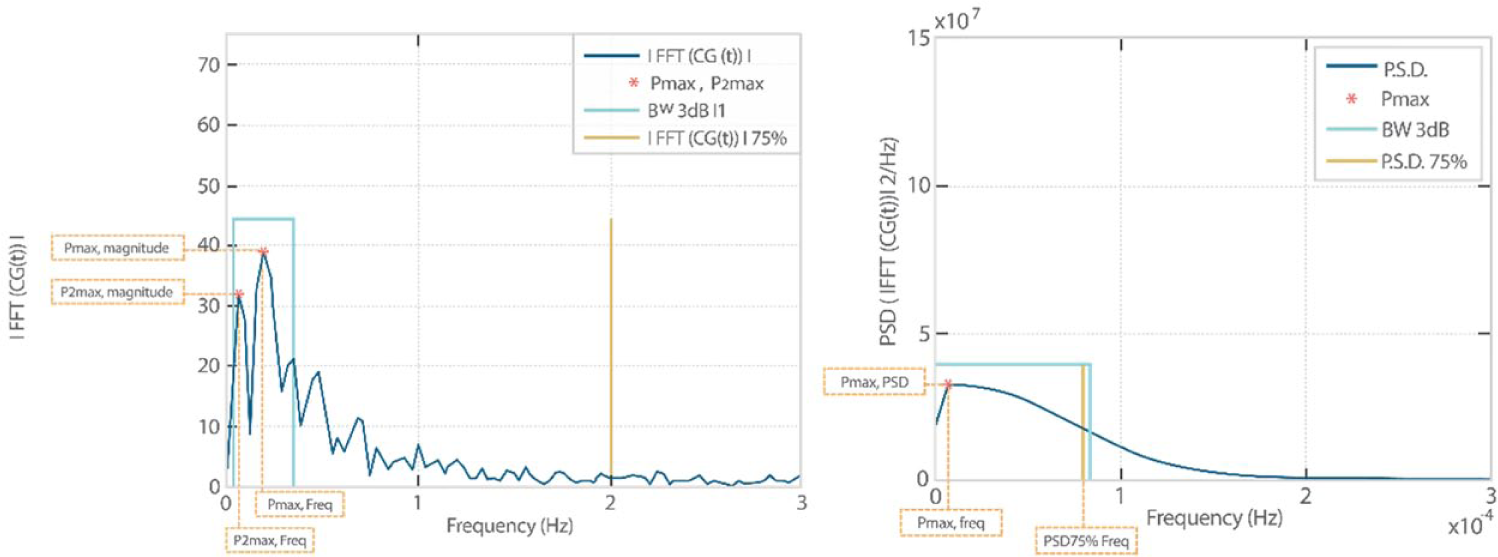
Example of graphical representation of the frequency features extracted for the FFT (left) and Welch (right) methods: Pmax, P2,max, BW3dB for the FFT methods; Pmax, BW3dB, DSP75% for the Welch method.
As previously mentioned, the Welch method reduces the noise in the estimated power spectra in exchange for reducing the frequency resolution, so that the spectral curve resulting from the implementation of the Welch method is smoother and presents a single peak, while the spectrum generated by the application of FFT is a curve with very pronounced slopes and composed of several signal peaks. For this reason, the FFT’ spectrum features are Pmax and P2,max, while the Welch’ spectrum feature is only Pmax, that is, the maximum value of the generated function. From these parameters two indexes have been identified, the PSD and the frequency.
In the FFT, another index was derived, that is, the difference between Pmax and P2,max (Diffpeaks). This parameter was used to observe if the PSD is concentrated on a narrow frequency range or if it is uniformly distributed along the whole spectrum.
The BW3dB is a measure of the difference between two frequency points (fmin and fmax) where a decrease in 3dB with respect to the value of Pmax is observed. This parameter can be applied to both FFT and Welch methods.
Finally, the PSD75% parameter was obtained (by adding power densities at the different frequencies of the spectrum starting from 0 Hz), it is the frequency at which 75% of the sum of all values of PSD is exceeded. Therefore, this parameter provides an overview of the concentration of PSD at low frequencies of the signal.
Results
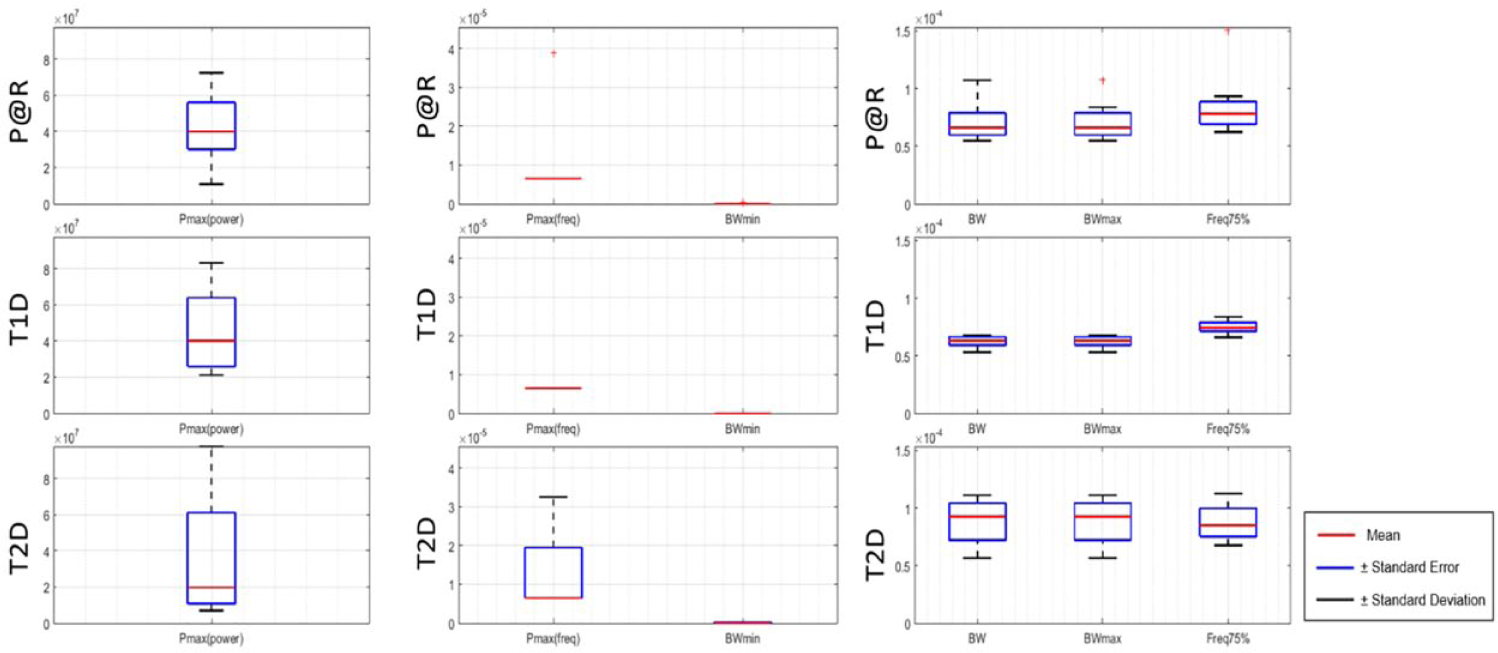
In Figure 3, the boxplots of the FFT features for each subjects’ group are shown. The average values of each feature are shown in Table 2, together with the t-test confronting the features between the different groups of subjects involved in the study. The highlighted values correspond to the results that fulfill the condition P < .05, used as probability value and the test criterion for all groups.
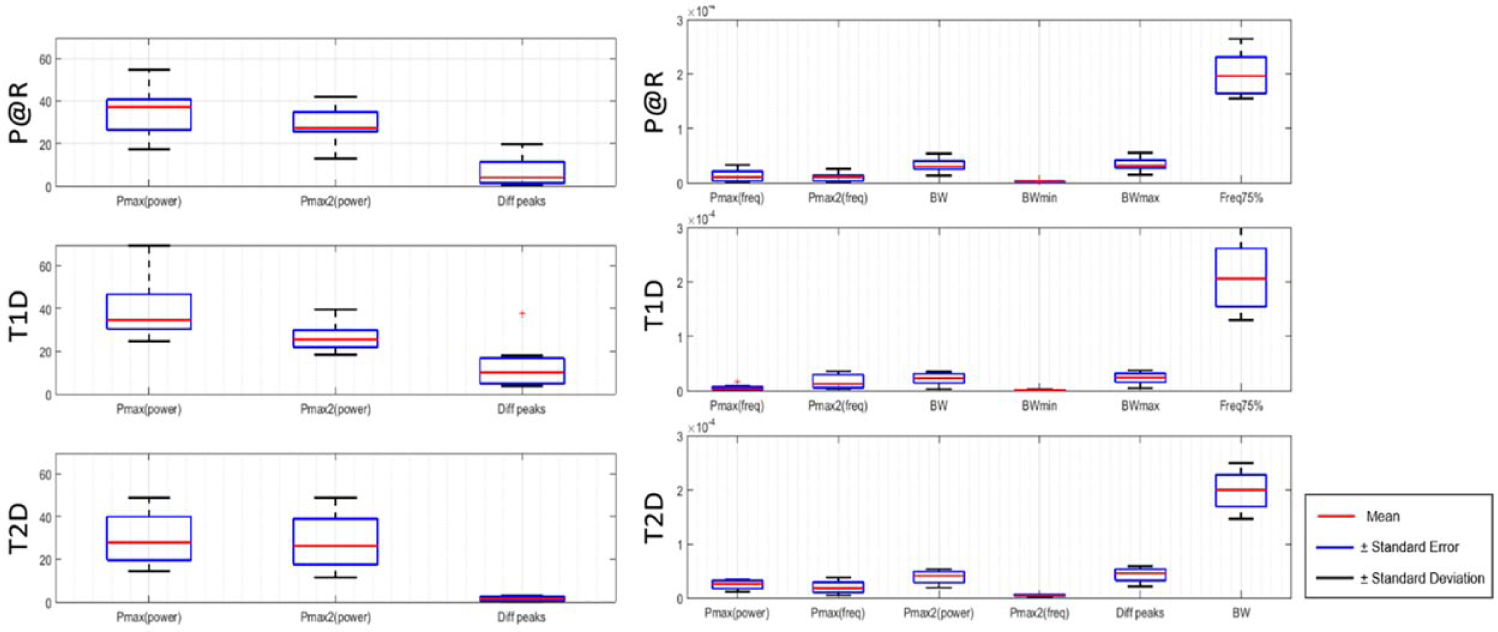
Boxplots of the frequency features extracted from the FFT signal for each subjects’ group (P@R, T1D, and T2D).
Average Values of Each Feature Extracted From the FFT Signal Aggregated by Subject Groups and Result of the t-Test Comparing the Values of the Different Groups.
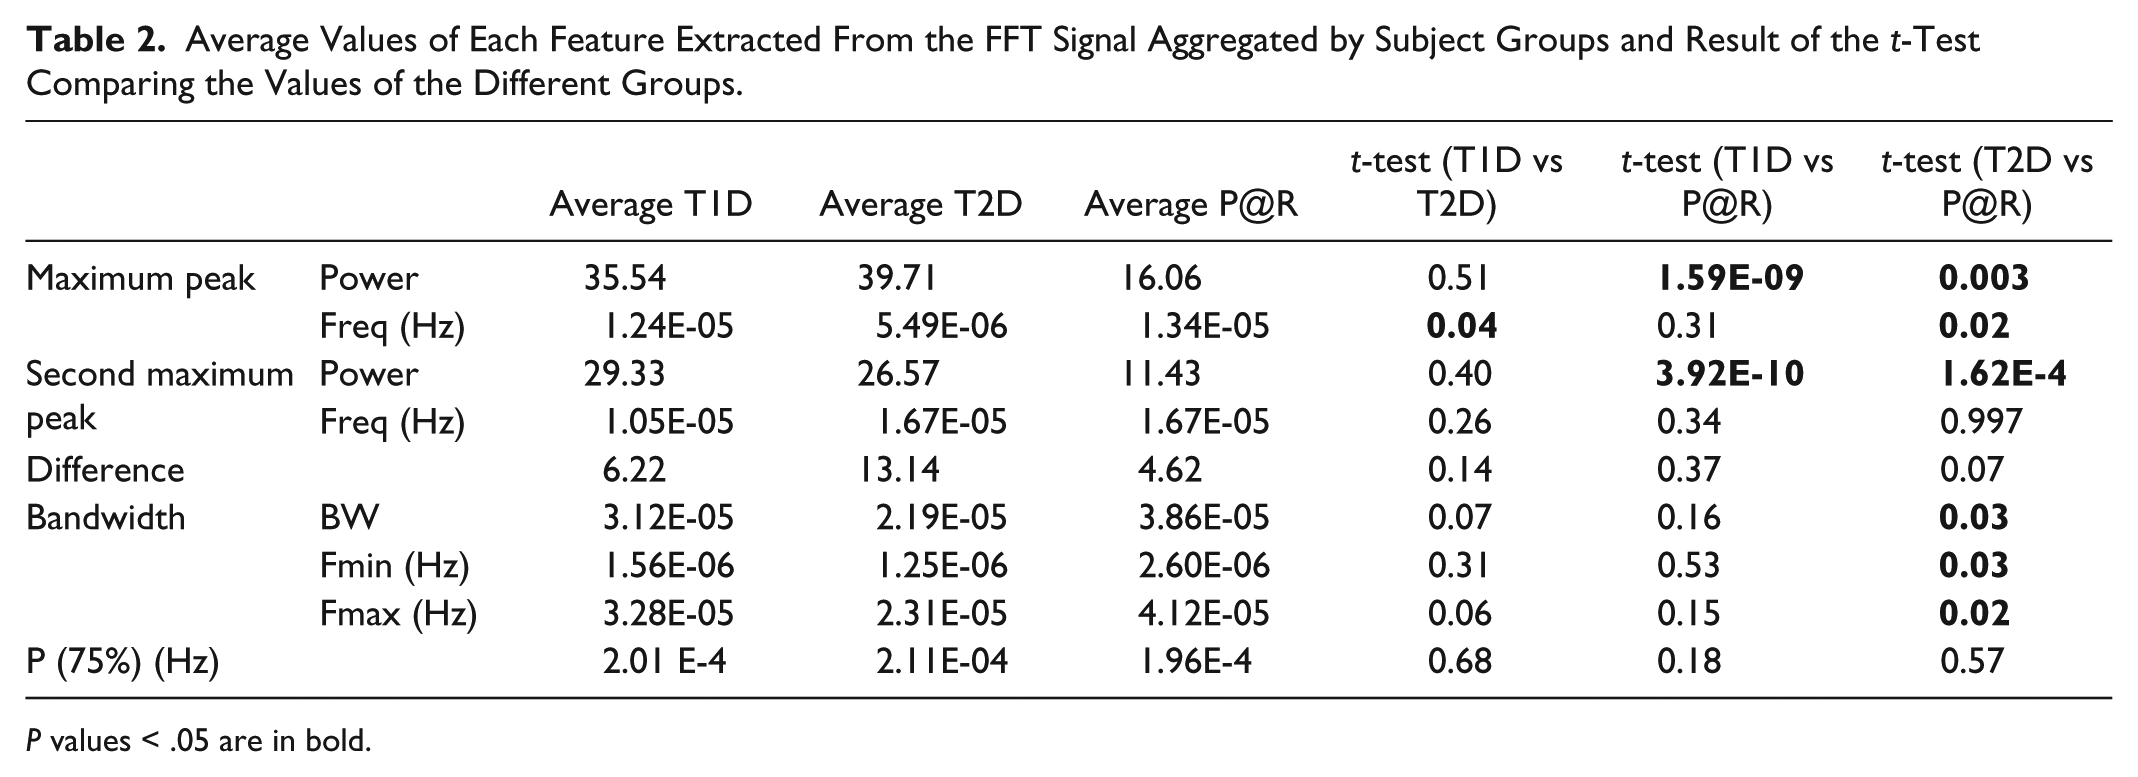
P values < .05 are in bold.
In T1D subjects, the glucose signal is characterized by: maximum peak at 1.24E-05 Hz, which corresponds to a period of 22.33 hours; a second peak at 1.05E-05 Hz, which corresponds to a period of 26.55 hours; the 3dB band ranges from 1.56E-06Hz to 3.28E-05Hz; and the frequency at which the 75% of the total power is reached is 2.01E-04 Hz (period of 1.4 h).
As regards T2D subjects, the average maximum peak was found at 5.49E-06 Hz (50.56 hours); the second largest peak was found at 1.67E-05 Hz, which corresponds to a period of 16.65 hours; the distance, in terms of frequency, between the first and the second peak is greater than in T1D subjects (13.14 Hz in T2D vs 6.22 of T1D), the 3dB band ranges from 1.25E-06 Hz to 2.31E-05Hz; and the frequency at which the 75% of the total power is reached is 2.11E-04 Hz (period of 1.31 h).
Finally, the average frequency of the higher peak for P@R was 1.34E-05 Hz (20.71 hours), while the second one was 1.67E-05 Hz with an average difference between both peaks of 4.62 Hz, the lowest value among the three groups. The 3dB bandwidth ranges from 2.60E-06 Hz to 4.12E-05 Hz, which apparently shows a shift to higher frequencies compared with the previous ones.
As regards the Welch approach, results are shown in Figure 4 and Table 3.
Boxplot with the frequency features extracted from the Welch processing outcome and aggregated by subjects’ group.
Average Values of Each Feature Extracted From the Welch Signal Aggregated by Subject Groups and Result of the t-Test Comparing the Values of the Different Groups.
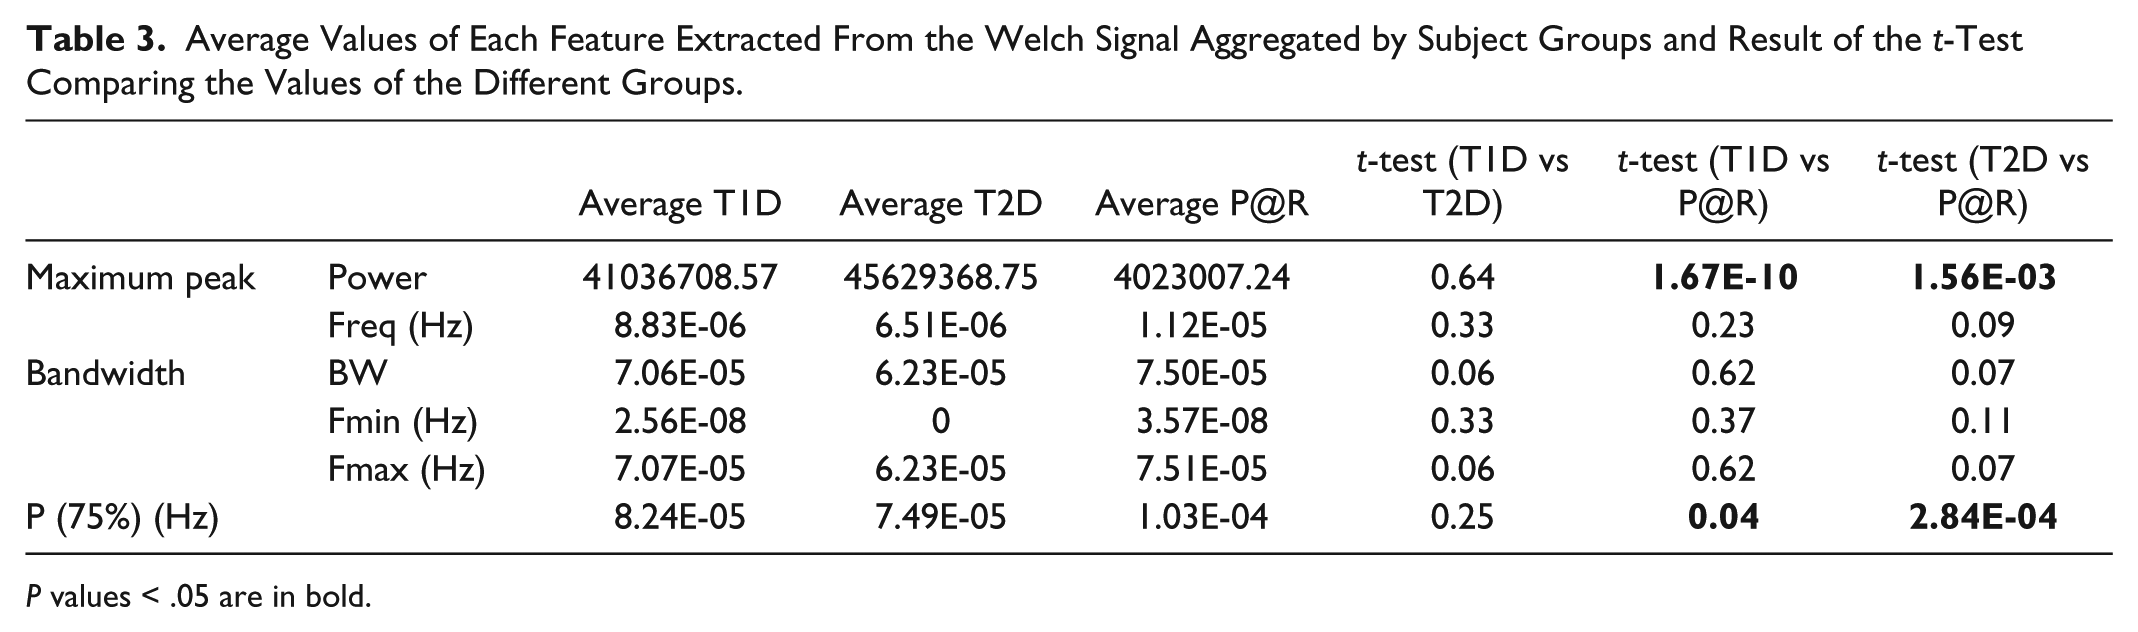
P values < .05 are in bold.
The average values for the frequency of the first peak are 8.83E-06 Hz (31.34 hours) for T1DM, 6.51E-06 Hz (42.66 hours) for T2D and 1.12E-05 Hz (24.88 hours) for P@R. As regards the bandwidth, it ranges from 2.56E-08 Hz to 7.07E-05 Hz for T1D subjects, from 3.57E-08 Hz to 7.51E-05 Hz for T1D subjects, and from 0 Hz to 6.23E-05 Hz for P@R subjects, the latter seeming to show a shift on the bandwidth to lower frequencies respect to the other two groups. Finally the frequency at which the 75% of the signal power is located was found to be 8.24E-05 Hz for T1D, 7.49E-05 Hz to T2D and 1.03E-04 Hz to P@R. Thus, even when P@R showed the higher peak at the lowest frequency the power spectrum of the signal is more spread along the frequencies presenting a value which is much higher than the aggregated values of the other two groups. Values in bold are those where the P value < .05 on the groups comparison with the t-test.
As regards difference between T1D and T2D, the only parameter that significantly increases is the frequency of the maximum peak, which in average passes from 1.24E-05 Hz to 5.49E-06 Hz. This means that, at least in terms of frequency analysis, glucose signals in the two populations are similar except that in T1D the most relevant component presents a time period of about 22.4 hours, while in T2D the most relevant component has a time period of about 50.56 hours. This could mean that the T1D patient repeats almost each day the same actions (daily routine) because of a more strict therapy, while in T2D the presence of a daily routine is not so evident.
As regards T1D vs P@R, differences were found in the power of the first and second peaks, where T1D subjects have higher values (35.545 against 39.714 and 29.326 against 26.574 respectively).
When it comes to T2D vs P@R, several differences were observed: the magnitude of the maximum peak was significantly lower, while the frequency was significantly greater. This could mean that the most important component of the glucose signal has a lower period (close to 24 hours instead of 50 hours) but less frequent with respect to others (lower magnitude). The frequency of the second peak was similar, while the magnitude was significantly lower in P@R. As regards the 3db band, we can observe that the band in which the most important components are contained changes significantly. In fact, both maximum and minimum frequencies increase, meaning that, compared to T2D, P@R presents in general higher frequencies.
Again, by performing a t-test between the values of the different groups, some differences between the features extracted were found. However, the Welch effect (the integration of different signals) seems to lose some of the details that we found in the FFT, for example the information about the second peak. Nevertheless, the P(75%) appears in this case as a useful feature for the comparison.
In this case, no significant differences were found between the T1D and the T2D groups. By confronting these two groups with the P@R, two remarkable differences were found, the first one regarding the power of the main peak, in this case the power of the peak from the P@R population was found lower than the one in the T1D and the T2D in the case of the P(75%) the value of the P@R shows a significant higher value than in the T1D and T2D populations. Thus, the Welch spectrum of the P@R seems to be more spread along the frequencies of the spectrum while in the case of T1D and T2D the spectrum is more concentrated on a lower band.
Discussion
In this research work we have explored the potential of using the frequency domain to gain new insights in the characterization of GV. To date, a golden standard to characterize GV with an optimum set of indexes does not exist. The frequency domain has been not explored sufficiently and we strongly believe that it is worth to analyse this domain. The availability of CGM data is going to increase, several companies are starting to produce this kind of devices and sell it at very low cost price. This could lead to scenarios where CGM signals and GV may play a similar role that electrocardiogram and hearth rate variability do for cardiovascular diseases. As such, this information is going to be available not only from people suffering T1D, but also from T2D, P@R and even healthy subjects. The aim of this study was to understand if features that can be extracted from the frequency domain of CGM data could be used to discriminate between individuals belonging to different classes (T1D, T2D, P@R). We wanted just to evidence that also the frequency domain should be explored in this proof-of-concept study. Clinical practical applications of this work could be several, for example, these frequency domain indices could be added to the standard pool of GV indices to improve the classification of the glucose control of a patient with diabetes. However, future work is needed to build on our preliminary results. Future directions will be to gather data from more individuals within each group. This especially applies to T2D because, even if interesting indication can be drawn, the number of individuals was very limited.
Conclusion
This work aimed at exploring the potential of the frequency analysis for the characterization of the CGM signal. As a preliminary analysis, it was found that significant differences exist in frequency features extracted from both the FFT and Welch between the population at risk of developing diabetes and groups of patients with diabetes (T1D and T2D).Apparently, the FFT method provides more information than the Welch one as, by definition, the Welch method integrates together different signals and removes some of the details presented in the FFT. Nevertheless, that integration reinforces the differences between two features of the Welch method, the power of the main peak and the P(75%), which showed a good ability to differentiate subjects at risk of developing diabetes from the population with diabetes.
As regards the FFT method, the main and the second peaks provided information to differentiate these two populations, as well as the features related with the bandwidth (width and maximum and minimum frequencies). The power of the main and second peaks showed also significant differences between the T1D and P@R groups and finally, the frequency of the main peak was the only feature that showed a significant difference between the T1D and T2D groups.
Hence, frequency features, particularly those extracted from the FFT showed their ability to discriminate between the population at risk of developing diabetes and populations with diabetes. Also, some features suggested their potential to differentiate between populations of patients with diabetes (T1D and T2De). Further work should be done to verify these preliminary insights on larger datasets; to make our results more effective and robust, the possibility of building new index of glucose variability based on the frequency features will be explored.
Footnotes
Abbreviations
BW, bandwidth; CGM, continuous glucose monitoring; dB, decibel; FFT, fast Fourier transform; GV, glucose variability; Hz, hertz; PSD, power spectrum density; T1D, type 1 diabetes mellitus; T2D, type 2 diabetes mellitus.
Declaration of Conflicting Interests
The author(s) declared no potential conflicts of interest with respect to the research, authorship, and/or publication of this article.
Funding
The author(s) disclosed receipt of the following financial support for the research, authorship, and/or publication of this article: This work was funded by the MOSAIC project (Funded by the European Commission under the FP7 Programme, project reference 600914).