
Abstract
Introduction:
Hyperglycemia following meals is a recurring challenge for people with type 1 diabetes, and even the most advanced available automated systems currently require manual input of carbohydrate amounts. To progress toward fully automated systems, we present a novel control system that can automatically deliver priming boluses and/or anticipate eating behaviors to improve postprandial full closed-loop control.
Methods:
A model predictive control (MPC) system was enhanced by an automated bolus system reacting to early glucose rise and/or a multistage MPC (MS-MPC) framework to anticipate historical patterns. Priming was achieved by detecting large glycemic disturbances, such as meals, and delivering a fraction of the patient’s total daily insulin (TDI) modulated by the disturbance’s likelihood (bolus priming system [BPS]). In the anticipatory module, glycemic disturbance profiles were generated from historical data using clustering to group days with similar behaviors; the probability of each cluster is then evaluated at every controller step and informs the MS-MPC framework to anticipate each profile. We tested four configurations: MPC, MPC + BPS, MS-MPC, and MS-MPC + BPS in simulation to contrast the effect of each controller module.
Results:
Postprandial time in range was highest for MS-MPC + BPS: 60.73 ± 25.39%, but improved with each module: MPC + BPS: 56.95±25.83 and MS-MPC: 54.83 ± 26.00%, compared with MPC: 51.79 ± 26.12%. Exposure to hypoglycemia was maintained for all controllers (time below 70 mg/dL <0.5%), and improvement came primarily from a reduction in postprandial time above range (MS-MPC + BPS: 39.10 ± 25.32%, MPC + BPS: 42.99 ± 25.81%, MS-MPC: 45.09 ± 25.96%, MPC: 48.18 ± 26.09%).
Conclusions:
The BPS and anticipatory disturbance profiles improved blood glucose control and were most efficient when combined.
Keywords
Introduction
Preventing hyperglycemia following eating is still a persistent issue for people with type 1 diabetes (T1D), even while using an automated insulin dosing (AID) system which delivers insulin variably based on an internal closed-loop algorithm. 1 The unwanted increase in plasma blood glucose (BG) following eating for people with T1D is primarily a result of the dynamics associated with subcutaneously injected insulin and ingested carbohydrates. Currently available subcutaneous insulin analogs have slower time constants than consumed carbohydrates, thus necessitating the use of feedforward control to prevent hyperglycemia. Anticipation and automatic bolusing in an advanced control system framework have proven to compensate for the inherent absorption delay from current insulin analogs. 2 In this contribution, we designed an in silico experiment using real-world eating behavior to contrast the impact of an automatic bolus priming system (BPS) and anticipatory glycemic disturbance profiles in our control system.
Fully Closed-Loop AID
Several AID systems that do not require users to input meal amounts have been tested. In 2014, Harvey et al evaluated a fully closed-loop (FCL) AID system on 12 adult participants with T1D in an inpatient clinical trial. 3 Overall, this system produced glycemic control with 80% of all BG readings in the 70- to 180-mg/dL range (time in range [TIR]) but caused high postprandial glucose values following unannounced meals. Forlenza et al presented the performance of an FCL that preempts predefined postprandial excursions in a 72-hour hotel-based study, reporting a TIR of 63.6 ± 9.2%. 4 However, in the four hours following unannounced meals, the time above range (>180 mg/dL, TAR) was 60.9 ± 23.3%. A recent study by Dovc et al used two formulations of insulin, FIASP and aspart, in a 27-hour inpatient admission study of their FCL AID system, 5 reporting TIR of 53.3% and 57.9% for aspart and FIASP insulins, respectively. Their approach relied on a meal detection algorithm but similarly faced difficulty with unannounced meals. Multihormone approaches have reported better performances, with recent early outpatient results. 6 In 2021, Haidar et al conducted a 30-participant open-label crossover trial and showed that an AID system using simple meal announcements and empagliflozin was noninferior to a hybrid system with meal announcements (mean BG: 153 ± 25.2 vs 153 ± 27.0 mg/dL). 7 Majdpour et al demonstrated the noninferiority of an insulin-pramlintide FCL AID to a hybrid AID (TIR: 81% vs 83%) in another 2021 pilot study. 8
Cameron’s 2012 manuscript describes a methodology for an AID system that uses multiple BG prediction models, each informed by different disturbances. 1 When the system determines that one disturbance is more likely, additional weight is given to that model’s predictions. In addition, information was included regarding the likely timing of meal disturbances based on normal mealtimes, the time of the last meal, and sleep schedule. Using this approach, Cameron et al were able to reduce the two-hour prediction error by 45% without meal detection and 18% with meal detection. The three-hour prediction error was reduced by 60% without meal detection and 30% with it.
Cameron et al extended these findings in a 2014 clinical trial. 2 The so-called multiple model probabilistic controller (MMPC) was used by ten patients in an inpatient study where they consumed five unannounced meals. For the six patients who used the final version of the controller, the mean continuous glucose monitor (CGM) TIR was 78%. During the admission, there was only one controller-induced hypoglycemia.
The MMPC was evaluated on ten patients in an inpatient clinical study where the mean TIR was 142 mg/dL overall and 125 mg/dL overnight. 3 A different version of the algorithm that was tested in a hotel-based study with 15 subjects achieved an overall mean BG of 152 mg/dL and a mean overnight BG of 139 mg/dL.
Use of Behavioral Patterns to Anticipate Glycemic Disturbances
Several simulation and clinical experiments conducted by our group have shown how anticipatory profiles integrated into AID systems can reduce the unwanted effects of glycemic disturbances. Simulation experiments have demonstrated that multistage model predictive controllers (MS-MPC) informed by disturbance profiles to anticipate moderate exercise’s effects can reduce hypoglycemia,9 -11 results that were later confirmed in a randomized crossover clinical trial with 15 adult participants: 12 There were fewer hypoglycemic events (9 vs 33), and the percent time where BG was <70 mg/dL (time below range [TBR]) was 1.3% lower while the participants used the MS-MPC system compared with a well-tuned standard MPC. The overall reduction in hypoglycemia resulted in no significant increase in TAR.
We also demonstrated in silico the capacity of the MS-MPC framework to anticipate glycemic disturbances caused by meals. 2 In that work, disturbance profiles were generated from a representative real subject and then used to perform closed-loop experiments using the 100 adult cohort of the University of Virginia (UVA)/Padova simulator. Results showed an average increase in TIR of 1.6% when using a hybrid closed-loop approach and 16.4% when using an FCL approach.
Our goal in this work is to build upon our past experiences and further study the impact of automated priming bolus and disturbance anticipation using the MS-MPC framework. To test the effects of each component of the control system, we implemented a 2 × 2 experimental design (each module on or off) resulting in four treatment strategies: model MPC, MS-MPC, MPC + BPS, and MS-MPC + BPS.
Methods
Control Strategy
Our modular control strategy is depicted in Figure 1 below. Within our legacy modular architecture (ie, data management, safety system module, autocorrection, state estimation), we consider four different combinations of modules to reject large positive disturbances. Details of each module are provided below.
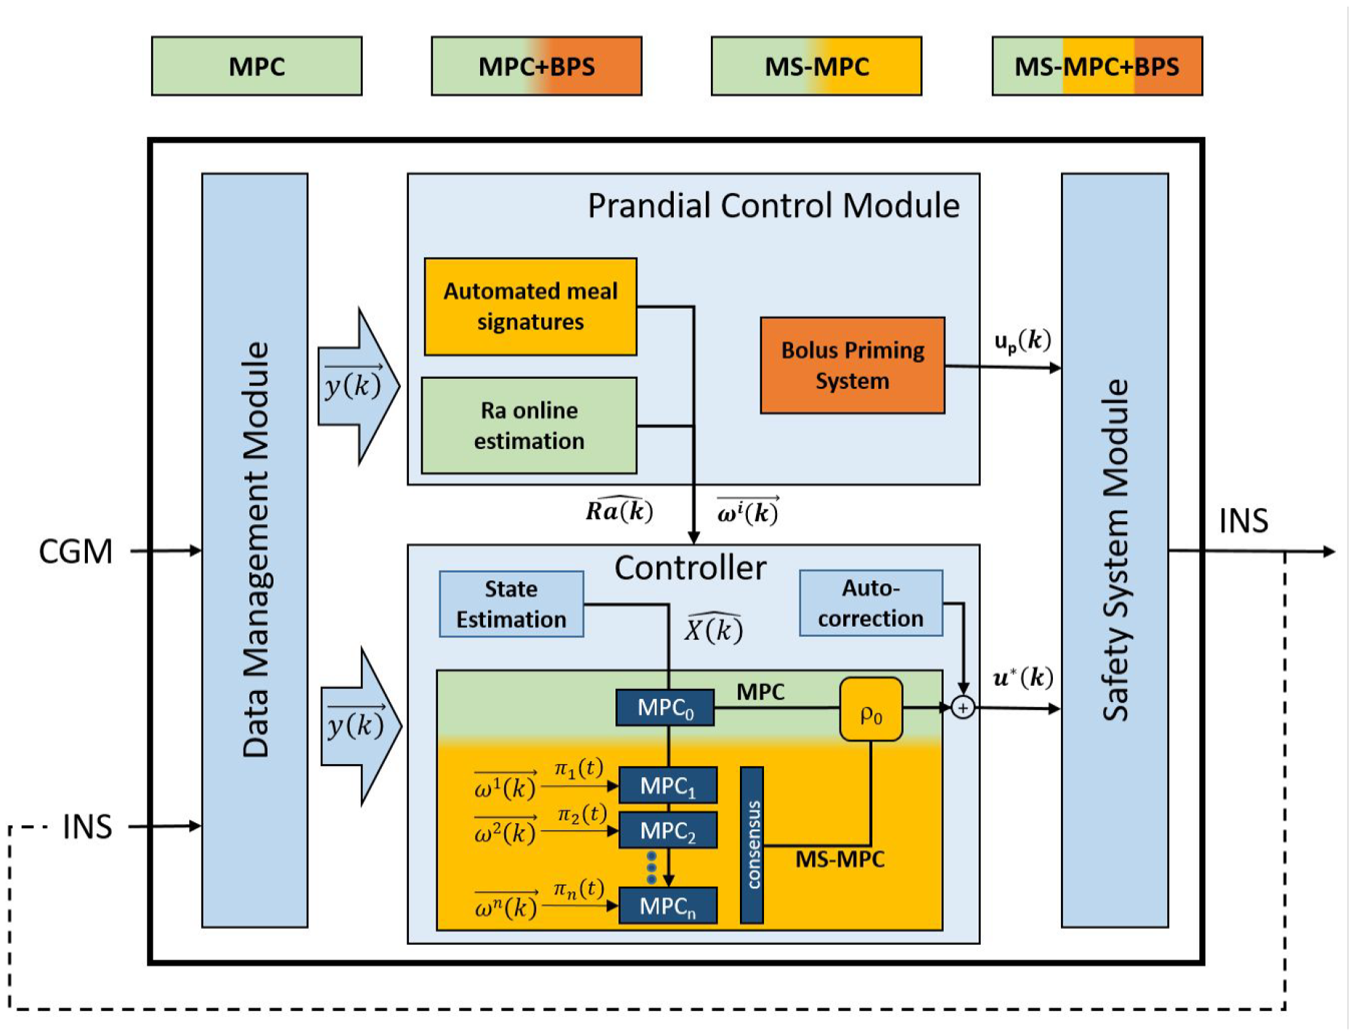
A schematic of the control strategies tested. System configurations range from a meal naive approach (MPC, green) to a meal anticipating system with priming boluses (MS-MPC + BPS, combination of green, yellow, and orange). Abbreviations: CGM, continuous glucose monitor; MPC, model predictive control; MS, multistage; BPS, bolus priming system.
Core controller
Rather than a single control strategy, MPC encompasses a general control paradigm; it integrates the predictions from an explicit mathematical model of the user’s glucose-related metabolic state within a real-time optimization problem that aims to find the best insulin injection subject to possible constraints over the model variables. In this setup, the MPC part commands optimized basal insulin injections through the pump every five minutes to reject internal metabolic disturbances. Multistage model predictive controller is a robust control strategy that considers N parallel MPC controllers, each perturbed by a particular disturbance realization. In this case, the disturbance realizations are composed of N different subject-specific disturbance profiles representing typical eating behavior. The final control action is reached after a consensus of the N controllers by the nonanticipatory constraint. 2
Bolus priming system
The BPS was designed to deliver doses of insulin that are comparatively higher than basal infusions when the probability of sizeable positive glycemic disturbance is elevated. This feedforward action is intended to work together with the feedback aspects of the controller to reduce postprandial BG excursions. At each five-minute interval, a second-order polynomial is fit on the last 30 minutes of CGM data using least squares regression. The coefficients of this equation roughly approximate the average value, first derivative, and second derivative of the most recent CGM values. These features are then used in a logistic regression-based disturbance detection algorithm.
The logistic regression coefficients were found by training a logistic regression classifier on a data set where 15 subjects using CGMs were observed but not supervised at home in a clinical trial data collection period based at UVA (NCT03394352). 13 In this data set, periods following meals were labeled in the positive class, and all other times were considered the negative class to train the classifier.
The output of the logistic regression, π
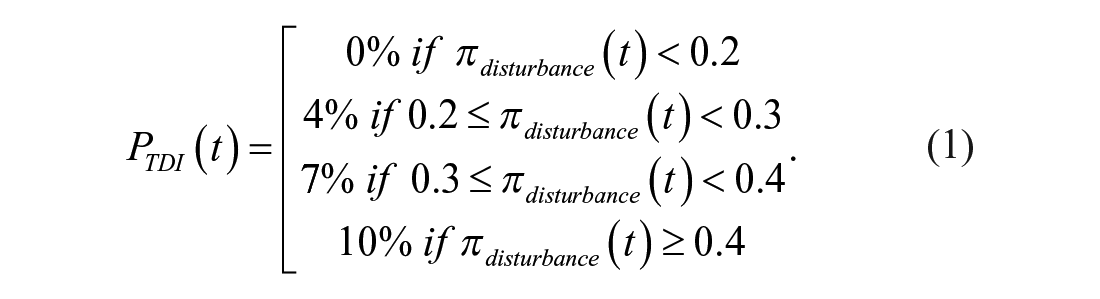
The BPS dose,

where
Subject-specific disturbance profile generation
To construct a manageable ensemble of disturbance profiles for the MS-MPC to anticipate, we need to reduce the current ensemble of
Historical disturbance estimation
Disturbance signatures,
Estimation of
Disturbance detection
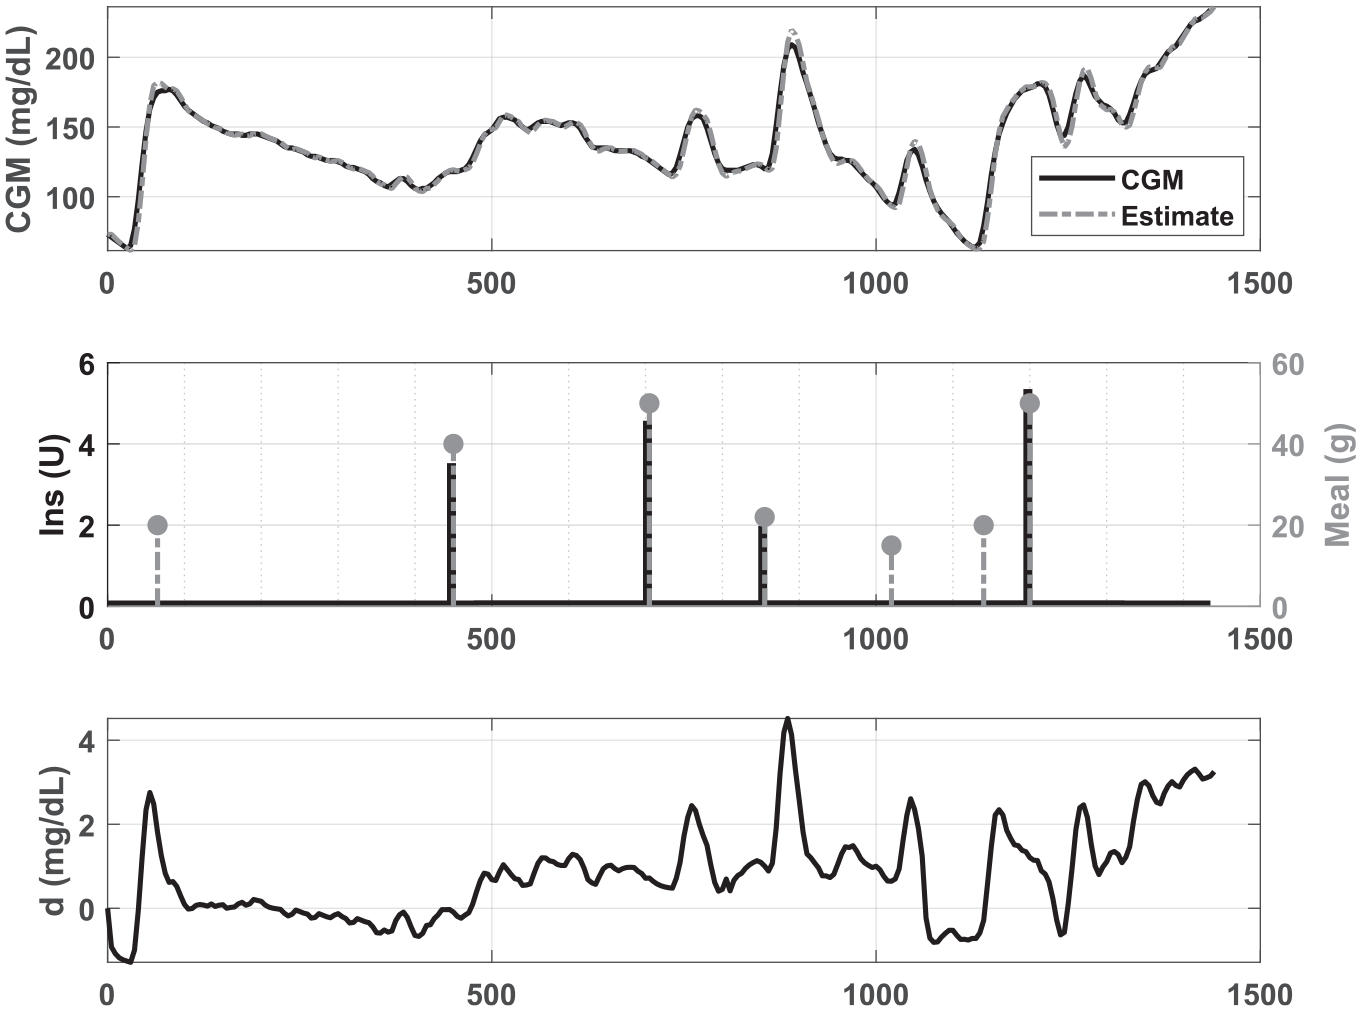
As records of meals would be absent in an FCL system, we reconstructed meal-like disturbances retrospectively from CGM and insulin data. To filter out any small deviation and focus on disturbances worth anticipating, we propose an automated disturbance detector using features characterizing the estimated disturbance values,
Once features were generated for each five-minute interval,
Disturbance profiles generation
Once major glycemic disturbances are detected, daily indicator signals are defined to group similar days into clusters (equal to one in the two hours following disturbance detections and zero otherwise). Using k-means with the hamming distance measure, these signals are clustered with

with
Weighting function for profile values.
We then estimate the prior probability value for each cluster, π

where
Figure 4 shows an example of one subject’s profiles. Here, it can be seen that this individual’s disturbance profiles are elevated following typical times for breakfast (6-8 am), lunch (12-2 pm), and dinner (6-8 pm). The associated prior probabilities indicate that this person eats earlier on 31% of days, and on 46% of the days of data used, the subject ate later. On 23% days, they had less of a discernable pattern of eating determined from their detected disturbances.
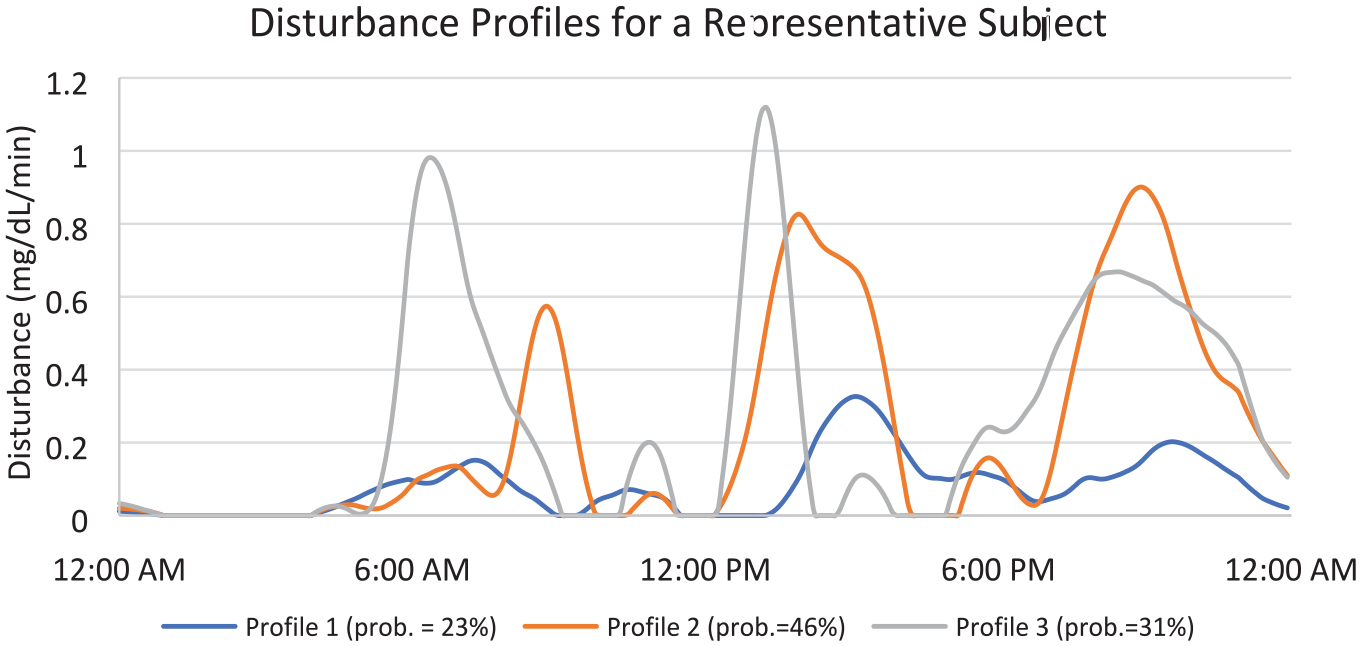
A representative subject’s profiles. Prior probabilities for each profile in legend.
Profile probability estimation for online MS-MPC weighing
The probability value of each profile is updated in real-time based on the current disturbance measurement, which was found using the same technique applied to the retrospective data. This probability, π
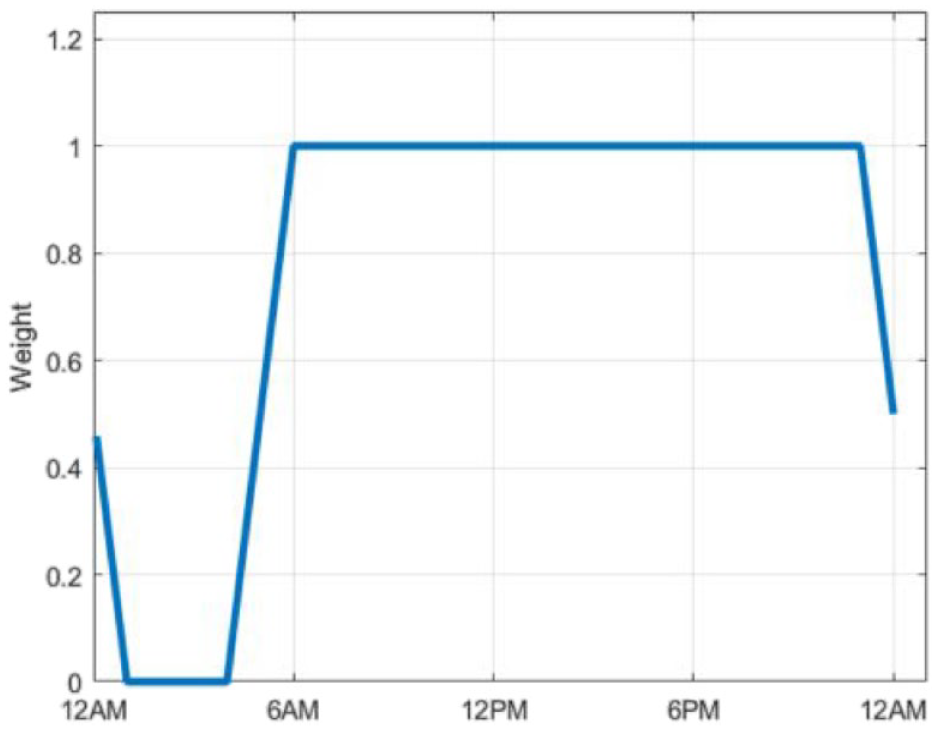
We further add a “night mode,” allowing the profile probabilities real-time estimates to reset back to their prior (so each day is not influenced by the previous one). From 11 pm to 1 am, the probabilities devolved linearly from the value before the beginning of night mode, π

For the,

Finally, to ensure that the currently observed disturbance is prioritized over anticipation of expected disturbances, all the profile probability values are scaled based on an index,

Experimental Design
Data collected during the unsupervised at-home portion of a large-scale pivotal trial conducted at UVA (NCT03563313) were used to evaluate this method. 19 These data are from 124 adult and adolescent participants with T1D over 6 months, during which they used an AID system with meal announcements. One hundred clinical subjects’ data were randomly selected and paired to an in silico subject in the UVA/Padova T1D simulator platform. 20 A total of 80% of the data were used to create meal profile clusters (see above). Seven days with at least one recorded meal were randomly selected from the remaining month of collected data. This week of meal record, scaled by the bodyweight, was then used as the meal protocol of the simulation experiment, which included intraday insulin sensitivity variability. 20 In this implementation of the simulation platform, circadian changes to insulin sensitivity and dawn phenomenon are simulated using subject-specific (ie, class-specific) time-varying profiles, which impacts endogenous glucose production and insulin-dependent glucose utilization. The use of real eating records allowed for more realistic behaviors in simulation and the existence of eventual meal patterns. This experimental configuration was then tested with the four configurations of the control system: MPC, MS-MPC, MPC + BPS, and MS-MPC + BPS. Treatments were compared overall and during the four hours after meals using the relevant metrics described by Maahs et al’s criteria for evaluating AID systems. 21 We provide individual P values (level: .05) for mean difference testing between control strategies for the primary outcome (TIR: 70-180 mg/dL); to note, due to the absence of random factors in our in silico experiment, statistical testing is potentially misleading; 22 it is therefore less emphasized than for a similar clinical experiment.
Results
The simulation experiment results suggest that the use of the anticipatory profiles in the MS-MPC and the BPS reduced BG values overall. The primary outcome (TIR over the entire simulation) improved from 72 ± 17.7% with MPC only to 73.4 ± 17.4% with anticipation and 75.5 ± 17.1% with priming bolus (all comparisons with P < .001). Maximum effect was seen with the combination of priming bolus and anticipation with TIR reaching 77.2 ± 16.7%, or +5.2% over MPC alone (P < .001). On average, when delivered, BPS boluses were 27.64 ± 29.70 minutes after the actual mealtime; 4% of the patients’ TDI was delivered after 64.11% of meals, 7% was delivered after 36.72%, and 10% was delivered after 22.18%. No BPS dose was delivered after 35.89% of meals. The overall false positive rate was 0.69%.
The mean BG for the MS-MPC + BPS was the lowest (155.14±31.88 mg/dL). The other controller configurations had higher mean BG values of 165.49 ± 33.49, 161.61 ± 33.60, and 159.65 ± 33.20 mg/dL for the MPC, MS-MPC, and MPC + BPS, respectively. This trend in lower BG values was represented similarly in the TBRs (ie, <50, <60, and <70 mg/dL), time in tight range (ie, 70-140 mg/dL), and time above ranges (ie, >180, >250, and >300 mg/dL). The BPS and anticipatory profiles also reduced the standard deviation of BG values and caused the system to deliver more insulin overall. The overall results of the experiment are listed in Table 1.
Artificial Pancreas Evaluation Metric Mean and Standard Deviation Values from Simulation Experiments Overall.
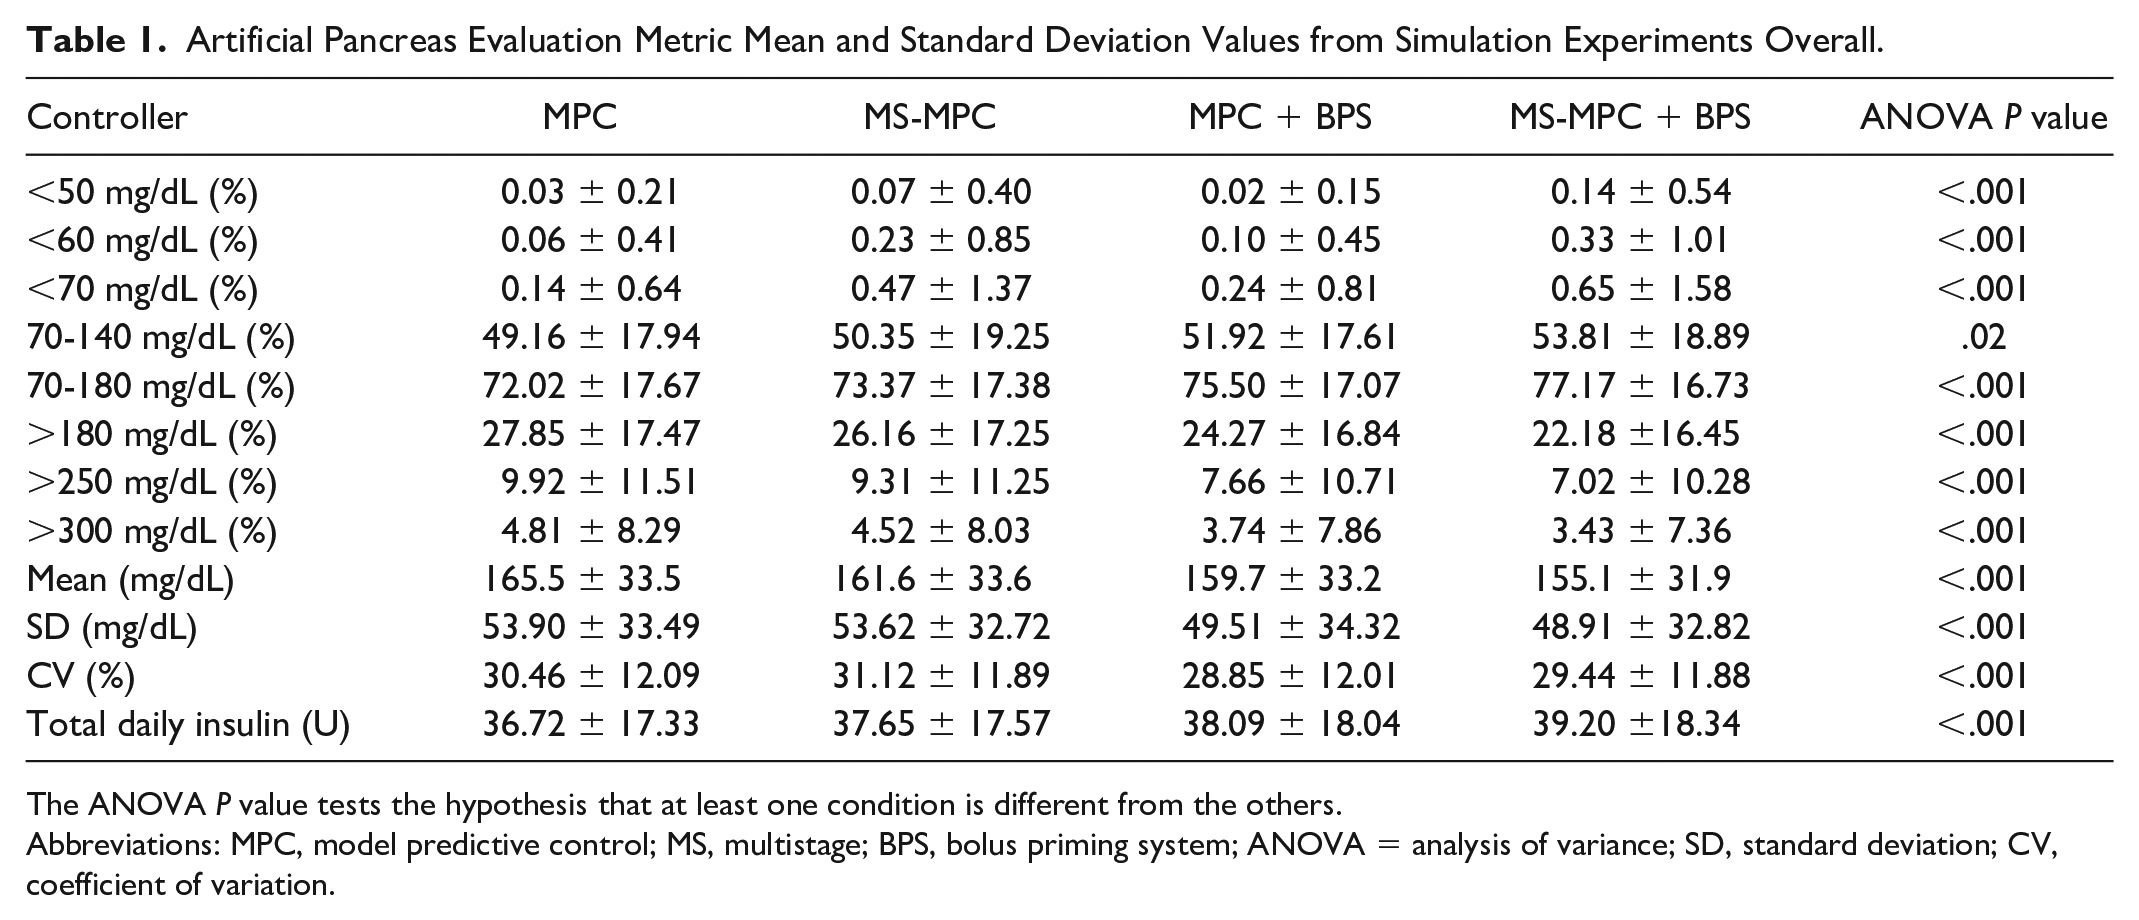
The ANOVA P value tests the hypothesis that at least one condition is different from the others.
Abbreviations: MPC, model predictive control; MS, multistage; BPS, bolus priming system; ANOVA = analysis of variance; SD, standard deviation; CV, coefficient of variation.
In the four hours following meals, the effect of the anticipatory profiles and BPS was more evident. During this period, the TIR was 60.73 ± 25.39% for the MS-MPC + BPS. The mean TIR was 3.78%, 5.9%, and 8.94% less for the MPC + BPS, MS-MPC, and MPC configurations, respectively. Postprandial mean BG was also 4.51 to 10.35 mg/dL lower for the MS-MPC + BPS than it was for the other controller setups. Time below range for all controller setups was less than 1% during this timeframe. Table 2 lists the results during the postprandial period.
Artificial Pancreas Evaluation Metric Mean and Standard Deviation Values from Simulation Experiments During the Four Hours After Meals.
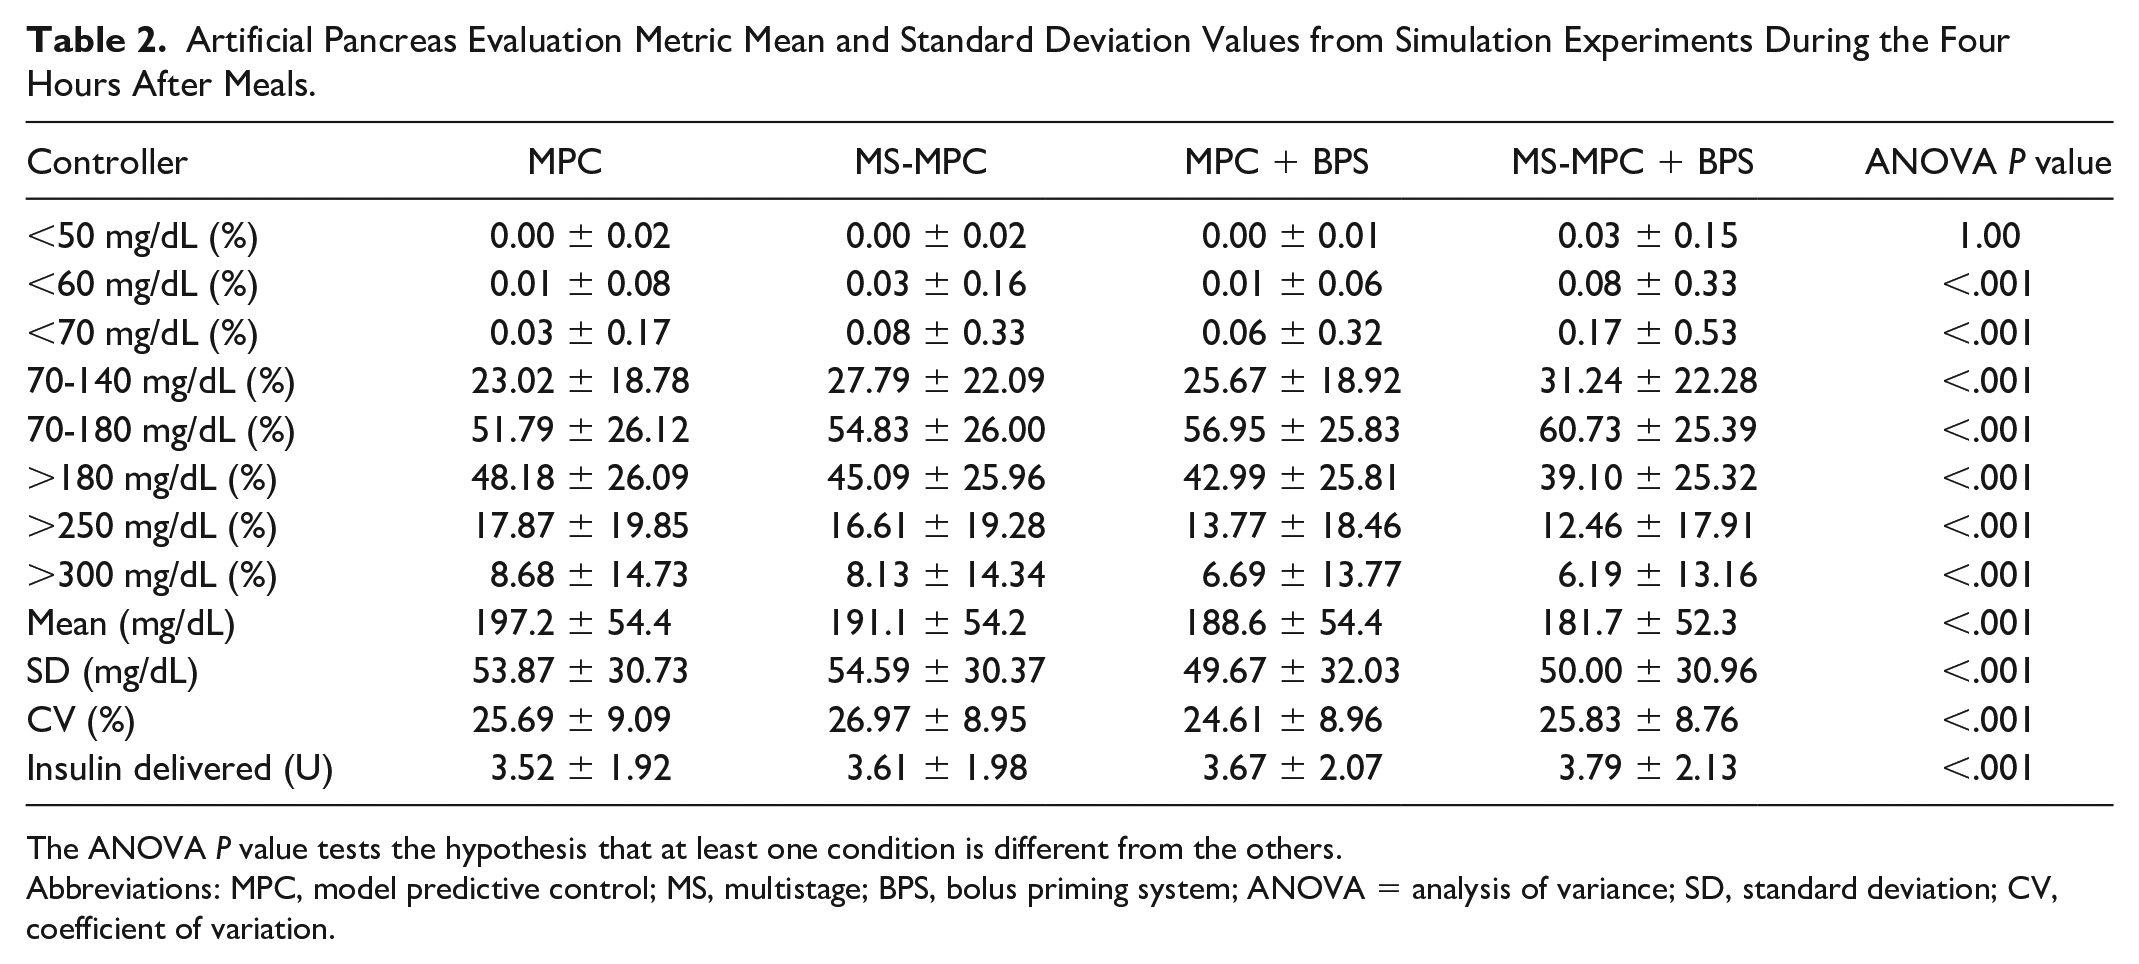
The ANOVA P value tests the hypothesis that at least one condition is different from the others.
Abbreviations: MPC, model predictive control; MS, multistage; BPS, bolus priming system; ANOVA = analysis of variance; SD, standard deviation; CV, coefficient of variation.
Discussion
This simulation, which encompasses realistic eating behaviors in T1DM, indicates that mean BG values were lowest for the MS-MPC + BPS, followed in order by the MPC + BPS, the MS-MPC, and the MPC both overall and after eating. This relationship was maintained in terms of the percent time where BG was in the euglycemic ranges (ie, 70-140 mg/dL and 70-180 mg/dL) and the hypoglycemic ranges (ie, <50, <60, and <70 mg/dL). It was reversed in the amount of time where BG was in the hyperglycemic ranges (ie, >180, >250, and >300 mg/dL). This shows that both the anticipatory profiles and the BPS had the effect of lowering BG values overall. Overall, the MPC + BPS had a 5.84-mg/dL lower mean BG and TIR 3.38% higher than the MPC. The MS-MPC case resulted in a 1.35% greater TIR compared with the MPC, where no profiles were used. The MPC + BPS and MS-MPC + BPS cases had a difference of 1.67% in TIR. This indicates a synergetic interaction between BPS and the anticipatory disturbance profiles. While statistically significant, the differences between MPC versus either MS-MOC or MPC + BPS were incremental, while MS-MPC + BPS showed a potentially clinically relevant difference above 5% TIR.
Across the four configurations, there was no meaningful change in the amount of hypoglycemia overall. Comparing the MPC and MS-MPC + BPS shows that the modules may be responsible for increasing the amount of TBR by less than five minutes, while increasing TIR by more than 5% overall, which is clinically relevant.
The most insulin was used in the case where both the BPS and profiles were active (MS-MPC + BPS). This was less when only BPS was used (MPC + BPS), then even less when just the profiles were used (MS-MPC), and the least when the standard MPC. Interestingly, the MS-MPC case had the highest average coefficient of variation (CV), followed by MPC, MS-MPC + BPS, and MPC + BPS.
The postprandial TIR was increased by nearly 10% when the anticipatory profiles and BPS were used compared with the standard MPC. In addition, there was an increase in the 70- to 140-mg/dL range, but this amount was slightly smaller. This difference resulted from a reduction in TAR and a reduction in the mean BG of roughly 16 mg/dL. The combination of the MS-MPC structure and BPS had its greatest effect during the postprandial period by lowering BG values without increasing hypoglycemia.
A limitation of this work is that this is a simulation study and does not include some variability inherent in free-living conditions (eg, stress, hormonal changes). An additional limitation is that there was no physical activity which could cause both a risk for hypoglycemia and hyperglycemia in the simulation. Because the system does not know future actions like a person might, physical activity could be dangerous if an increase in automatic insulin delivery preceded it. In future versions of this work, we will address this issue by incorporating our past methodologies that consider inputs related to negative disturbances in the prediction model. Other improvements involve using activity sensors to detect eating and exercise events. Model personalization could also improve the generation of the disturbance estimation procedure.
Conclusion
This experiment shows that in a simulation environment, both the BPS and the disturbance profiles positively impact the amount of time that BG values are in the euglycemic range while also decreasing hyperglycemia. These modules are the most impactful during the four hours following eating. Independently, both modules improve TIR and do even better in combination. The reduction in mean BG values attributed to the BPS and disturbances profiles did increase hypoglycemia, but only to a degree that is not clinically meaningful. The BPS and disturbance profiles seem to impact the variability of glucose, although the cause of this is unclear. Future work will determine how this system is impacted by situations that may create risk for hypoglycemia and hyperglycemia.
Supplemental Material
sj-docx-1-dst-10.1177_19322968211059159 – Supplemental material for Using an Online Disturbance Rejection and Anticipation System to Reduce Hyperglycemia in a Fully Closed-Loop Artificial Pancreas System
Supplemental material, sj-docx-1-dst-10.1177_19322968211059159 for Using an Online Disturbance Rejection and Anticipation System to Reduce Hyperglycemia in a Fully Closed-Loop Artificial Pancreas System by John P. Corbett, Jose Garcia-Tirado, Patricio Colmegna, Jenny L. Diaz Castaneda and Marc D. Breton in Journal of Diabetes Science and Technology
Footnotes
Acknowledgements
We would like to acknowledge the clinical, regulatory, and data management staff at the University of Virginia Center for Diabetes Technology
Abbreviations
AID, automated insulin dosing; BG, blood glucose; BPS, bolus priming system; CGM, continuous glucose monitor; CV, coefficient of variation; FCL, fully closed-loop; MPC, model predictive control; MS-MPC, multistage model predictive control; SAP, sensor-augmented pump; SD, standard deviation, TAR, time above range; TIR, time in range; TDI, total daily insulin; T1D, type 1 diabetes.
Declaration of Conflicting Interests
The author(s) declared the following potential conflicts of interest with respect to the research, authorship, and/or publication of this article: M.D.B. has received honoraria and travel reimbursement from Dexcom and Tandem, and research support from Dexcom, Novo Nordisk, and Tandem. The other authors have no conflicts of interest to disclose.
Funding
The author(s) disclosed receipt of the following financial support for the research, authorship, and/or publication of this article: This work has been supported by the American Diabetes Association (1-19-PMF-014), the National Institutes of Health (1UC4 DK108483-01), and the University of Virginia Strategic Investment Fund.
Supplemental Material
Supplemental material for this article is available online.
References
Supplementary Material
Please find the following supplemental material available below.
For Open Access articles published under a Creative Commons License, all supplemental material carries the same license as the article it is associated with.
For non-Open Access articles published, all supplemental material carries a non-exclusive license, and permission requests for re-use of supplemental material or any part of supplemental material shall be sent directly to the copyright owner as specified in the copyright notice associated with the article.