
Abstract
Background:
Affinity sensors for glucose are based on a different measuring principle than the commercially available amperometric needle type sensors: reversible affinity interaction of glucose with specific receptors is the primary recognition mechanism instead of an enzymatic glucose oxidation.
Methods:
A novel pulsed-flow micro-fluidic system was used to characterize first the viscosity of a sensitive liquid containing the glucose receptor Concanavalin A and dextran and in a second approach to characterize the geometry of a fluidic resistance. In the viscometric sensor, glucose of the sensitive liquid is equilibrated, while passing through a dialysis chamber, with the surrounding medium. With the membrane flow sensor, the viscosity of the liquid remains constant but the pores of the flow-resisting membrane contain a swellable hydrogel affecting the width of the pores. Two types of hydrogel were tested with the membrane flow sensor; one is highly sensitive to pH and salt concentration, the other contains receptors of phenyl boronic acids to obtain sensitivity to glucose.
Results:
The viscometric affinity sensor (first approach) showed a linear response over 0 to 30 mmol/L glucose concentration range. The disturbing effect of air bubbles could be compensated for. The sensing proof of principle of the second approach could be demonstrated by its linear response to different saline concentrations; however, the glucose-sensitive membrane developed showed only a small response to glucose.
Conclusions:
Glucose monitoring based on this pulsed flow measuring principle offers interesting alternatives for the development of CGM systems with different options for the glucose sensing part.
Continuous glucose monitoring (CGM) of changes in the glucose levels in the interstitial fluid (ISF) in the subcutaneous tissue is a diagnostic option that allows patients with diabetes to optimize their metabolic control.1,2 Over the past decade, different types of needle sensors from 3 manufacturers became commercially available: Medtronic (Northridge, CA), 3 Abbott Diabetes Care (Alameda, CA), 4 and DexCom (San Diego, CA). 5 The amperometric enzymatic measuring principle allows all these CGM systems to measure the rate of glucose consumption by an enzyme. This measurement principle depends on the rate of glucose flow from the ISF to the enzyme immobilized on the sensor surface through membranes covering the sensor. A stable sensor signal requires a constant diffusion rate of glucose; this however usually is not the case in situ as biofouling of the membrane takes place. This not well-defined process includes the deposition of cells or proteins to the sensor surface that become additional barriers hampering glucose diffusion. This causes signal drift and changes in the intensity of the sensor raw signal within days.
To overcome such shortcomings, glucose sensors were developed that couple the amperometric measurement with the micro-dialysis principle. The latter allows generation of a fluid with a glucose concentration that is closely correlated to that in the ISF but which is practically protein-free. The glucose signals generated by such systems were accurate and stable over time.6,7 To date, only one microdialysis system (GlucoDay; Menarini, Florence, Italy) is available on the market in Europe. 8 This is mainly used for research purposes.
Affinity sensors employ a different measuring principle; these are based on the reversible binding of the analyte to a specific receptor. In the case of glucose, the protein Concanavalin A (ConA),9,10 human mannan-binding lectin, 11 apo-enzymes,12,13 or phenyl boronic acids14,15 have been used. Pros and cons of affinity sensors compared with enzymatic sensors are discussed elsewhere. 16 One advantage of affinity sensors is that when step changes from one glucose level to another are established, the diffusion of glucose proceeds until equilibration between free glucose in the ISF and inside the sensor has been reached, thereby free and receptor-bound glucose within the sensor equilibrates as well. Additional diffusion barriers (created by adhered proteins or cells) may prolong the response time of such sensors, but the height of the final signal in the state of equilibrium is usually not affected. However, the increase in response time reduces the sensitivity of the device during fast changes in blood glucose concentration. 17
The first prototype of an affinity sensor for glucose and later variants was based on optoelectronics and measured a glucose-dependent fluorescence signal.9,18-22 Meanwhile, optical fiber-coupled glucose sensors were tested in animal studies16,23 and human studies. 24 Worsley et al measured the swelling state of a hydrogel with phenylboronic acid receptors which contracted in the presence of glucose in a holographic sensor. 25 Osmotic sensors measured the increase of hydrostatic pressure resulting from the displacement of a polymeric affinity ligand by free glucose from its complex with an affinity glucose receptor in a closed dialysis cell.26,27
Viscometric affinity sensors for glucose are based on a liquid that exhibits a viscosity change due to changes in the glucose concentration. In case of sensitive liquids making use of aqueous solutions out of high molecular, polyvalent dextran and the tetravalent glucose receptor ConA, free glucose reduces the cross-links by ConA between the dextran molecules in the aqueous solution and decreases viscosity.10,28-30 A CGM system based on such a sensor with continuous pressure measurement on fluidic resistances was tested in clinical trials.31,32 More recently MEMS-based viscometric sensors were developed with optical or capacitive signal transduction, 33 some of them making use of synthetic glucose receptors with phenyl boronic acids.34-36
All attempts made thus far to develop a commercially usable CGM-system based on these approaches have not led to a commercial product. One fundamental issue in affinity sensors with constant pumping of a glucose-sensitive liquid is the presence of air bubbles that significantly alter the sensor signal. To overcome this and other issues, a novel approach with pulsed pumping was studied. The development of a novel micro-pump that allows the reproducible pumping of constant liquid volumes of 250 to 5000 µL even at 1.5 bar outlet pressure allows construction of a fluidic resistance measuring system based on the relaxation kinetics of pressure pulses. 37 The aim of this article is to outline the principle of the pulsed flow measurement and how this was applied to glucose monitoring with the flow resistance changes in relation to glucose with a viscometric affinity sensor (first approach) or a membrane flow sensor (second approach).
Material and Methods
Measuring Principle/Ideal System
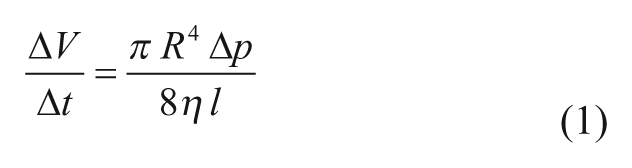
The principle of a fluidic system containing a pressure sensor, a volumetric capacitance and a flow resistance is shown in Figure 1. The flow resistance is varied in the two approaches presented below. Such a system contains a liquid that has a viscosity η. The pressure p is the driving force for the liquid flow ΔV/Δt through the flow resistance. At constant pressure, the flow through the capillary resistance ΔV/Δt is proportional to p and can be described for a Newtonian fluid by the law of Hagen-Poiseulle:
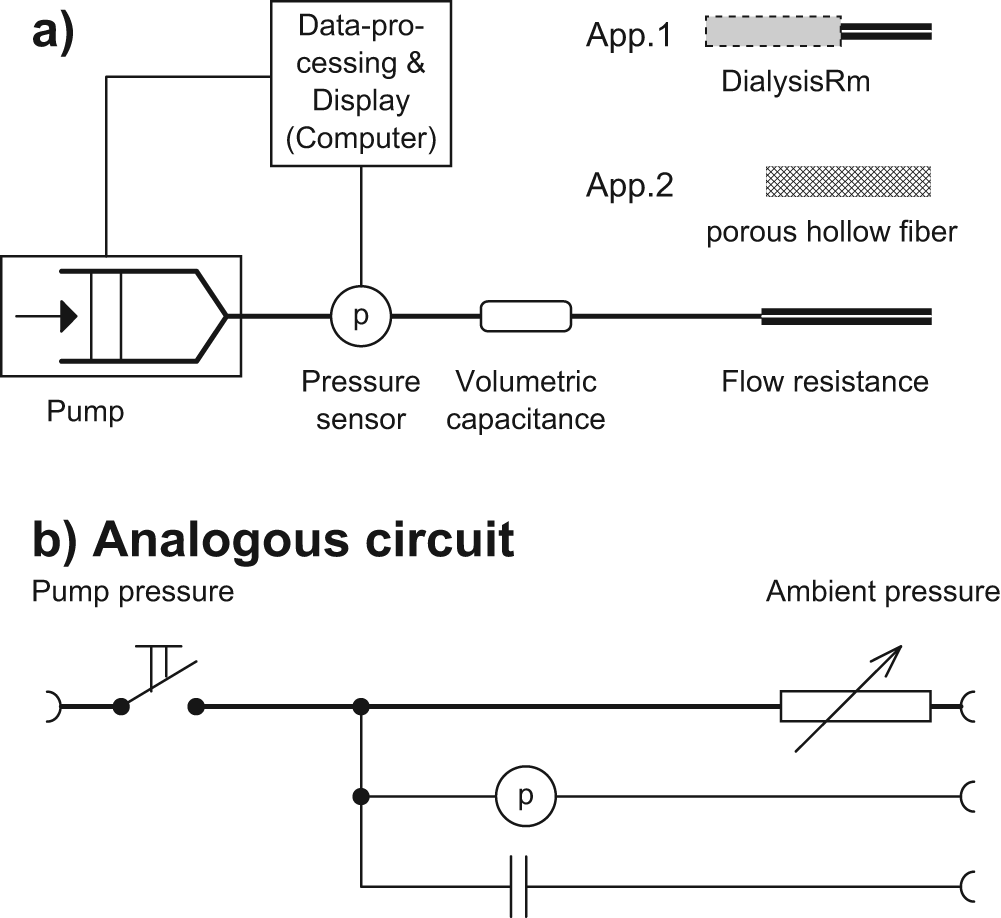
Scheme (a) and analogous circuit (b) of the pulsed measuring system. In the case of the first approach (app. 1) the flow resistance is a glucose-sensitive liquid which is pumped through a capillary with a given resistance (Rm). The liquid changes its viscosity depending on glucose concentration. Equilibration of glucose with the surrounding anlyte solution takes place in a dialysis chamber that is introduced into the fluidic path upstream the flow-resisting capillary. In the case of the second approach (app. 2) a porous hollow fiber is the flow resistance part. The resistance of the hollow fiber with micro-pores changes when an aqueous solution with constant viscosity is pumped through it. This is induced by a swellable hydrogel (interface to the analyte solution) that changes the pore width with changing analyte concentration.
Here radius R and length l are the dimensions of the capillary.
However, for the pulsed-flow system the pressure (Δp), the driving force, is reduced steadily over time by the flow and results in a pressure curve of exponential decay. The same happens with the flow, which steadily decreases over time due to the decreasing pressure.
If the pump introduces discrete volume bursts Vburst of the liquid into the system at t = 0, this generates a pressure increase or peak pressure pmax. Its amount depends on the overall volumetric capacitance of the system. The latter is determined by the material properties of the walls of the fluidic channels and the compressibility of the fluid inside. In an ideal system the quotient between peak pressure and burst volume is constant (pmax/Vburst = const.) for burst volumes from very small until large amounts. Then the pressure decreases over time by the law of first order according to,
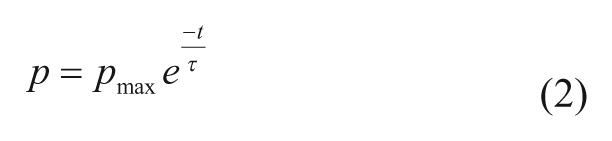
In this case τ = t63%, that is, the time constant of pressure relaxation τ (required to reduce the pressure p to p/e with e – mathematical constant) can be easily determined online from the pressure decay curve as that time, at which the peak pressure is decreased by 63%.
System behavior according to the ideal system is advantageous for a stable measurement of the fluidic resistance and a stable sensor.
Characterization of the Pulsed Measuring System
Initially the measuring system was characterized with glass capillaries, which represent well-defined flow resistances, with respect to the requirements of the ideal system and for the influence of air bubbles. Later, in case of the two glucose sensor approaches studied, the changes in the flow resistances in response to glucose are induced by two different mechanisms.
The setup for the system characterization consisted of a Cavro Centris pump with a syringe of 250 µL volume and a filling valve (Tecan Trading AG, Männedorf, Switzerland). This was connected to a pressure transducer (type ASR 1000 V1 TN, with a measuring range of 0-1000 mbar from EPCOS/AktivSensor, Stahnsdorf, Germany). The flexible element was a silicone tubing (Rotilabo®, inner diameter [ID] of 1.5 mm, outer diameter of 3.5 mm, length of 10 mm, Carl Roth AG, Arlesheim, Switzerland). The fluidic resistances were made from fused silica glass capillaries (dimensions: ID of 75 µm with 3 different lengths of 50, 100, and 200 mm).
Trials were carried out with purified water. Prior to use, the water was degassed by applying vacuum until the boiling point (25 to 30 mbar) for 10 min. The influence of air bubbles was analyzed at 30.0 ± 0.5°C after introducing air bubbles with volumes of 0, 1, 5, and 10 µL into the Luer connector by a gas-tight micro-syringe (with a volume of 10 µL; Hamilton, Bonaduz, Switzerland). For each of the 4 bubble volumes all 12 combinations (3 capillaries and the 4 burst volumes 125, 250, 500, 1000 nL) were measured with 3 repetitions.
Change in the Flow Resistance Part (First Approach): Viscometric Affinity Sensor
The glucose-sensitive liquid contained 6.5% Dextran Mr ~ 2 000 000 (Fluka cat no 95771; Sigma-Aldrich, Buchs, Switzerland), 0.65% ConA (type IV, Sigma cat no C2010, Sigma-Aldrich, Buchs, Switzerland), 5 mmol/L D-glucose, and 0.2% phenol. These substances were dissolved in a 100 mmol/L NaCl solution. The pH value was adjusted to 7.4. The fluidity of the liquid, being the inverse of the viscosity, was previously shown to be proportional to the glucose concentration in the fluid (for details, see Beyer and Ehwald). 38
Glucose solutions used for calibration of the viscometric affinity sensor contained 130 mmol/L NaCl, 5 mmol/L KCl, 15 mmol/L NaN3, 1.5 mmol/L PEG 6000, and 10 mmol/L Tris-(hydroxmethyl)-amino-methane-hydrochloride (TRIS). The pH was adjusted to 7.4. Glucose was added by weight to this solution to obtain final concentrations of the different standard solution of 2.5, 5, 10, 20, and 30 mmol/L.
For this approach the pump was an insulin pump H-Tron V100 (Roche/Disetronic, Burgdorf, Switzerland) and a dialysis probe with a downstream capillary flow resistance was used as interface with the glucose solutions (Figure 2a). The dialysis probe (Figure 2b) was constructed as reported in Diem et al: 32 The double-lumen steel needle had a cross section of 0.9 × 0.45 mm and a window in which a dialysis fiber segment was glued. A hollow fiber made from cellulose (Fraunhofer IAP, Potsdam, Germany) with a free length of 10 mm was used for dialysis. The capillary resistance was made from an ORMOCER® hollow fiber (Fraunhofer ISC, Würzburg, Germany). The sensitive liquid was filled, free of air bubbles, into modified cartridges of the insulin pump. Every 3 minutes bursts of 250 nL were pumped through the system. During measurements, the dialysis probe (including the measuring capillary) was submersed in the different glucose standard solutions. These were incubated at 35°C in a block thermostat (Figure 2c).
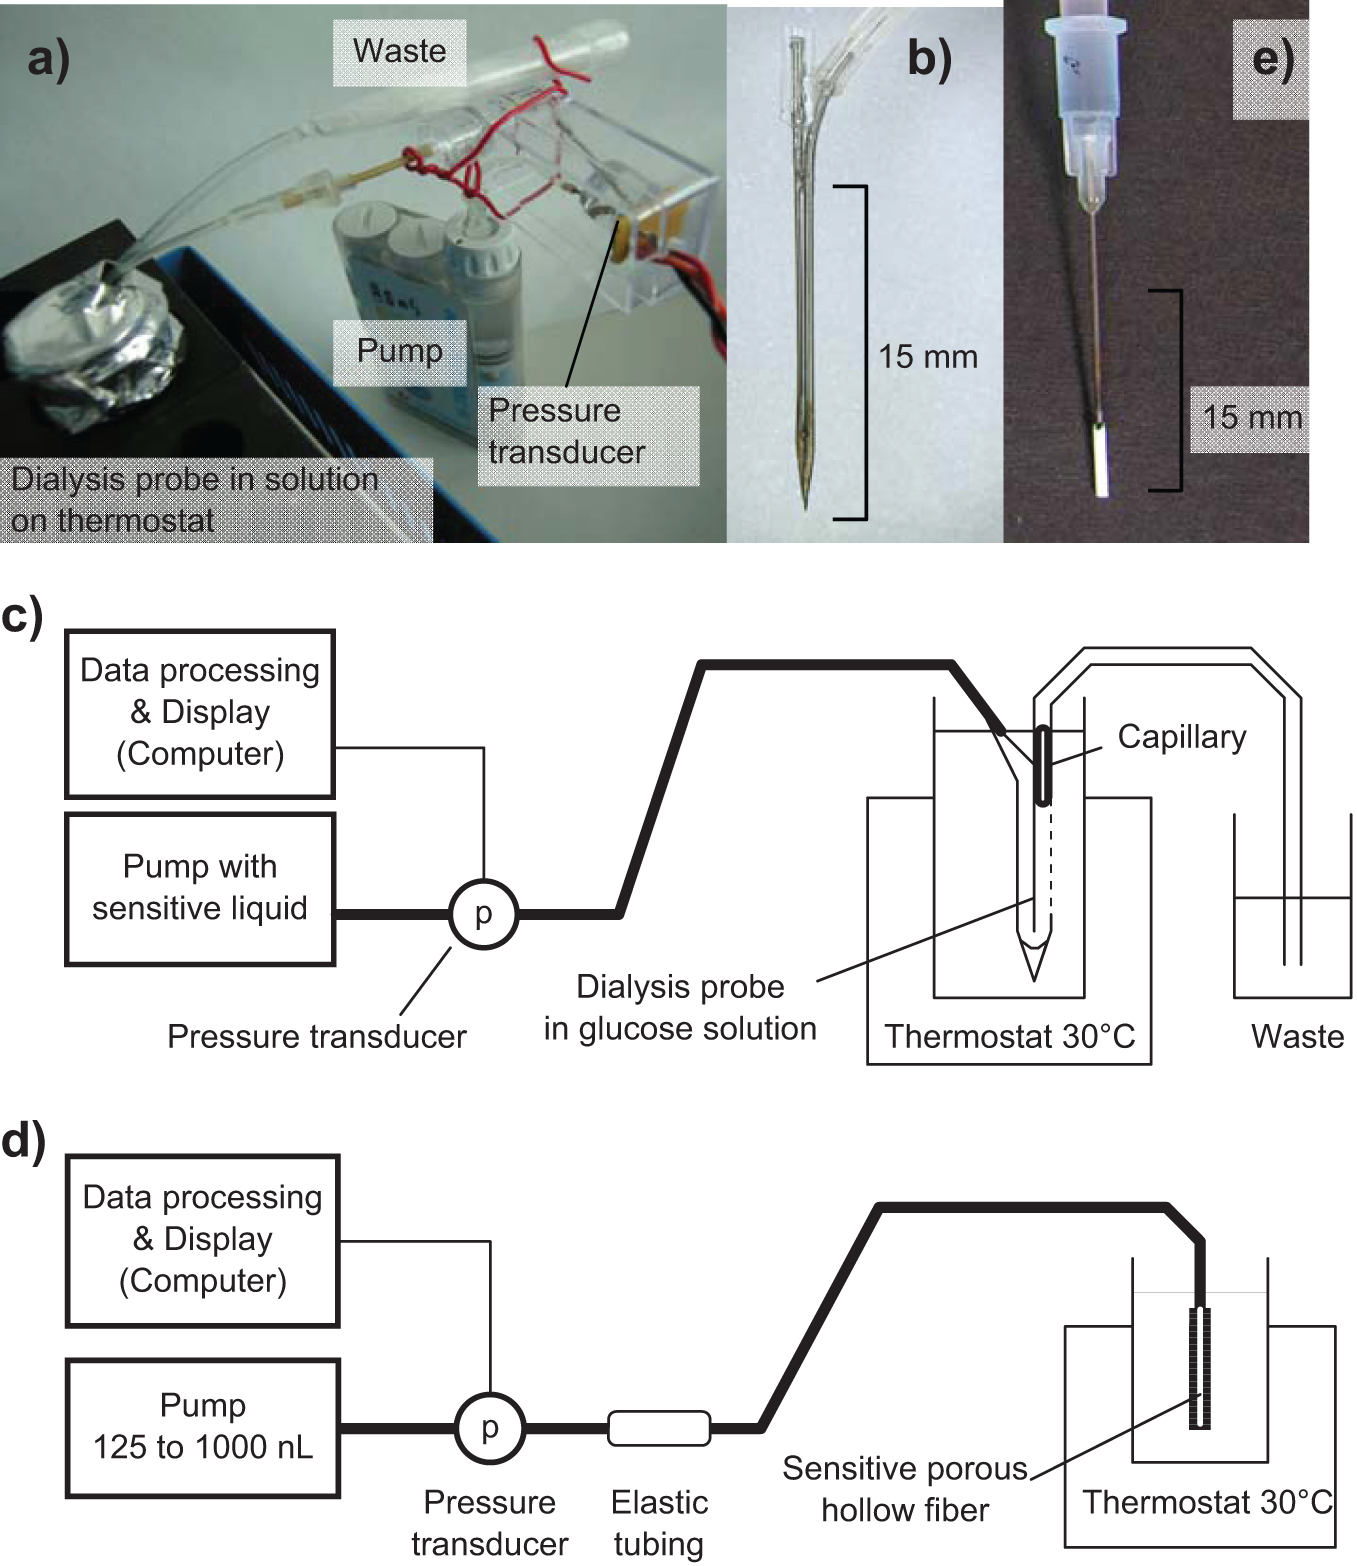
Composition of the sensors based on the pulsed measuring principle. a-c: viscometric affinity sensor (first approach) with overview (a), dialysis probe (b). and schematic view (c). d-e: membrane flow sensor (second approach) with schematic view (d) and sensitive porous fiber (e).
Change in the Flow Resistance Part (Second Approach): Membrane Flow Sensor
These responsive porous fiber elements were constructed with polypropylene hollow fiber material with an ID of 600 µm and pores with a diameter of about 100 nm (obtained from filter cartridges MICRODYN® MD070FP1L, Microdyn-Nadir GmbH, Wiesbaden, Germany). To create responsive fibers, the pores were modified at the EPFL (Lausanne, Switzerland) with grafts of methacrylic acid to obtain a swellable polymeric hydrogel. This hydrogel swells according to differences in salt concentration and pH, hereby affecting the free inner radius of the pores. The concept of a glucose sensor requires porous membranes with a different type of hydrogel which also contain receptors such as phenyl boronic acids or ConA to obtain sensitivity to glucose. Prototypes of such membranes were tested; however, they showed no sufficient response to glucose (data not shown).
Short segments of these fibers were connected on one side to a G23 cannula and closed at the opposite side by a plug with the help of the cyano-acrylate glue Loctite 4011. The prepared porous fiber elements contained a free unglued fiber length of 5 mm (Figure 2e) at the end.
Test solutions consisted of a 10 mmol/L TRIS buffer pH 9 containing salt concentrations between 0 and 200 mmol/L NaCl. In addition, 10 mmol/L acetate buffer at pH 4 was used to obtain the shrunk state of the hydrogel for reference.
In case of the membrane flow sensor (Figure 2d), the Cavro Centris pump (as before) was used with bursts of pure water of a volume of 1000 nL, delivered every 3 min. The porous fiber element was wetted prior the measurements and filled bubble-free with degassed pure water. Subsequently the porous fiber element was submerged in the test solutions with different salt or glucose concentrations on a block thermostat at 30°C.
Software and Data Processing
An application-specific software application in Labview controlled the Cavro Centris pump as well as measurement and data processing on a computer. Volume amounts of 125, 250, 500, or 1000 µL water were administered within 0.5 s to the measuring system every 3 min. Pressure raw data were sampled continuously with 10 Hz and analyzed online with a peak detection algorithm that calculated the relaxation parameters for each burst.
Results
Proof of the Measuring System for the Assumption of the Ideal System
As postulated for the ideal system, pressure curves obtained after application of 4 volumes from 125 to 1000 nL were different in absolute values but showed the same relaxation over time; tests were performed with a measuring system aimed at studying this principle with a flow resistance of 100 mm (data not shown). When constant volumes were applied, the pressure relaxation slowed down with different capillary lengths. Analysis of the raw pressure curves showed that the quotient pmax/Vburst was sufficiently constant (166.8 ± 6.0 mbar/µL in case of no air bubbles in the system) for 4 burst volumes, measured with 3 repetitions (n = 12) as required to apply the assumptions of an ideal system. Relative pressure curves of this experiment (raw pressure values related to the peak pressure pmax) are presented in Figure 3. Relative curves enable the calculation of the time constant t63% which increased with the length of the capillary. Relaxation curves for the same fluidic resistance (capillary length) overlaid to the same line.
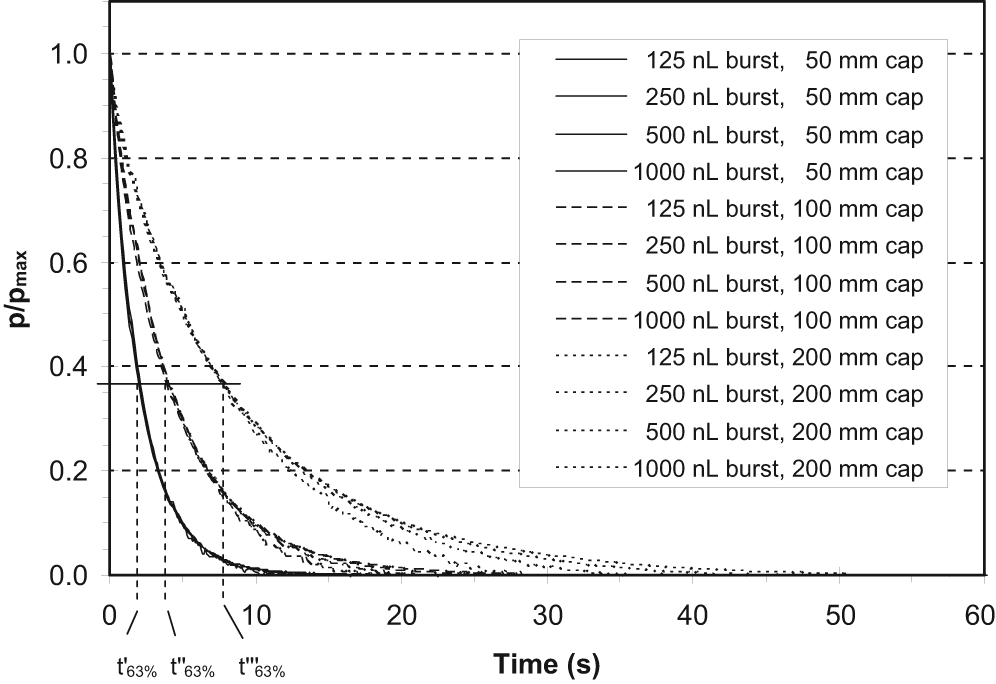
Pressure relaxation curves after application of discrete volume amounts to the fluidic measuring system. Relative pressure curves of all combinations of the 3 capillary lengths tested (50, 100, and 200 mm) and 4 burst volumes (125, 250, 500, and 1000 nL) to peak pressure pmax; each curve represents median values of 3 repeated measurements. Temperature: 24.6°C.
Influence of Air Bubbles on Time Constant t63%
Air bubbles in the fluidics increase the volumetric capacitance of the measuring system and dampen the pressure relaxation after application of discrete amounts of fluid. This effect may undermine a reliable determination of the fluidic resistance from the measured t63% values. For example, the introduction of an air bubble of 5 µL increased the t63% values by a factor of 2. However, gas bubbles in the system were compatible with the properties of the ideal system, since t63% values were linearly related to the fluidic resistance for each individual bubble size (Figure 4). The parameter pmax/Vburst was proportional to the air bubble volume and may be used for normalization of the t63% values to compensate for the influence of bubbles (the volume of which is usually unknown) respectively to the overall volumetric capacitance of the measuring system. The normalized time constant t63%_norm was calculated by,
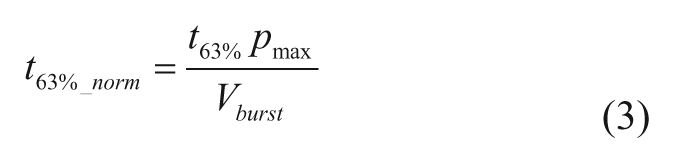
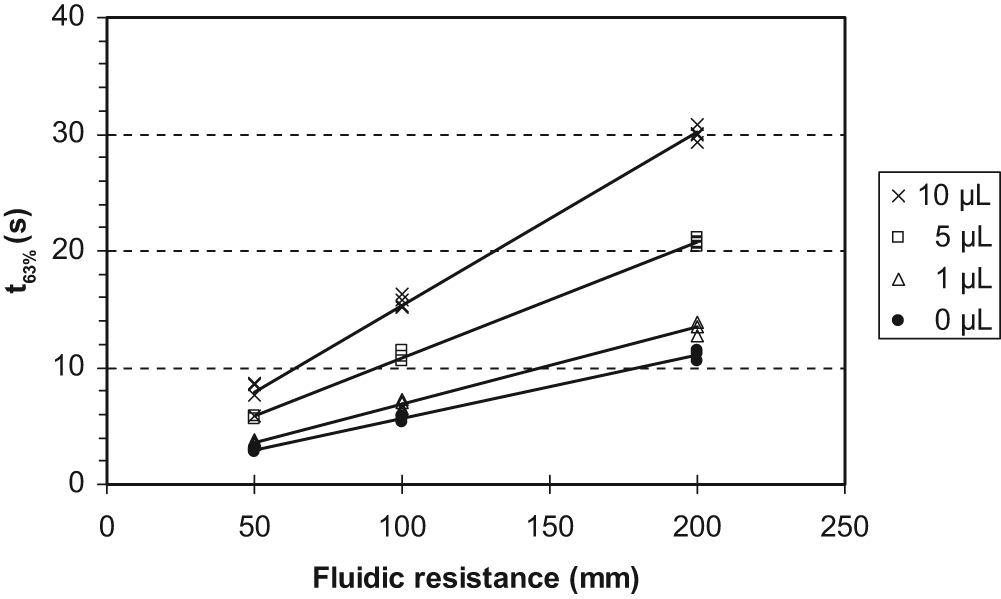
Influence of air bubbles in the fluid on the time constants of pressure relaxation by 63% (t63%). Temperature: 30°C. Each variant measured with 4 different volumes applied, represented by average values of 3 repetitions.
The results of the normalization of the time constants for 4 burst volumes between 125 and 1000 nL with 4 different gas volumes (0, 1, 5, and 10 µL) in the system, that is, 16 variants for each of the 3 capillaries, are shown in Figure 5. It was found that normalized time constants of all variants for the same capillary lay in the same region. Normalized time constant was directly proportional to the fluidic resistance given by the length of the capillary.
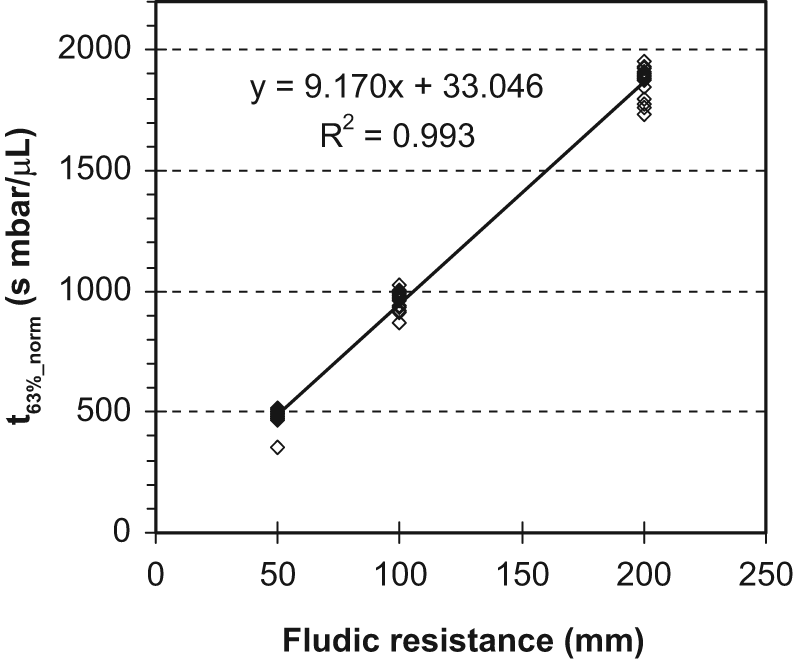
Relationship between fluidic resistance (capillary length) and normalized relaxation time constants (t63%_norm). Data from 16 variants (4 volume amounts and 4 gas volumes) for each capillary length.
First Approach: Viscometric Affinity Sensor
With this approach, the time constant of pressure relaxation t63% represents the viscosity and its reverse the fluidity of the sensitive liquid. The characteristic relationship between glucose concentrations and the inverse of the normalized time constant t63%_norm is shown in Figure 6. The sensor raw signal 1/t63%_norm was proportional to glucose concentrations in the range between 0 and 30 mmol/L. The corresponding calibrated glucose curve is shown in Figure 7. The response time, that is, change in measurement signal after change of glucose standard solution, was 3 to 6 minutes (one complete measuring interval, time is required for micro-dialysis). In Figure 8 the signal stability of the viscometric sensor was tested over a period of 26 days. Applying one set of calibration parameters, sensor output was stable over this time in the physiological glucose range between 2 and 20 mmol/L. No systematic drift occurred over time. However, values on day 1 were lower by about 2 mmol/L than those obtained for the other days, which cannot be explained afterward. Due to the low flow rate (only 5 µL/h), a retarding effect might be derived from water, introduced into the Luer connector at the pump while filling the device on day 0.
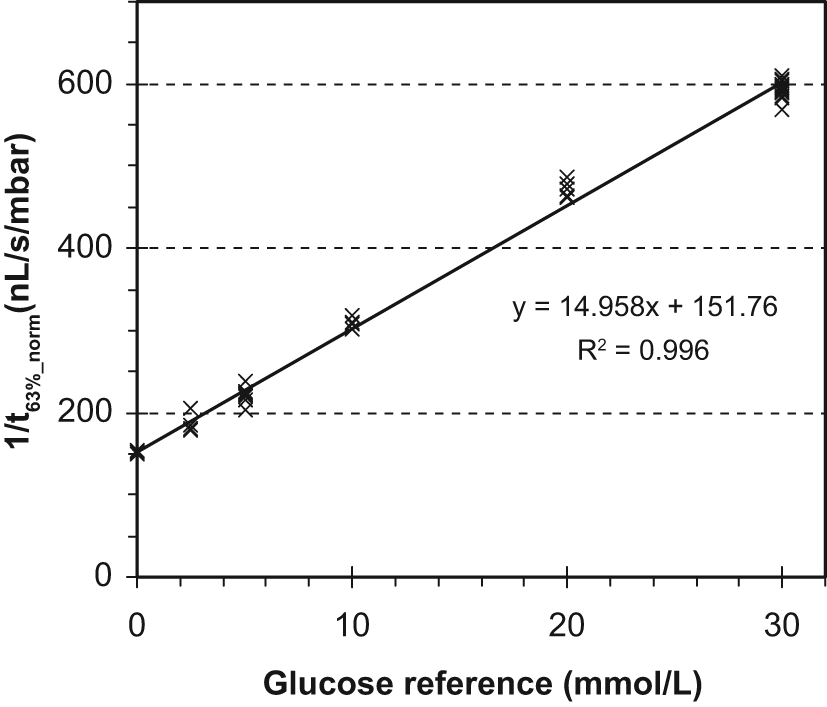
Relationship between glucose concentration and the inverse normalized time constant of pressure relaxation 1/t63%_norm. First data point after change of the glucose standard solution excluded. Temperature = 25.7-26.1°C.
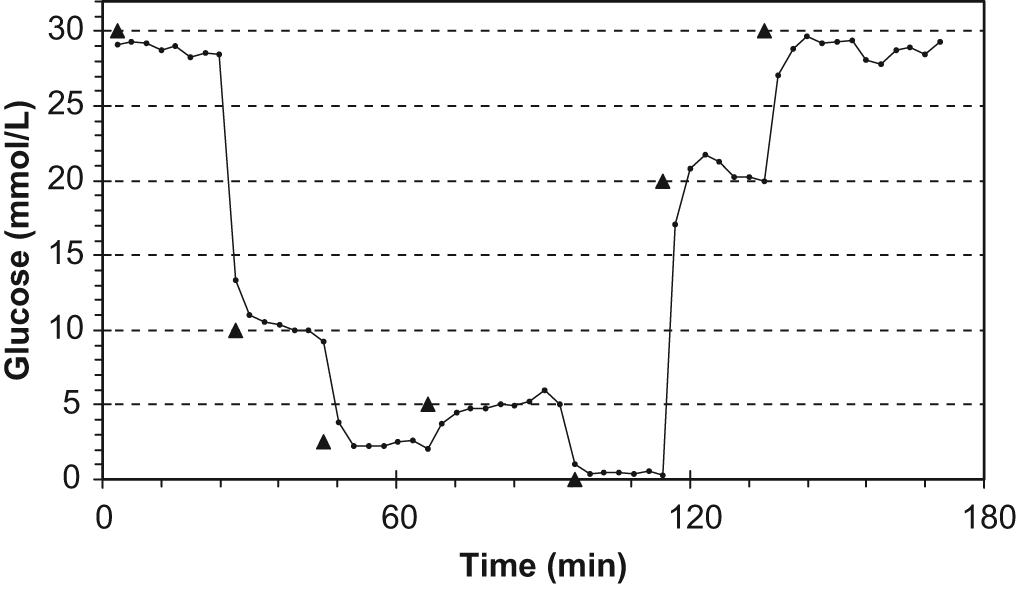
Glucose measurement in test solutions with the viscometric affinity sensor by pulsed measurement. ▲, change of the standard glucose concentration.
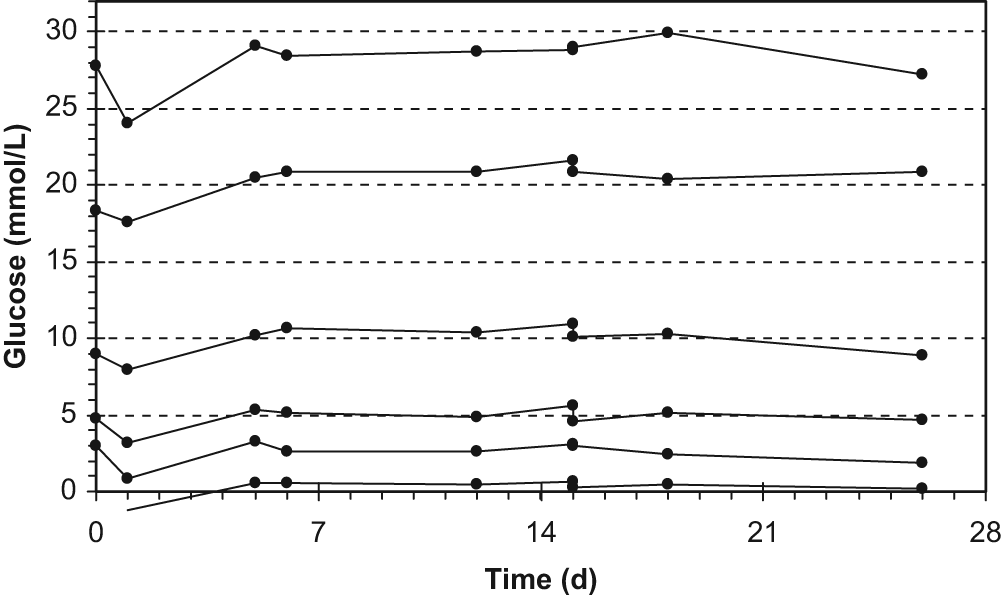
Stability of the glucose measurement with the viscometric affinity sensor over 26 days at the different standard solutions used. Calibration was carried out retrospectively with the mean values of slope and offset obtained for the individual measurements at the different measurement days. Glucose concentrations: 0, 2.5, 5, 10, 20, and 30 mmol/L.
Second Approach: Membrane Flow Sensor
The porous fiber elements showed a clear response to changes in salt concentrations (Figure 9). At pH 9 the poly-acryl hydrogel inside the pores is swollen due to the negative charge of the gel matrix after deprotonation of the carboxylic groups. Addition of cations due to increased neutral salt concentration shielded the charged groups and allowed the gel to shrink, which led to an opening of the pores and a reduction of the normalized time constants.
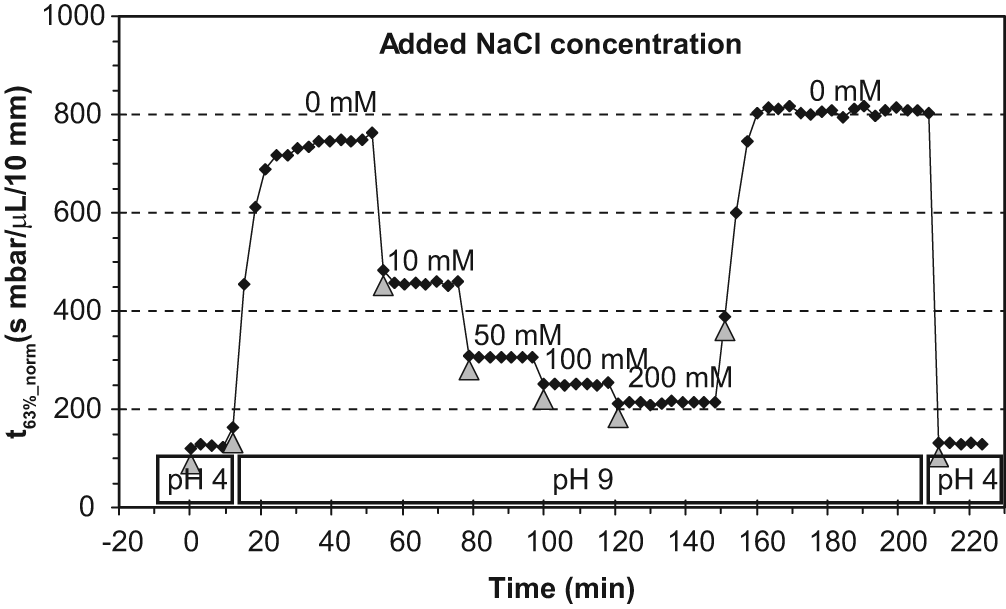
Response of the pulsed flow sensor to salt concentration. Fiber sample O4-1, fiber length: 5 mm; pump delivered bursts of 1 µL pure water every 3 min; buffer concentration in test solutions was 10 mmol/L. Temperature = 30°C.
In analogy to the viscometric glucose sensor, the inverse values of the normalized time constants t63%_norm were plotted with the salt concentration and resulted in saturation kinetics (data not shown). When 1/(t63%_norm) 4 (the inverse of the fourth power of the normalized time constant) is used, a linearization with salt concentration is possible. The response time was 3 to 6 minutes (one complete measuring interval; time is required for diffusion of the salt into the porous fiber).
Prototypes of porous fibers modified with phenyl boronic acids in the hydro-gel showed only a weak tendency of the normalized time constants for the highest glucose concentrations compared with zero glucose (data not shown). Possibly the chemical modification of the hydro-gel was not effective or did not affect sufficiently the inner surfaces of the pores, which are most important for the flow resistance of the porous fiber.
Discussion
The in vitro measurements showed that application of a pulsed system to measure the fluidic resistance can be used for glucose monitoring. With the first approach, the observed linear response curve of the viscometric affinity sensor to glucose indicates the usefulness of such a physicochemical principle for glucose monitoring. It appears that more basic research is needed to develop glucose responsive membranes before the second approach, the membrane flow sensor, can enter clinical development.
The established pulse measuring systems fulfilled the properties of the ideal system. This circumstance strongly simplifies the normalization of the individual pressure curves and the calculation of the relaxation parameters compared with a nonlinear approach. Compared with the constant flowing system of the viscometric affinity sensor,31,32 where 2 pressure transducers are needed, only 1 is required in the disposable of the pulsed system. Moreover, it was possible to compensate for the variability in the elasticity of the system without detailed information on its origin simply by the quotient pmax/Vburst. This is especially important in case of gas bubbles, which have been found to be compatible with the properties of the ideal system. Bubbles may always be an issue in fluidic systems since they may be existent from filling the system or arise suddenly from the liquid. In addition, bubbles change their size with pressure and temperature. Without compensation even small bubbles may dramatically influence the measurement. This also applies for the elastic properties of polymers, bordering the system, which may be altered due to temperature and aging. Additional compensation is needed for the influence of temperature on the viscosity of the liquid passing the fluidic resistance, which may easily be solved either by keeping the temperature constant or by making a correction based on a temperature sensor.
The time period, which is available for relaxation measurement, depends on the targeted frequency of measurements. A period of 5 times the time constant (5τ) is required for a complete relaxation of a pressure pulse to its initial level. In case that one glucose value is required every 180 s, τ must not exceed 36 s. This also sets the limit for the tolerable size of bubbles in the fluidics, which increase the relaxation time.
The signal of the pulsed viscometric sensor (first approach) showed a good correlation to the glucose concentration when measured in vitro. Because of the sensitive liquid used, the sensor measured the glucose concentration in the entire physiological range without dilution. Here, dialysis and pump volume were adjusted to realize a recovery of glucose of close to 100%. The affinity principle of the sensitive liquid works well in vivo as has been shown for the continuously flowing viscometric affinity sensor. 32 The continuous flow has some advantages, for example, the glucose signal is always available, but is more sensitive to disturbances by air bubbles. One glucose measurement result every 3 or 5 minutes, as in the current pulsed approach, should be sufficient for a good glucose monitoring since physiological changes in glucose concentration are relatively slow and do not exceed 5 mg/dL/min. 39 The advantage of the pulsed sensor principle is a well-controlled flow of the sensitive liquid by the pump. This may make it possible to more easily detect possible malfunctions of the system.
The concept of a membrane flow sensor (second approach) which changes its flow resistance in response to glucose is especially attractive, since it enables the construction of a single-port closed-loop system which delivers basal insulin by the pump through a porous membrane and simultaneously measures the fluidic resistance which contains the information about the glucose concentration in the tissue. This approach was studied within the framework of the EU-funded project AP@home. 40 Unfortunately, glucose response of the tested fibers hitherto was too weak for a reliable glucose sensor. A crucial point is the specific chemical modification of the hydro-gel directly inside the pores with glucose receptors since this region is responsible for the flow resistance of the porous fiber. However, in principal the effect of the swelling response of hydro-gel inside the pores to changes in analyte concentration as well as the response characteristics and kinetics can be analyzed with porous fibers containing ion sensitive hydro-gels and NaCl solutions too.
The current results demonstrate the response of the flow resistance of a salt-sensitive membrane with salt concentration in test solutions. Hereby a linearization between salt concentration and 1/(t63%_norm) 4 (the inverse of the fourth potency of the normalized time constant) was possible. This is not surprising when keeping in mind that the flow resistance of capillaries depends on their radius R by 1/R 4 . Due to the proportionality between 1/(t63%_norm) 4 and the salt concentration, it can be assumed that the shrinking effect of the poly-acryl hydrogel to widen the radius of the pores is linearly related to the shielding effect on the charged groups of the hydrogel by neutral salt.
In view of the limitations of the currently commercially available CGM systems, it is of interest to pursue novel approaches for glucose sensors that allow overcoming such limitations; the presented approach represents an interesting option for such a development.
Footnotes
Acknowledgements
The authors thank Nicolas Fortin and Harm-Anton Klok of the EPFL (Institut des Matériaux, Laboratoire des Polymères, Lausanne Switzerland) for providing the responsive porous fibers.
Abbreviations
CGM, continuous glucose monitoring; ConA, Concanavalin A; ID, inner diameter; ISF, interstitial fluid.
Declaration of Conflicting Interests
The author(s) declared the following potential conflicts of interest with respect to the research, authorship, and/or publication of this article: UB, TW, and FR are employees of Sensile Medical AG, Hägendorf, Switzerland. LH is partner and consultant of Profil Institut für Stoffwechselforschung, Neuss, Germany and Profil Institute for Clinical Research, San Diego, CA, USA.
Funding
The author(s) disclosed receipt of the following financial support for the research, authorship, and/or publication of this article: This research was supported in part by the European Community Framework Programme 7 (FP7-ICT-2009-4 grant number 247138).