
Abstract
Background
Saccade, pupil, and blink control are impaired in patients with α-synucleinopathies (αSYN): Parkinson's disease (PD) and multiple system atrophy (MSA). Isolated REM (rapid eye movement) Sleep Behavior Disorder (iRBD) is a prodromal stage of PD and MSA and a prime candidate for investigating early oculo-pupillo-motor abnormalities that may precede or predict conversion to clinically manifest αSYN.
Objective
Determine whether saccade, pupil, and blink responses in iRBD are normal or similar to those identified in PD and MSA.
Methods
Video-based eye-tracking was conducted with 68 patients with iRBD, 49 with PD, 17 with MSA, and 95 healthy controls (CTRL) performing an interleaved pro-/anti-saccade task that probed sensory, motor, and cognitive processes involved in eye movement control.
Results
Horizontal saccade and blink behavior was intact in iRBD, but abnormal in PD and MSA. iRBD patients, however, demonstrated reduced pupil dilation size, which closely resembled the changes found in PD and MSA. In the iRBD group, the extent of these pupillary changes appeared to correlate with the degree of hyposmia and reduction in dopamine transporter imaging signal.
Conclusions
Pupil abnormalities were present in iRBD, but blink and horizontal saccade responses were intact. Future longitudinal studies are required to determine which prodromal pupil abnormalities predict conversion from iRBD to PD or MSA and to identify the time window, in relation to conversion, when horizontal saccade responses become abnormal.
Plain language summary
Neurodegenerative diseases like Parkinson's disease (PD) are on the rise. In the clinic, the phenotypic similarities between early stage PD and conditions such as early-stage multiple system atrophy (MSA) complicate treatment strategies. Accurately distinguishing these disorders is essential for developing treatments that can delay the progression from even prodromal through early symptomatic stages to full-blown disease. Eye tracking, an affordable and non-invasive diagnostic tool, measures eye movements, pupil size, and eye blinks to help locate problems in the brain. These measurements are important to help identify PD from other related brain disorders and assessing the severity of impairments. Our study compared eye movement behaviors between groups, including individuals diagnosed with PD, MSA, and people at risk of developing PD, such as those with isolated rapid eye movement sleep behavior disorder (iRBD), and healthy controls. Our results show that PD and MSA patients had irregular eye movements and pupil responses. iRBD patients, who carry a high risk of developing PD or MSA, had changes in pupil size similar to PD, suggesting that pupil changes could serve as early indicators for patients at risk for developing PD. Improved diagnostic accuracy enhances the testing of new treatment approaches and the quality of life for those affected by or at risk of developing PD.
Keywords
Introduction
There is an urgent need to establish reliable, easy to apply, noninvasive biomarkers that can be used to identify individuals at risk for Parkinson's disease and related disorders, i.e., ideally in their prodromal stage. Isolated rapid eye movement (REM) sleep behavior disorder (iRBD) has been identified as the most specific and common prodromal stage of α-synucleinopathies (αSYN) such as Parkinson's disease (PD), dementia with Lewy bodies (DLB), and the sporadic disease multiple system atrophy (MSA).1,2 Within 10 to 20 years, patients with iRBD convert to an αSYN-related neurodegenerative disease in up to 85% of the cases. 1 Hence, iRBD is an ideal group for testing disease-modifying therapies to delay or even prevent phenoconversion. Therefore, identifying those iRBD patients when they are likely to phenoconvert needs highly sensitive and specific prodromal biomarkers and progression markers.
Video-based eye tracking is a non-invasive technique that has demonstrated the capacity to detect subtle yet pathological alterations in saccade, pupil, or blink behavior.3–7 Detailed quantitative assessment of oculo-pupillo-motor parameters can provide valuable insights into the underlying neural circuitry affected by various disease processes, including disease progression.8–10
To date, most of the biomarkers and progression markers for manifest αSYN relate to motor and cognitive dysfunction and imaging of the central nervous system, but less to sensory and autonomic dysfunction. 11 Over the past several years, oculomotor abnormalities, such as hypometric saccades, greater task errors, and slower reaction times, have been identified in individuals with PD.4,5,8,12–15 Therefore, the important question now is which of these abnormalities are already present in the prodromal stage for PD and MSA. That is, what abnormalities will be already present in iRBD patients, that may predict the future manifestation of PD or MSA?
Earlier studies, including our own, have utilized an interleaved pro-/anti-saccade task (IPAST) to start to identify oculo-pupillo-motor abnormalities in iRBD, such as increased anti-saccade direction errors, reduced pupil responses to task instructions, and reduced blink rate.3,4,16 The goal of this study is to use IPAST to describe saccade, pupil, and blink responses in a much larger cohort of well-phenotyped iRBD participants and compare them to the responses produced by participants with manifest PD and MSA as well as to control participants.
Methods
Participant characteristics
This study consisted of four different groups of participants. Patients with PD, MSA, and iRBD were recruited at the University Clinic Marburg (UKGM), Department of Neurology. Healthy controls (CTRL) were recruited in Kingston, Canada, as part of a large normative database. 17 The Declaration of Helsinki was followed to obtain voluntary informed consent from each participant. The research protocols were approved by the Human Research Ethics-Committees of the Faculty of Medicine at the University of Marburg (Protocol ID: 147/16). Queen's University Health Sciences and Affiliated Teaching Hospitals Research Ethics Board reviewed and approved this experiment (Protocol IDs: PHYS-007-97; CNS-005-10). Supplemental Figure 1 illustrates the age distributions of all participants in this study.
A variety of clinical tests were performed on all patients, including the Unified Parkinson's Disease Rating Scale (UPDRS-III), 18 the Montreal Cognitive Assessment (MoCA), 19 Beck's Depression Inventory-II (BDI-II), 20 PD Non-Motor Symptoms (PDNMS), 21 and the iRBD screening questionnaire (RBDSQ). 22
Isolated REM sleep behavior disorder
Sixty-eight patients [Mean-age, SD: 65.56 ± 6.27 years] with video polysomnography-confirmed iRBD (Darien IL, AASM, 2014) were included in this study (Supplemental Figure 1, Supplemental Tables 1 and 2). Mean UPDRS-III, MoCA, and BDI-II scores in iRBD were 2.23 ± 2.22, 28.28 ± 1.36, and 8.73 ± 9.24, respectively. The iRBD data described here includes 22 participants from a previous study. 3 The exclusion criteria are explained in Supplemental Methods.
The olfactory function in iRBD patients was assessed using the Sniffin’ Sticks test, which evaluates threshold, discrimination, and identification (TDI-score).23,24 In our cohort of 68 iRBD patients (detailed in Supplemental Table 2), the distribution of olfactory function, as measured by the TDI score, was as follows: 28 individuals exhibited anosmia (TDI score ≤15), 18 had severe hyposmia (TDI score 16–20), 11 individuals presented moderate hyposmia (TDI score 21–25), 6 individuals presented mild hyposmia (TDI score 26–30), 3 individuals had normosmia (TDI score ≥31) and 2 individuals were not subjected to the olfactory test. The smell test was conducted exclusively on iRBD patients (detailed in Supplemental Methods).
Furthermore, 62 out of 68 patients with iRBD underwent Dopamine transporter imaging (DaTscan) at baseline as part of the diagnostic workup. 25 Among these patients, 31 had normal DaTscan results, 31 had abnormal findings, and 6 did not have DaTscan imaging performed.
Parkinson's disease
PD patients were diagnosed under the United Kingdom Brain Bank Criteria. Forty-nine PD [Mean-age, SD: 64.90 ± 8.71 years] were included in the study: Mean UPDRS-III, MoCA, and BDI-II scores in PD were 15.83 ± 9.46, 27.48 ± 3.02, and 12.20 ± 10.15, respectively. The research included 43 individuals with PD (n = 43) who were receiving dopaminergic treatment. There were also 6 participants (n = 6) with de novo PD.
The iRBD and PD data described here includes some common participants from a previous study (iRBD n = 22; PD n = 19). 3 We compared the data from the newly collected iRBD and PD patients (iRBD n = 46; PD n = 30) with the previously collected data. We confirmed the similarity between the older dataset 3 and our new cohort data on PD/iRBD groups through statistical tests, including Kruskal–Wallis tests, which showed no significant differences between oculomotor variables (Saccade latency, direction error, pupil, etc). This justified combining the datasets to enhance statistical power.
Multiple system atrophy
As a second manifest α-synucleinopathy a group of seventeen MSA patients [Mean-age, SD: 63.42 ± 6.90 years] was included. This cohort comprised four MSA patients of the cerebellar subtype, three of the parkinsonian subtype, two mixed subtype, and eight patients who had not been distinctly classified at the time of measurement. MSA patients were diagnosed according to the second consensus statement on the diagnosis of MSA. 26 Mean UPDRS-III, MoCA, and BDI-II scores in MSA were 27.09 ± 12.75, 26.92 ± 2.78, and 13.08 ± 5.52, respectively. This is our first description of oculomotor behavior in MSA and the first study comparing MSA to iRBD.
Controls
Ninety-five healthy age-matched CTRL [Mean-age, SD: 64.75 ± 8.16 years] participated in the study and were also part of a larger normative database describing pro- and anti-saccade behavior across the lifespan. 17 We could not directly confirm if differences in nationality between the control and patient groups influenced the analysis due to a lack of a German CTRL cohort. We compared the German PD group to a Canadian PD patient cohort performing the same task 14 and the results were almost identical. All CTRL participants identified as Caucasian. The CTRL participants were excluded if they had any known neurological disorder or visual dysfunction other than correction for refractive errors. The mean MoCA score for CTRL subjects was 27.63 ± 1.67, but other questionnaires were not administered.
Eye tracking
All patient data were collected in a windowless testing room inside the Department of Neurology, Marburg, with all lights turned off to ensure that the only illumination source was the computer display (more details in Supplemental Methods). The setting matched the Kingston lab where CTRL participants were recruited. At both locations, a video-based monocular eye tracker was used to monitor eye location, pupil size, and blink behavior (Eyelink-1000 Plus, SR Research Ltd, Osgoode, ON, Canada). The eye-trackers were standardized between sites by purchasing the identical hardware at the same time. Subsequently, software installation and calibration were performed according to a similar protocol at both locations in Kingston and Marburg prior to experimentation. Documentation and training procedures were also standardized across sites. 14 All recordings and calibrations were done using the right eye to maintain consistency with previous experiments in our laboratory.
Task description
The interleaved pro-/anti-saccade task (IPAST) consisted of randomly interleaved pro and anti-saccade trials (Supplemental Figure 2). Each trial started with a black screen that lasted 1000 ms (Inter-trial interval). Then, a fixation point, either red or green in color (matched for luminance at 44 cd/m2), appeared in the middle of the screen, and subjects were instructed to look at it for its 1000 ms duration. The green fixation point instructed a pro-saccade trial (look toward the peripheral stimulus as soon as it appears), and the red one instructed an anti-saccade trial (look in the opposite direction of the peripheral stimulus). Fixation was followed by a 200 ms gap of a black screen, and then the peripheral stimulus (white spot; 0.5° diameter, ∼62 cd/m2) was displayed on either 10 degrees to the left or right of the fixation point. There were 60 pro-saccade and 60 anti-saccade trials that were pseudo-randomly interleaved in each block of 120 trials. Participants completed two blocks, totaling 240 trials.
Data analysis
Saccade analysis
All saccades were marked for direction, amplitude, peak velocity, and duration using previously established criteria and algorithms 27 (additional details in Supplemental Methods). The time from stimulus appearance to the beginning of the first saccade was defined as saccadic reaction time (SRT). Saccades were categorized into different types based on when they occurred during the task. Saccades triggered ≥90 ms after stimulus appearance were impacted by stimulus appearance and were further divided into express saccades (90–140 ms) and regular latency saccades > 140 ms. 28 Saccades occurring > 800 ms were extremely rare, reflecting drowsiness or lack of attention, and were excluded from further analyses.
Correct saccades were defined as the first saccade ≥90 ms SRT made in the correct direction relative to the task instruction (pro: toward stimulus; anti: away from stimulus). Direction errors were defined as a first saccade ≥90 ms SRT made in the incorrect direction (pro: away from stimulus; anti: toward stimulus). Direction errors in pro-saccade trials were extremely rare and excluded from further analyses. Here, our focus was on the direction errors in the anti-saccade trials, which we separated into express and regular latency error rates due to their distinct neural mechanisms.29,30
We focused on comparing saccade amplitudes only in pro-saccade trials across diseases, as anti-saccade trials exhibited considerable amplitude variations.
Pupil analysis
As pupil size is sensitive to eye position, we restricted analysis of pupil responses to the central fixation epoch prior to stimulus appearance, when the eyes were not moving and participants were fixating on the central fixation point. Following the fixation point appearance, there was an initial constriction of the pupil, driven by saliency and luminance changes,9,31 followed by a dilation response just prior to stimulus appearance that was related to cognitive control. 32 The analysis window extended from fixation point appearance to peripheral stimulus appearance. Baseline pupil size was measured in the epoch 150–200 ms after fixation point appearance when the eyes were stable at the center of the screen. 12 The peak constriction response following fixation point appearance was measured, and pupil dilation was defined as the maximum dilation from peak constriction to peripheral stimulus appearance. Peak dilation velocity was measured as the maximum pupil velocity during the dilation epoch.
Blink analysis
Closure of the eyelids during eye blinks led to a loss of eye tracking data. We developed a customized algorithm to extract these brief periods of data loss (100–400 ms) that were due to eye blinks as opposed to loss of data from a head turn or sleepiness of our participant which produced longer periods of data loss27,33 (details in Supplemental Methods).
Statistical analysis
Statistical evaluations were conducted utilizing IBM SPSS version 27 (IBM, Armonk, NY, USA). Normality assumptions were tested with the Kolmogorov-Smirnov test. Consequently, because data was not normally distributed, we employed non-parametric methods for subsequent analyses. The Kruskal-Wallis H test was employed to assess the statistical significance between groups, followed by pairwise post hoc analyses with Dunn's test for more detailed comparisons. To account for the inflation of Type I error due to multiple comparisons, we applied the Holm-Bonferroni method, which is a stepwise approach that offers a more powerful alternative to the classic Bonferroni correction by sequentially adjusting p-values (details in Supplemental Table 4). Moreover, the following results are reported based on group medians.
Results
Saccade behavior
The cumulative distribution of SRTs for correct and direction error trials in both pro- and anti-saccade tasks revealed between-group differences (Figure 1). The Kruskal–Wallis test indicated significant differences across groups regarding correct pro-SRTs (H(3) = 9.01, p < 0.05, Supplemental Figure 3A). However, after adjusting for multiple comparisons following pairwise comparison, no significant differences remained (CTRL: 185 ms, iRBD :179 ms, PD :170 ms, and MSA: 158 ms).
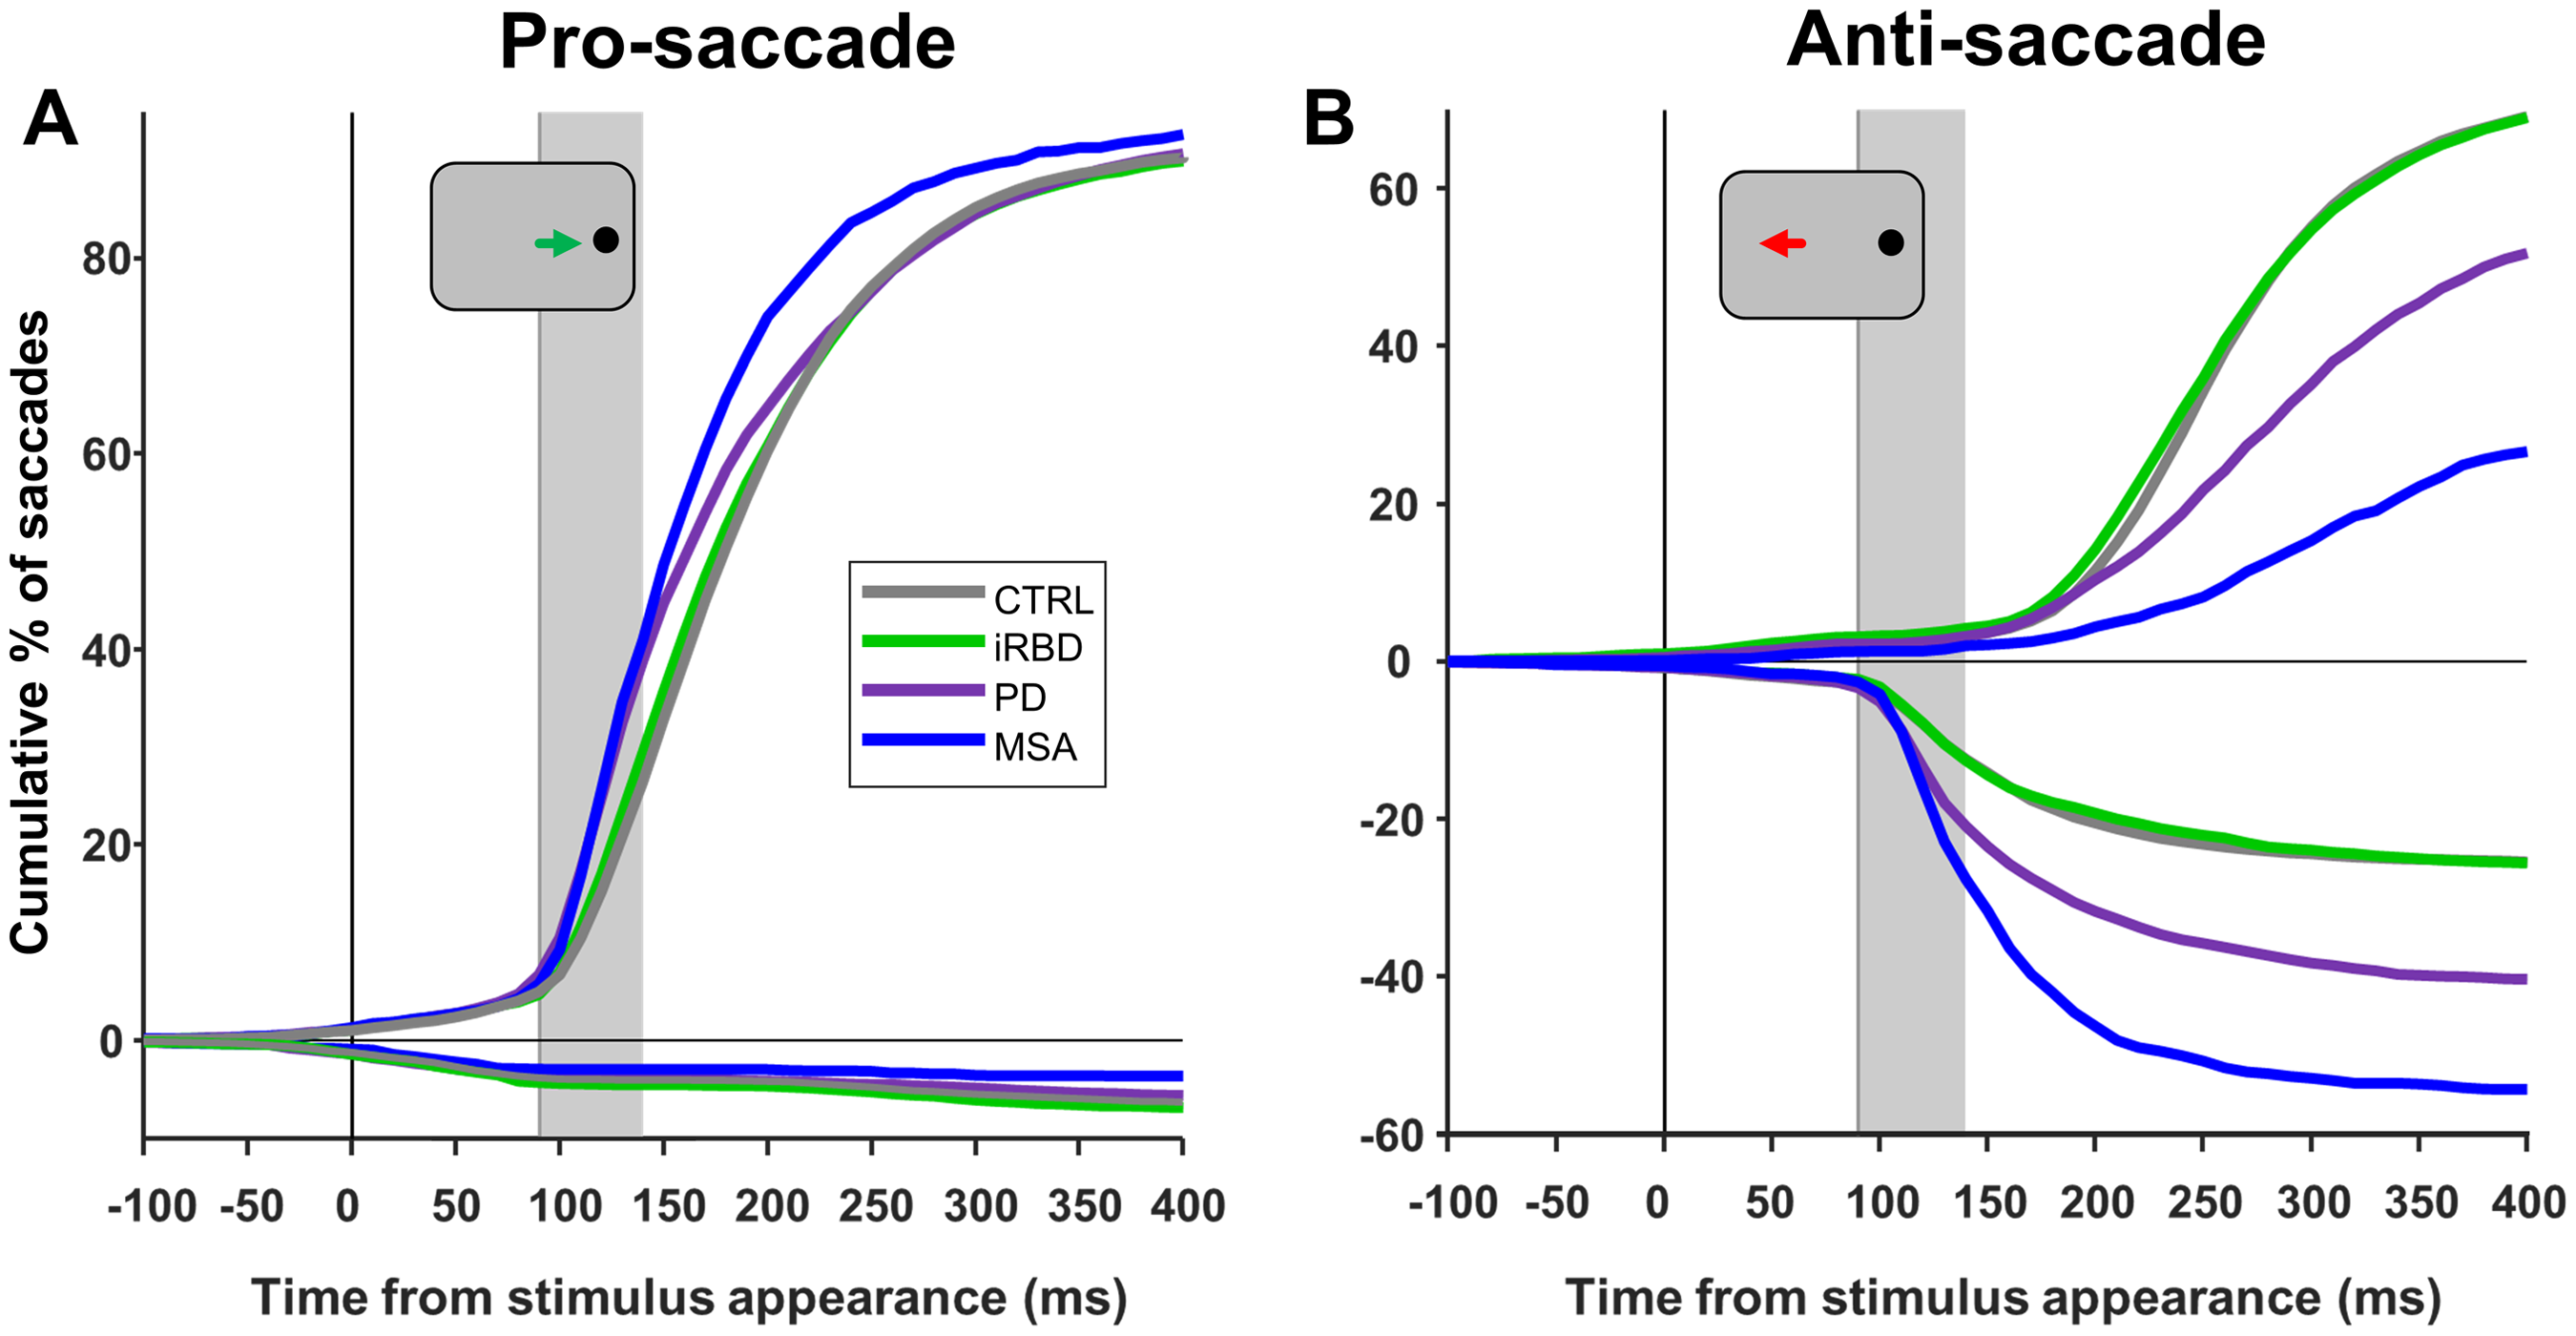
Saccade behavior. Cumulative distribution of saccadic reaction time (SRT) of group responses from −100 to 400 ms from stimulus onset for the (A) pro-saccade and (B) anti-saccade trials. Time zero shows the stimulus onset. The range of express latency saccades is shown by the gray-shaded boxes in (A) and (B) (90:140 ms). Responses shown above the zero line are correct, while those shown below are errors. SRTs were binned into 10 ms epochs to construct the curves. CTRL: Control; iRBD: Isolated REM sleep behavior disorder; PD: Parkinson's disease; MSA: Multiple system atrophy.
There were significant differences across groups regarding correct anti-SRTs (H(3) = 14.32, p < 0.01). MSA patients (318 ms) had slower correct anti-SRTs than CTRL (268 ms, p < 0.05) and iRBD patients (267 ms; p < 0.05, Supplemental Figure 3B). The anti-SRTs of PD patients (295 ms) was not different from any other group.
There were significant differences across groups regarding express saccade rate (H(3) = 13.51, p < 0.01) in the pro-saccade trials. However, there was no significant differences between the groups when doing pairwise comparisons: CTRL (13.33%), iRBD (12.08%), PD (18.33%), and MSA (16.67%) (Supplemental Figure 3C).
There were significant differences across groups regarding express latency direction errors (H(3) = 13.86, p < 0.01). Express latency direction errors were similar in iRBD (3.33%) and CTRL (3.44%) (Supplemental Figure 3D), however, they were significantly elevated in PD (8.33%) compared to CTRL (p < 0.05) and iRBD (p < 0.05). The MSA group (14.17%) also generated more express latency direction errors from other groups, however, this difference was not significant.
There were significant differences across groups regarding regular latency direction errors (H(3) = 11.91, p < 0.01). CTRL and iRBD groups generated comparable numbers of regular latency direction error rates (both 11.67%) (Supplemental Figure 3F). The PD group (16.81%) made significantly more regular latency direction errors than CTRL (p < 0.05). The MSA group (16.67%) also made more regular latency direction errors than CTRL and iRBD, but this difference was not significant.
There were significant differences across groups regarding saccade amplitude in pro-saccade trials (H(3) = 48.92, p < 0.001). CTRL (9.37 degrees) and iRBD (9.35 degrees) groups had similar median saccade amplitude (Supplemental Figure 3E). Saccade amplitude was significantly reduced in PD (8.75 degrees, p < 0.001) and MSA (8.12 degrees, p < 0.001). iRBD saccade amplitude was greater than both PD (p < 0.001) and MSA (p < 0.001).
Pupil behavior
Pupil traces were normalized to baseline at trial onset (Figure 2; Supplemental Figure 4A-D). To provide a broader perspective on pupil dynamics over an extended time period, we included extended pupil size traces in Supplemental Figures 5 and 6. However, because saccades occurred shortly after stimulus appearance and introduced artifacts due to changes in pupil position relative to the camera (see Supplemental Material), we only considered pupil traces up to stimulus appearance.
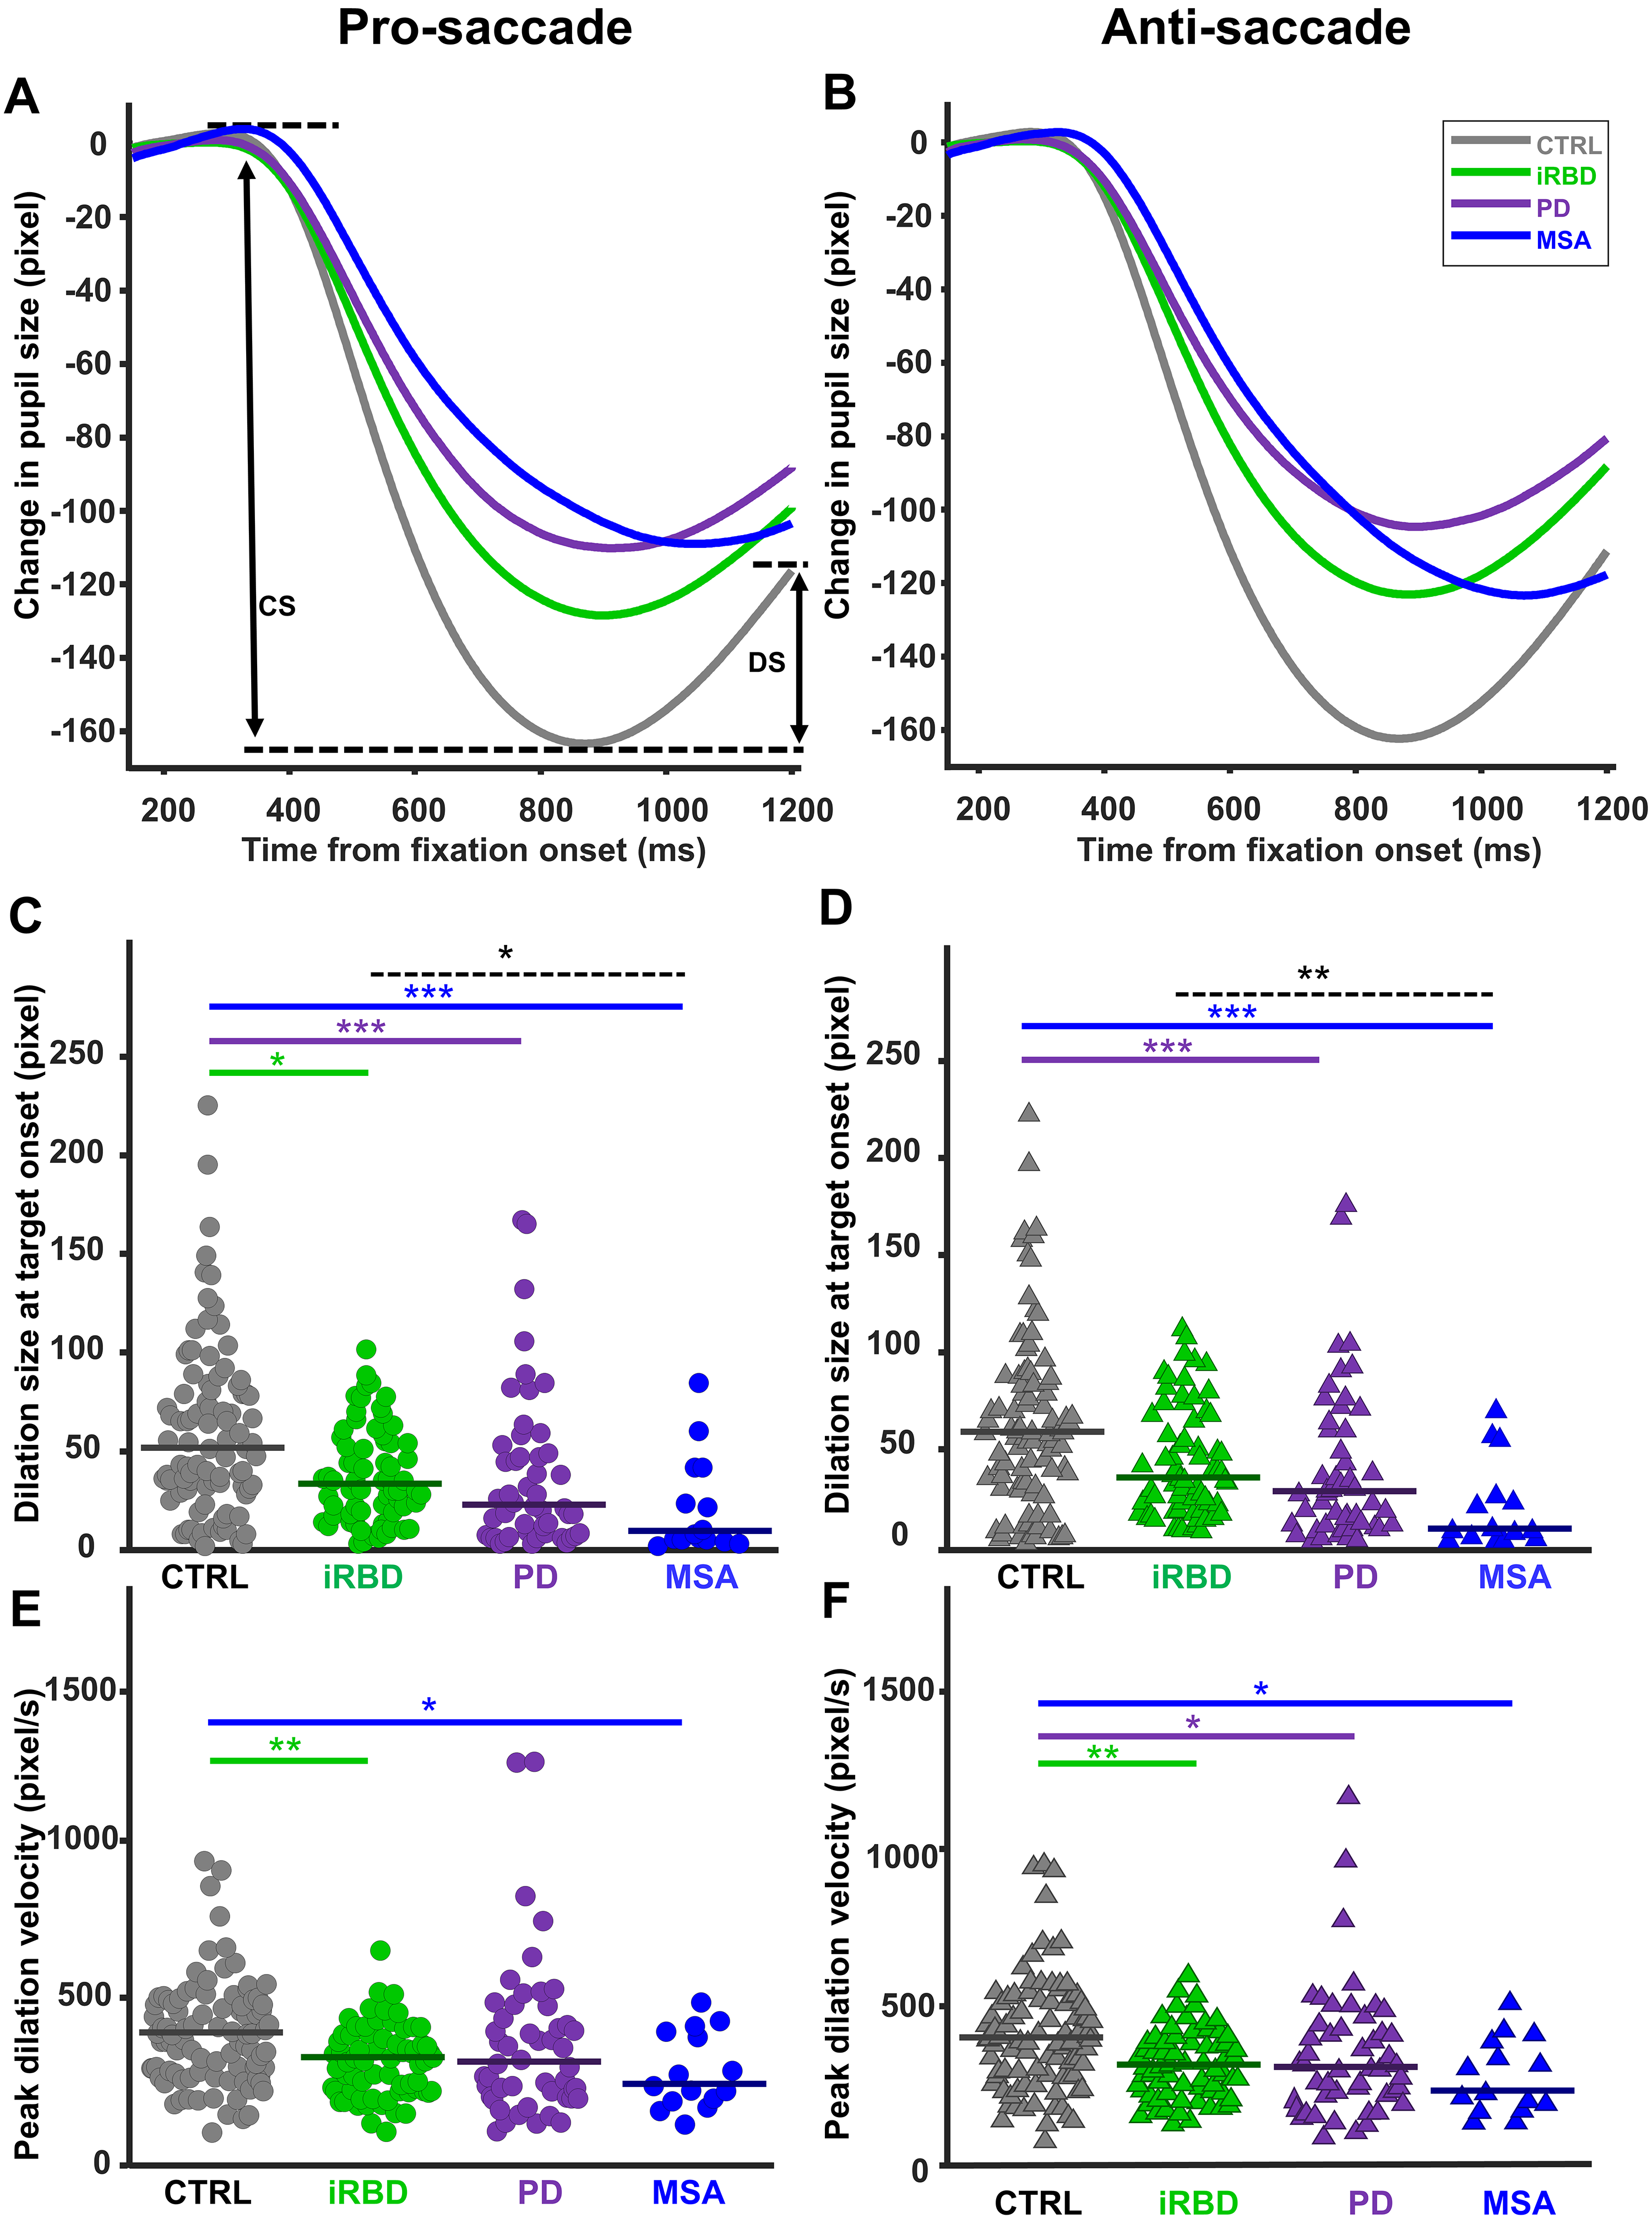
Pupil response. Mean pupil traces for each patient group are represented during the pro- (A) and anti- (B) saccade trials in the fixation period. Each trace represents the average of all potential trials that met the inclusion criteria. In (A), the black arrows indicate the quantification of pupil Constriction size (CS) and dilation size (DS). Dilation size at stimulus onset for each group is depicted during (C) pro-saccade and (D) anti-saccade trials. Peak dilation velocity at stimulus onset for each group is depicted during (E) pro-saccade and (F) anti-saccade trials. The horizontal solid line on each group's data points shows the group median. Significant differences between the groups are indicated by the horizontal lines (solid lines for patient vs. CTRL comparisons and dashed lines for patient-to-patient comparisons). Asterisks show a significant level of *p < 0.05, **p < 0.01, and ***p < 0.001. CTRL: Control; iRBD: Isolated REM sleep behavior disorder; PD: Parkinson's disease; MSA: Multiple system atrophy.
There were no differences in pupil baseline across groups for both pro (H(3) = 1.43, p = 0.69) and anti-saccade trials (H(3) = 1.50, p = 0.68). Following fixation point appearance there was a transient constriction of the pupil that was followed by a dilation just prior to stimulus appearance (Figure 2A, B). There were significant differences in the pupil constriction response between the groups in both pro (H(3) = 9.43, p < 0.05) and anti-saccade trials (H(3) = 9.14, p < 0.05). The PD group had a smaller pupil constriction size than CTRL in both pro and anti-saccade trials (both p < 0.05) (Supplemental Figure 4E, F). There were no other significant differences observed between the groups.
The magnitude of the pupil dilation response was different across the groups in both pro (Figure 2C; H(3) = 26.50, p < 0.001) and anti-saccade trials (Figure 2D; H(3) = 26.57, p < 0.001). In pro-saccade trials, the median pupil dilation sizes for all groups were as follows: CTRL (52.0 pixels), iRBD (33.7 pixels), PD (23.0 pixels), and MSA (9.0 pixels). CTRL had a significantly larger pupil dilation size than iRBD (p < 0.05), PD (p < 0.001), and MSA (p < 0.001). Moreover, MSA had a smaller dilation size than iRBD (p < 0.05). In anti-saccade trials, the median pupil dilation for all groups were as follows: CTRL (59.0 pixels), iRBD (35.5 pixels), PD (28.5 pixels), and MSA (9.0 pixels). The CTRL group had a significantly larger pupil dilation size than PD (p < 0.001), and MSA (p < 0.001). Moreover, MSA had a smaller pupil dilation size than iRBD (p < 0.01).
Peak dilation velocity was different across the groups in both pro (Figure 2E; H(3) = 16.22, p < 0.01) and anti-saccade trials (Figure 2F; H(3) = 18.11, p < 0.001). In pro-saccade trials, the median peak dilation velocities for all groups were as follows: CTRL (390.5 pixels/s), iRBD (312 pixels/s), PD (298 pixels/s), and MSA (227 pixels/s). CTRL had a significantly larger peak dilation velocity than iRBD (p < 0.01) and MSA (p < 0.05). The difference in peak dilation velocity between PD and CTRL did not reach significance.
In anti-saccade trials, the median peak dilation velocities for all groups were as follows: CTRL (401.5 pixels/s), iRBD (314 pixels/s), PD (308 pixels/s), and MSA (231 pixels/s). CTRL had a significantly larger peak dilation velocity than iRBD (p < 0.01), PD (p < 0.05), and MSA (p < 0.05).
Blink behavior
Figure 3A shows the blink probability for each group during the entire task duration collapsed across pro- and anti-saccade trials. We quantified average blink probability in two distinct epochs: ITI (−2000:−1500 ms) and FIX (−900:−40 0 ms) (Figure 3, Supplemental Figure 7). In Figure 3B and 3C and Supplemental Figure 7B-E, we only considered blinks whose starting points were within that epoch, and this is slightly different from the probability curve (Figure 3A, Supplemental Figure 7A) that was considering all blinks including those that already started before that epoch. During the ITI epoch, the median blink probability for the CTRL group was 0.026%, iRBD was 0.020%, PD was 0.017%, and MSA was 0.005% (Figure 3B), which differed significantly across groups (H(3) = 14.93, p < 0.01). CTRL had a higher blink probability than MSA (p < 0.01). iRBD did not follow the αSYN groups. MSA displayed a lower blink probability than iRBD (p < 0.05). During the FIX epoch (Figure 3C), the median blink probabilities also differed significantly across groups (H(3) = 17.07, p < 0.001). The median blink probability for the CTRL group was 0.026%, which was not different from iRBD (0.016%) and PD (0.018%). However, MSA group (0.001%) had significantly lower blink probability than CTRL (p < 0.001), iRBD (p < 0.05), and PD (p < 0.05).
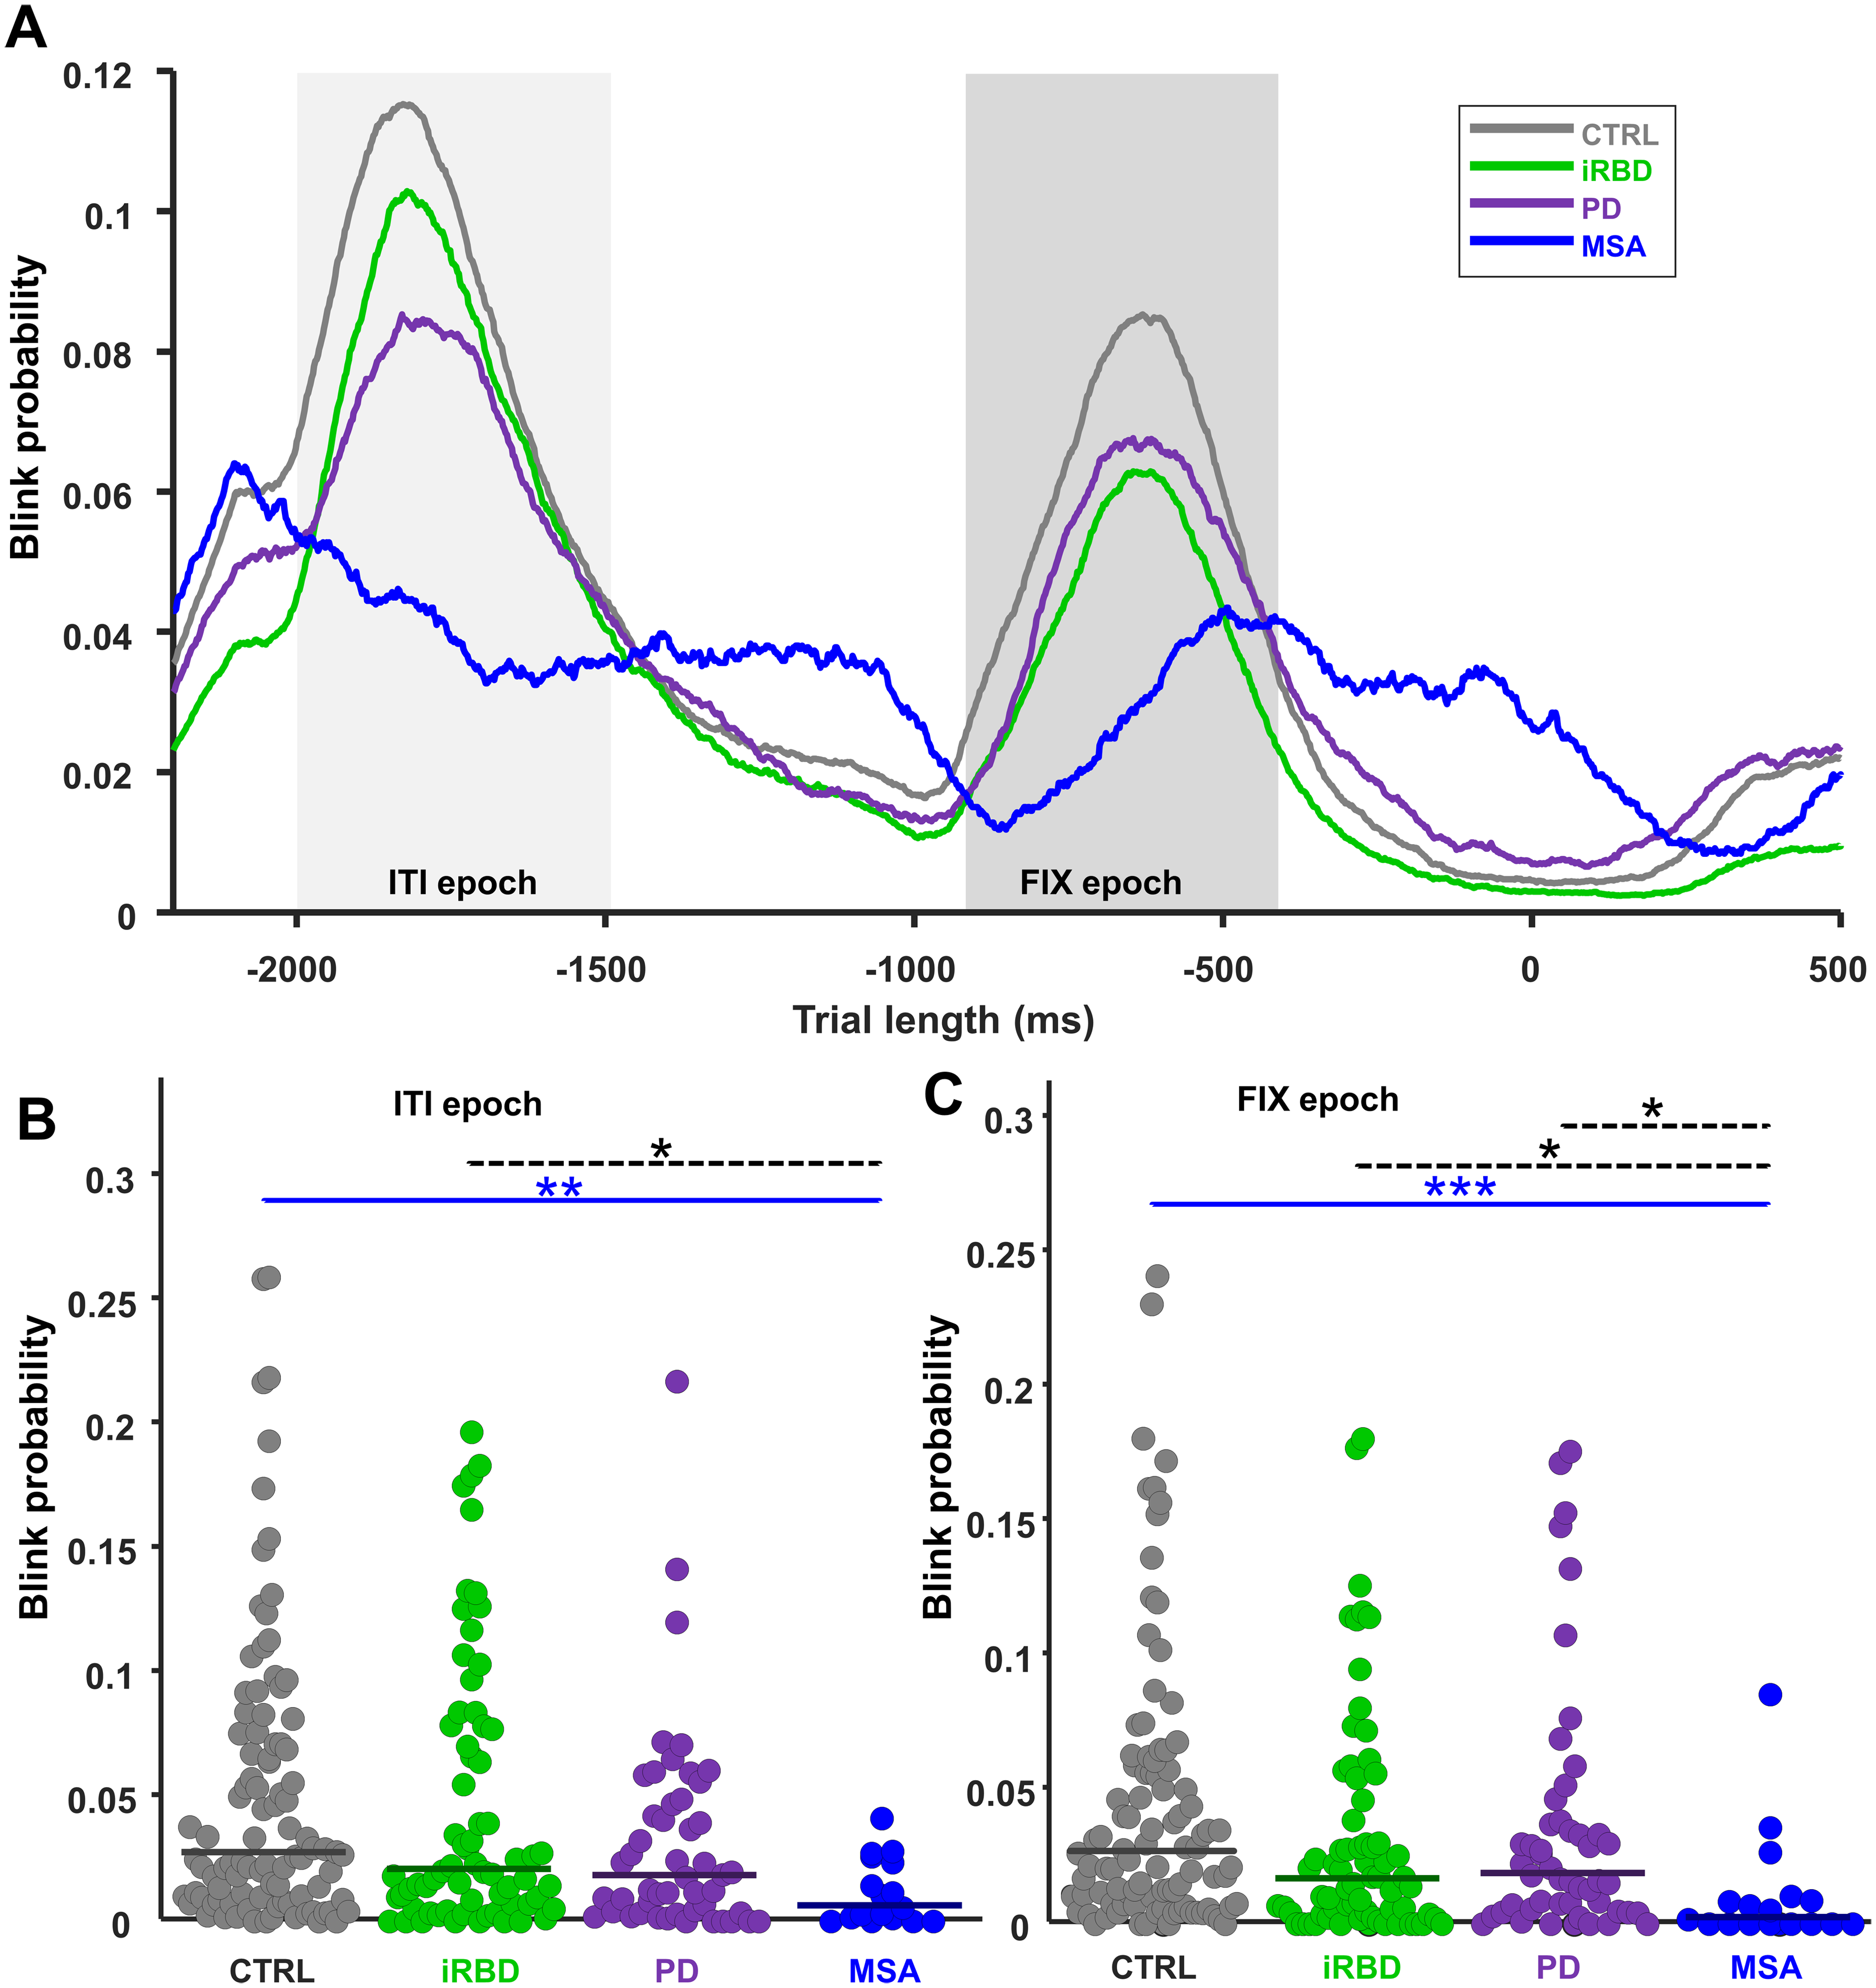
Blink rate probability. (A) Blink rate probability curves for each group from −2200:500 ms relative to stimulus onset were displayed for each group
Clinical correlation with saccade, pupil, and blink
We correlated clinical scores and oculo-pupillo-motor metrics without the iRBD group (Table 1) using Spearman correlation. This decision was based on the observation that iRBD patients generally exhibited better overall (normal) UPDRS-III scores compared to those with PD and MSA, as seen in Supplemental Figure 8A. Individuals who scored higher on the UPDRS-III scale exhibited saccades with reduced amplitudes (rho: −0.46, p < 0.01) (Supplemental Figure 8B).
UPDRS-III correlations with saccade, pupil, and blink metrics.
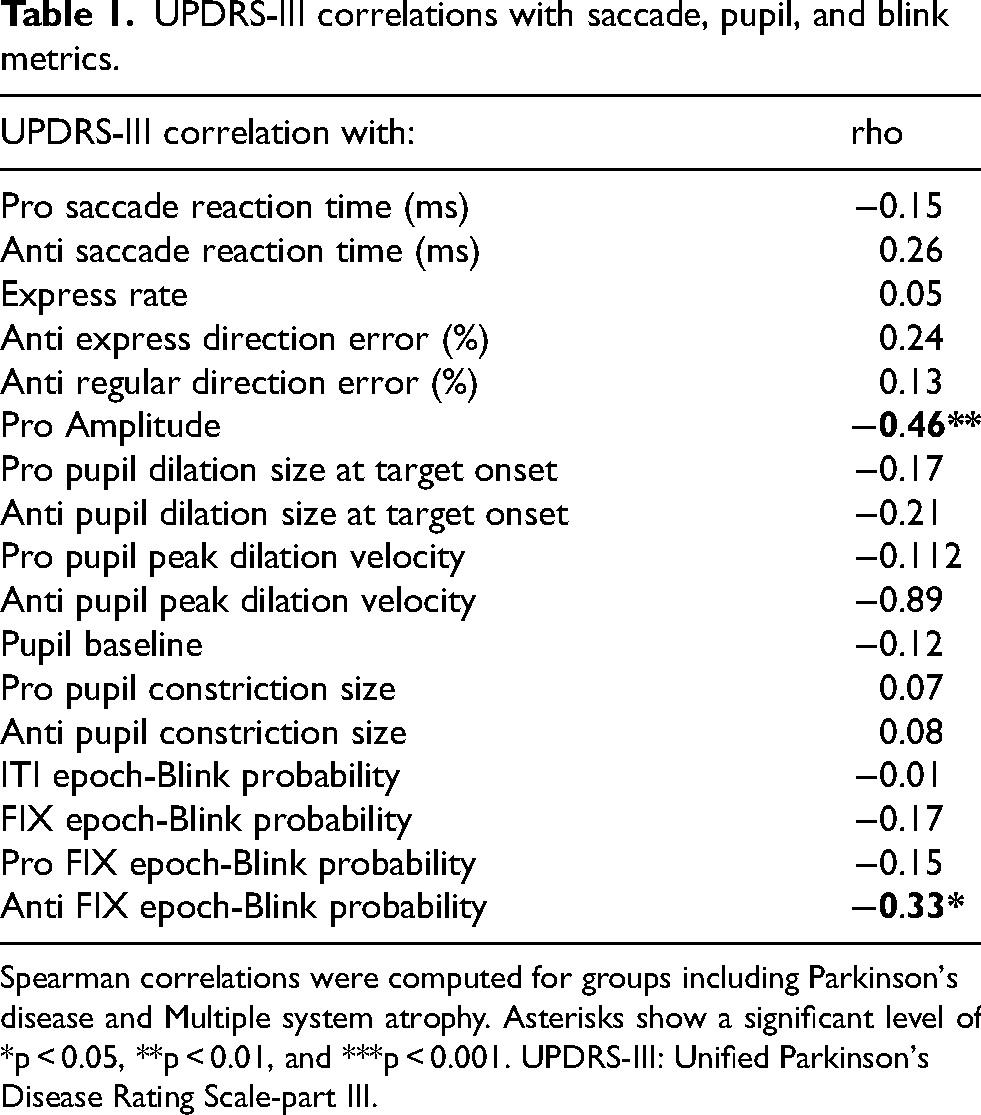
Spearman correlations were computed for groups including Parkinson's disease and Multiple system atrophy. Asterisks show a significant level of *p < 0.05, **p < 0.01, and ***p < 0.001. UPDRS-III: Unified Parkinson's Disease Rating Scale-part III.
No correlation was found between pupil metrics and UPDRS-III scores. However, blink probability during the fixation epoch was negatively correlated with UPDRS-III scores (rho: −0.33, p < 0.05; Supplemental Figure 9), suggesting that patients with more severe motor symptoms had a lower probability of blinking during this epoch.
Datscan outcomes and variations in saccade, pupil, and blink in iRBD patients
In our study of iRBD patients, we classified participants into two groups based on their DaTscan results—normal (n = 31) and abnormal (reduced) (n = 31). In pro-saccade trials, the median pupil dilation size at stimulus appearance was smaller (H(1) = 4.31, p < 0.05) for the abnormal group (24 pixels, SD = 23.96) compared to the normal group (43 pixels, SD = 22.67). Similarly, the median baseline pupil size in the pro-saccade condition was significantly larger in the normal group (2038 pixels, SD = 666.22) than in the abnormal group (1346 pixels, SD = 932.35) (H(1) = 4.85, p < 0.05). In the anti-saccade condition, the median baseline pupil size was larger in the normal group (2080.5 pixels, SD = 665.22) compared to the abnormal group (1336.0 pixels, SD = 929.18) (H(1) = 5.04, p < 0.05). Detailed statistical analyses and further information are provided in the Supplemental Material (Supplemental Table 3). These findings underscore significant variations in pupil dynamics based on DaTscan outcomes among iRBD patients raising the question of whether pupil metrics can serve as predictive indicators for progression to pathological DaTscan results.
TDI scores and variations in saccade, pupil, and blink in iRBD patients
To investigate the impact of smell dysfunction on eye movements, we categorized the RBD cohort into two groups based on the severity of Hyp-/Anosmia: Moderate-Severe Hyp-/Anosmia (n = 46, TDI < 21) and Normal-Mild Hyposmia (n = 20, TDI ≥ 21).
In pro-saccade trials, the median pupil dilation size at stimulus appearance was significantly smaller in the Moderate-Severe Hyp-/Anosmia group (29.75 pixels) compared to the Normal-Mild Hyposmia group (46 pixels), with a statistical difference of H(1) = 6.8, p < 0.01. Similarly, in anti-saccade trials, the Moderate-Severe Hyp-/Anosmia group exhibited a smaller median pupil dilation size (32.25 pixels) than the Normal-Mild Hyposmia group (62.5 pixels), with H(1) = 5.96, p < 0.05. Furthermore, the express saccade direction error rate was significantly higher in the Moderate-Severe Hyp-/Anosmia group (5%) compared to the Normal-Mild Hyposmia group (1.66%), with H(1) = 4.31, p < 0.05.
We also observed a positive correlation between TDI scores and pupil dilation sizes in both pro-saccade (Spearman's rho = 0.27, p < 0.05) and anti-saccade trials (Spearman's rho = 0.25, p < 0.05). These findings indicate that less severe Hyp-/Anosmia is associated with greater pupil dilation. While additional parameters such as saccade latency, pupil constriction, and blink rates were measured, only the differences and correlations previously mentioned reached statistical significance.
Discussion
Here, we used an interleaved pro-/anti-saccade task to identify abnormalities in saccade, pupil, and blink behavior in PD and MSA and contrasted this pattern to an αSYN prodrome cohort: iRBD. To the best of our knowledge, this is the first study of pro- and anti-saccades that directly compared PD and MSA to such a large cohort of iRBD patients. We discovered that horizontal saccade parameters and blink behavior were normal in iRBD, but pupil parameters were altered in iRBD, as in PD and MSA. The extent of early alterations in pupillary parameters seems to be associated with the decline in DaTscan results as well as the severity of hyposmia. These observations clearly indicate that the premotor control circuits governing pupil are impacted by iRBD disease processes before saccade control circuits are affected.
Relation to the earlier studies of α-synucleinopathies
Our findings in PD patients align with previous studies using pro- and anti-saccade tasks.3–5,34–39 PD patients produced more anti-saccade direction errors (Supplemental Figure 3D). Additionally, the saccade hypometria we observed in PD patients (Supplemental Figure 3E) was consistent with numerous earlier studies.3,16,40 Regarding pupil responses, relative to CTRL, PD patients displayed a weaker dilation response (Figure 2), leading to a prolonged time to peak pupil constriction.3,12,41 Moreover, our findings align closely with prior studies that have reported that PD patients exhibited longer latency pupil constriction time and reduced pupil constriction amplitude.41,42
Fewer studies have described eye-tracking abnormalities in MSA patients.37,43 We found that MSA participants had longer SRTs in the anti-saccade task (Figure 1B, Supplemental Figure 3B). We also identified a reduction in saccade amplitude in pro-saccade trials, consistent with prior studies.36,40 Pupil dilation responses were reduced in MSA, consistent with a previous study that correlated these reduced responses with disease severity. 43 Other studies have also identified pupil abnormalities in MSA employing other tasks.44–46 The reduction in blink probability in MSA patients displayed a distinct difference compared to other groups (Figure 3). 47 Unlike the other groups, it appears that MSA patients struggled to control their blinking or time it properly in response to task events.
Relation to the prodromal stage of synucleinopathy
The most important observations we described were abnormal pupil responses in iRBD, but normal saccade and blink control. We found that iRBD patients exhibited reduced pupil dilation size in pro-saccade trials (Figure 2C) and reduced peak dilation velocity in both pro and anti-saccade trials (Figure 2E, F). However, it is important to note that other studies have identified subtle vertical saccade abnormalities in iRBD.4,16 We did not investigate vertical pro- and anti-saccades and instead focused on collecting more horizontal trials.
The presence of pupil abnormalities without horizontal saccade abnormalities in iRBD suggests that the onset of saccadic impairments likely occurs later in the disease's course, while pupil impairments manifest earlier. The pupil abnormalities we found in iRBD were similar to those in PD and MSA, suggesting that there may be shared underlying mechanisms that form a pathological continuum. This is in line with the Braak staging hypothesis, which proposes that neurodegeneration in PD initiates in the lower brainstem and ascends toward the midbrain and basal ganglia selectively impacting nuclei containing monoaminergic neurons. 48
The locus coeruleus (LC) contains noradrenergic neurons and is impacted at stage two of the Braak framework. Its early involvement may contribute to the non-motor symptoms observed in PD, such as cognitive and emotional disturbances, as well as visual dysfunction.9,49 LC is also a key part of the pupil premotor circuit9,50,51 and has a primary role in the autonomic regulation of pupil size through its noradrenergic output. The impaired pupillary dilation noted here in iRBD could reflect an early compensatory upregulation of cholinergic pathways, potentially leading to an overactive parasympathetic response that disrupts sympathetic control.52–54 Therefore, LC may already be pathologic in iRBD patients, as supported by previous literature. 55
Our finding demonstrated distinct differences in pupillary dynamics between normal and abnormal DaTscan groups among iRBD patients. We also showed that pupil responses were different between the groups with severe versus normal to moderate smell disfunction. These differences highlight the potential of using pupil measurements as early indicators for disease progression in iRBD. The ability to predict pathological conditions through non-invasive means such as pupil assessment may represent a significant advancement in the early detection and monitoring of the progression iRBD.
Limitations and future directions
This work needs to be followed up with longitudinal studies of iRBD participants to determine if the onset of saccade abnormalities coincides with conversion to alpha-synucleinopathy. In addition, a more detailed study is required to identify oculo-pupillo-motor abnormalities that differentiate MSA and PD at the early stages of the disease. Additionally, we recognize that incorporating various subtypes of MSA may have introduced variability into the data. Future research should aim to collect more detailed data on MSA subtypes to determine if significant differences exist.
In this study, we combined the data from both the on and off stages of dopaminergic medication based on previous literature showing minimal changes in saccade behavior in PD in on versus off states. 8 However, it would be advantageous to segregate the patient groups and conduct more specific analyses of any drug effects, particularly as they pertain to pupil and blink responses.
In summary, this study presents novel insights into premotor control circuit dysfunctions in α-synucleinopathies, revealing that pupil abnormalities in iRBD patients manifest prior to saccade impairment. The degree of these early changes in pupillary parameters appears to be related to the reduction in DaTscan and also to the degree of hyposmia. As such, these changes in the pupillary function—combined with DaTscan and olfactory testing—may contribute to monitoring the therapeutic response of strategies that could intervene at a stage when neurodegeneration might still be amenable to modification.
Supplemental Material
sj-docx-1-pkn-10.1177_1877718X241308193 - Supplemental material for Saccade, pupil, and blink abnormalities in prodromal and manifest alpha-synucleinopathies
Supplemental material, sj-docx-1-pkn-10.1177_1877718X241308193 for Saccade, pupil, and blink abnormalities in prodromal and manifest alpha-synucleinopathies by Maha Habibi, Brian C Coe, Donald C Brien, Jeff Huang, Heidi C Riek, Frank Bremmer, Lars Timmermann, Annette Janzen, Wolfgang H Oertel and Douglas P Munoz in Journal of Parkinson's Disease
Footnotes
Acknowledgments
We are grateful to Elisabeth Sittig for her support in the phenotyping and long-term documentation of subjects suffering from iRBD. We are also thankful to Karen Wilhelm, Felix Bernhard, and Julia Perkins who participated in some of the early data collection.
Funding
This project was supported by the German Research Foundation, International Research Training Group, IRTG 1901, to WHO and FB, the Canadian Institutes of Health Research (MOP-FDN-148418; PJT-190028) to DPM and the Hessian Ministry of Higher Education, Research, Science and the Arts - HMWK (Cluster project The Adaptive Mind and LOEWE - Exploration, project number LOEWE/5/A005/519/06/00.006(0007)/E39) to FB. AJ and WHO are supported by Parkinson Fonds Deutschland and Stichting Parkinson Fonds, The Netherlands. WHO is Hertie-Senior-Research-Professor supported by the Charitable Hertie Foundation, Frankfurt/Main, Germany. Open Access funding was provided by the Open Access Publishing Fund of Philipps-Universität Marburg. The authors have no financial disclosures or conflicts of interest.
Declaration of conflicting interests
The authors declared no potential conflicts of interest with respect to the research, authorship, and/or publication of this article.
Data availability
The datasets used and/or analyzed during the current study are available from the corresponding author upon reasonable request.
Supplemental material
Supplemental material for this article is available online.
References
Supplementary Material
Please find the following supplemental material available below.
For Open Access articles published under a Creative Commons License, all supplemental material carries the same license as the article it is associated with.
For non-Open Access articles published, all supplemental material carries a non-exclusive license, and permission requests for re-use of supplemental material or any part of supplemental material shall be sent directly to the copyright owner as specified in the copyright notice associated with the article.