
Abstract
Background
Immune-inflammatory responses and dysregulation play a key role in liver fibrosis (LF) and cirrhosis progression, but the phenotypic and functional dynamics of immune cell populations remain poorly characterized.
Methods
LF-related data from the GEO database were analyzed using ssGSEA to quantify immune cell infiltration and Kaplan-Meier analysis to assess the prognostic value of specific immune cell populations. Single-cell RNA sequencing data were used to establish an immune cell atlas, identify cell types linked to poor prognosis, and validate characteristic genes. Additionally, the functional distinctions and cell-cell interactions were further investigated.
Results
LF patients showed increased infiltration of monocytes, T cells, and NK cells, associated with poor outcomes. Genes linked to poor prognosis were markedly expressed in mononuclear phagocytes, T cells, and innate lymphoid cells (ILCs), which were further classified into 24 distinct subpopulations. Pro-fibrotic scar-associated macrophages and pro-inflammatory ILCs increased, while anti-inflammatory Kupffer cells and protective ILCs decreased. CCR7-expressing T cells and depletion-related genes were elevated in peripheral blood mononuclear cells, with ILCs showing increased expression of S1PR4 and S1PR5. Furthermore, macrophages expressing CD9 and IGFBP7 were identified.
Conclusion
This study highlights immune heterogeneity in LF, identifying key cell populations linked to disease progression, offering potential immunotherapy targets.
Introduction
Liver fibrosis (LF) represents a pathological progression that culminates in chronic liver disease and ultimately cirrhosis, a condition affecting millions globally and resulting in over one million annual fatalities, placing a substantial strain on global healthcare systems. 1
LF is defined by the pathological proliferation of connective tissue and excessive extracellular matrix (ECM) accumulation in the liver, 2 driven by a multifaceted mechanism involving diverse immune cells and a complex cytokine network operating through both autocrine and paracrine signaling. 3 Immune cells exhibit opposing functions in fibrosis, either advancing its progression or contributing to its resolution. Macrophages, in particular, perform diverse roles. M1 macrophages exacerbate LF by secreting fibrogenic mediators that activate hepatic stellate cells (HSCs), 4 whereas during fibrosis regression, macrophages induce HSC apoptosis 5 and promote ECM degradation through matrix metalloproteinase (MMP) secretion, supporting fibrosis reversal. 6 Other immune cells, beyond macrophages, are implicated in the progression of LF. Natural killer (NK) cells, a subset of lymphocytes, potentially mitigate LF by triggering apoptosis in activated HSCs. 7 T cells also play a central role in fibrosis, with Th1 and Th17 CD4+ T cell subsets secreting pro-inflammatory mediators that promote fibrogenesis.8,9 Additionally, tissue-resident memory CD8+ T cells have been linked to LF resolution through apoptosis. 10 The immune system's involvement is significant in both the advancement and reversal of fibrosis, yet the functional interactions and phenotypic changes among various immune cells during fibrotic progression remain insufficiently characterized. A deeper understanding of these processes may underpin the future development of immunotherapeutic approaches in clinical practice.
The introduction of single-cell RNA sequencing (scRNA-seq) technology enables precise identification and characterization of cellular modifications during disease progression at the single-cell level. While microarrays lack the resolution to assess individual cell changes, they remain valuable for large-scale studies by measuring overall gene expression across cell populations in a given sample. This study aims to leverage scRNA-seq to comprehensively explore the diversity of immune cell types and subtypes in LF. By applying multi-faceted bioinformatic analyses, we intend to characterize functional variations, immune dynamics, and intercellular communication networks that contribute to immune cell heterogeneity. Integrating these findings with microarray data will help identify immune cell subpopulations potentially associated with disease severity and progression. Such insights could guide the development of innovative and precise immunotherapies for LF.
Materials and methods
Study design
The study design encompassed a comprehensive bioinformatics pipeline integrating harmonized microarray and single-cell RNA sequencing data to elucidate the relationship between immune cell alterations and the prognosis of LF patients, as well as their contribution to fibrosis progression. Initially, public datasets were integrated to generate robust combined data for comprehensive analyses. Subsequently, various bioinformatics methods, including Single-sample gene set enrichment analysis (ssGSEA) for immune cell infiltration, Kaplan-Meier (KM) survival analyses, pseudotime analysis, Cellchat for cell-cell interactions, and differential expression analysis, were systematically applied to provide a holistic understanding of the complex immune heterogeneity associated with LF. The detailed study design is outlined in Supplementary Figure 1.
Acquisition of array data and scRNA-Seq data
We obtained array and scRNA-seq data from the Gene Expression Omnibus (GEO) database (http://www.ncbi.nlm.nih.gov/geo/) based on the following criteria: relevance to human LF or cirrhosis, availability of gene expression profiles, sufficient sample size for robust statistical analysis, availability of associated clinical or pathological information, and public accessibility of raw data. Datasets meeting these criteria, including GSE6764, GSE14323, GSE25097, GSE45050, GSE139602, GSE89377, GSE15654, and GSE84044, were retrieved. Additionally, the single-cell dataset GSE136103, which included cirrhosis-associated tissue and peripheral blood mononuclear cells (PBMCs), was accessed alongside PBMC datasets GSE149689 and GSE167363 from healthy controls. Supplementary Table 1 provided detailed descriptions. To form the training set, five cirrhosis-related datasets (GSE6764, GSE14323, GSE25097, GSE45050, and GSE139602) were combined using the “Combat” method, with GSE89377 designated as the test set.
Analysis of tissue immune cell infiltration degree
The ssGSEA was conducted utilizing the R packages “GSVA” (v1.42.0), 11 “limma” (v3.50.3), and “GSEABase” (v1.56.0). 12 to quantify the relative infiltration of immune cells across the samples. Immune cell infiltration in tissue samples from both the training and test cohorts was assessed using 28 predefined immune gene sets or custom sets based on Zlatko Trajanoski et al., 13 with visualization achieved through the “ggplot2” (v3.4.0) package.
Consensus clustering analysis of immune scores
Based on the immune cell infiltration profile, consensus clustering was applied using a resampling approach to delineate clusters within the GSE15654 dataset, which included 216 samples representing different stages of LF. The “ConsensusClusterPlus” package (v1.58.0) facilitated this analysis. 14 The consensus score matrix, in conjunction with the CDF curve, was then utilized to define the optimal cluster number.
Km analysis
Clinical data from the GSE15654 dataset, including metrics on overall survival, HCC onset, Child grade, and liver decompensation, were analyzed. Preliminary data for the 216 patients from this dataset can be found in the supplementary material 2. To evaluate the prognostic relevance of cell subsets and gene-expression signatures, the correlation of overall survival, HCC development, Child grade, and liver decompensation events with the ssGSEA score was analyzed using a two-sided log-rank test within the “survival” package (v3.5-0). Additionally, optimal cut-off points for each score were determined through maximally selected logrank statistics via the “surv_cutpoint” function in the “survminer” package (v0.4.9) in R.
Enrichment analysis
Transcriptome data were employed to perform gene set enrichment analysis (GSEA), 15 enabling the assessment of molecular disparities between cases and controls. The analysis concentrated on biological processes as delineated by the Gene Ontology framework.
ScRNA-Seq data analysis
The single-cell dataset GSE136103 included data from tissues of five healthy individuals, five patients with liver cirrhosis and fibrosis, as well as PBMCs from four patients. In samples labeled Healthy 5, Patient 4, and Patient 5, CD45+ cells were specifically isolated through flow cytometric fluorescence sorting. Subsequent single-cell analysis was conducted using the Seurat package (v4.3.0). 16 For a comprehensive description of the methods, refer to the supplementary document.
Identification of genes associated with a poor prognosis
Gene expression data from the GSE15654 dataset were analyzed for correlations with overall survival, HCC onset, Child–Pugh class progression, and decompensation events using univariate Cox regression. The “survival” package (v3.5-0) was employed to determine the statistical relevance of these gene-expression associations. Genes with a hazard ratio (HR) > 1 and a p-value < 0.05 were identified and compiled into a specific gene set. The spatial distribution of these gene sets within the single-cell atlas was subsequently mapped using the “AUCell” package (v1.18.1) in R. 17
Evaluation of the heterogeneity of single-cell subpopulations
Liu et al. 18 introduced the “ROGUE” package (v1.0), utilizing a differential entropy-based metric to evaluate cellular heterogeneity, with a ROGUE index ranging from 0 to 1. A default threshold of >0.9 indicated high subpopulation purity, while scores below this suggest lower purity. This tool quantifies cell type purity, enabling robust and precise clustering independent of sequencing depth. In this study, the ROGUE package with default parameters was applied to assess subpopulation purity and analyze cellular heterogeneity.
Pseudotime analysis of single cells
Differentiation trajectories of specific cell clusters were mapped using the Monocle2 algorithm. Seurat's “subset” function facilitated the isolation of relevant cell subpopulations, while the “newCellDataSet” function within Monocle2 (v2.22.0) 19 created “CellDataSet” objects, with the “lowerDetectionLimit” parameter set at 0.5. Low-quality cells and genes were subsequently filtered through the “detectGenes” and “subset” functions, respectively, utilizing a “min_expr” threshold of 0.1. Dimensionality reduction was achieved via the “DDRTree” method, with “max_components” configured to 2. Post cell sorting, trajectory visualization was performed using the “plot_cell_trajectory” function. Monocle3 (v1.2.9) 19 offers an alternative for trajectory analysis. To infer the direction of cell differentiation, CytoTRACE (v0.3.3), 20 an unsupervised tool for predicting relative cell differentiation based on scRNA-seq data, was used to calculate the differentiation score. Visualization and ranking of cell subpopulations were carried out through the “plotCytoGenes” and “plotCytoTRACE” functions, with CytoTRACE scores ranging from 0 (more differentiated) to 1 (less differentiated).
Statistical analyses
Statistical analyses were conducted using R software (v4.1.3) (http://www.R-project.org). Two-tailed t-tests or Student's t-tests were applied to assess statistical significance.
Results
Degree of immune infiltration was correlated with the prognosis of patients with LF
Integration of five datasets was performed using the Combat method, with PCA confirming a balanced sample distribution (Supplementary Figures 2A–2C). These five datasets constituted the training set, while GSE89377 served as the test set. Immune cell infiltration was analyzed via ssGSEA in samples from the training set (44 normal and 119 stage 4 LF samples), the test set (13 normal and 12 stage 4 LF samples), and GSE15654 (216 samples across various LF stages). Through the intersection of differential immune cell types from the training and test sets, 11 immune cell types were identified for further analysis: activated B cells, activated CD8+ T cells, gamma delta T cells, immature B cells, mast cells, monocytes, NK T cells, type 1T helper cells, effector memory CD4+ T cells, central memory CD4+ T cells, and effector memory CD8+ T cells (Figure 1A–1C). Infiltration levels of 11 immune cell types in 216 LF patients from the GSE15654 dataset were used to stratify patients into two clusters via consensus clustering analysis (Figures 1D-1E). Cluster 2 demonstrated a notably higher immune score (Figures 1F). KM analysis further indicated that patients in cluster 1 experienced better overall survival rates, reduced HCC incidence, improved Child grade, and fewer liver decompensation events in the GSE15654 cohort (Supplementary Figure 3A-3D). This implies that immune cell presence may substantially impact prognosis in LF patients. Given the role of PTPRC (CD45) as an immune cell marker and its regulatory function, further analysis focused on the PTPRC gene. Stratifying the 216 patients into high and low PTPRC expression groups, based on a predefined cut-off, revealed that elevated PTPRC expression correlates with poorer prognosis (Supplementary Figure 3E-3H). These observations suggest that elevated immune infiltration was frequently associated with worse outcomes in LF patients.
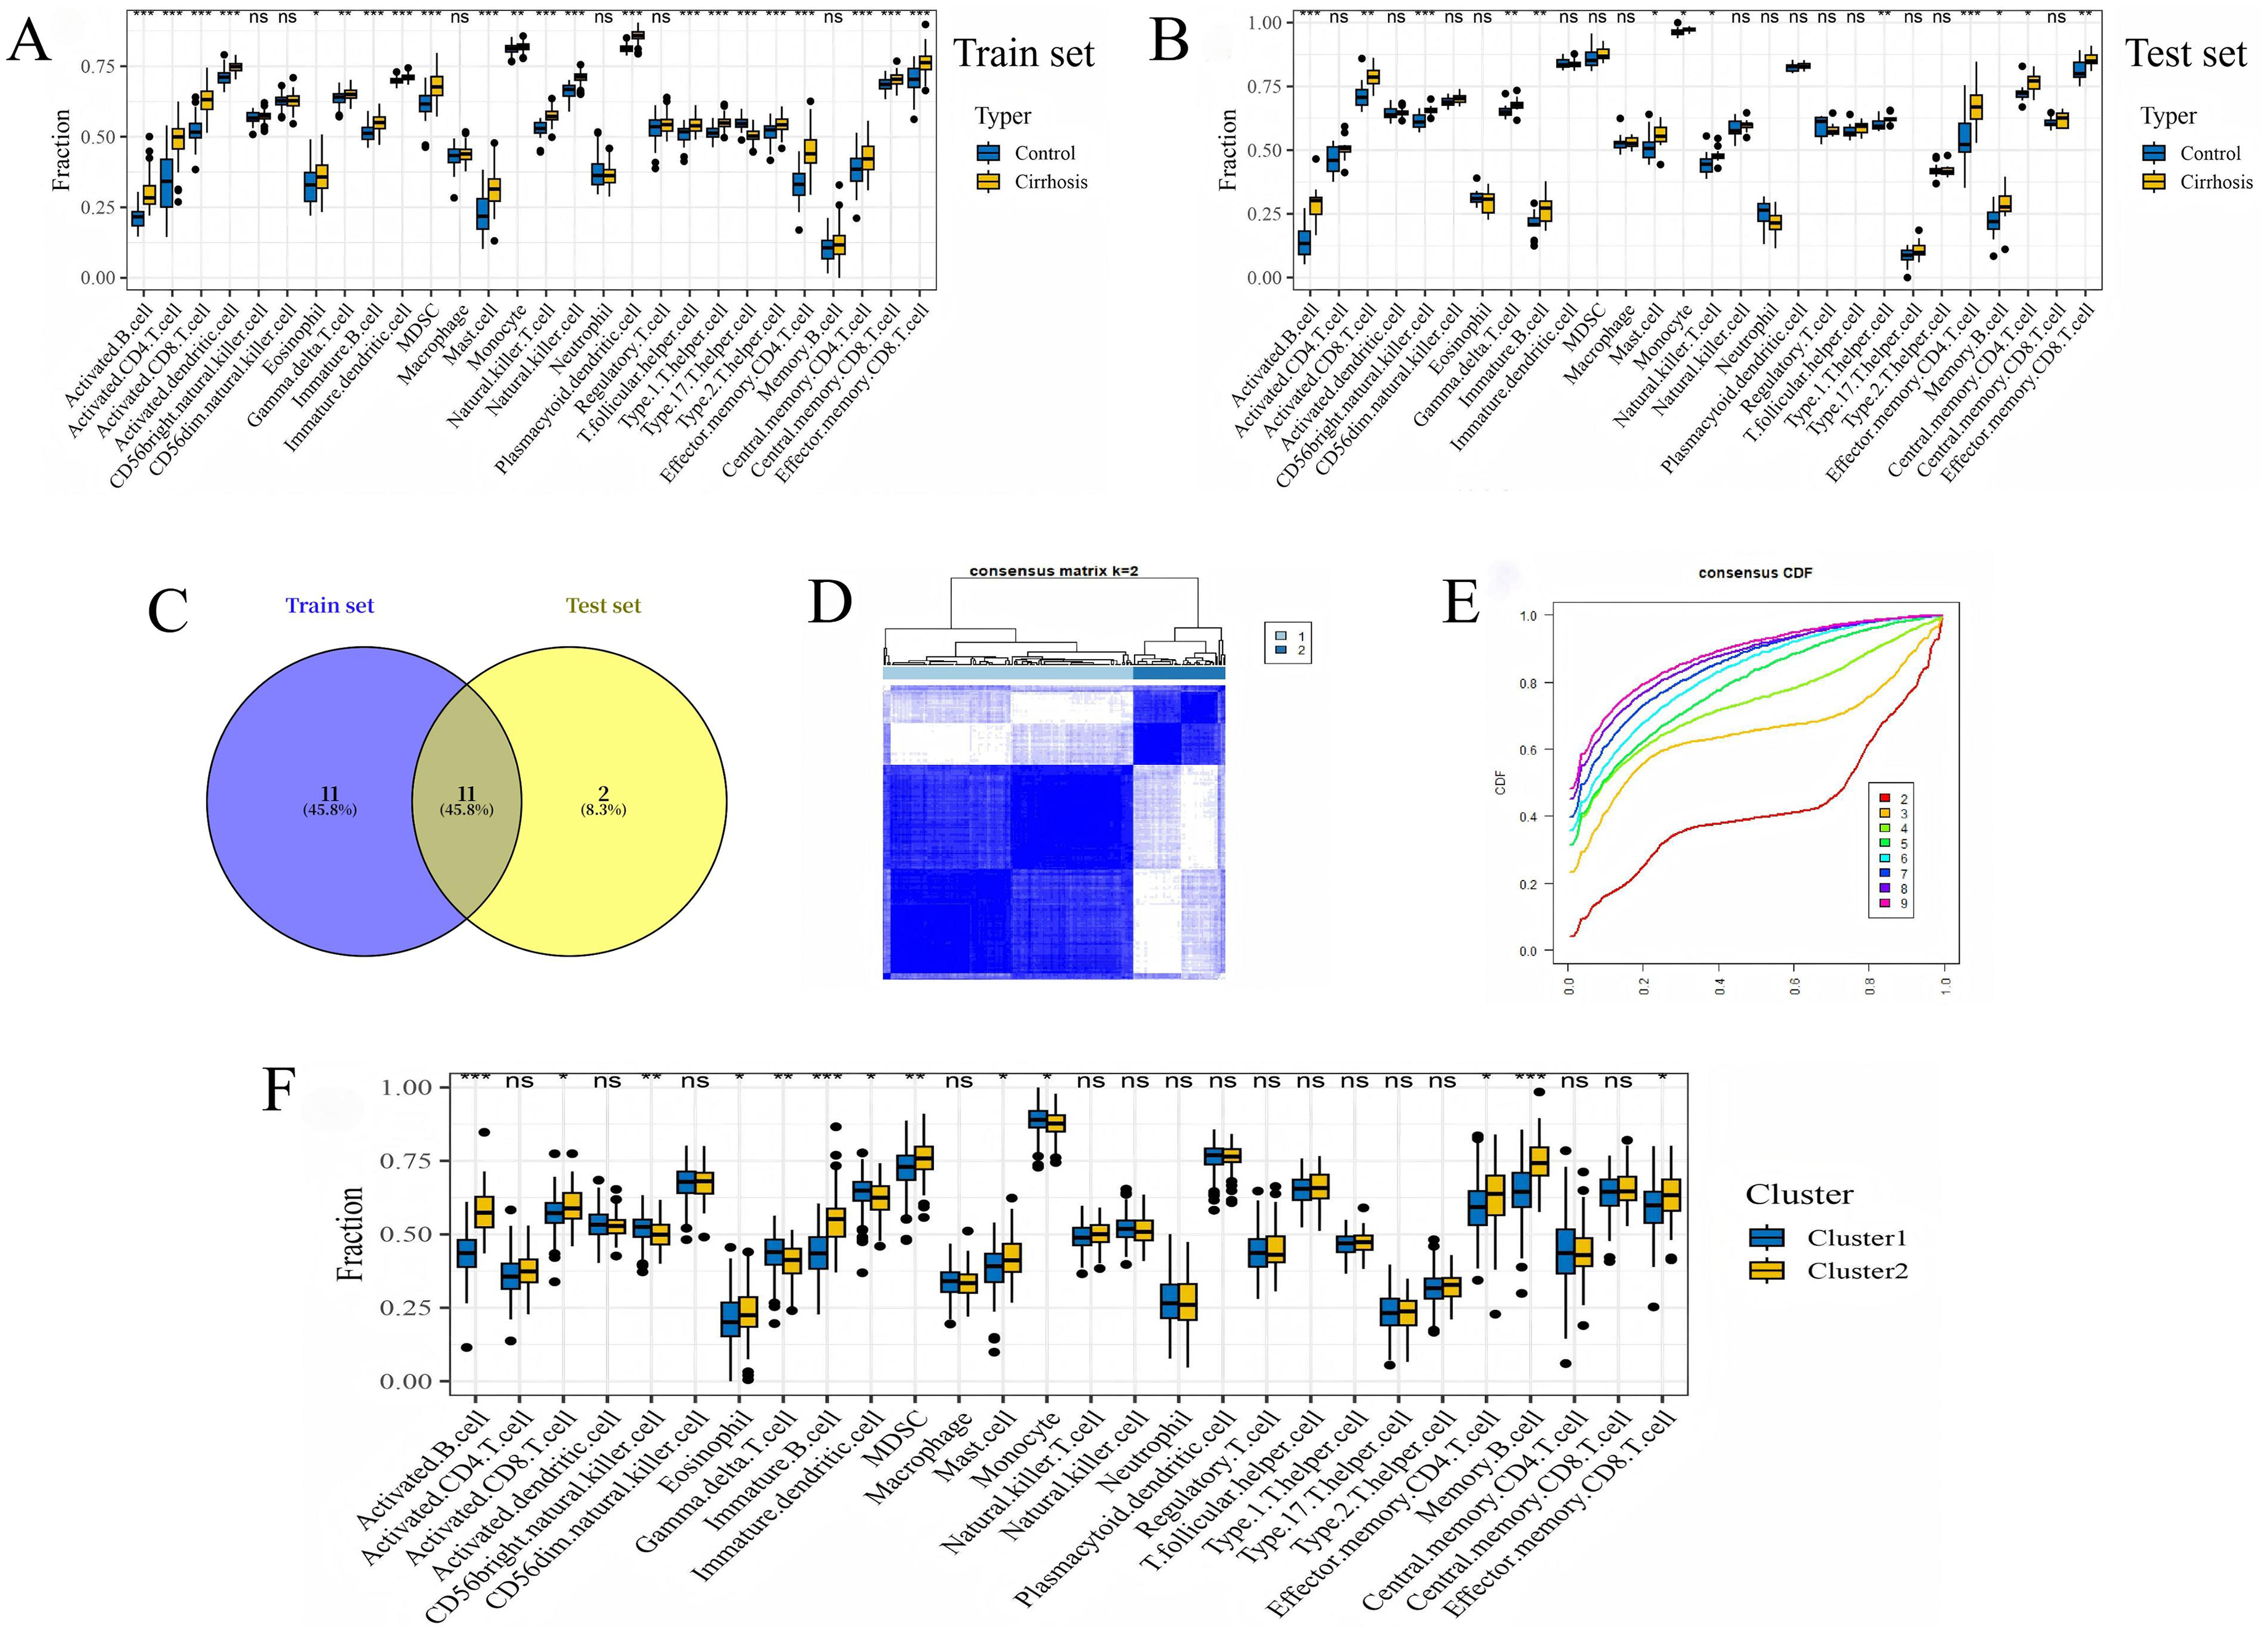
Characterization of immune infiltration and consensus clustering for subgroup identification in LF patients. (A) A box plot illustrates immune infiltration differences between healthy and cirrhotic groups in the training set. (B) A box plot illustrates immune infiltration differences between healthy and cirrhotic groups in the test set. (C) Overlapping immune cell profiles between the two sets. (D) The consensus score matrix across all samples at k = 2. (E) The CDF curves for consensus matrices at each k value, distinguished by color. (F) ssGSEA analysis reveals differential immune infiltration between clusters 1 and 2. Statistical significance was determined by Student's t-test: ***, p ≤ 0.001; **, p ≤ 0.01; *, p < 0.05.
Single-cell atlas of non-parenchymal cells (NPCs) in liver tissue
Following the exclusion of low-quality cells from the GSE136103 single-cell dataset (Supplementary Figures 4A–4F), 55,708 NPCs were identified, comprising 32,977 cells from the healthy group and 22,731 from the cirrhosis/fibrosis group. PCA was employed to reduce dimensionality and cluster the data, yielding 22 distinct clusters (Supplementary Figures 4G–4J; Figure 2A). Cluster annotation was performed by cross-referencing cell marker genes (Supplementary Table 2) with relevant literature. Thirteen cell types were classified, including mononuclear phagocytes (MPs), T cells, innate lymphoid cells (ILCs), endothelial cells, B cells, epithelial cells, cycling cells, mast cells, mesenchymal cells, HSCs, hepatocytes, plasmacytoid dendritic cells, and plasma cells (Figure 2B), in alignment with NC Henderson et al.. 21 Marker gene dot plots distinguishing subpopulations were produced (Figure 2C), alongside heatmaps showcasing the top five highly expressed genes (Figure 2D). ROGUE values were computed for each subpopulation using the ROGUE package in R, revealing high purity in B cells (ROGUE > 0.9), while MPs and cycling cells exhibited elevated heterogeneity (ROGUE < 0.9) (Figure 2E).
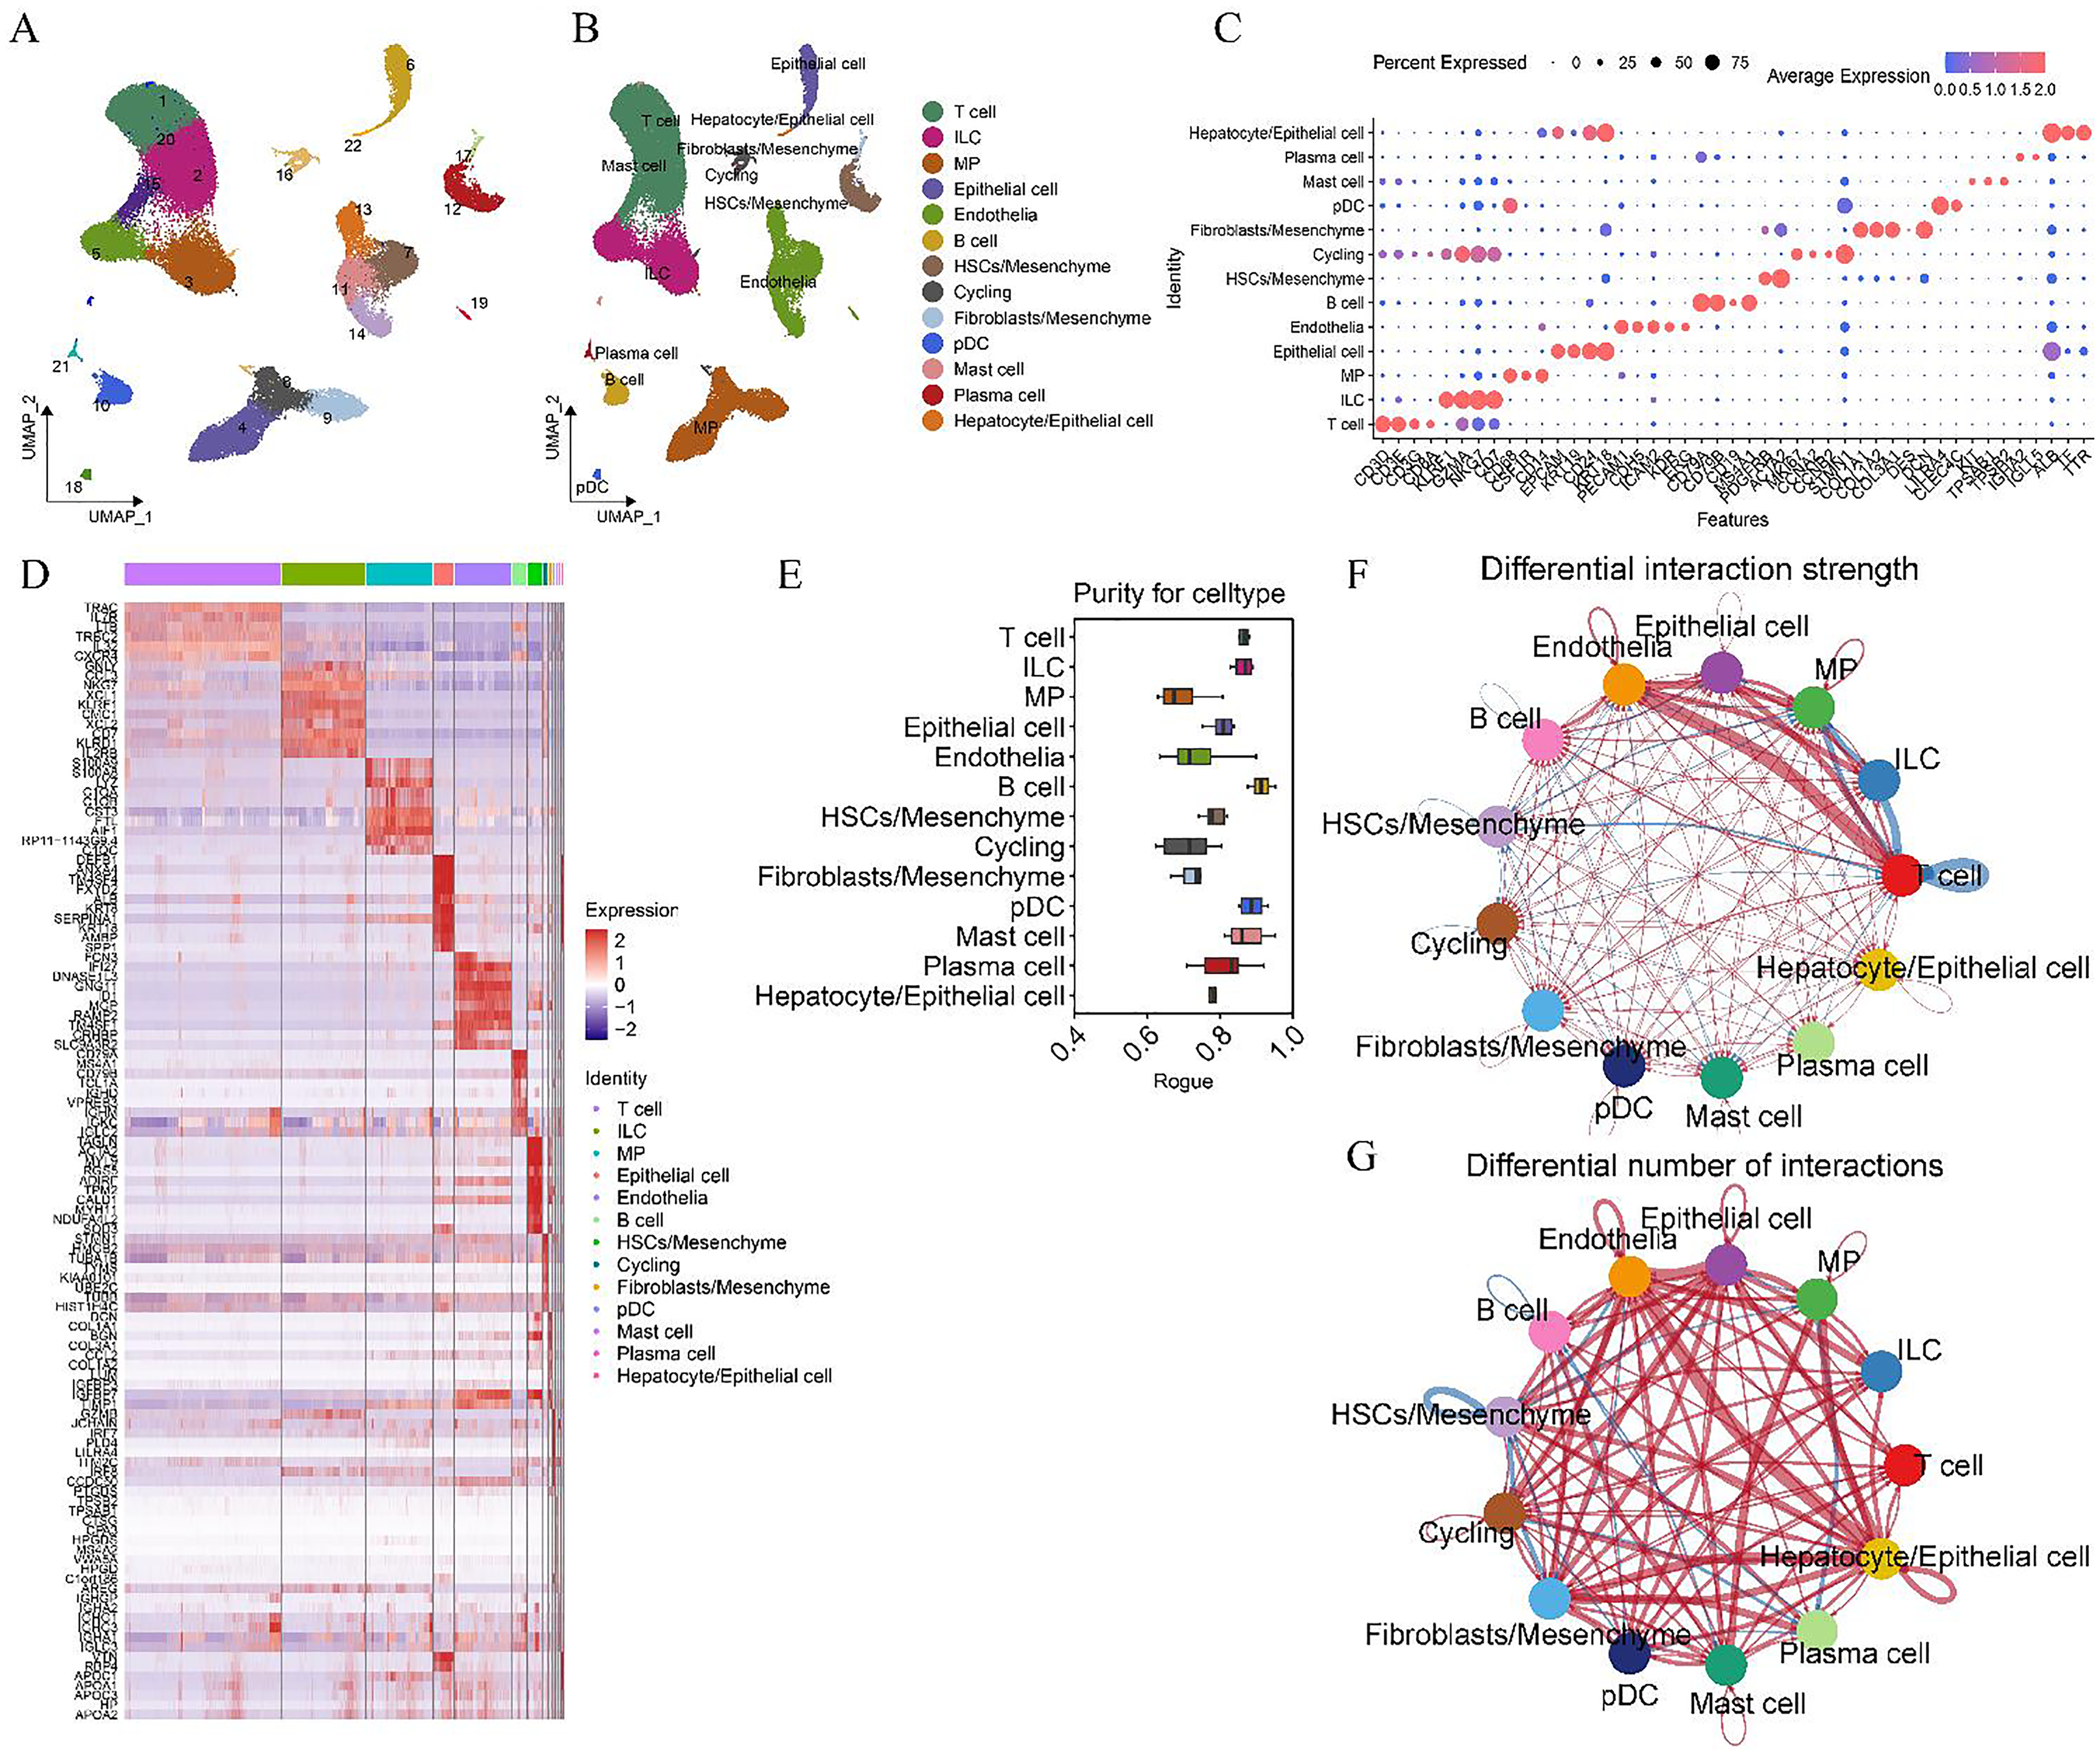
Single-cell atlas of 55,708 NPCs in human liver tissue. (A) A UMAP plot illustrating 22 clusters identified at a resolution of 1. (B) Cell lineage determination of the 22 clusters was inferred through marker gene expression signatures. (C) A dot plot displaying scaled gene expression levels of selected genes across liver cell clusters, where circle size represents the proportion of cells expressing the gene above the mean, and color reflects mean expression (red for high, blue for low). (D) A heatmap presenting the top five highly expressed genes in each cell subpopulation. (E) A boxplot depicting cell purity for each cell type, as calculated by ROGUE (0–1, with higher values indicating greater purity), across 13 cell subpopulations. (F) The number and strength of intercellular communication between cell groups, with (G) line thickness representing communication intensity and color indicating communication scenarios (blue: healthy; red: cirrhosis). NPCs: non-parenchymal cells, MP: mononuclear phagocytes, ILCs: innate lymphoid cells, cycling: cycling cells, HSCs: hepatic stellate cells, pDCs: plasmacytoid dendritic cells.
A cell-cell communication network was constructed using known ligand-receptor pairs and their cofactors across various cell populations, employing “CellChat” (v1.6.1). 22 The analysis identified substantial intercellular communication among monocytes, ILCs, cycling cells, plasma cells, T cells, epithelial cells, mesenchymal cells, and endothelial cells in cirrhotic fibrosis patients (Figure 2F). Notably, interactions were particularly robust among monocytes, ILCs, T cells, epithelial cells, and endothelial cells (Figures 2F, 2G). In the communication network, enhanced interactions were observed between immune cells and between T cells and HSCs in the healthy cohort, while cirrhosis/fibrosis patients displayed intensified communication between immune cells and epithelial, mesenchymal, and endothelial cells (Figures 2F, 2G).
Expression patterns of genes associated with poor prognosis in the single-cell atlas
Univariate Cox regression analysis identified 976 gene sets associated with survival status, 838 with liver cancer, 1015 with Child grade, and 507 with progression to liver function decompensation in cirrhosis patients with fibrosis stages F1–F4. Genes influencing survival were predominantly expressed in epithelial, mesenchymal, and endothelial cells (Figure 3A), while those affecting HCC progression were expressed across epithelial, mesenchymal, endothelial cells, MPs, T cells, and ILCs (Figure 3B). Genes associated with Child grade progression were also expressed in epithelial, mesenchymal, and endothelial cells (Figure 3C). Additionally, genes linked to liver function decompensation were expressed in epithelial, stromal, endothelial cells, MPs, T cells, and ILCs (Figure 3D). These data suggest that interactions between MPs, T cells, ILCs, and epithelial/endothelial cells may contribute to poor prognosis in patients.
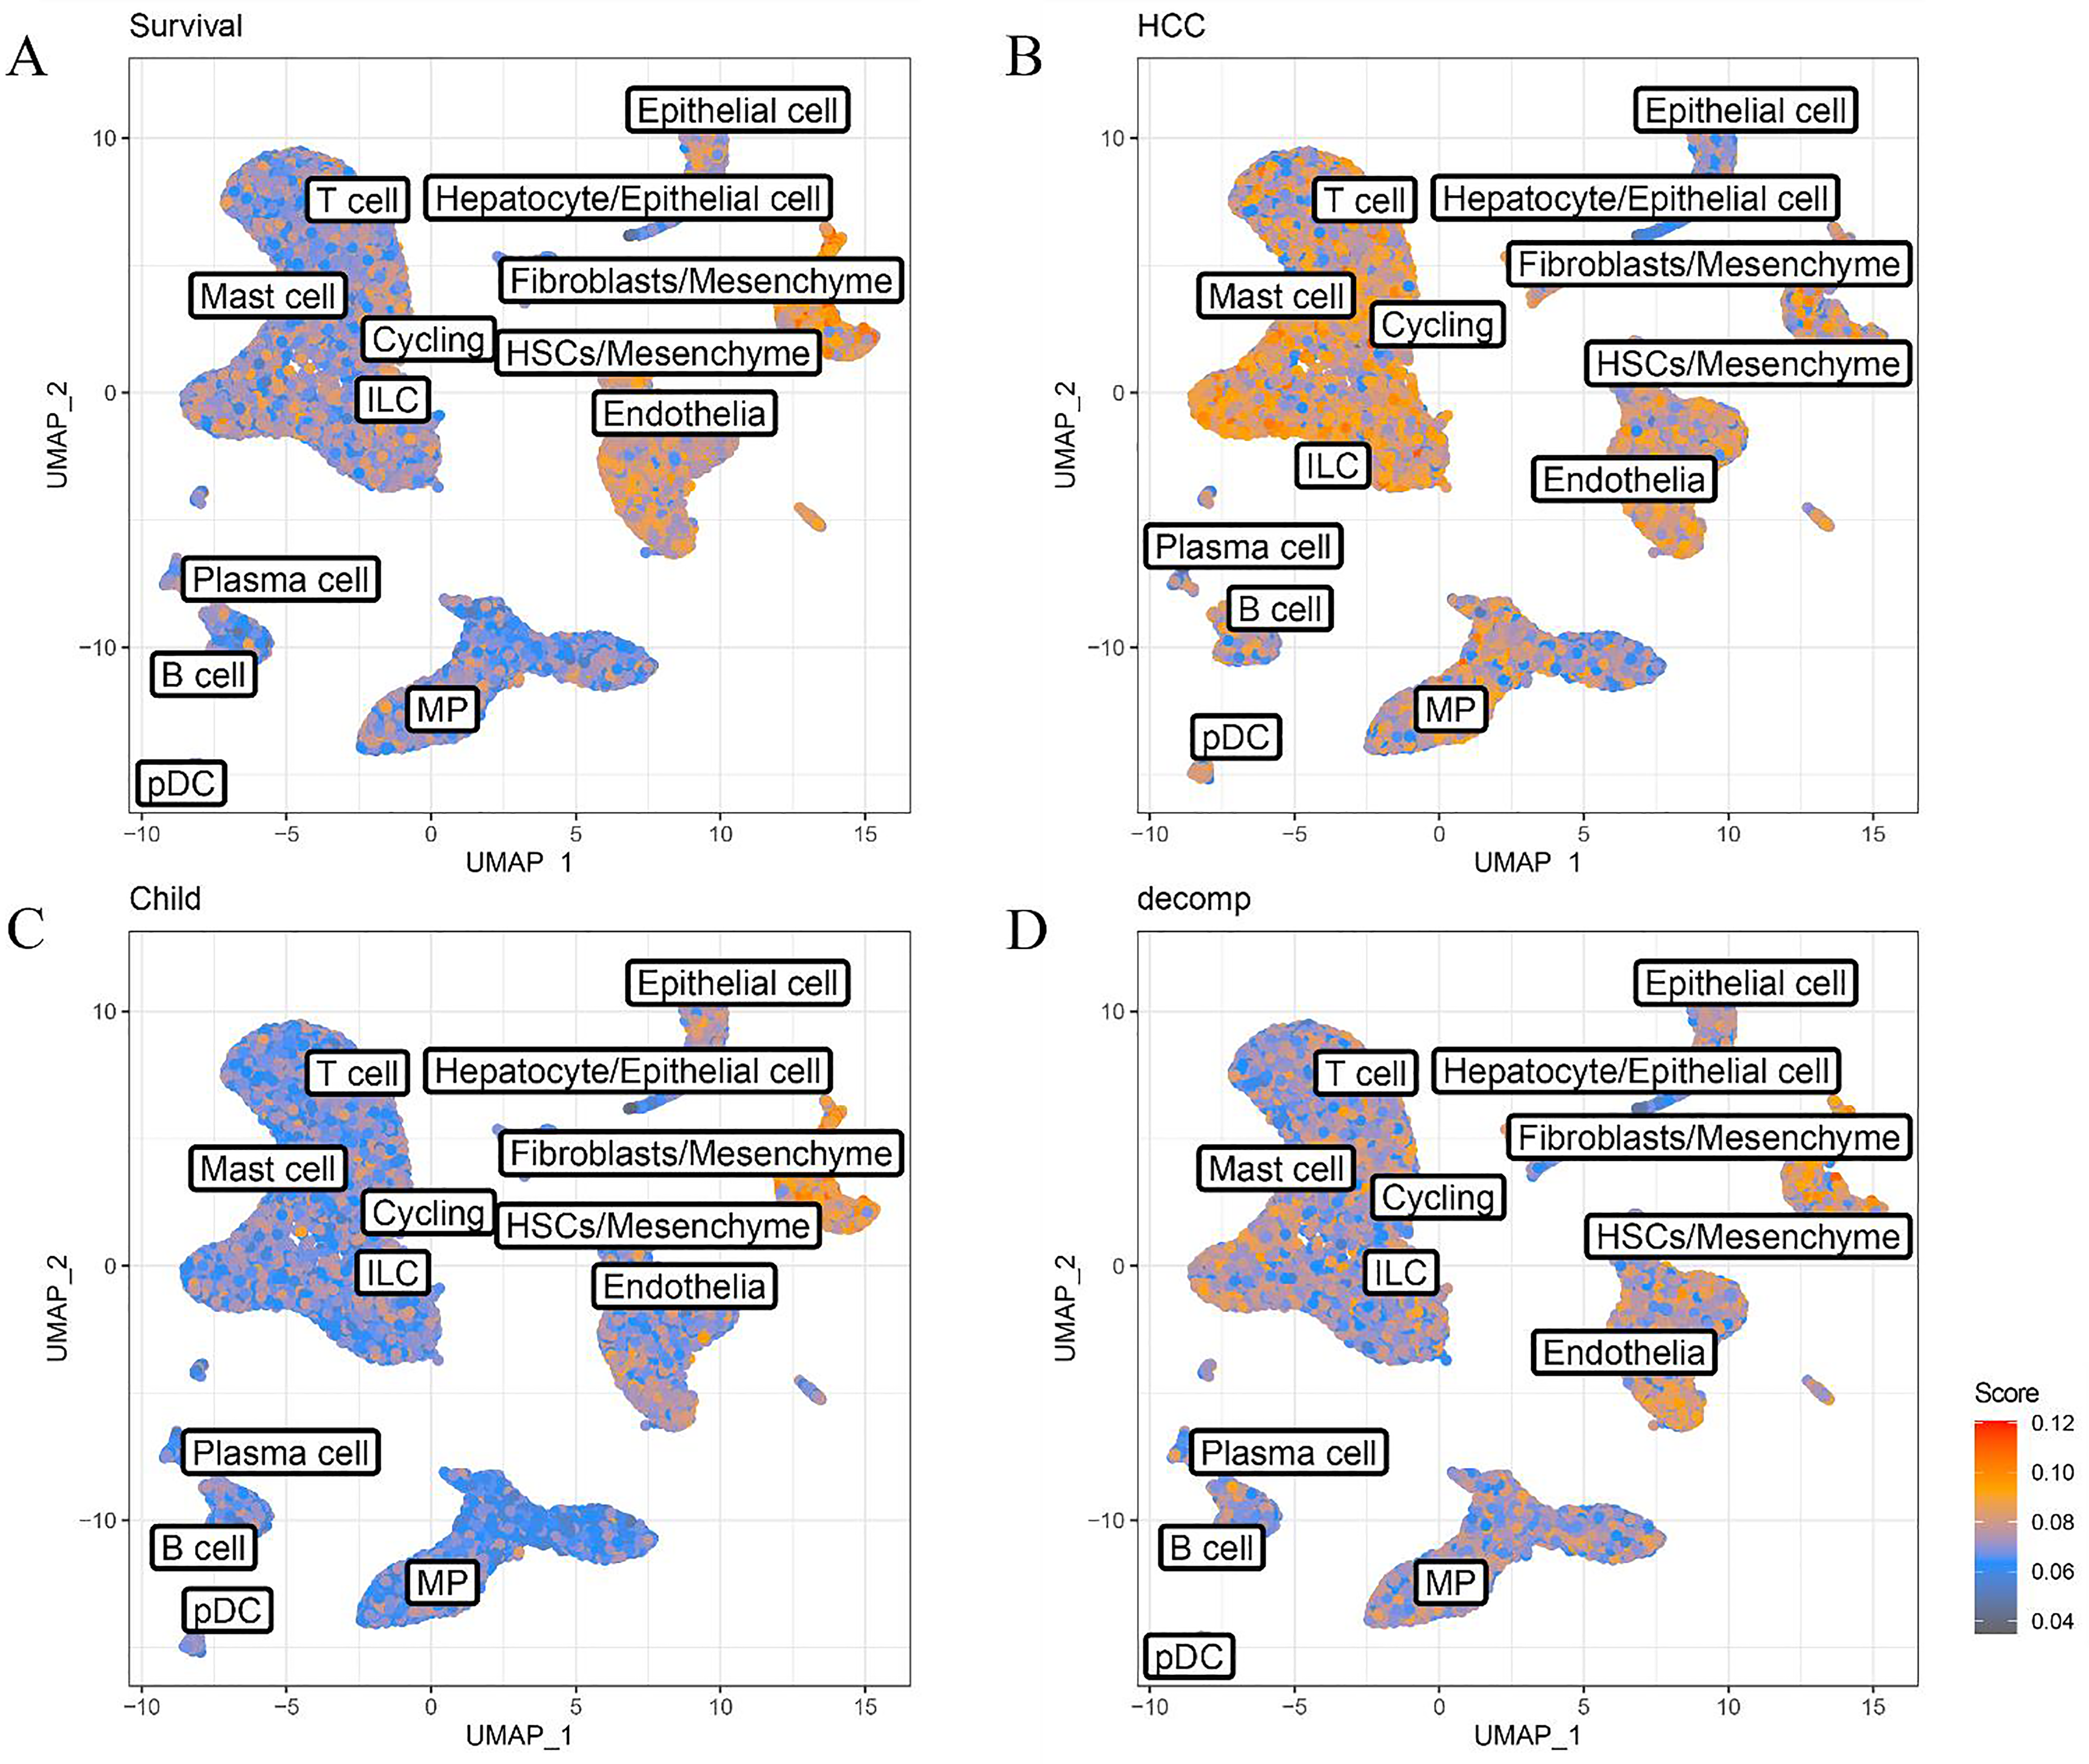
AUCell analysis of poor prognosis-related gene expression patterns in the single-cell atlas. UMAP visualization highlighted cell subpopulations associated with patient survival (A), liver cancer progression (B), Child grade progression (C), liver function decompensation (D), and the expression of genes linked to poor prognosis. Signature scores are represented by color intensity, with red indicating high expression and gray representing low expression. MPs: mononuclear phagocytes, ILCs: innate lymphoid cells, cycling: cycling cells, HSCs: hepatic stellate cells, pDCs: plasmacytoid dendritic cells.
Distribution and function of MP subgroups in liver tissue and PBMCs
MPs were isolated, resized, clustered, and annotated as shown in Figure 4A–4C, yielding results consistent with those of NC Henderson et al.. 21 Evaluation of ROGUE scores for cell subpopulations indicated high purity in TMo (1) and Kupffer cells (KC) (2), while scar-associated macrophage Φ1 (SAMΦ1) exhibited marked heterogeneity (Supplementary Figure 5C). Additionally, SAMΦ (1) and SAMΦ (2) were significantly upregulated in fibrosis patients, contrasted by notable downregulation of KC (1) and KC (2) subpopulations. TMo (2) displayed a near-significant upregulation trend (Figure 4D; Supplementary Table 3). The analysis demonstrated that KCs displayed elevated expression of macrophage-related genes MARCO and C1QC, with CD5L and CD163 predominantly expressed in KC (1) and CD68 in KC (2) (Figure 4F), indicating KC (1) as an anti-inflammatory and KC (2) as a pro-inflammatory subpopulation. GSEA of KC (1) and KC (2) showed that KC (1) upregulated the oxidative phosphorylation pathway, associated with anti-inflammatory responses 23 (Supplementary Figures 5A, 5B), further supporting its classification as an anti-inflammatory subpopulation. In contrast, SAMΦ contributes to fibrosis, as previously described by NC Henderson et al.. 21 An evaluation of macrophage infiltration in patients with varying degrees of LF and cirrhosis, based on highly expressed genes in SAMΦ1, SAMΦ2, and KC, revealed enhanced macrophage activity in fibrotic and cirrhotic tissues (Figure 4E). Additionally, a reduction in KC proportions was observed via single-cell analysis, possibly linked to disease progression or patient age.
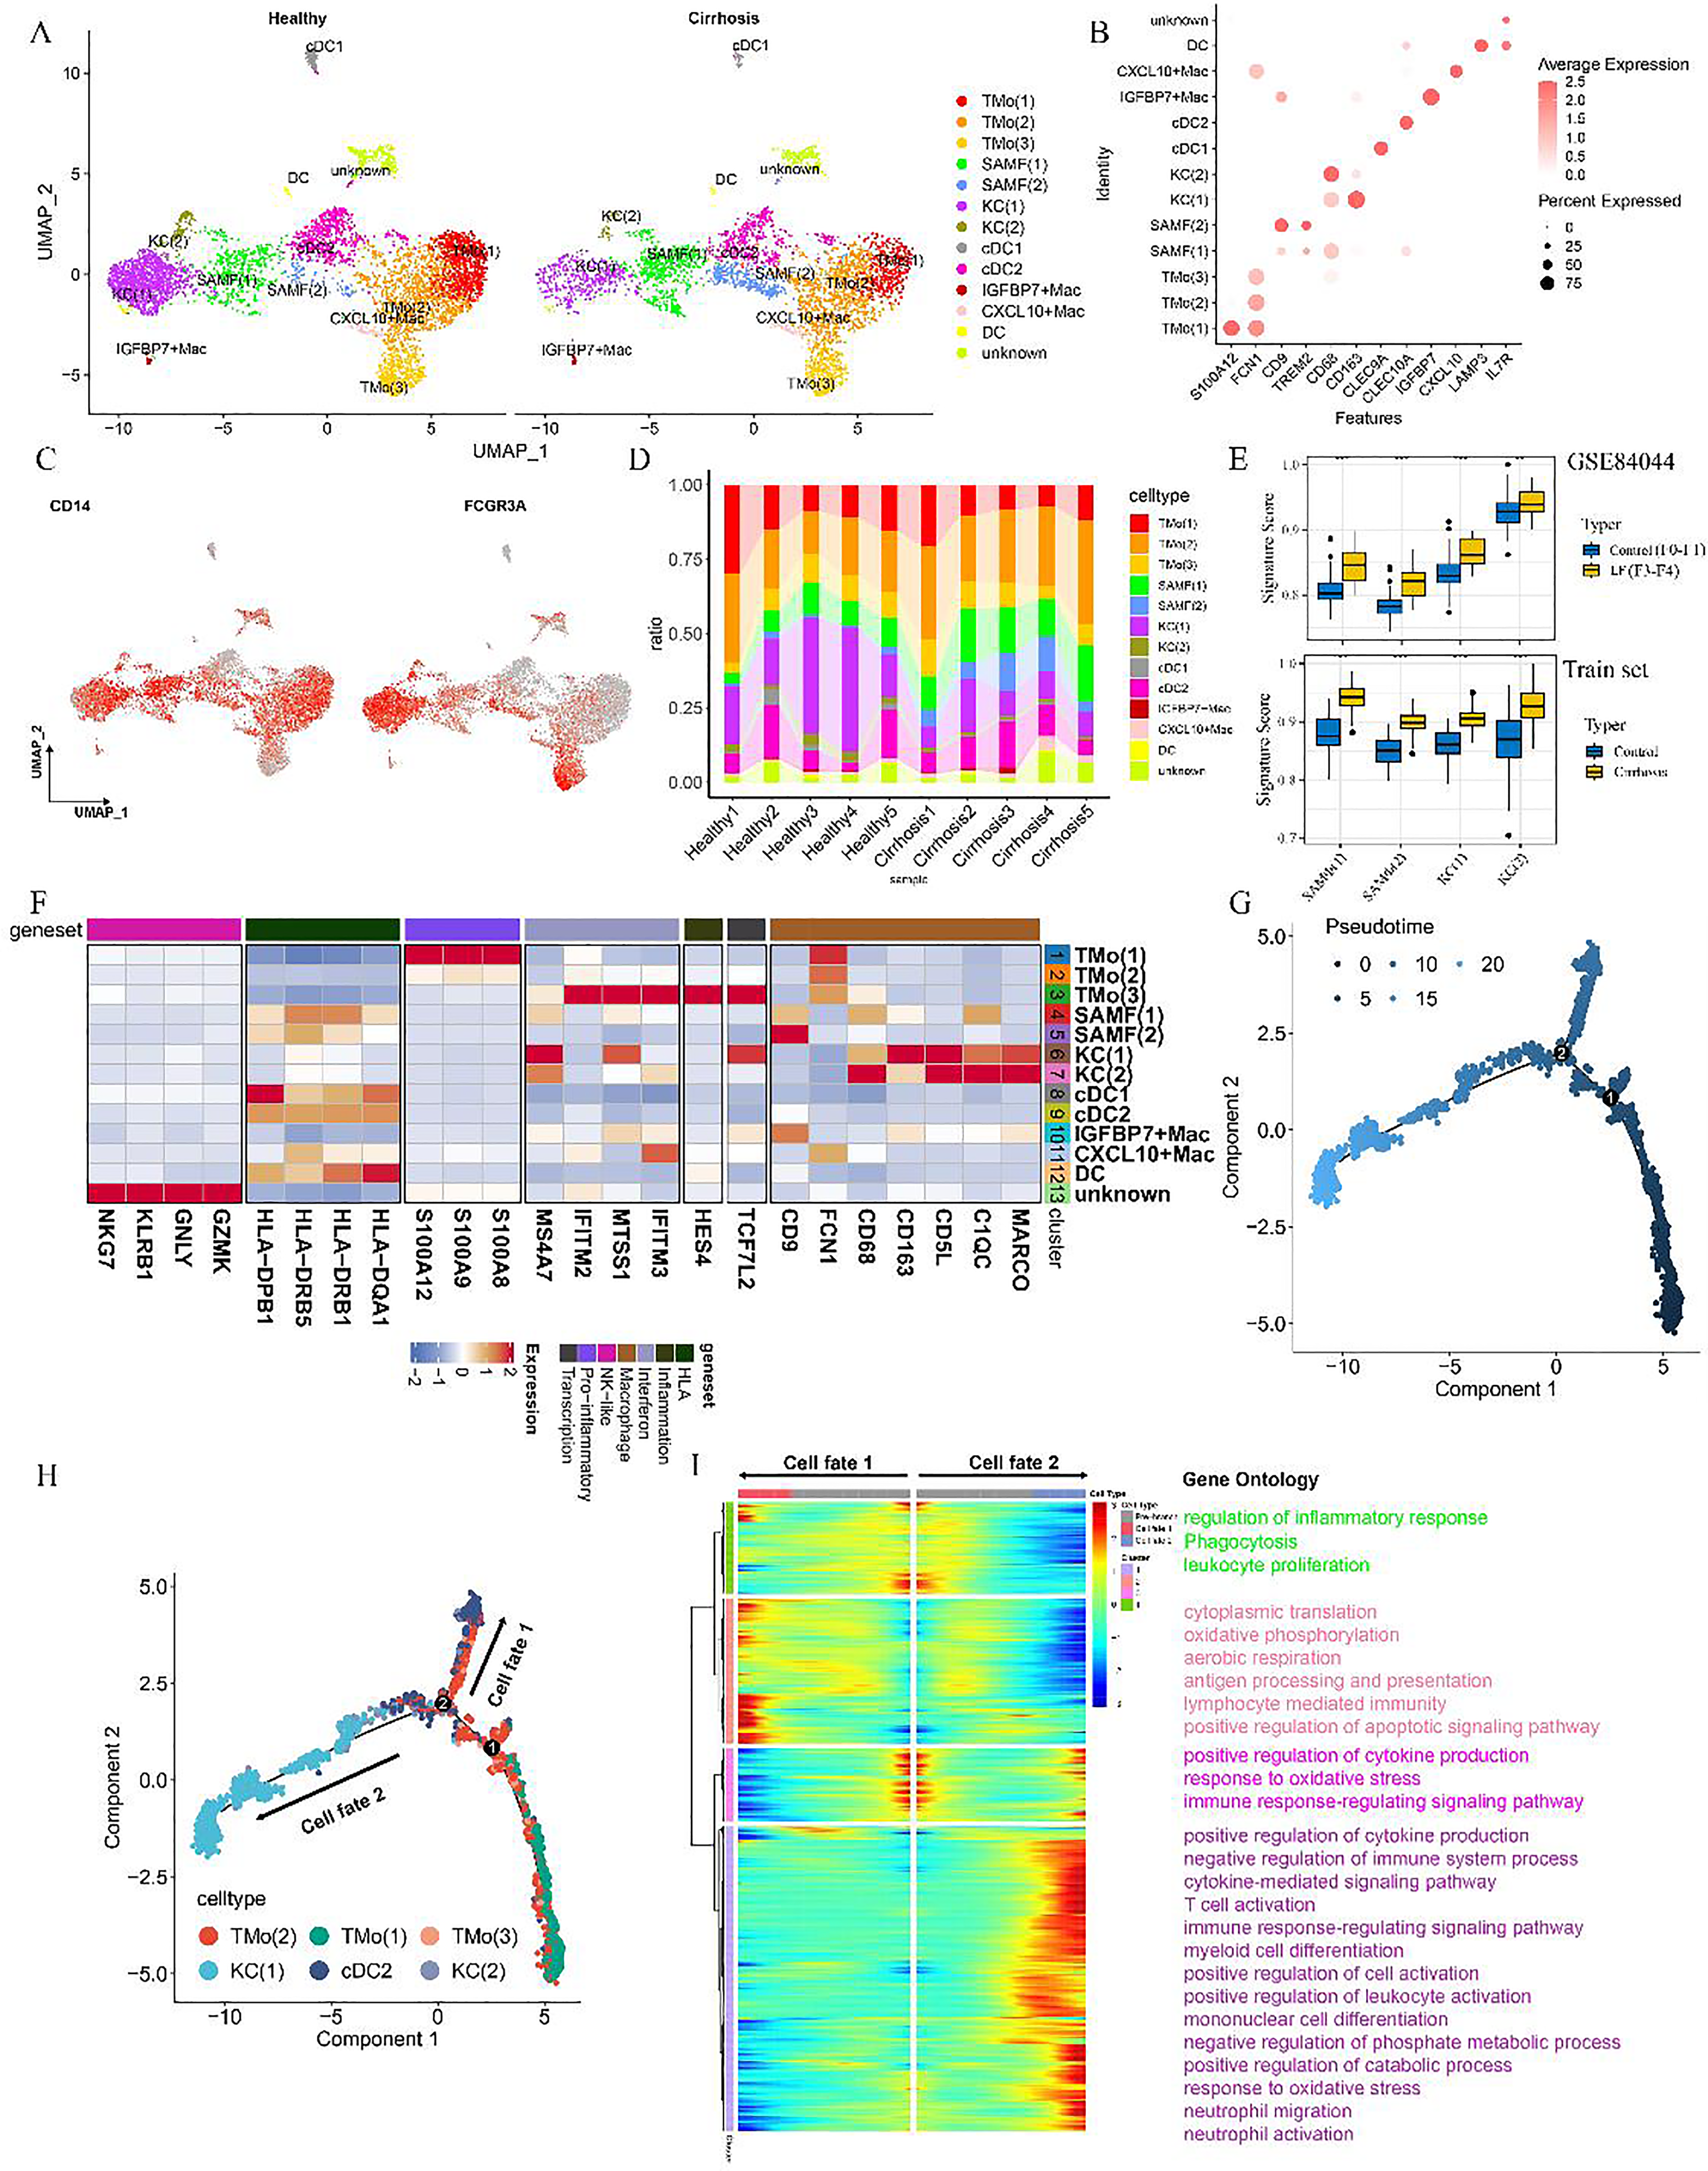
Lineage of 8699 MPs in liver tissue and pseudotime analysis of select subpopulations. (A) Clustering analysis of 8699 MPs from liver samples. (B) Dot plot illustrating scaled gene expression of markers across 13 distinct cell types. (C) Scaled expression levels of selected genes (CD14 and FCGR3A) within MP clusters in the liver. (D) Proportional bar chart comparing the distribution of MP cell subsets between five healthy and five cirrhotic livers. (E) Box plot highlighting variations in immune infiltration between the two groups (***, p ≤ 0.001; **, p ≤ 0.01, Student's t-test), accompanied by a heatmap displaying the normalized mean expression of functionally relevant genes across MP subpopulations. (F) Heatmap showing scaled expression of selected genes within MP clusters from both healthy and cirrhotic liver samples. (G) Pseudotime analysis indicating the initiation point and direction of cell differentiation. (H) Differentiation trajectories of various cell types in the Pseudotime analysis. (I) BEAM analysis identifying bifurcation point 2, leading to two distinct branches of differentially expressed genes. SAM/SAMF: scar-associated macrophage; KCs, Kupffer cells; TMo, monocytes; DCs: dendritic cells; Cdcs: classic dendritic cells; Mac: macrophages.
Pseudotime analysis of cell subpopulations identified two branch points and five major differentiation paths, highlighting the transition of monocytes into KC and cDC2 cells. At branch point 2, monocytes progressed toward both KC and cDC2 lineages (Figures 4G, 4H). Branched expression modeling was applied to uncover differential genes governing monocyte differentiation at this juncture. Cluster 1 included genes upregulated during monocyte-to-KC differentiation, while clusters 2 and 4 contained genes downregulated in the KC differentiation process, implicated in inflammatory response regulation, leukocyte migration, apoptotic signaling, and oxidative phosphorylation. Notably, cluster 2 also featured genes upregulated during monocyte-to-cDC2 differentiation (Figure 4I), influencing pathways related to this transition and modulating monocyte differentiation toward the cDC2 lineage.
TMo (3) monocytes demonstrated elevated expression of FCGR3A (CD16), while KC (1) exhibited high levels of the transcription factor TCF7L2, alongside the inflammation-responsive gene HES4 and interferon-inducible genes IFITM3 and MTSS1 (Figures 4C, 4F). In PBMC-derived monocytes from cirrhosis patients, CD16 + CDKN1C + Mono and CD16 + HLA-DQA1 + Mono subpopulations showed enrichment of TCF7L2, HES4, and interferon-related genes IFITM2, IFITM3, MS4A7, and MTSS1 (Figure 5A–5E). TMo (1) and TMo (2) cells both expressed high levels of the classical monocyte marker gene CD14. Additionally, TMo (1) cells, together with the PBMC subpopulation CD14 + Mono (1), showed heightened expression of pro-inflammatory mediators S100A8, S100A9, and S100A12 (Figure 4F, Figure 5E), indicating their potential role as pro-inflammatory monocytes. TMo (2) cells, similar to TMo (1) and TMo (3), expressed S100A8 and FCN1 but showed lower expression of S100A12, FCGR3A, and CD68 (Figures 4B–C, F), suggesting an intermediate phenotype between these TMo subtypes. The CXCL10 + Mac subpopulation expressed both CD14 and CD16, indicating monocyte-like macrophage characteristics. The IGFBP7 + Mac subpopulation, marked by the SAM gene CD9 (Figure 4F), suggested a distinct class of pro-fibrotic SAMs.
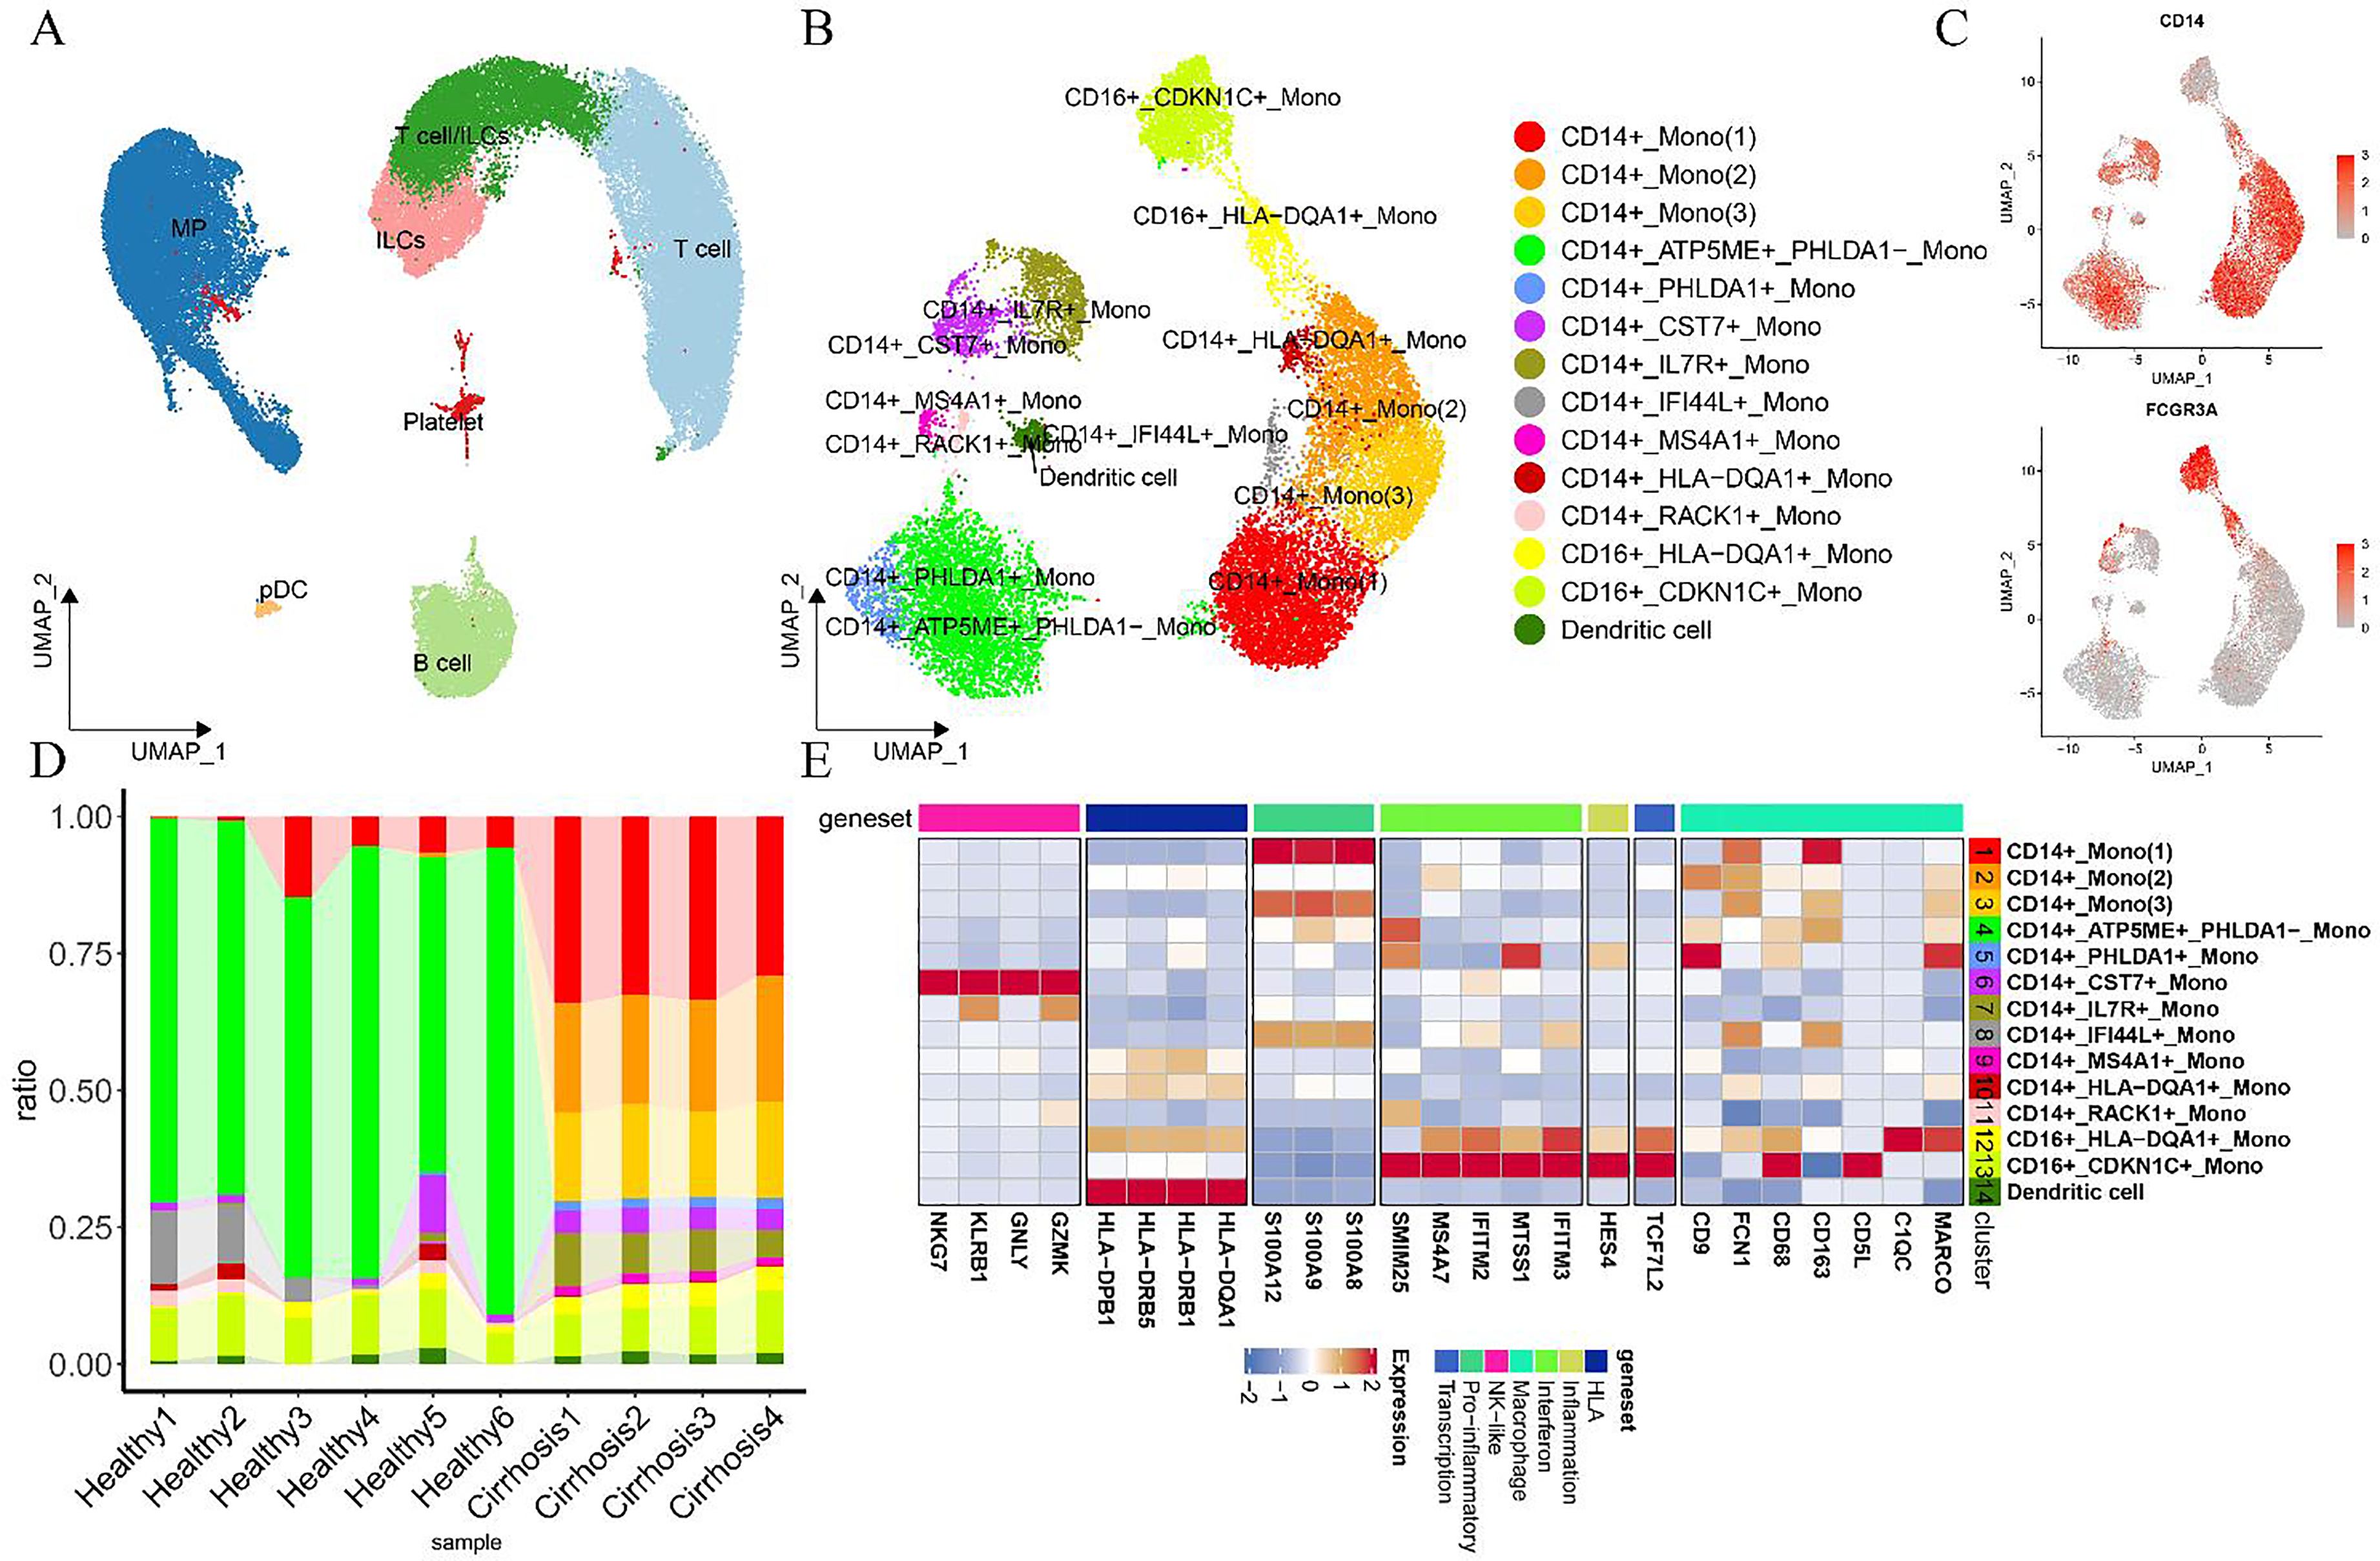
Lineage and characteristics of 53,370 PBMCs from healthy individuals and patients with cirrhosis. (A) UMAP visualization of 53,370 PBMCs from both healthy individuals and cirrhosis patients. (B) UMAP projection of 16,234 MPs. (C) Feature plots highlighting canonical marker gene expression. (D) Bar chart illustrating the relative proportions of various MP subsets in PBMCs from healthy individuals and cirrhosis patients. (E) Heatmap displaying scaled expression levels of selected genes across MP clusters in PBMCs from healthy and cirrhotic individuals. MPs: mononuclear phagocytes, ILCs: natural lymphocytes, cycling: cycling cells, HSCs: hepatic stellate cells, pDCs: plasmacytoid dendritic cells. The cell subpopulations labeled as genes indicate high gene expression in these subpopulations.
In this specific subpopulation of unknown origin, the elevated expression of NK cell-associated genes, such as GZMK, GNLY, KLRB1, and NKG7 (Figure 4F), indicated involvement in cytotoxic regulation and inflammatory responses, with functional similarities to NK cells. Furthermore, the expression of CD14 (Figure 4C) in this subpopulation suggested the presence of NK-like monocytes. Jun Xu et al. 24 previously identified a monocyte with NK-like functionality in PBMCs from patients with slow-plus acute liver failure. In this analysis, a monocyte-macrophage subpopulation, CD14 + CST7 + Mono, displaying NK-like characteristics, was observed in PBMCs from patients with cirrhosis. However, limitations in analytical methods, such as inadequate clustering resolution, may introduce variability. Additionally, two monocyte subpopulations, CD14 + HLA-DQA1 + Mono and CD16 + HLA-DQA1 + Mono, were identified in PBMCs, both exhibiting elevated HLA expression (Figure 5E). These subpopulations expressed class II major histocompatibility molecules, including HLA-DQA1, HLA-DRB1, HLA-DRB5, and HLA-DPB1 (Figure 5E).
This study identified a previously unreported subpopulation of IGFBP7 + macrophages expressing the SAM gene CD9 in LF. IGFBP7 had been shown to have a pro-fibrotic role and was associated with fibrosis severity, 25 while in obese patients, macrophage-derived IGFBP7 was implicated in metabolic regulation rather than inflammatory responses. 26 Further research was needed to determine whether IGFBP7-secreting macrophages in LF contribute to fibrosis progression.
Assessment and clustering of T cells and ILCs in liver tissue and PBMCs
To investigate the role of ILCs and T cells in fibrosis progression, 31,352T cell and ILC subsets were categorized into 12 distinct groups. These included four CD4+ T cell subsets—CD4-C1-CCR7, CD4-C2-CCR6, CD4-C3-CD40LG, and CD4-C4-TNFRSF4; five CD8+ T cell subsets—CD8-C1-CRTAM, CD8-C2-ZNF683, CD8-C3-SLC4A10, CD8-C4-LYAR, and CD8-C5-GZMB; and three ILC subsets—ILC-C1-KLRC1, ILC-C2-FGFBP2, and ILC-C3-SELL (Figure 6A). ROGUE analysis indicated high purity levels across T cell subpopulations (Supplementary Figure 5D). Heatmaps were constructed from scatter plots of marker genes, such as CD3D, CD8 (CD8A), CD4, KLRF1, and CD56 (NCAM1) for classical T cells and ILCs, as well as the most highly expressed genes in the annotated subpopulations (Figures 6B, 6C).
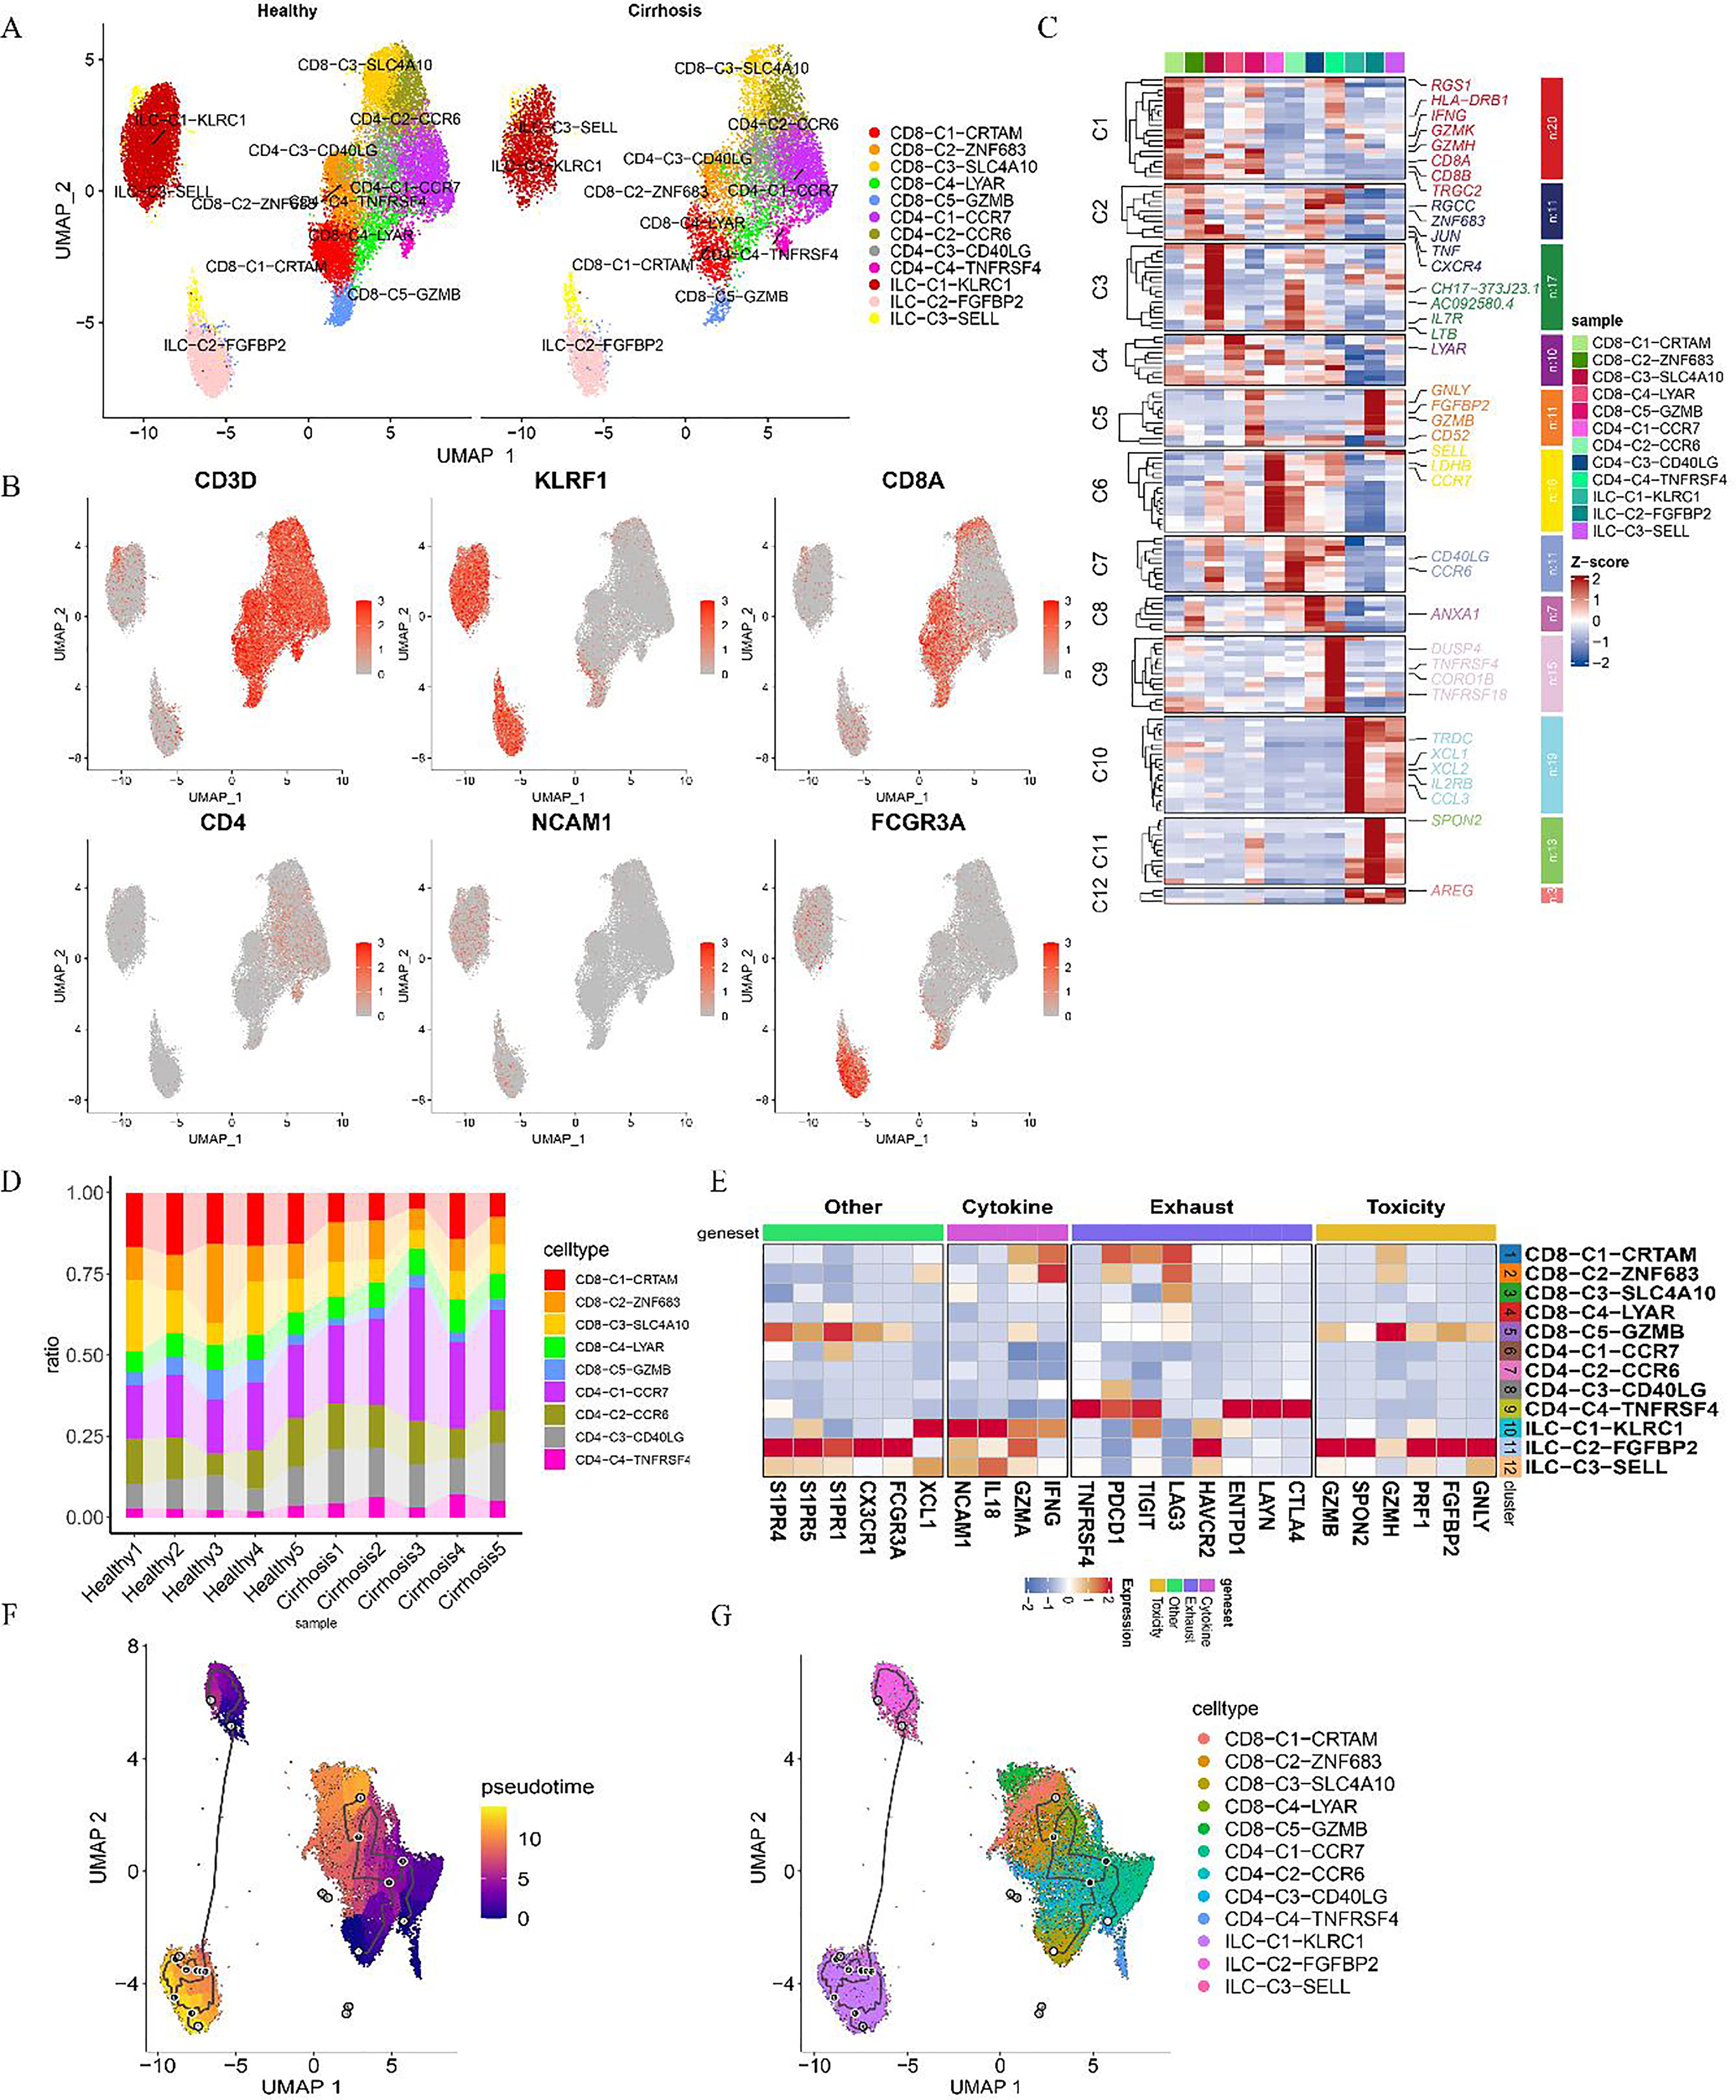
ILCs and T cell re-clustering atlas of the human liver. (A) Clustering of 31,352 ILCs and T cells from liver samples. (B) Feature plots highlighting canonical marker gene expression. (C) Heatmap displaying genes with elevated expression across cell subpopulations. (D) Proportional bar chart illustrating the distribution of ILC and T cell subsets in livers from both healthy individuals and cirrhotic patients. (E) Heatmap showing scaled expression levels of selected genes. (F) Pseudotime analysis visualized through UMAP plots, tracking ILC and T cell subpopulation dynamics over time points. (G) Subpopulations with high gene expression.
Assessment of alterations in T cell subpopulations within tissues, as visualized through cell proportion plots (Figure 6D), indicated a general increase in CD4+ T cells alongside a decline in CD8+ T cells. The CD4-C1-CCR7, CD4-C3-CD40LG, and CD4-C4-TNFRSF4 subsets were elevated in the disease group, while the CD8-C1-CRTAM and CD8-C5-GZMB subsets displayed marked downregulation, with the CD8-C3-SLC4A10 subset approaching significance in its downregulation (Figure 6D; Supplementary Table 3). Conversely, within the ILC subpopulation, ILC-C1-KLRC1 was significantly downregulated, whereas ILC-C3-SELL showed a near-significant upregulation (Supplementary Table 3). In tissue samples, the proportion of CD4+ T cells increased compared to PBMCs, while CD8+ T cells were downregulated (Figure 6D). Subpopulations such as CD8-C5-GZMB, ILC-C2-FGFBP2, and three ILC groups in PBMCs showed elevated expression of cytotoxicity-associated genes, including GNLY, FGFBP2, PRF1, GZMH, and SPON2, indicative of a mature cytotoxic phenotype, along with the expression of CX3CR1, GZMB, S1PR5, and S1PR4 (Figure 6E, Figure 7A–7D). Additionally, markers of T cell exhaustion—HAVCR2, ENTPD1, TIGIT, PDCD1 (PD-1), TNFRSF4, CTLA4, and LAYN—were expressed in the CD4-C4-TNFRSF4 subpopulation (Figure 6E), pointing to a class of exhausted cells. The CD4-C3-RTKN2 subpopulation in PBMCs also exhibited elevated levels of T cell exhaustion-related genes, including ENTPD1, TIGIT, TNFRSF4, PDCD1, and CTLA4 (Figure 7D).
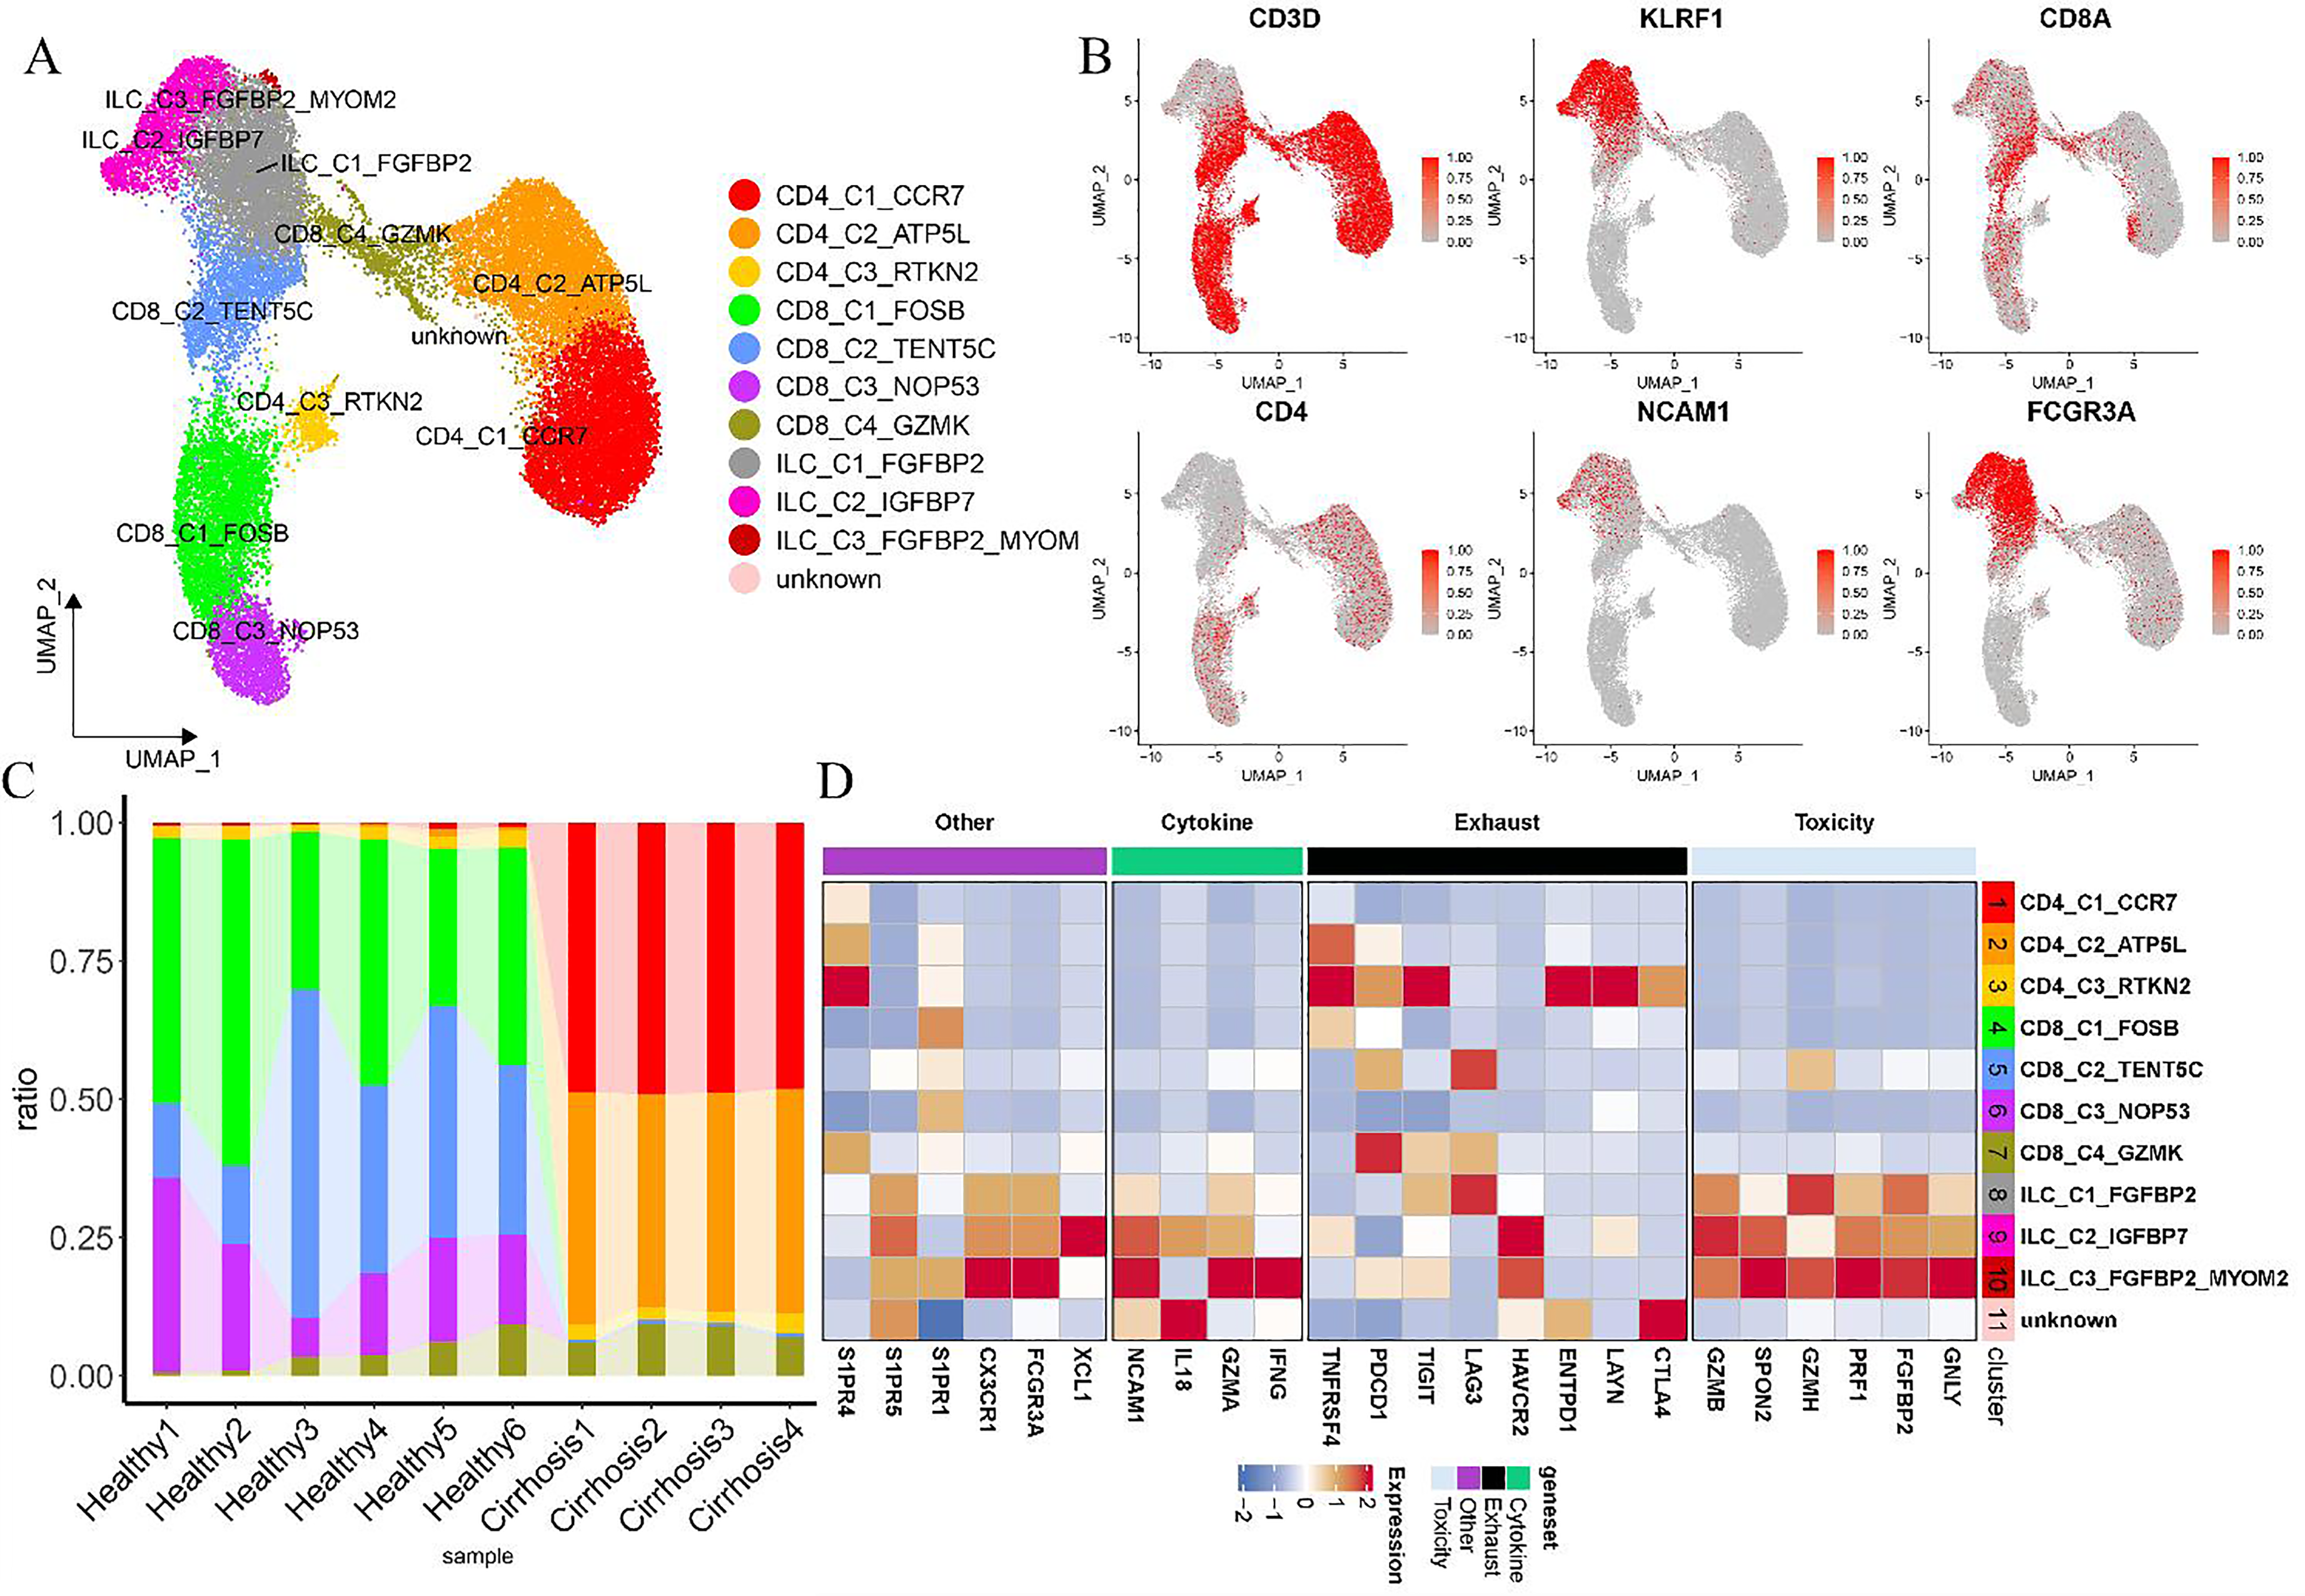
Comprehensive analysis of ILCs and T cells in 31,011 PBMCs from healthy individuals and patients with cirrhosis. (A) Clustering analysis of 31,011 ILCs and T cells derived from PBMCs. (B) Feature plots highlighting canonical marker gene expression. (C) Proportional bar chart illustrating the distribution of various ILC and T cell subsets in PBMCs from both healthy individuals and cirrhosis patients. (D) Heatmap displaying scaled gene expression profiles, with labeled subpopulations corresponding to elevated expression of specific genes.
Re-clustering of ILC subpopulations revealed three distinct clusters, with particular attention given to those expressing the NK cell marker KLRF1. Among them, ILC-C2-FGFBP2 showed both elevated CD16 expression and increased levels of the T cell exhaustion marker HAVCR2 (Figure 6E). In contrast, ILC-C1-KLRC1 displayed the highest CD56 expression and significantly upregulated cytokines IFNG, GZMA, and XCL1 compared to ILC-C2-FGBP2 and ILC-C3-SELL (Figure 6E), indicating its likely enhanced cytokinetic profile. The CD56low ILC-C2-FGBP2 subpopulation, characterized by the expression of genes associated with cytotoxicity, suggested potential for cytokinetic activity. Previous studies classified NK cells into CD56high cells, which were known for heightened cytokine production and monocyte activation, and CD56low NK cells, recognized for strong cytotoxic functions,27,28 a distinction aligned with the present findings.
Developmental trajectory analysis using Monocle3 over the proposed period revealed the differentiation of CD56high ILC subpopulations into CD56low expressing subpopulations (Figures 6F, 6G). CD56high NK cells were recognized as precursors to CD56low NK cells in established sexual maturation models. 29 An evaluation of 12 liver tissue subpopulations using CytoTRACE (Supplementary Figures 5E–5G) indicated that CD56high ILC-C1-KLRC1 had lower scores compared to CD56low ILC-C2-FGFBP2 and ILC-C3-SELL, supporting the differentiation of CD56low subpopulations from more differentiated CD56high subpopulations. These results align with the model suggesting that CD56high lymphocytes act as precursors to CD56low lymphocytes.
Communication patterns of MP, ILC, and T cell subpopulations with epithelial and endothelial cells in liver tissue
Intercellular communication among immune cell subpopulations, epithelial cells, and endothelial cells was evaluated through cellular communication analysis. The analysis revealed (Figure 8A, 8B) that KC (1), SAMΦ (1), SAMΦ (2), and TMo (2) within the MP subpopulation, as well as CD4-C1-CCR7, CD4-C2-CCR6, CD4-C3-CD40LG, and ILC-C1-KLRC1 in the T and ILC subpopulations, exhibited enhanced interaction with epithelial and endothelial cells. Notable variability in the proportion of these subpopulations was observed across patients. Key signaling pathways, including MK, TWEAK, and CD40, were identified as significantly altered based on differential information flow between the healthy and cirrhotic groups. Specifically, the MK, TWEAK, and CD40 pathways showed increased activity in the cirrhotic state (Supplementary Figures 6A, 6B). To further evaluate the impact of these subgroups on patient prognosis, differential genes (|logFC| > 0.25, p < 0.0001 after FDR correction) were validated using the validation set (Figure 8C). Stratification of the test set into two groups based on differential gene expression revealed significant associations with patient survival, progressive HCC, and Child classification (Figures 8D–8G), with cluster 2 indicating a more favorable prognosis. Cluster 2, characterized by low CD45 (PTPRT) expression (Supplementary Figure 6C), also correlated with better survival outcomes, aligning with previous reports linking reduced immune activity to improved prognosis. Differential analysis and GSEA were conducted to explore functional distinctions between the two clusters. Cluster 2 showed enrichment in pathways related to fatty acid metabolism, retinol metabolism, complement and coagulation cascades, glycolysis/gluconeogenesis, and pyruvate metabolism (Supplementary Figure 6D).
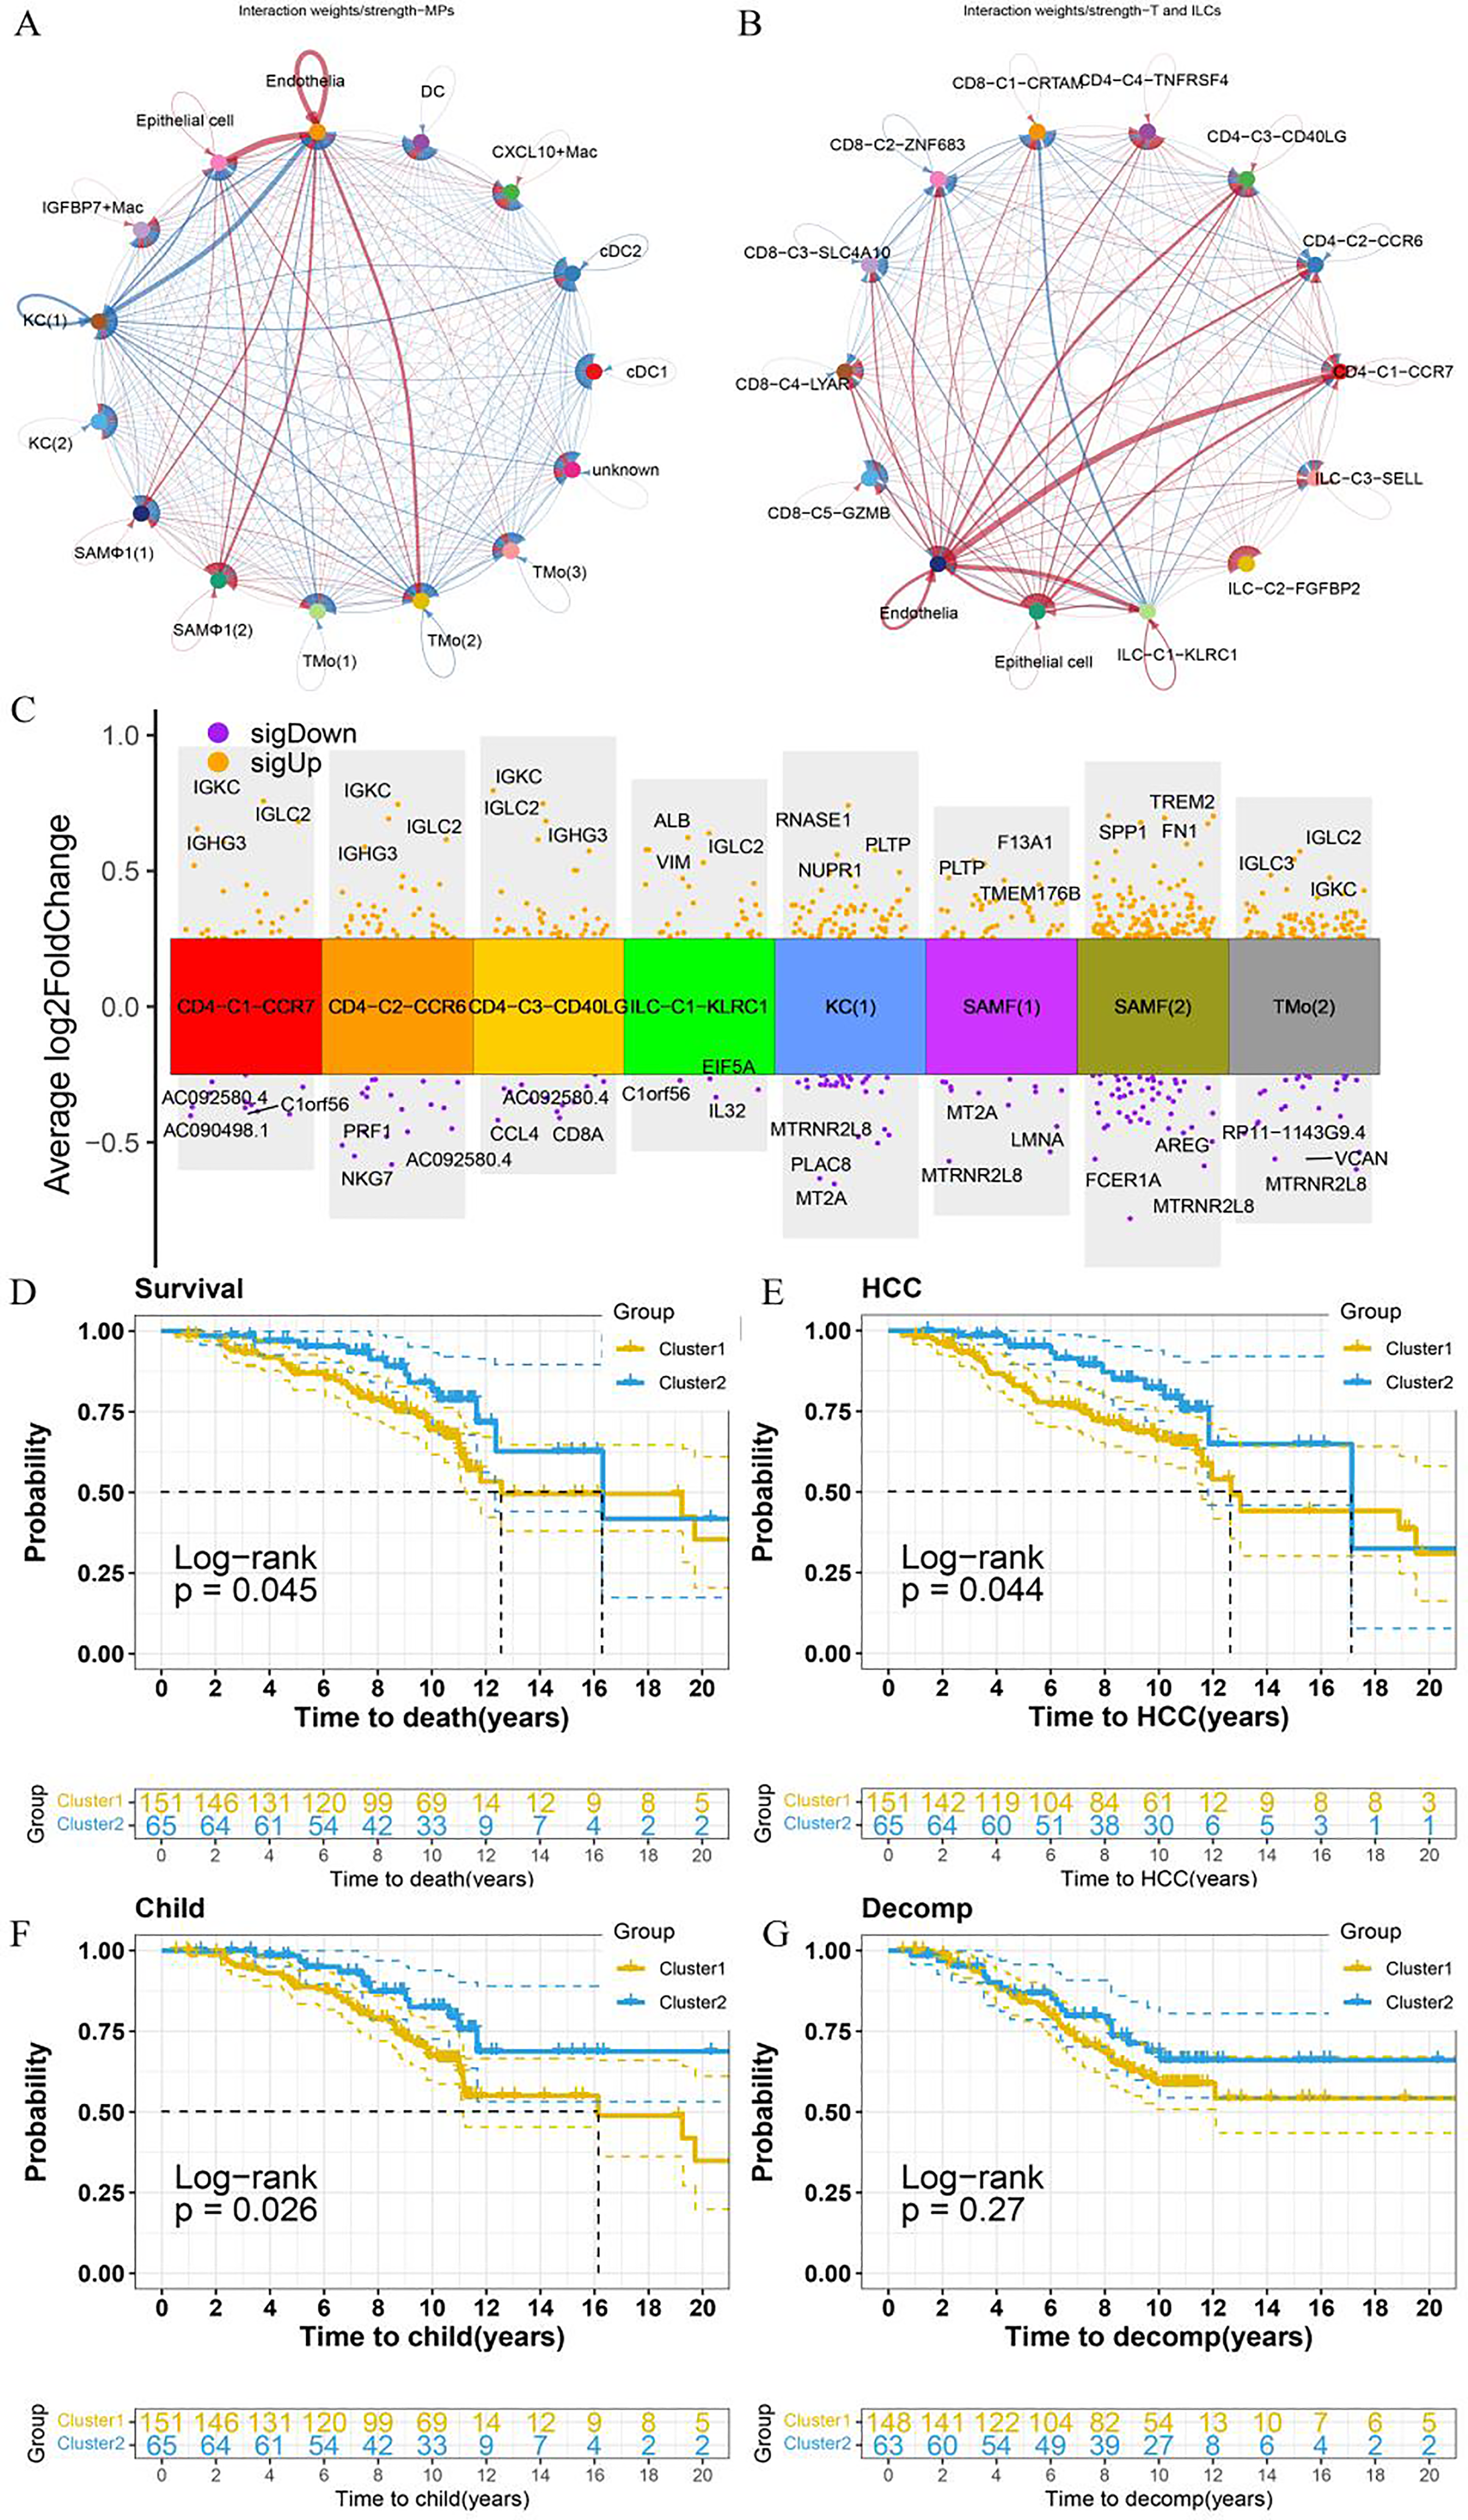
Communication patterns of MP, ILC, and T cell subpopulations with epithelial and endothelial cells in relation to cell communication and prognosis. (A, B) Line thickness represents the intensity or volume of communication, while colors differentiate communication scenarios under specific conditions (blue: healthy, red: cirrhosis). (C) Volcano plots display differential gene expression across various subpopulations. (D) KM curves illustrate overall survival, HCC development (E), Child-Pugh progression (F), and decomp development (G) in clusters 1 and 2.
Discussion
LF, a progressive outcome of chronic liver disease, arises from factors such as chronic alcohol consumption, viral infections, autoimmune disorders, and other etiologies. It can advance to cirrhosis and liver dysfunction, potentially leading to liver failure and hepatocellular carcinoma. This study identified specific cell subpopulations with altered distributions, including KC (1), KC (2), SAMΦ (1), SAMΦ (2), CD4-C1-CCR7, CD4-C3-CD40LG, CD4-C4-TNFRSF4, CD8-C1-CRTAM, and CD8-C5-GZMB, which were implicated in the progression and unfavorable prognosis of LF and cirrhosis.
Macrophages have been shown to play a key role in both the progression and resolution of LF.5,30 Among the MP subpopulations analyzed, SAMΦ, known for its pro-fibrotic activity, was notably upregulated in patients, aligning with the observations of NC Henderson et al.. 21 Interestingly, this subpopulation demonstrated overexpression of CD163, a marker typically associated with anti-inflammatory M2 macrophages. This suggests that, under specific conditions, M2 macrophage polarization may not alleviate LF but rather contribute to fibrosis progression, aggravating the disease. Evidence indicates that M1 macrophages and pro-inflammatory cytokines are markedly increased in carbon tetrachloride-induced LF, whereas M2 macrophages dominate in schistosome-induced LF.31,32 In addition, CX3CR1 deficiency may impair the anti-inflammatory function of M2 macrophages, leading to increased TGF-β expression, HSC activation, and LF progression. 33-35 Additionally, M2c macrophages expressing CD163 have been found to co-express the inflammatory marker TNF-α 36 and the fibrosis marker TIMP1, 37 indicating the presence of pro-fibrotic M2 macrophages. In contrast, reducing M1 macrophages while promoting M2 macrophage polarization has been reported to mitigate HSC and fibroblast activation. 38 Notably, KC (1) macrophages were identified to exhibit elevated CD5L expression in this analysis. Maria-Rosa Sarrias et al. 39 demonstrated that CD5L modulates the phenotype of Ly6Chigh (pro-inflammatory) macrophages, shifting them to a Ly6Clow (anti-inflammatory) state. CD5L also promotes the secretion of MMP9 and MMP12 while inhibiting the expression of pro-inflammatory cytokines and pro-fibrotic genes, such as platelet-reactive protein-1.40,41 Additionally, CD5L prevents SMAD2/3 nuclear translocation by enhancing SMAD7 activity and elevating ID2 transcription factor levels. 42 It also suppresses TGF-β signaling in HSCs, thereby mitigating LF progression. 39 In our study, macrophage populations with increased expression of IGFBP7 or CXCL10 were identified. A separate study indicated that elevated IGFBP7 levels in plasma from LF/cirrhosis patients enhanced mediators of the Th17 response, exacerbating fibrosis, while steatosis alone did not produce this effect. 25 A study by Myriam Aouadi et al. 26 demonstrated that knocking down IGFBP7 expression in liver macrophages significantly reduced hyperglycemia and hepatic steatosis in high-fat diet-induced mice, highlighting IGFBP7's role in metabolic regulation rather than inflammation. 26 Additionally, CXCL10 knockout in mice has been shown to attenuate LF, with its levels correlating with the severity of HCV-induced liver disease. 43 CXCL10-expressing KCs promote hepatitis through their interactions with monocytes. 44 Collectively, these MP phenotypes likely contribute significantly to the progression of cirrhosis and fibrosis, emphasizing the role of macrophage phenotypes and immune microenvironment alterations in LF development.
Previous research has emphasized the integral role of T cell-mediated immunity in the progression of LF. 8-10 To explore changes in ILC and T cell populations in LF, 12 novel subpopulations were identified through analysis. Findings revealed an increased proportion of CD4+ T cells in liver tissue, accompanied by a reduction in CD8+ T cells. In contrast, Rifaat Safadi et al. 45 reported a significant reduction in the CD4/CD8 ratio and NK cell levels in advanced human fibrosis, highlighting a divergence in outcomes. This discrepancy may be attributed to Safadi et al.'s focus on patients in their mid-40 s with advanced fibrosis driven by hepatitis B virus (HBV) or HCV infection. In contrast, NC Henderson's study examined cirrhosis caused by non-alcoholic fatty liver disease, alcohol-related liver disease, and primary biliary cholangitis in a cohort averaging 56 years of age. The CD4-C1-CCR7 cell subpopulation was notably upregulated in the disease group, potentially due to infiltration from peripheral blood. 46 This was corroborated by the increased expression of the CCR7 subpopulation in PBMCs from cirrhotic patients. CD4-C1-CCR7 cells are naïve CD4+ T cells. Activation of cannabinoid receptor 2 (CB2) on these cells inhibits their differentiation into Th17 lymphocytes, reduces the expression of the pro-inflammatory gene IL-17, and thereby attenuates LF. 47 Lower levels of naïve T cells have been reported in patients with alcohol use disorder-related LF 48 and primary biliary cirrhosis. 49 In contrast, the resolution of cirrhosis has been linked to a decrease in CD4 + lymphocytes. 50 These alterations in CD4 + naïve cells significantly influence the onset and resolution of fibrosis across various disease stages.
The study identified CD4+ T cells with elevated CD40LG expression, the ligand for CD40. Despite reduced serum levels of soluble CD40LG in patients with alcoholic and HCV-related cirrhosis, which has been associated with early diagnostic potential 51 and patient prognosis, 52 an increase in CD40LG + CD4+ T cell populations was observed in liver tissue from cirrhotic patients. Additionally, CD40 signaling was upregulated in the cirrhotic group, indicating its involvement in the pro-inflammatory 53 and pro-fibrotic processes mediated by CD40 receptor-ligand interactions in liver cellular communication. 54 Beyond immune cell interactions, including CD4+ T cells 55 and liver-derived macrophages, 56 CD40 and CD40LG were also implicated in crosstalk with HSCs, driving sustained HSC activation in LF through TNFR-related factor 2 and IKK2-dependent pathways. 57 The CD4-C4-TNFRSF4 cell subpopulation was found to express the T-cell depletion-associated gene TIGIT. TIGIT, an inhibitory receptor present on both T cells and NK cells, 58 is highly expressed in immune-depleted CD4+ and CD8+ T cells, which consistently show elevated levels of multiple inhibitory receptors. These receptors are integral to immune regulation in chronic viral infections and within the tumor microenvironment, 59 driving the secretion of the anti-inflammatory cytokine IL-10 60 and influencing T cell activation. 61 In clinical settings, antiviral treatment for HCV 62 and primary biliary cholangitis 63 has been shown to downregulate TIGIT expression in CD4+ T cells, accompanied by a restoration of T cell populations in the peripheral blood. 64 Conversely, TIGIT knockdown or inhibition specifically reverses hepatic CD8+ T cell depletion, inducing tolerance in HBsAg transgenic mice and contributing to the development of chronic hepatitis. 65 This highlights the significant role of TIGIT in T cell dysfunction during HCV infection. In our study, a reduction in CD8-C1-CRTAM was observed within the disease group. Konrad Streetz et al. demonstrated that CRAMP-KO mice on a methionine- and choline-deficient diet exhibited increased intrahepatic fat accumulation, 66 which also enhanced NK cell cytotoxicity and interferon-γ secretion, alongside CD8+ T cell-mediated anti-fibrotic effects. 67-69 In line with these results, the ILC-C2-FGFBP2 and CD8-C5-GZMB subsets identified in our study, known for their cytotoxic properties, expressed S1PR1, S1PR4, and S1PR5. S1PRs, or sphingosine 1-phosphate receptors, play a key role in lymphocyte migration, LF, inflammation, angiogenesis, and other related processes. Targeting S1PR1, S1PR2, and S1PR3 has been shown to alleviate fibrosis.70,71 Although S1PR5 and S1PR4 were previously reported to be absent in the liver, 72 inhibition of S1PR4 expression in macrophages has been shown to reduce the inflammatory response in non-alcoholic steatohepatitis. This suggests that S1PR-expressing macrophages may contribute to the inflammatory process through peripheral infiltration into liver tissue. 73 In PBMCs from patients with liver cirrhosis, three ILC subgroups, particularly the ILC-C3-FGFBP2-MYOM2 group, exhibited elevated expression of GNLY, FGFBP2, PRF1, GZMH, CX3CR1, GZMB, S1PR5, and S1PR4, further supporting the notion that S1PR-expressing cells in liver tissue likely originate from peripheral immune infiltration. S1PR5 and S1PR4 may thus enhance the infiltration of cytotoxic T cell subpopulations within the liver or represent potential therapeutic targets for LF in cirrhosis. Additionally, pro-inflammatory and pro-fibrotic CD4 + subpopulations, including CD4-C4-TNFRSF4, CD4-C1-CCR7, and CD4-C3-CD40LG, were upregulated in cirrhotic liver tissues, whereas hepatoprotective, anti-fibrotic CD8-C1-CRTAM and cytotoxic CD8-C5-GZMB subpopulations were downregulated.
In terms of cellular communication, CD40, MK, TWEAK, and SPP1 expression was elevated in the disease group. Research 74 suggests that the CD40-CD40LG interaction plays a key role in fibroblast activation, while MK and TWEAK are involved in the fibrotic process.75,76 SPP1 was notably upregulated in cirrhotic patients, particularly in MPs, ILCs, and during communication between T cells and both epithelial and endothelial cells. Macrophage-derived SPP1 has been reported to mitigate non-alcoholic hepatitis, 77 while weight-loss surgery has been shown to alleviate non-alcoholic steatohepatitis by reducing SPP1 levels. 78 Conversely, inhibiting monocyte secretion of SPP1 improves LF outcomes. 79 Additionally, the SPP1-CD44 interaction may limit T cell proliferation and chemotaxis. 80 In this study, elevated SPP1 expression in SAMΦ in cirrhosis likely contributed to its pro-fibrotic activity. This suggests that the functional heterogeneity of SPP1 in LF is influenced by its interactions with diverse cell types through distinct mechanisms.
Building upon the work of NC Henderson 21 and others, this research seeks to enhance the understanding of how immune cell alterations relate to prognosis in cirrhosis patients through a detailed analysis. The study specifically examined immune cell subsets, identifying those that may impact prognosis as cell proportions shift. Further stratification of these subsets into refined immune subpopulations allowed for a deeper investigation into immune microenvironment changes linked to cirrhosis. Additionally, functional analyses of these subpopulations provided further insights, expanding on the initial findings. The study identified KC (1), SAMΦ (1), SAMΦ (2) within the MP subpopulation, as well as CD4-C1-CCR7, CD4-C3-CD40LG, ILC-C1-KLRC1, alongside epithelial and endothelial cells in the T and ILC subpopulations, whose interactions contribute to fibrosis progression. Given that the immune high cluster correlates with a worse prognosis and the altered cell subpopulations in cirrhosis are predominantly linked to immune inflammatory responses and pro-fibrotic activity, it is hypothesized that these imbalanced subpopulations play a significant role in the poor outcomes observed in patients. In contrast, cluster 2, associated with higher survival rates, was enriched in metabolic pathways including fatty acid metabolism, retinol metabolism, complement and coagulation cascades, glycolysis/gluconeogenesis, and pyruvate metabolism. Recent research has shown that macrophage pyruvate kinase M2 (PKM2) modulation enhances glycolysis and induces M1 polarization, contributing to LF progression. 81 In contrast, PKM2 tetramerization 82 effectively suppresses HSC activation. Inhibition of mitochondrial pyruvate metabolism has demonstrated potential in mitigating fibrosis in non-alcoholic steatohepatitis patients. 83 In individuals with advanced LF who lack enzymes involved in fatty acid metabolism, 84 fatty acids become cytotoxic and further exacerbate fibrosis. The favorable prognosis observed in cluster 2 may result from the upregulation of fatty acid metabolic pathways. Therefore, targeting immune responses, promoting metabolic pathways such as fatty acid metabolism, and correcting dysregulated cellular subpopulations emerge as promising therapeutic strategies for treating LF in cirrhosis.
Despite its comprehensive bioinformatic analyses, this study presents several limitations that warrant discussion. Firstly, our analysis was constrained by a relatively limited sample size from public datasets. Furthermore, inherent challenges in single-cell isolation and processing, coupled with the potential omission of certain rare cell types, might lead to an incomplete representation of the entire immune landscape in LF. Additionally, the publicly available datasets utilized in this study exhibited clinical heterogeneity. They encompassed patients with diverse underlying etiologies for LF, including chronic hepatitis B virus infection, chronic hepatitis C virus infection, non-alcoholic fatty liver disease, and cases where the specific cause was not explicitly detailed. While this reflects the complex etiology of LF in clinical practice, this diversity introduces variability that could influence the observed immune profiles and intercellular communication patterns. Moreover, the limitations in available detailed clinical covariates (such as age, MELD score, or specific etiology of cirrhosis) within the public datasets precluded the performance of multivariate Cox regression analysis. This limits our ability to fully account for the potential confounding effects of these important clinical factors on the identified prognostic immune cell populations. Furthermore, the clustering analysis of immune scores identified in this study lacked independent external validation. Finally, our current findings primarily focus on identifying disease-related alterations in cell subpopulations, and further studies are needed for robust predictive modeling and external validation of these identified immune cell populations and mechanisms. Addressing these limitations in future research, possibly through more homogeneous patient cohorts or etiology-stratified analyses, will be crucial for a more precise and generalizable understanding of LF progression.
Conclusion
Analysis of scRNA-seq data revealed shifts in the proportions of MP, ILC, and T cell populations, prompting an investigation into their potential functional roles. These subpopulations were linked to adverse prognosis in patients with LF. Targeting S1PR4 and S1PR5 in ILC-C2-FGFBP2, toxicity-associated CD8-C5-GZMB, hepatoprotective anti-fibrotic CD8-C1-CRTAM, and CCR7 + T cell subpopulations, along with inhibiting IGFBP7-expressing macrophages, may represent viable therapeutic strategies for LF treatment.
Supplemental Material
sj-docx-1-cbm-10.1177_18758592251374861 - Supplemental material for Role of immune cell subsets in liver fibrosis through single-cell RNA sequencing and array
Supplemental material, sj-docx-1-cbm-10.1177_18758592251374861 for Role of immune cell subsets in liver fibrosis through single-cell RNA sequencing and array by Bo Yang, Junjie Yuan, Jingwen Zhao and Xin Chen in Cancer Biomarkers
Supplemental Material
sj-docx-2-cbm-10.1177_18758592251374861 - Supplemental material for Role of immune cell subsets in liver fibrosis through single-cell RNA sequencing and array
Supplemental material, sj-docx-2-cbm-10.1177_18758592251374861 for Role of immune cell subsets in liver fibrosis through single-cell RNA sequencing and array by Bo Yang, Junjie Yuan, Jingwen Zhao and Xin Chen in Cancer Biomarkers
Footnotes
Acknowledgments
The authors extend their gratitude to the GEO database for the data used in this study. Special thanks to Bullet Edits Limited for providing linguistic editing and proofreading services.
Ethical approval and informed consent statements
All data analyzed in this study were obtained from publicly accessible databases (Gene Expression Omnibus database). The original studies involving human participants were reviewed and approved by their respective ethics committees, with all data anonymized prior to public release. Therefore, no additional ethical approval was required for this secondary analysis.
Author's contributions
Conceptualization: Bo Yang, Jingwen Zhao, and Xin Chen.
Interpretation or analysis of data: Bo Yang and Junjie Yuan.
Preparation of the manuscript: Bo Yang and Junjie Yuan.
Revision for important intellectual content: Bo Yang and Junjie Yuan.
Supervision: Jingwen Zhao and Xin Chen.
Funding
The authors disclosed receipt of the following financial support for the research, authorship, and/or publication of this article: This study was funded by the Health Commission of Guizhou Province (Grant No.2024GZWJKJXM0743), the Zunyi Municipal Natural Science Foundation (Grant No.HZ (2024) No. 132), Guizhou Aerospace Hospital (Grant No.gzhtyy-2023-12).
Declaration of conflicting interests
The authors declared no potential conflicts of interest with respect to the research, authorship, and/or publication of this article.
Data availability statement
The Gene Expression Omnibus database (![]() ) was utilized to retrieve datasets pertaining to LF/cirrhosis, including GSE6764, GSE14323, GSE25097, GSE45050, GSE139602, GSE89377, GSE15654, and GSE84044. Additionally, the single-cell dataset GSE136103 for cirrhosis-associated tissue and peripheral blood mononuclear cells (PBMCs), along with the PBMC datasets GSE149689 and GSE167363 pertaining to normal patients, were obtained. For additional information or queries, please contact the corresponding author as indicated in the publication.
) was utilized to retrieve datasets pertaining to LF/cirrhosis, including GSE6764, GSE14323, GSE25097, GSE45050, GSE139602, GSE89377, GSE15654, and GSE84044. Additionally, the single-cell dataset GSE136103 for cirrhosis-associated tissue and peripheral blood mononuclear cells (PBMCs), along with the PBMC datasets GSE149689 and GSE167363 pertaining to normal patients, were obtained. For additional information or queries, please contact the corresponding author as indicated in the publication.
Supplemental material
Supplemental material for this article is available online.