
Abstract
Introduction
Triple-Negative Breast Cancer (TNBC) is a subtype of breast cancer characterized by the absence of estrogen receptors, progesterone receptors, and HER2 expression, accounting for approximately 15% of all breast cancer cases. TNBC is associated with poor prognosis and lacks effective targeted therapies. T cell exhaustion (TEX) refers to the functional decline of T cells within the tumor microenvironment, which adversely affects immune responses. This study investigates the role of TEX in TNBC and its relationship with patient prognosis. The objective of this research is to evaluate the impact of TEX characteristics on the response to immunotherapy in TNBC patients through single-cell RNA sequencing and various bioinformatics analyses, aiming to identify potential biomarkers and therapeutic targets.
Methods
We performed a comprehensive analysis of the GSE161529 dataset using 10× scRNA-seq, identifying 12,477 high-quality cells and seven distinct cell subpopulations. Differential expression analysis and co-expression network construction revealed 154 candidate TEX-related genes, from which five prognostically significant genes were selected to construct a risk scoring model.
Results
Our findings indicate that TEX characteristics are crucial for prognostic assessment in TNBC patients, with significant correlations between risk scores and tumor-infiltrating immune cells. High-risk patients exhibited elevated expression levels of immune checkpoint genes, suggesting potential implications for immunotherapy.
Conclusions
This study underscores the clinical significance of TEX features in TNBC prognosis and highlights the urgent need for therapeutic strategies targeting TEX to improve patient outcomes.
Keywords
Introduction
Breast cancer remains one of the most prevalent malignancies worldwide, with approximately 2.3 million new cases diagnosed annually, representing 11.7% of all cancer incidences, and accounting for around 680,000 deaths, making it a leading cause of cancer-related mortality globally. 1 Among its subtypes, triple-negative breast cancer (TNBC) is distinguished by the absence of estrogen receptors (ER), progesterone receptors (PR), and human epidermal growth factor receptor 2 (HER2) expression. This phenotype defines approximately 15–20% of all breast cancer cases and is associated with an aggressive clinical course, characterized by early relapse, higher rates of vascular invasion, distant metastases, and poor overall prognosis. 2 Unlike other breast cancer subtypes that benefit from targeted therapies such as endocrine treatment or HER2 inhibitors, TNBC patients are limited to conventional chemotherapy and surgical interventions. 3 However, the pronounced heterogeneity of TNBC, both at the molecular and immunological levels, poses a significant challenge for effective treatment and underlines the urgent need to identify robust prognostic biomarkers and novel therapeutic targets.
Recent advances in immuno-oncology have revealed that T cells are central to anti-tumor immunity, especially in the context of immune checkpoint therapies.4,5 Under physiological conditions, naïve T cells are activated upon encountering antigens, co-stimulatory signals, and inflammatory cues, subsequently differentiating into effector and memory T cells capable of clearing pathogens and transformed cells. 6 However, in chronic antigen exposure environments such as the tumor microenvironment (TME), T cells progressively lose their effector functions—a state termed T cell exhaustion (TEX). Exhausted T cells are characterized by sustained expression of multiple inhibitory receptors, reduced cytokine production, impaired proliferative capacity, and altered metabolic profiles, all of which contribute to their diminished cytotoxicity. 7 T cell exhaustion is now understood as a progressive process rather than a uniform state. Early exhausted T cells retain stem-like properties (e.g., TCF1 expression), moderate PD-1 levels, and partial responsiveness to immune checkpoint blockade. With persistent stimulation, they acquire higher expression of inhibitory receptors such as TIM-3 and LAG-3, diminished cytokine production, and impaired metabolism, eventually transitioning into terminally exhausted cells with fixed epigenetic programs and minimal effector function. In TNBC, this hierarchical exhaustion continuum critically shapes both prognosis and the variable outcomes of immunotherapy.8,9
Importantly, CD8+ exhausted T cells (CD8+Tex) remain a major target for cancer immunotherapy. The development of immune checkpoint blockade (ICB), particularly therapies targeting PD-1/PD-L1 or CTLA-4 pathways, has partially reversed exhaustion phenotypes and yielded durable responses in various malignancies. 10 Nonetheless, the efficacy of ICB in TNBC remains variable, and a substantial proportion of patients fail to respond or develop resistance, suggesting that TEX is regulated by complex molecular and cellular networks that are not yet fully understood.
A growing body of evidence has pointed to the pivotal role of the TME in shaping immunotherapy outcomes. 11 Among the diverse components of the TME, tumor-infiltrating lymphocytes, especially T cells, serve as both indicators of immune activity and key effectors of tumor control. However, these cells often become dysfunctional due to chronic antigenic stimulation and persistent exposure to immunosuppressive signals within the TME. The upregulation of inhibitory receptors, such as PD-1, TIM-3, LAG-3, and TIGIT, leads to immune evasion and disease progression. 12 Moreover, exhausted T cells undergo unique epigenetic and transcriptional reprogramming that locks them into a dysfunctional state, limiting their ability to respond even upon therapeutic intervention. 13
In this context, delineating the features of TEX in TNBC at high resolution becomes crucial for improving prognostic prediction and optimizing immunotherapy strategies. Single-cell RNA sequencing (scRNA-seq) and high-throughput bulk transcriptomic analysis have revolutionized our capacity to dissect immune heterogeneity and gene expression dynamics within tumors. These technologies have been extensively applied to identify immune-related biomarkers, infer immune cell states, and classify patients into molecular subtypes with distinct prognoses.14–22 TEX involves a gradual loss of effector functions and progressive changes in transcriptional programs. 23 Yet, systematic analyses of TEX characteristics in TNBC remain limited, particularly at the single-cell level.
Therefore, this study integrates single-cell and bulk RNA sequencing data from TNBC samples to comprehensively profile the transcriptomic landscape of exhausted T cells. By applying differential expression analysis, co-expression network construction, and survival modeling, we aim to identify TEX-related genes with prognostic value and explore their functional relevance within the immune microenvironment of TNBC. Our work provides novel insights into the molecular underpinnings of T cell exhaustion and offers a promising framework for developing personalized immunotherapeutic strategies in TNBC.
Materials and Methods
The reporting of this study conforms to REMARK guidelines. 24
Data Source Collection
We retrieved the GSE161529 dataset, which includes 10× Genomics-based single-cell RNA sequencing (scRNA-seq) data from two triple-negative breast cancer (TNBC) samples, comprising a total of 16,935 cells. In parallel, we obtained transcriptomic profiles, somatic mutation data, and clinical information for both normal breast tissue (n = 113) and TNBC samples (n = 101) from The Cancer Genome Atlas (TCGA; https://portal.gdc.cancer.gov/). Additionally, RNA-seq data from the International Cancer Genome Consortium (ICGC) and immunotherapy cohorts, including IMvigor210 (http://research-pub.gene.com/IMvigor210CoreBiologies/), GSE78220, GSE79671, and GSE91061 (https://www.ncbi.nlm.nih.gov/geo/), were incorporated to assess the influence of T cell exhaustion (TEX) signatures on immunotherapy outcomes.
10× scRNA-Seq Data Processing
ScRNA-seq data from the GSE161529 dataset were processed using the Seurat package (v4.0.0) in R to ensure high data quality. We followed the standard Seurat pipeline with defined quality-control thresholds. Cells with fewer than 200 detected genes, or with >10% mitochondrial gene content, were removed to exclude low-quality or stressed cells. 25 Genes expressed in fewer than 1,000 total counts across all cells were also filtered out. After normalization, the top 2000 highly variable genes were identified using the FindVariableFeatures function. Potential doublets and cell debris were identified and excluded during preprocessing. After quality control, the remaining high-quality cells were used for dimensionality reduction and clustering analysis. Principal component analysis (PCA) was used for dimensionality reduction, followed by Uniform Manifold Approximation and Projection (UMAP) to visualize and cluster cells. Differentially expressed genes in each cluster were identified using the FindAllMarkers function with adjusted thresholds for |log2FC| and min.pct. Cell type annotation was conducted using the SingleR package, referencing annotated immune and epithelial datasets. 26 For functional analysis, we used the ReactomeGSA package to perform pathway enrichment via the pathways function. 27 To assess intercellular communication, the CellChat package was employed to infer signaling pathways, while Patchwork was used for network visualization. All analyses were performed in R (version 4.2.0). Unless otherwise specified, default parameters of Seurat and related packages were applied.
Identification of Key Co-expressed Modules
To identify modules of co-expressed genes associated with TEX features, we performed Weighted Gene Co-expression Network Analysis (WGCNA). 28 A soft-thresholding power (β) was selected based on the criterion of approximate scale-free topology. Modules were identified using dynamic tree cutting, and module–trait relationships were calculated to detect modules correlated with TEX scores. Genes within the module most significantly associated with TEX were retained for further analysis.
TEX Pathway Activity Assessment
TEX-related genes were curated from the MSigDB (v7.2) and the TISCH BRCA dataset. Using the GSVA package in R, we computed gene set variation analysis (GSVA) scores to quantify pathway activity in each sample. 29 These scores were used to assess the regulatory influence of TEX on TNBC progression.
Construction and Validation of TEX Features
To construct a prognostic model, LASSO (least absolute shrinkage and selection operator) regression was performed using the glmnet package. Genes significantly associated with survival in univariate Cox analysis (p < 0.05) were input into the LASSO model to avoid overfitting. The resulting coefficients from multivariate Cox regression were used to calculate a risk score for each patient:

Patients were stratified into high- and low-risk groups based on the median risk score. Survival analysis was performed using Kaplan-Meier curves, and predictive performance was evaluated using time-dependent receiver operating characteristic (ROC) curves. The model was internally validated on the TCGA cohort and externally validated using the ICGC-BRCA dataset.
Independent Prognostic Analysis and Construction of Nomograms
To test the independence of the TEX risk score as a prognostic factor, we conducted univariate and multivariate Cox regression analyses based on age, gender, grade, pathological stage, T stage, and risk score. A nomogram was constructed using the rms package to predict 1-, 2-, and 3-year overall survival probabilities. Calibration plots were generated to assess the agreement between predicted and observed outcomes.
Functional Enrichment Analysis
To understand biological functions and pathways associated with TEX-related genes, Gene Ontology (GO) and Kyoto Encyclopedia of Genes and Genomes (KEGG) enrichment analyses were conducted using the ClusterProfiler package. Visualizations were generated using the circlize package. In addition, GSVA was used to compare pathway activation between high-risk and low-risk groups using the “c2.cp.kegg.v7.4.symbols.gmt” gene set from MSigDB.
Somatic Mutation Analysis
Somatic mutation profiles in MAF (Mutation Annotation Format) were analyzed using the maftools package. Tumor mutation burden (TMB) was calculated for each TNBC sample as:

Survival analysis was performed to evaluate the prognostic impact of TMB in TNBC patients. Mutational landscapes for both high- and low-risk groups were visualized using waterfall plots.
Correlation between TEX Features and the Immune Microenvironment
We used seven deconvolution algorithms (XCELL, TIMER, QUANTISEQ, MCPCOUNTER, EPIC, CIBERSORT-ABS, and CIBERSORT) to quantify tumor-infiltrating immune cells and assess their correlation with the TEX risk score. Additionally, comparing their levels between risk groups, the expression of 18 immune checkpoint molecules were analyzed.
Using the ESTIMATE package, we calculated stromal, immune, and composite ESTIMATE scores to assess tumor purity and microenvironment composition. These immune scores were compared across risk groups using Wilcoxon rank-sum tests.
Prediction of Immunotherapy and Chemotherapy Sensitivity
To evaluate treatment response prediction, we analyzed the relationship between TEX features and response to immune checkpoint blockade (ICB) using three GEO immunotherapy cohorts and the IMvigor210 dataset. IMvigor210 data were processed using the IMvigor210CoreBiologies package to ensure proper annotation and normalization.
To estimate chemotherapy sensitivity, we utilized the Genomics of Drug Sensitivity in Cancer (GDSC) database and applied the pRRophetic package to calculate the half-maximal inhibitory concentration (IC50) for a panel of drugs. This approach predicts drug response based on the expression profile of each sample and was validated across risk groups.
Statistical analysis
This study employed R software (Version 4.2.2) for data processing and statistical analysis. Unless specified otherwise, employ Student's T-Test for comparisons of two sets of continuous variables when the data follows a normal distribution, and use the Mann-Whitney U-test when the data does not conform to normality (equivalent to the Wilcoxon Rank Sum Test). Utilize the Kruskal-Wallis test for comparisons involving three or more groups. We employed Spearman correlation to assess the relationships among various compounds. The significance threshold for all analyses was established at p < 0.05, and all p-values were two-tailed unless specified otherwise.
Results
Single-cell RNA-seq Analysis of TNBC Samples
An overview of the study design and analytical workflow is provided in the schematic flowchart (Supplementary Figure 1). To characterize the cellular composition and immune landscape of TNBC, we analyzed single-cell transcriptomic data from the GSE161529 dataset, which includes two primary TNBC tumor samples. After rigorous quality control to exclude low-quality or stressed cells, a total of 12,477 high-quality single cells were retained for downstream analysis.
Using established clustering methods, we identified seven transcriptionally distinct clusters, visualized in a two-dimensional UMAP embedding (Figure 1A). These clusters were subsequently annotated based on reference-based classification and canonical gene expression signatures, revealing five dominant cell populations: epithelial cells, fibroblasts, macrophages, monocytes, and T cells (Figure 1B). The largest proportion of cells belonged to the epithelial compartment, consistent with the tumor origin of the samples.

Cellular diversity and intercellular communication in TNBC revealed by scRNA-seq. (A) UMAP plot showing seven transcriptionally distinct clusters from 12,477 single cells. (B) Cell-type annotations identifying five major populations: epithelial cells, fibroblasts, macrophages, monocytes, and T cells. (C) Heatmap of representative marker gene expression across clusters, confirming cell identity. (D) Heatmap of Reactome pathway enrichment across cell types. T cells show distinct enrichment in immune activation and signaling pathways. (E) CD137 signaling pathway network, illustrating specific ligand–receptor interactions between cell types. (F) Overall interaction strength network depicting epithelial cells as central communication hubs within the tumor microenvironment.
To confirm the identity of each cell group, we generated a heatmap showing representative marker gene expression across the seven clusters (Figure 1C). Distinct marker profiles validated the classification, with epithelial cells expressing genes such as EPCAM and KRT8, while T cells and monocytes showed strong expression of CD3D and CD14, respectively.
We next explored functional differences among cell types using Reactome pathway enrichment analysis. As shown in Figure 1D, the resulting heatmap highlighted distinct pathway activities, with T cells enriched in immune activation and costimulatory signaling, while epithelial and stromal cells showed involvement in structural remodeling, metabolism, and biosynthesis pathways.
To further investigate the communication landscape within the TNBC microenvironment, we performed intercellular interaction analysis based on ligand–receptor pair inference. Focusing on signaling specificity, the CD137 (TNFRSF9) pathway emerged as a key node in the network, mediating interactions especially between T cells, epithelial cells, and stromal lineages (Figure 1E). In parallel, a comprehensive view of interaction strength across all cell types revealed epithelial cells as a major hub of communication, both as signal senders and receivers (Figure 1F). These findings suggest a potential role for epithelial cells as central modulators of tumor–immune–stromal dynamics, and indicate that T cell co-stimulatory axes such as CD137 signaling may be relevant in TNBC biology based on computational ligand–receptor predictions.
Identification of TEX Candidate Related Candidate Genes
To identify genes associated with T cell exhaustion (TEX) in triple-negative breast cancer (TNBC), we first performed differential expression analysis on the TNBC cohort from the TCGA-BRCA dataset using the limma package. A total of 23,062 differentially expressed genes (DEGs) were identified. The volcano plot shows a predominance of upregulated genes in TNBC samples (Figure 2B), while the heatmap displays the top 50 significantly upregulated and downregulated genes, clearly separating TNBC and normal breast tissues (Figure 2A).
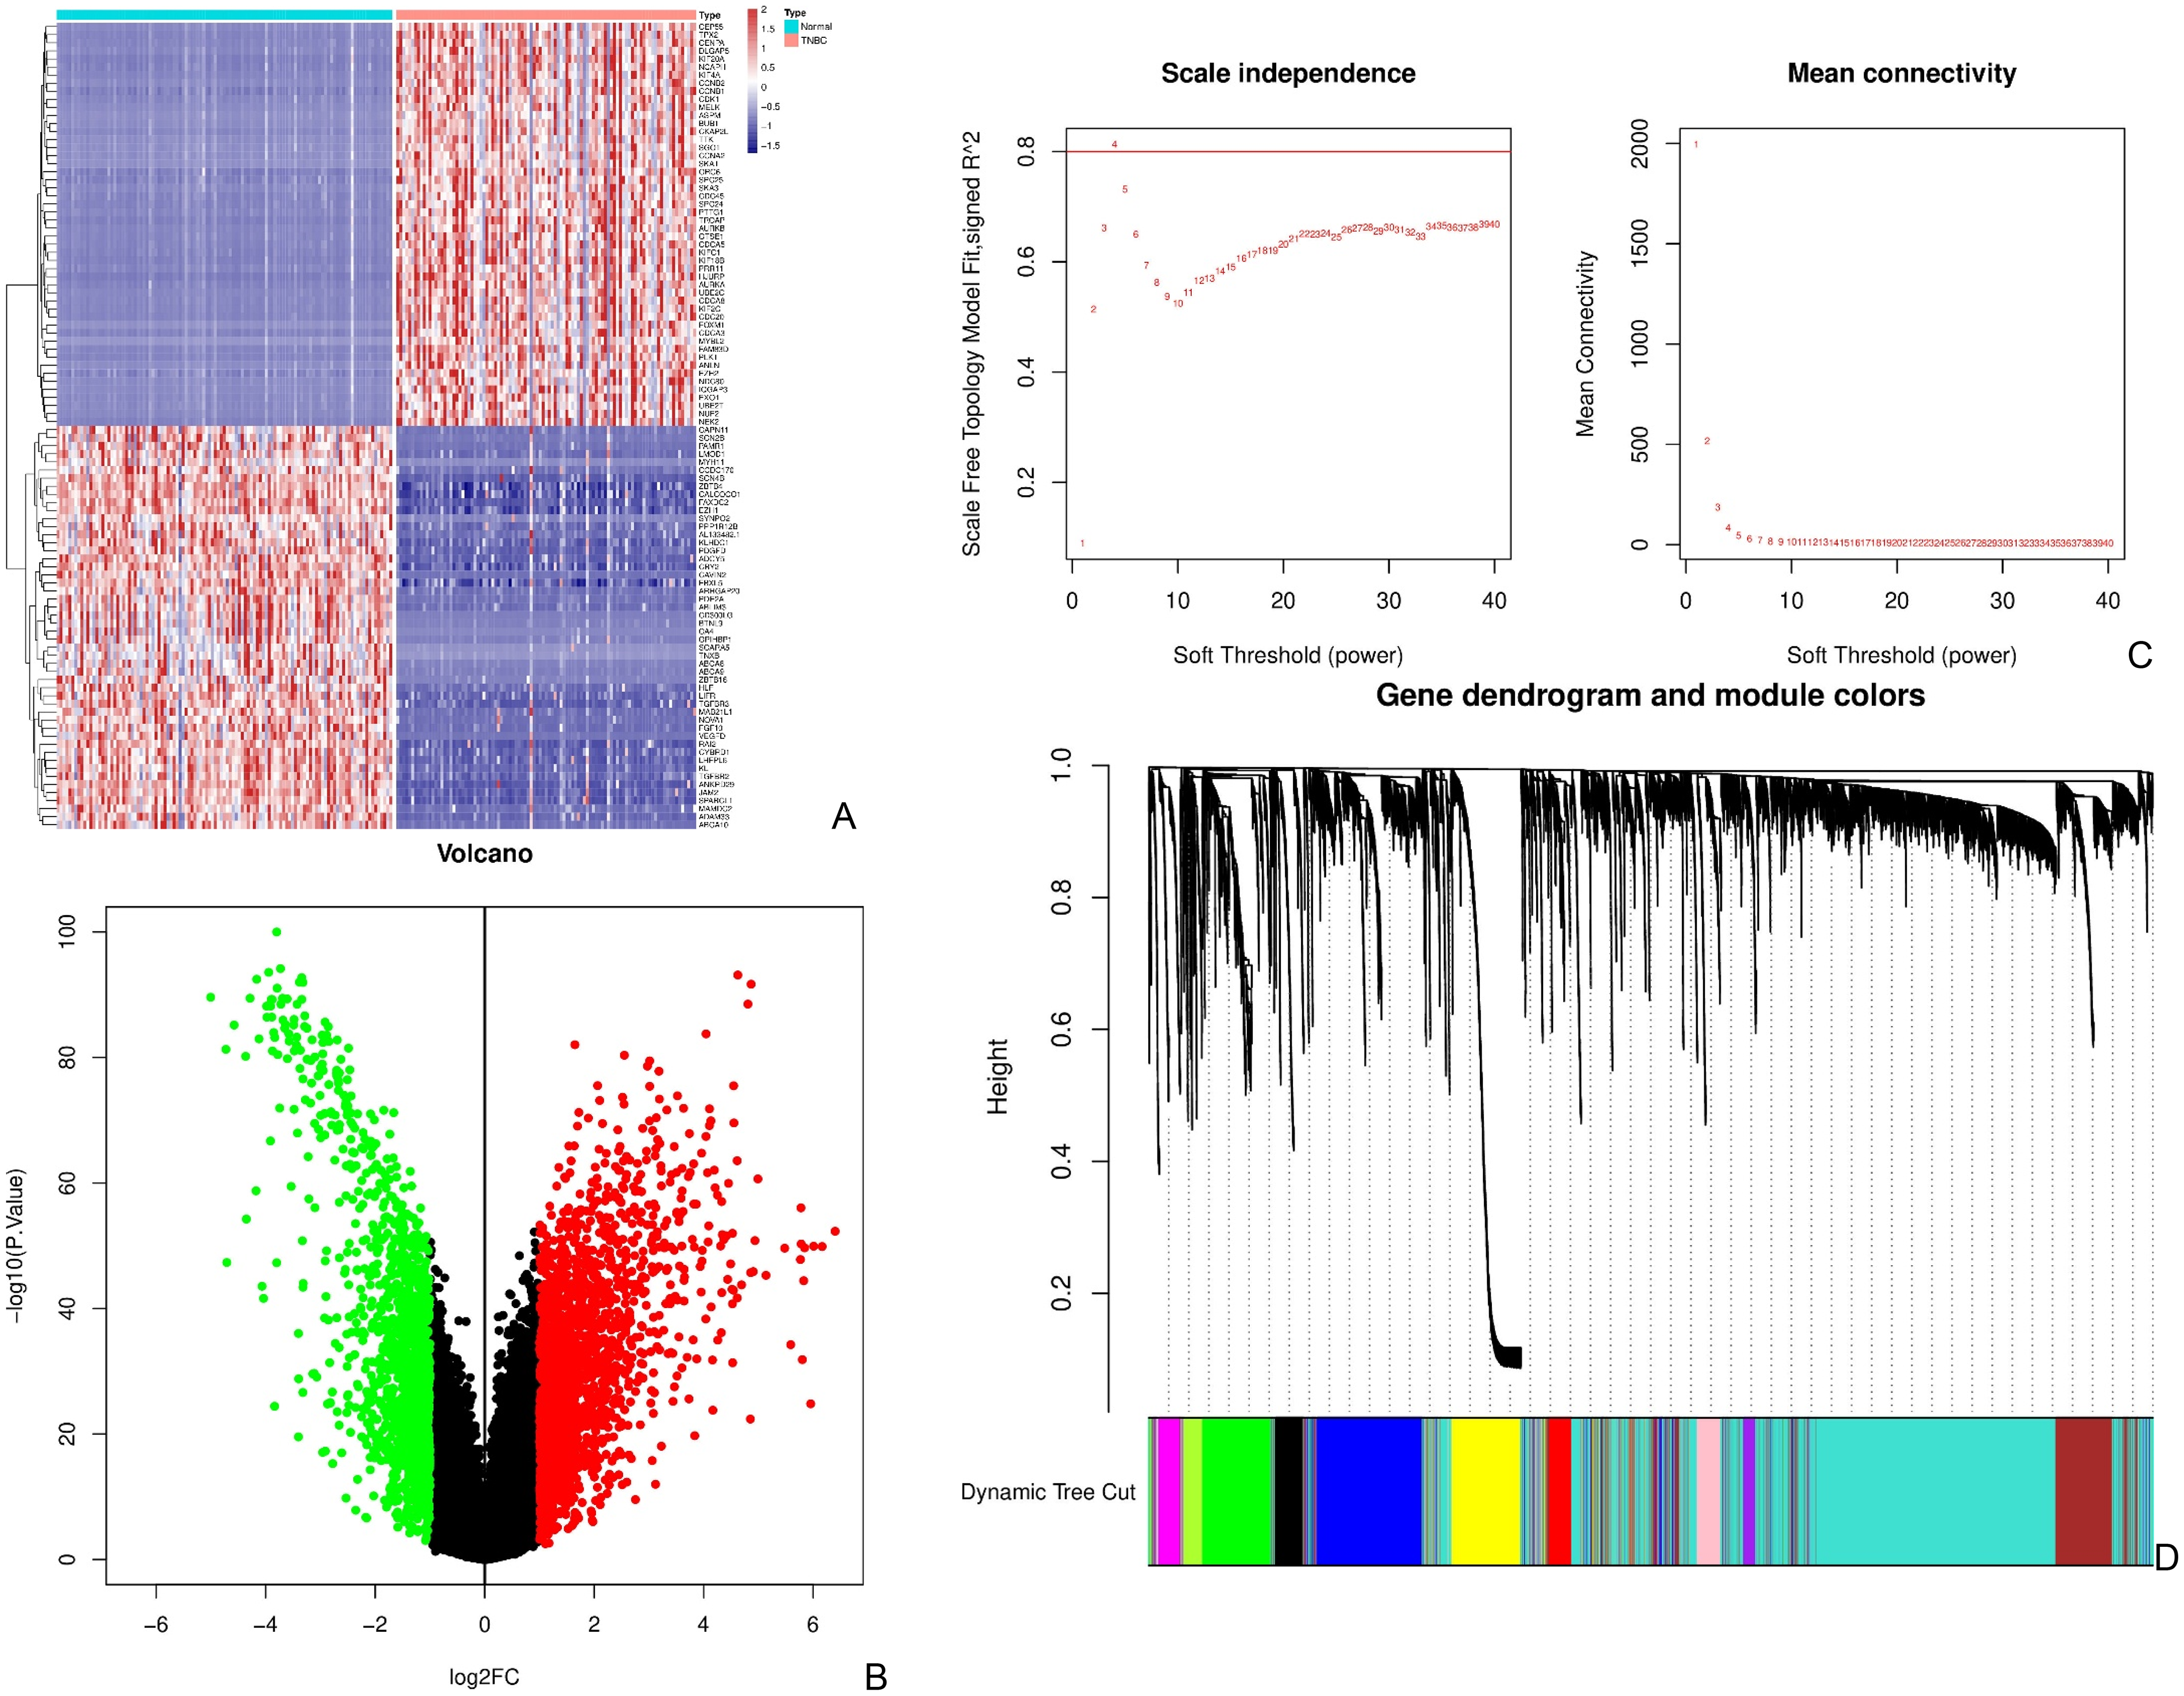
Identification of candidate genes associated with T cell exhaustion in TNBC. (A) Heatmap of the top 50 upregulated and downregulated genes differentiating TNBC and normal breast tissues. (B) Volcano plot of DEGs in the TCGA-BRCA cohort (FDR < 0.05, |log2FC| > 1). Red: upregulated; green: downregulated. (C) Scale independence and mean connectivity plots used to determine the soft-thresholding power for WGCNA (power = 4). (D) Gene dendrogram and dynamic module detection showing twelve co-expression modules. (E) Heatmap of module–trait correlations. The green module was significantly associated with TEX pathway activity. (F) Venn diagram showing the overlap between genes in the green module and known T cell marker genes, yielding 154 candidate TEX-related genes.
We next compiled a list of TEX-related genes from the TISCH database and calculated enrichment scores for TEX signatures using GSVA. These scores were used to guide downstream module analysis.
To identify gene modules most relevant to TEX progression, we constructed a co-expression network using weighted gene co-expression network analysis (WGCNA). As shown in Figure 2C, a soft-thresholding power of 4 was selected, achieving a scale-free topology fit index above 0.8. Based on hierarchical clustering and the dynamic tree cut algorithm, twelve distinct gene modules were identified (Figure 2D).
Module–trait correlation analysis revealed that the green module was significantly associated with the TEX GSVA scores (Figure 2E; P < 0.001), indicating that genes within this module are highly relevant to the TEX phenotype. To refine our candidate list, we intersected genes in the green module with known T cell marker genes. This resulted in a set of 154 candidate TEX-related genes, representing those both co-regulated in TEX-associated patterns and enriched in T cell identity (Figure 2F; Supplementary Table 1). This integrated approach combining differential expression, co-expression analysis, and pathway enrichment enabled us to prioritize a robust set of TEX-related candidates for further prognostic modeling.
Construction and External Validation of a TEX-Based Prognostic Model
To establish a TEX prognostic model unaffected by co-expression and avoiding overfitting, we first screened 154 candidate genes through univariate Cox analysis, obtaining nine significant genes (p < 0.05). To further optimize model performance, the next two genes with borderline significance were also included, resulting in an 11-gene candidate set for LASSO regression analysis (Figures 3A and 3B, Supplementary Table 2). Based on the weighted regression coefficients of these 11 genes, a linear risk score model was constructed as follows:


TEX signature establishment and external validation. (A) LASSO regression coefficient profiles of candidate TEX-related genes showing coefficient shrinkage with increasing penalty parameter λ, used to prevent overfitting. (B) Ten-fold cross-validation for LASSO model selection, identifying the optimal λ value corresponding to the minimum cross-validation error. Eleven genes were retained to construct the final risk model based on predictive accuracy. (C) Correlation heatmap between the calculated risk scores and the 11 TEX-related genes included in the final model. Among these, five genes (CLEC2B, TNFRSF25, MS4A6A, AIF1, and CD82) displayed the most consistent and significant prognostic association, representing the core components of the TEX signature. (D, G) Risk score distribution and survival status plots of TNBC patients from the TCGA training cohort (D) and the ICGC validation cohort (G), illustrating the separation between high- and low-risk groups. (E, H) Kaplan–Meier survival curves comparing overall survival between high-risk (HR) and low-risk (LR) patients in the TCGA (E) and ICGC (H) cohorts, showing significantly poorer outcomes in the HR group. (F, I) Time-dependent ROC curves for 1-, 2-, and 3-year overall survival prediction in the TCGA (F) and ICGC (I) cohorts, confirming the model's strong and stable predictive performance. Collectively, these panels depict the complete process of TEX signature establishment, internal training, and external validation, providing a robust framework for evaluating the prognostic impact of T cell exhaustion–related genes in TNBC.
Correlation analysis showed that all genes in the model were positively associated with the risk score, among which five genes (CLEC2B, TNFRSF25, MS4A6A, AIF1, and CD82) exhibited the most consistent and significant prognostic impact (Figure 3C). To verify the model's stability and reliability, we used TNBC patient data from the TCGA-BRCA series for internal training and TNBC patient data from the ICGC-BRCA series for external validation. Using the same risk formula, risk scores were calculated for each sample in the TCGA training series and the ICGC validation series. Results indicated that TNBC patients with increased risk in both series exhibited survival disadvantages (Figures 3D and 3G). Based on the median risk score, patients were divided into high-risk and low-risk groups. To explore the prognostic differences between the two groups, Kaplan-Meier curve analysis was first performed. The results showed significant prognostic differences between the high-risk and low-risk groups, with patients in the low-risk group having a more significant survival advantage (Figures 3E and 3H). ROC curves were used to predict patient survival times at 1, 2, and 3 years, with the AUCs for the TCGA series being 0.915, 0.922, and 0.838, respectively, and for the ICGC series being 0.675, 0.756, and 0.748 (Figures 3F and 3I). These conclusions were supported by survival analysis and ROC curves (Figures 3D, 3G, 3E, 3H, 3F, and 3I), further confirming the model's predictive effectiveness across different series.
Integration of TEX-Based Risk Score into a Clinical Nomogram
To assess the clinical relevance of the TEX-based risk score and enhance its prognostic applicability, we integrated it with conventional clinicopathological features. Univariate Cox regression analysis in the TCGA-TNBC cohort revealed that T stage, overall stage, and risk score were significantly associated with overall survival (Figure 4A). In multivariate analysis, stage and risk score remained independently significant predictors (Figure 4B), underscoring the independent prognostic value of the TEX model.

Clinical validation and nomogram construction based on the TEX risk model in TNBC. (A) Univariate Cox regression analysis of clinical variables and risk score. (B) Multivariate Cox regression analysis identifying stage and risk score as independent prognostic indicators. (C) Nomogram integrating risk score with clinical features (age, T, N, stage) to predict 1-, 3-, and 5-year overall survival. (D) Calibration curve comparing predicted and actual survival outcomes. (E) Time-dependent ROC analysis comparing the discriminative performance of risk score and individual clinical features. (F) Combined ROC curves showing that the nomogram and TEX risk score have superior AUCs compared to standard clinical variables. (G) Univariate and (H) multivariate Cox analyses of the nomogram. While univariate results were significant, multivariate analysis was not statistically conclusive.
To facilitate individualized patient prediction, we constructed a composite nomogram combining the TEX risk score with age, T stage, N stage, and overall stage to estimate 1-, 3-, and 5-year survival probabilities (Figure 4C). The calibration curve (Figure 4D) demonstrated strong concordance between predicted and observed survival outcomes, particularly at 3 and 5 years, validating the model's predictive reliability.
We further compared the prognostic discrimination of the TEX score and the nomogram against individual clinical parameters. Time-dependent ROC analysis showed that the TEX risk score (AUC = 0.915) outperformed traditional features such as age (AUC = 0.728), T stage (AUC = 0.776), and N stage (AUC = 0.671) (Figure 4E). When evaluated together, the nomogram (AUC = 0.775) and TEX score (AUC = 0.772) showed superior predictive accuracy compared to any single clinical variable (Figure 4F).
In subsequent Cox regression analyses of the nomogram itself, univariate analysis confirmed its significant association with overall survival (p = 0.008; Figure 4G). However, multivariate Cox analysis showed no statistically significant contribution of the nomogram after adjusting for other clinical features (p = 0.104; Figure 4H), likely due to limitations in cohort size or model redundancy. Together, these results support the clinical utility of the TEX-based risk model and demonstrate that its integration into a multivariable nomogram can enhance personalized survival prediction in TNBC patients.
Stratified Survival Analysis of the TEX Signature Across Clinical Subgroups
To further evaluate the clinical utility of the TEX-based risk model, we conducted subgroup survival analyses within the TCGA-TNBC cohort, stratifying patients by established clinicopathological characteristics. Patients were first grouped into high-risk (HR) and low-risk (LR) categories according to the calculated risk score. Within each clinical subgroup, Kaplan–Meier analysis was used to compare overall survival between HR and LR groups.
Subgroup analyses were performed across variables including age (≤65 years vs. >65 years), T stage (T1-2 vs. T3-4), M stage (M0), N stage (N0), pathological stage (I–II vs. III–IV), and gender (female). In most subgroups, a consistent trend emerged in which patients in the low-risk group exhibited better survival outcomes than those in the high-risk group, although statistical significance was not achieved in many comparisons, likely due to limited sample sizes.
For instance, among patients older than 65 years, the low-risk group showed improved survival (Figure 5A), while a similar but non-significant pattern was observed for younger patients (Figure 5B). In the M0 and N0 subgroups, survival advantages were also observed in low-risk patients (Figures 5C and 5I), though without statistical significance. When stratified by T stage, patients with T1–2 and T3–4 disease both showed trends favoring the low-risk group (Figures 5D and 5E). Gender-based analysis also indicated a potential survival benefit for low-risk female patients (Figure 5F, p = 0.059). Similarly, in both early-stage (I–II) and late-stage (III–IV) subgroups, low-risk patients tended to have better outcomes (Figures 5G and 5H).

Stratified survival analysis based on the TEX risk score across clinical subgroups in TNBC. Kaplan–Meier curves compare overall survival between high-risk and low-risk patients within defined clinical subgroups. (A–B) Patients aged >65 and ≤65 years. (C) M0 subgroup. (D–E) Patients with T1–2 and T3–4 stage tumors. (F) Female patients. (G–H) Patients with pathological stage I–II and III–IV. (I) Patients with N0 status. In most subgroups, low-risk patients exhibited longer survival than their high-risk counterparts, although statistical significance was not reached in these analyses.
Although p-values in these subgroup analyses were generally above the threshold for statistical significance, the consistency of survival trends across clinical subgroups reinforces the broad applicability and prognostic relevance of the TEX-based risk model in TNBC.
Distribution of TEX Risk Score Across Clinical Subtypes in TNBC
To investigate how the TEX risk model stratifies patients across clinical backgrounds, we analyzed the distribution of TEX-related gene expression and risk scores in high-risk (HR) and low-risk (LR) groups, with respect to key clinical characteristics.
A heatmap was generated to visualize the expression patterns of the 11 TEX-related genes across patients, aligned with clinical annotations including T stage, N stage, overall stage, age, and gender (Figure 6A). Notably, distinct expression patterns were observed between HR and LR groups, particularly for genes such as TNFRSF25, CD82, and MS4A6A, which showed higher expression levels in the HR group.
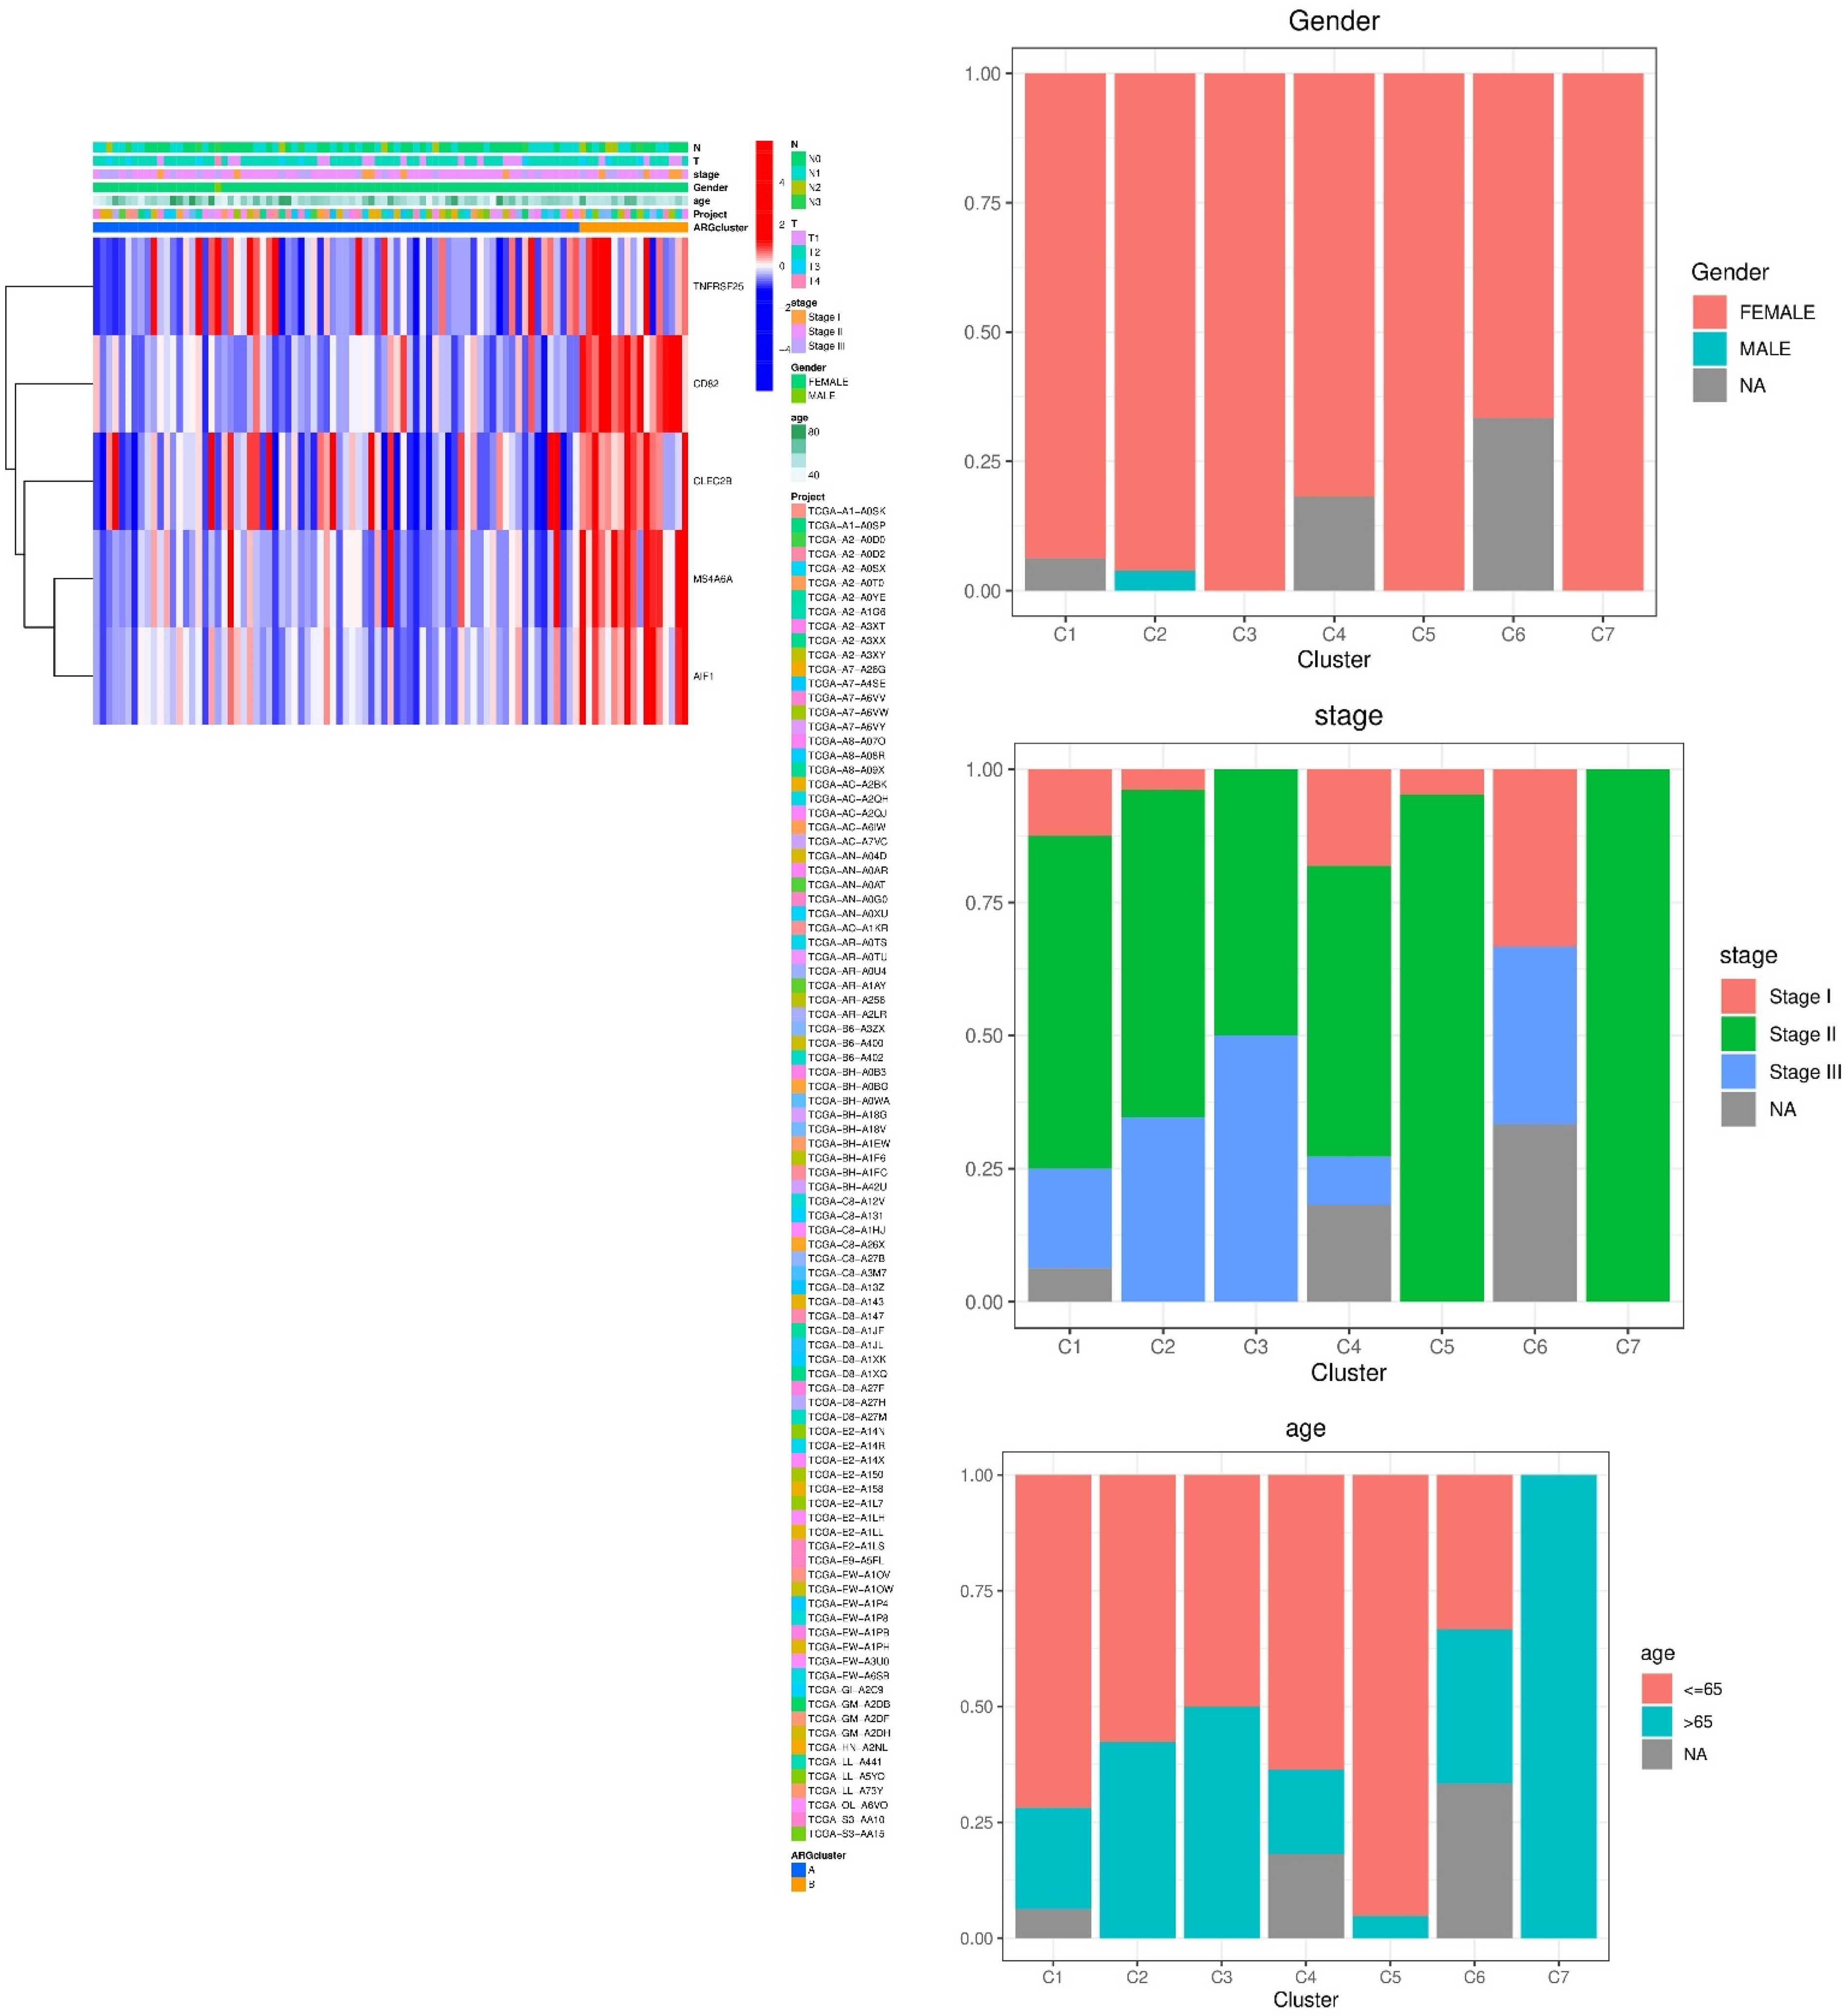
Distribution and clinical correlation of TEX risk features in TNBC. (A) Heatmap of the 11 TEX genes and associated clinicopathological annotations in HR and LR groups. (B–F) Proportional distribution of gender, stage, age, T stage, and N stage across patient clusters. (G–K) Expression analysis of the TEX gene CLEC2B in different clinical subgroups, including age (G), gender (H), N stage (I), overall stage (J), and T stage (K). Significant associations were observed between CLEC2B expression and N/T stage severity.
We then examined the proportional distribution of clinical subtypes within different risk clusters. As shown in Figures 6B–F, a greater proportion of high-risk patients were older (≥65 years), had higher T stages (e.g., T2–T4), and tended to fall into more advanced pathological stages. These trends suggest an association between risk group assignment and adverse clinical features.
To quantitatively assess this relationship, we compared the expression of individual TEX genes, particularly CLEC2B, a representative marker, with respect to clinical subgroups. CLEC2B expression showed no significant difference between age groups or between male and female patients (Figures 6G and 6H). However, CLEC2B expression was significantly elevated in patients with N2 and N3 lymph node involvement (p < 0.05; Figure 6I), as well as those with T3-T4 primary tumors (Figure 6K). A non-significant upward trend in CLEC2B expression was also noted across stages I to III (Figure 6J).
Altogether, these findings suggest that the TEX-based risk score reflects underlying clinical pathology. Higher scores were associated with features of more aggressive disease, further supporting the prognostic and biological relevance of the TEX gene signature in TNBC.
Functional Enrichment Analysis of TEX-Associated Genes
To explore the biological implications of TEX-related genes, we conducted Gene Ontology (GO) and KEGG enrichment analyses using differentially expressed genes between the high-risk (HR) and low-risk (LR) groups.
GO enrichment revealed that TEX-associated genes were significantly involved in biological processes such as integrin-mediated cell adhesion, extracellular structure organization, and multicellular organism reproduction. These findings highlight the relevance of TEX features in modulating cell–cell and cell–matrix interactions during tumor progression. In terms of cellular components, enrichment was observed in serine-type peptidase complexes and adhesion-related protein complexes. Molecular function terms included calcium-dependent protein binding, serine-type endopeptidase activity, and monosaccharide binding—functions often linked to extracellular signaling and immune remodeling (Figure 7A).

Functional enrichment of TEX-related genes in TNBC. (A) GO enrichment analysis across biological processes, cellular components, and molecular functions. Enriched terms highlight immune regulation, adhesion, and protease activity. (B) Circular KEGG enrichment map comparing HR and LR groups. LR-associated genes were enriched in metabolic and signaling pathways, while HR-associated genes were linked to transcription, degradation, and immune disruption.
KEGG pathway analysis further emphasized the immunological and structural roles of TEX genes. Significantly enriched pathways included ECM–receptor interaction, IL-17 signaling, HIF-1 signaling, and leukocyte transendothelial migration, all of which are relevant to immune infiltration, hypoxia response, and tissue remodeling within the tumor microenvironment.
To investigate functional divergence between patient risk groups, we performed comparative enrichment analysis. TEX-related genes from the LR group were preferentially enriched in metabolism-related pathways, including peroxisome function, PPAR signaling, and cytochrome P450 drug metabolism. Conversely, genes from the HR group showed upregulation in pathways associated with proliferation and immune dysregulation, such as RNA polymerase activity, ubiquitin-mediated proteolysis, lysosomal processing, and infectious disease-related responses (e.g., Vibrio cholerae infection; Figure 7B).
These functional insights reinforce the biological significance of TEX in TNBC. The results suggest that low-risk patients may exhibit more stable and metabolically regulated immune environments, while high-risk patients show signs of immune stress, degradation activity, and aberrant transcriptional regulation.
Tumor Mutation Burden (TMB) and Its Association with TEX Risk and Survival
Given the established role of genomic instability in cancer progression and immune evasion, we analyzed somatic mutation patterns and tumor mutation burden (TMB) in TNBC patients stratified by TEX-based risk score. Using mutation data from the TCGA-BRCA cohort, we visualized mutation frequencies in high-risk (HR) and low-risk (LR) groups.
In the HR group, the most frequently mutated genes were TP53 (82%), TTN (15%), and SPTA1 (13%), while in the LR group, the top mutated genes were TP53 (69%), TTN (24%), and MUC16 (18%) (Figures 8A and 8B). These findings suggest a difference in mutational spectra between risk groups, with TP53 mutations highly prevalent across both.
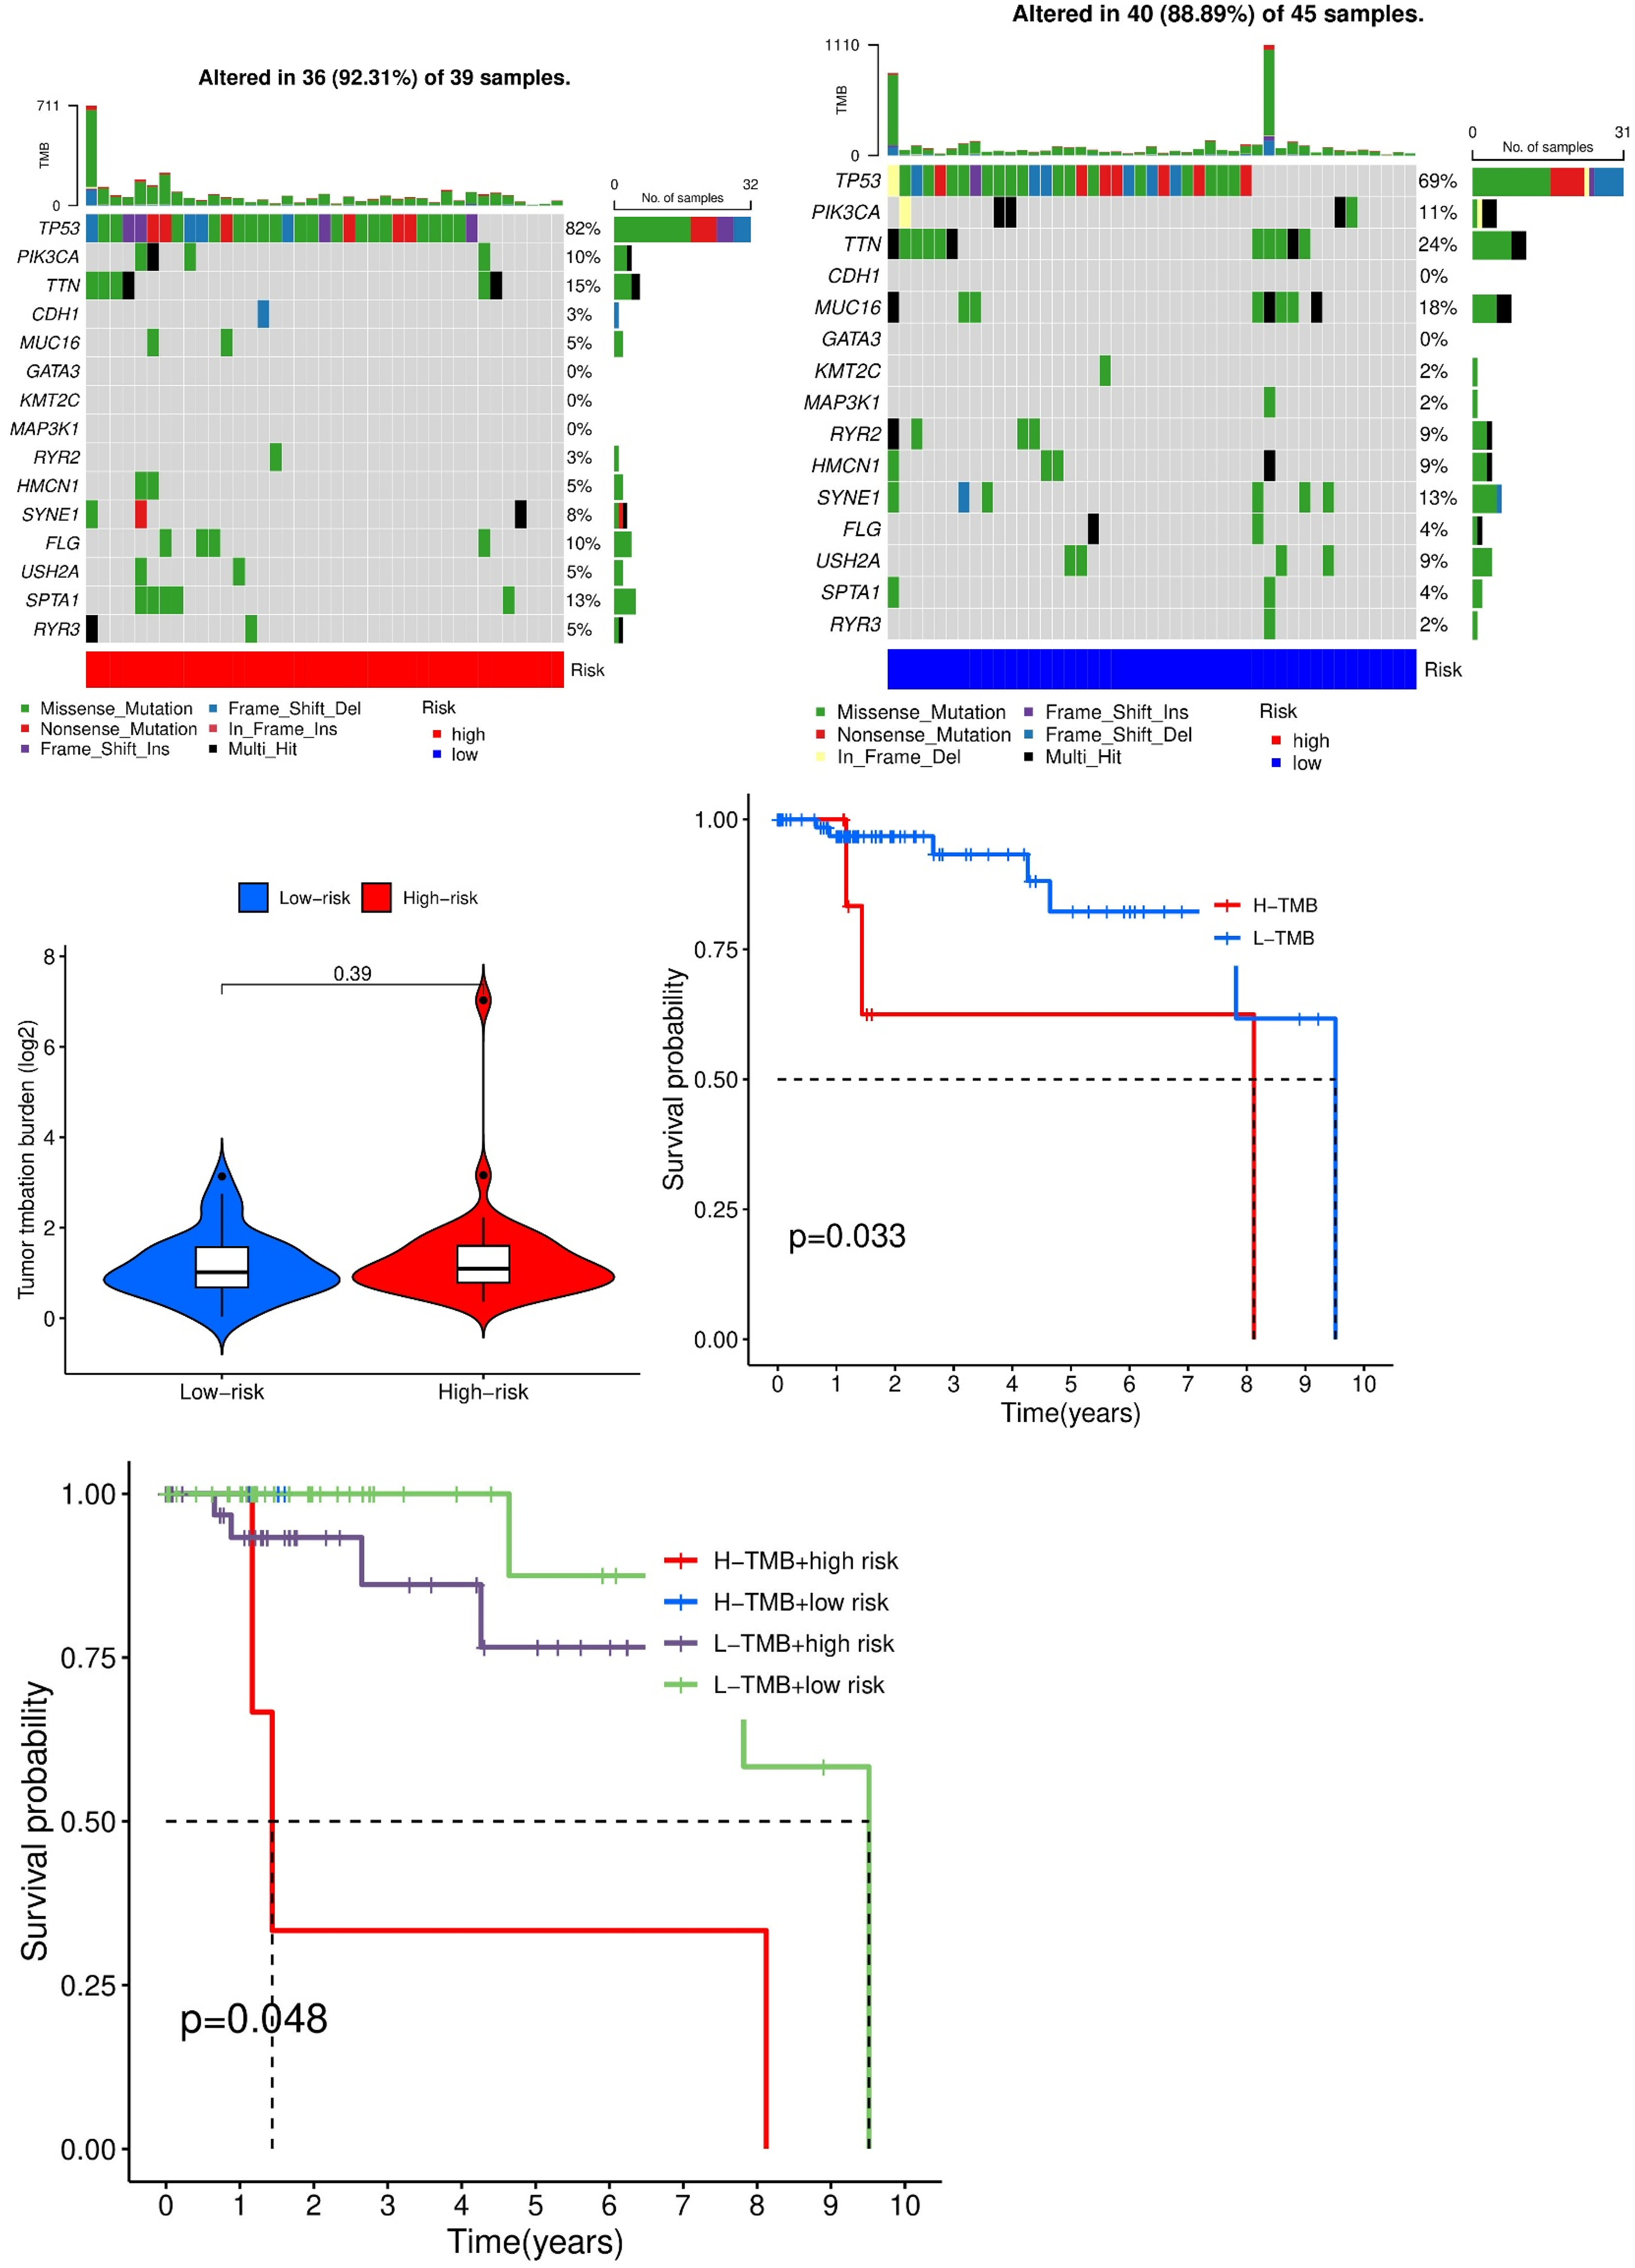
Somatic mutation profiling and survival analysis based on tumor mutation burden (TMB) and TEX risk score in TNBC. (A, B) Waterfall plots showing somatic mutation distributions in the high-risk and low-risk groups. TP53 is the most frequently mutated gene in both groups. (C) Violin plot comparing TMB between HR and LR groups (p = 0.39, not significant). (D) Kaplan–Meier survival curve comparing high-TMB and low-TMB patients. Low-TMB patients show significantly better survival (p = 0.033). (E) Combined survival analysis of four patient subgroups stratified by both TMB and TEX risk score. Patients in the low-TMB/low-risk group exhibit the most favorable prognosis (p = 0.048).
We then assessed TMB values across risk groups. While the HR group exhibited a slightly elevated TMB on average, the difference between groups was not statistically significant (p = 0.39; Figure 8C). However, when patients were stratified by TMB alone, Kaplan–Meier analysis revealed a significant survival advantage in the low-TMB group (p = 0.033; Figure 8D), supporting the notion that TMB level is independently associated with prognosis in TNBC.
To further refine risk stratification, we conducted a combined analysis incorporating both TMB and TEX risk score. Patients were divided into four subgroups: high-TMB/high-risk, high-TMB/low-risk, low-TMB/high-risk, and low-TMB/low-risk. Survival analysis demonstrated that patients in the low-TMB/low-risk group had the most favorable prognosis, while those in the high-TMB/high-risk group had the worst outcomes (p = 0.048; Figure 8E). These results emphasize the potential value of jointly considering genomic burden and transcriptional exhaustion markers in predicting patient outcomes and guiding treatment decisions.
Association Between TEX Risk Score, Tumor Microenvironment, and Immune Infiltration
To investigate the immunological relevance of the TEX-based risk model, we examined the relationship between risk score and tumor microenvironment (TME) features using multiple immune deconvolution algorithms. These included XCELL, TIMER, QUANTISEQ, MCPCOUNTER, EPIC, CIBERSORT-ABS, and CIBERSORT. Across all platforms, a consistent correlation was observed between the TEX risk score and infiltration levels of various immune cell types, suggesting that the risk model captures key aspects of immune dynamics in TNBC (Figure 9A).
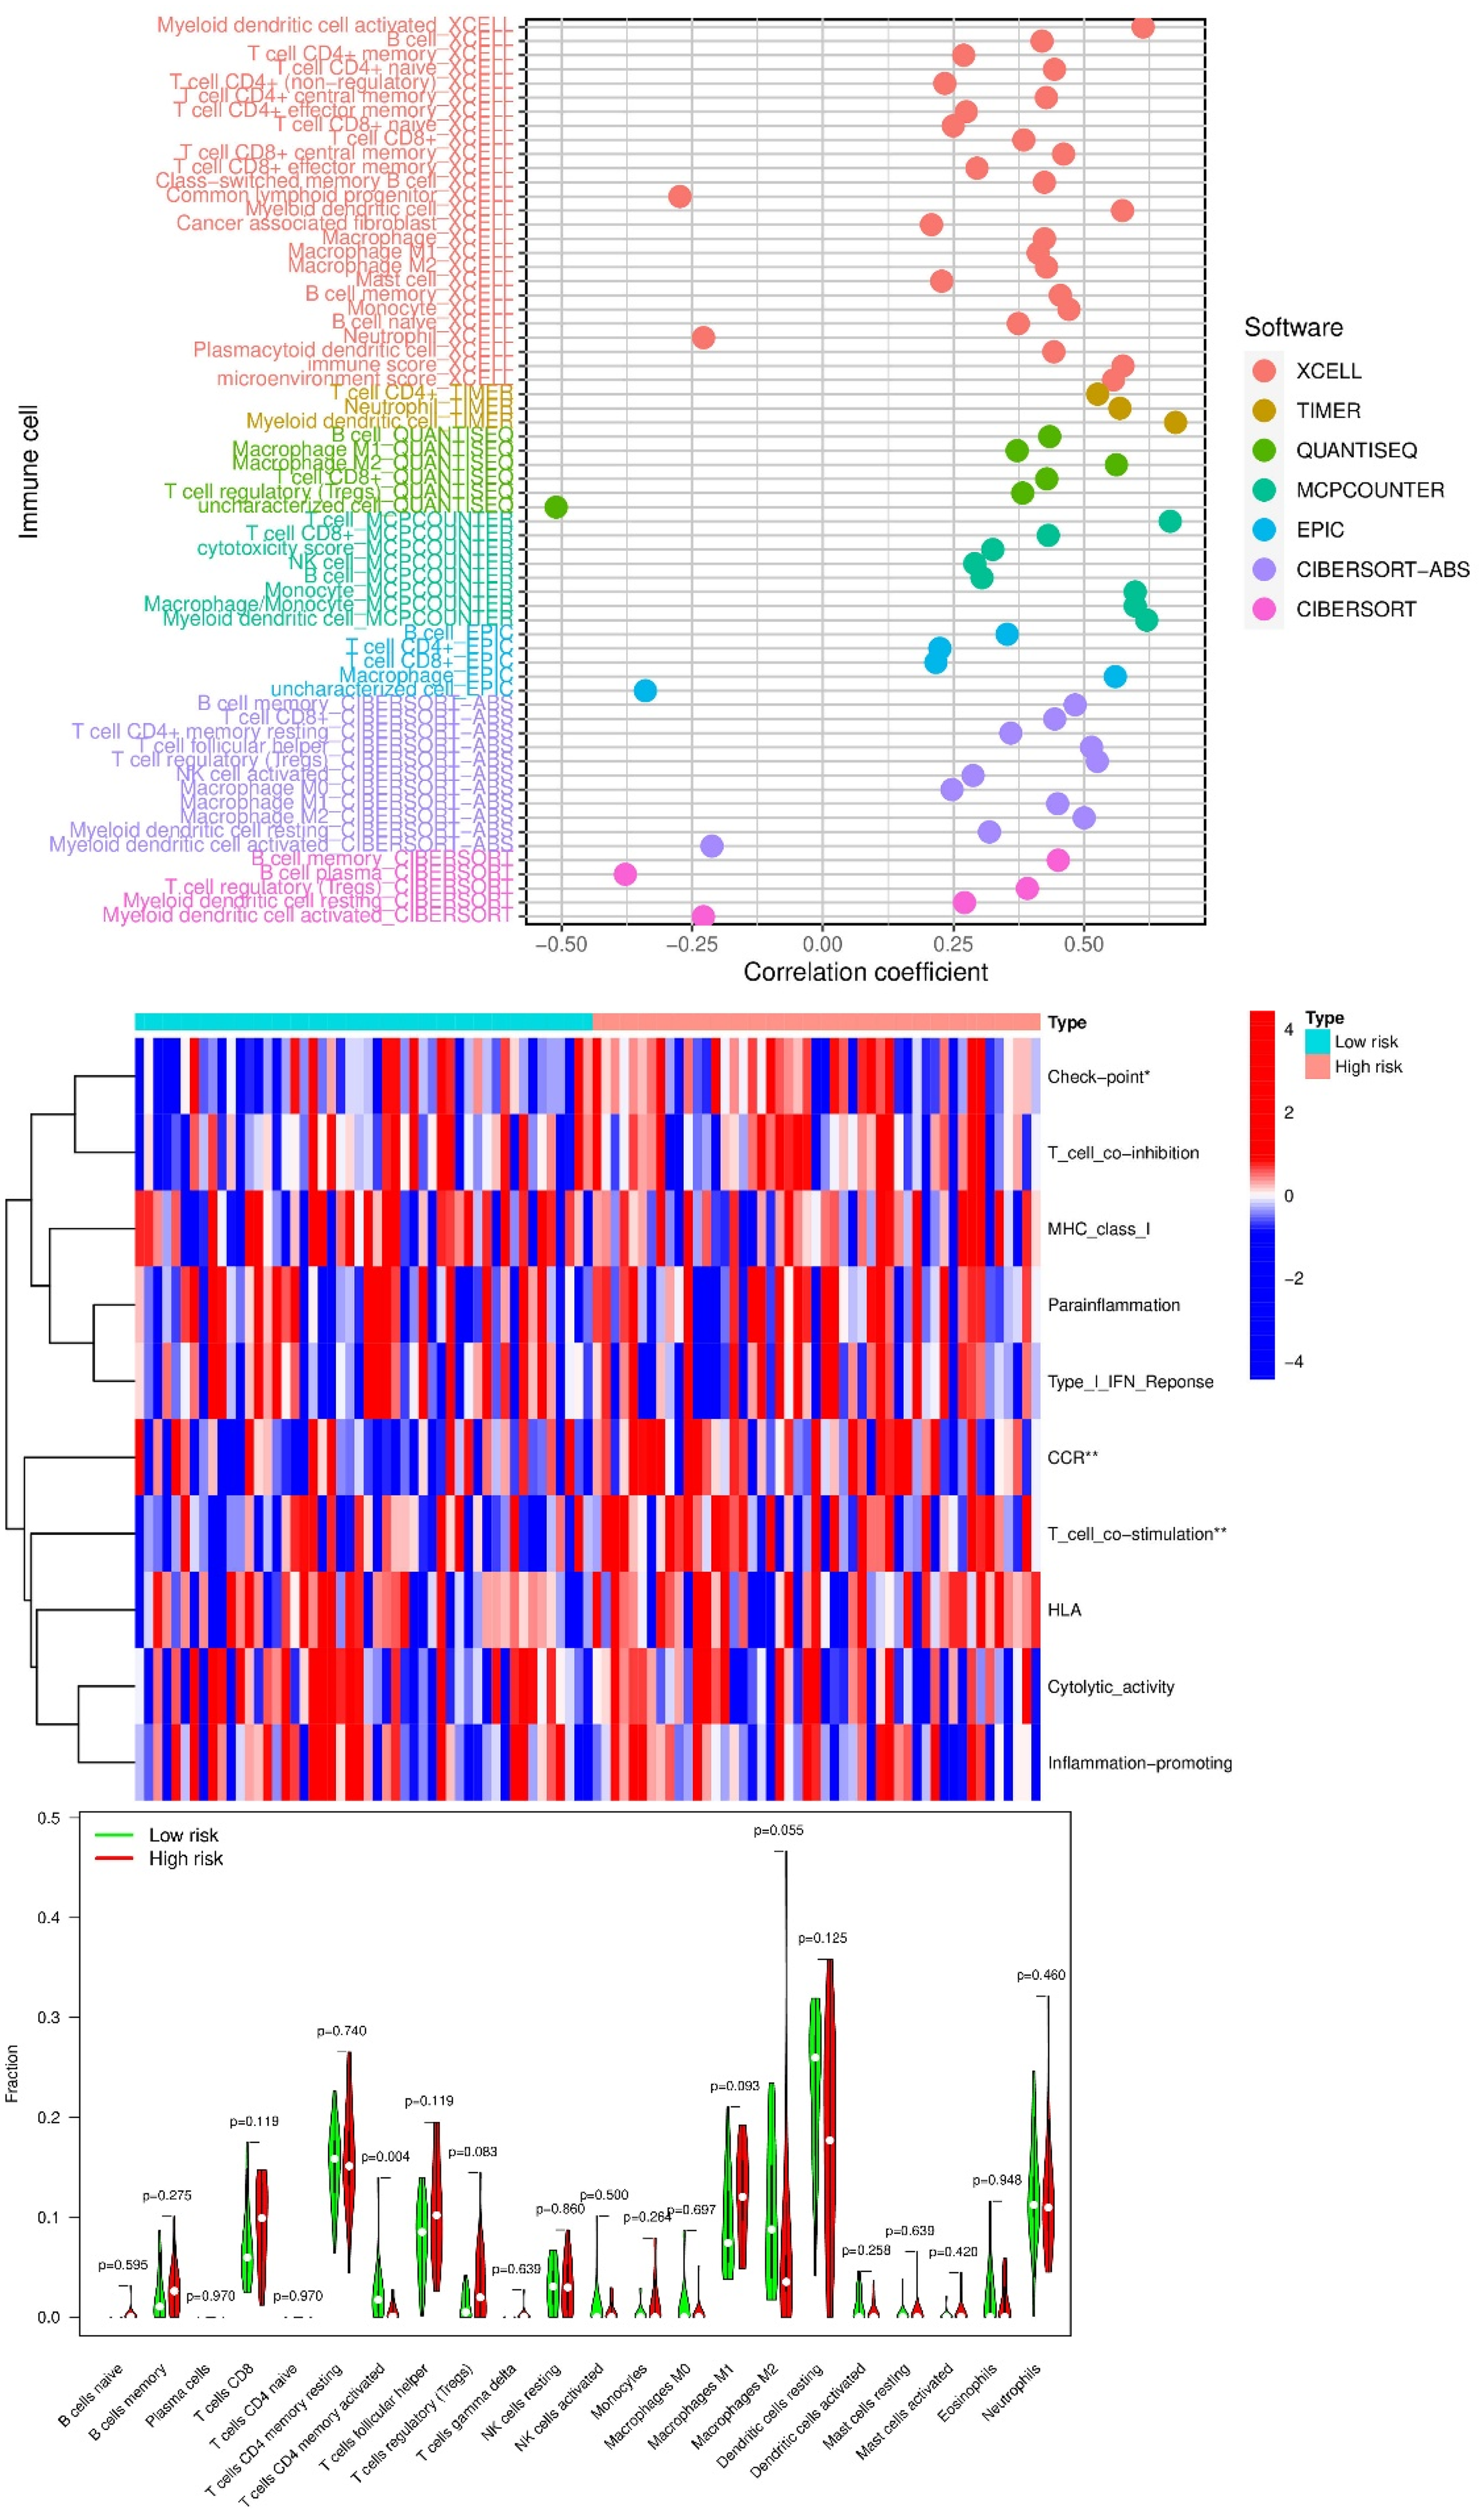
Association between the TEX risk score and tumor immune microenvironment features in TNBC. (A) Correlation between the TEX risk score and immune cell types across seven immune deconvolution algorithms. (B) Heatmap of immune cell proportions across patients ranked by risk score. (C) Boxplots comparing major immune cell types between high-risk and low-risk groups. (D) Differential expression of immune checkpoint genes across risk groups. Most were significantly elevated in the high-risk group. (E) Violin plots showing stromal score, immune score, and ESTIMATE score in low- vs high-risk groups. High-risk patients exhibited higher infiltration levels and reduced tumor purity. *P < 0.05; **P < 0.01; ***P < 0.001.
Using the CIBERSORT algorithm, we visualized immune cell proportions across patients ranked by increasing risk score. The heatmap revealed distinct immune infiltration patterns, with notable enrichment of activated immune cell subsets in high-risk individuals (Figure 9B). In particular, high-risk patients exhibited elevated proportions of T cells and macrophages compared to the low-risk group (Figure 9C), underscoring a potential association between TEX and inflammatory immune responses within the tumor microenvironment.
We next assessed immune checkpoint gene expression in relation to TEX risk classification. Among the 18 immune checkpoint-related genes analyzed, only VTCN1 was significantly upregulated in the low-risk group. In contrast, most other checkpoint genes—including TNFRSF4, TNFSF18, HAVCR2 (TIM-3), CD276 (B7-H3), NRP1, and CD86—were markedly elevated in high-risk patients (Figure 9D). These differences suggest that the immune landscape of high-risk tumors may be more immunosuppressive or exhausted, potentially influencing responsiveness to immune checkpoint blockade therapy.
Finally, we used the ESTIMATE algorithm to quantify stromal and immune cell infiltration and estimate tumor purity. Both stromal and immune scores were higher in high-risk patients, and accordingly, the composite ESTIMATE score was elevated as well (Figure 9E). These results indicate greater non-tumor cellular content in high-risk tumors and further support the view that the TEX score reflects broader TME complexity and immune remodeling.
Together, these findings provide functional context for the TEX risk score, linking it to immune composition, checkpoint expression, and stromal dynamics in TNBC tumors. The model not only serves as a prognostic tool but also offers mechanistic insight into the tumor-immune interface.
Risk Score Predicts Chemotherapeutic Drug Sensitivity
To further explore the translational utility of the TEX-based risk model in therapeutic decision-making, we analyzed its predictive value for chemotherapy response using drug sensitivity profiling. Specifically, the half-maximal inhibitory concentration (IC50) values of nine FDA-approved drugs or small-molecule inhibitors were compared between the high-risk and low-risk groups.
Patients classified as high-risk exhibited significantly increased sensitivity—reflected by lower IC50 values—to Entospletinib, Sapitinib, OTX015, Tozasertib, NU7441 (a DNA-PK inhibitor), Ribociclib, and RO-3306 (a CDK inhibitor) (Figures 10A–G). These findings suggest that tumors in the high-risk group may be more vulnerable to agents targeting kinases or transcriptional regulators, potentially due to elevated proliferative or immune exhaustion states associated with TEX features.
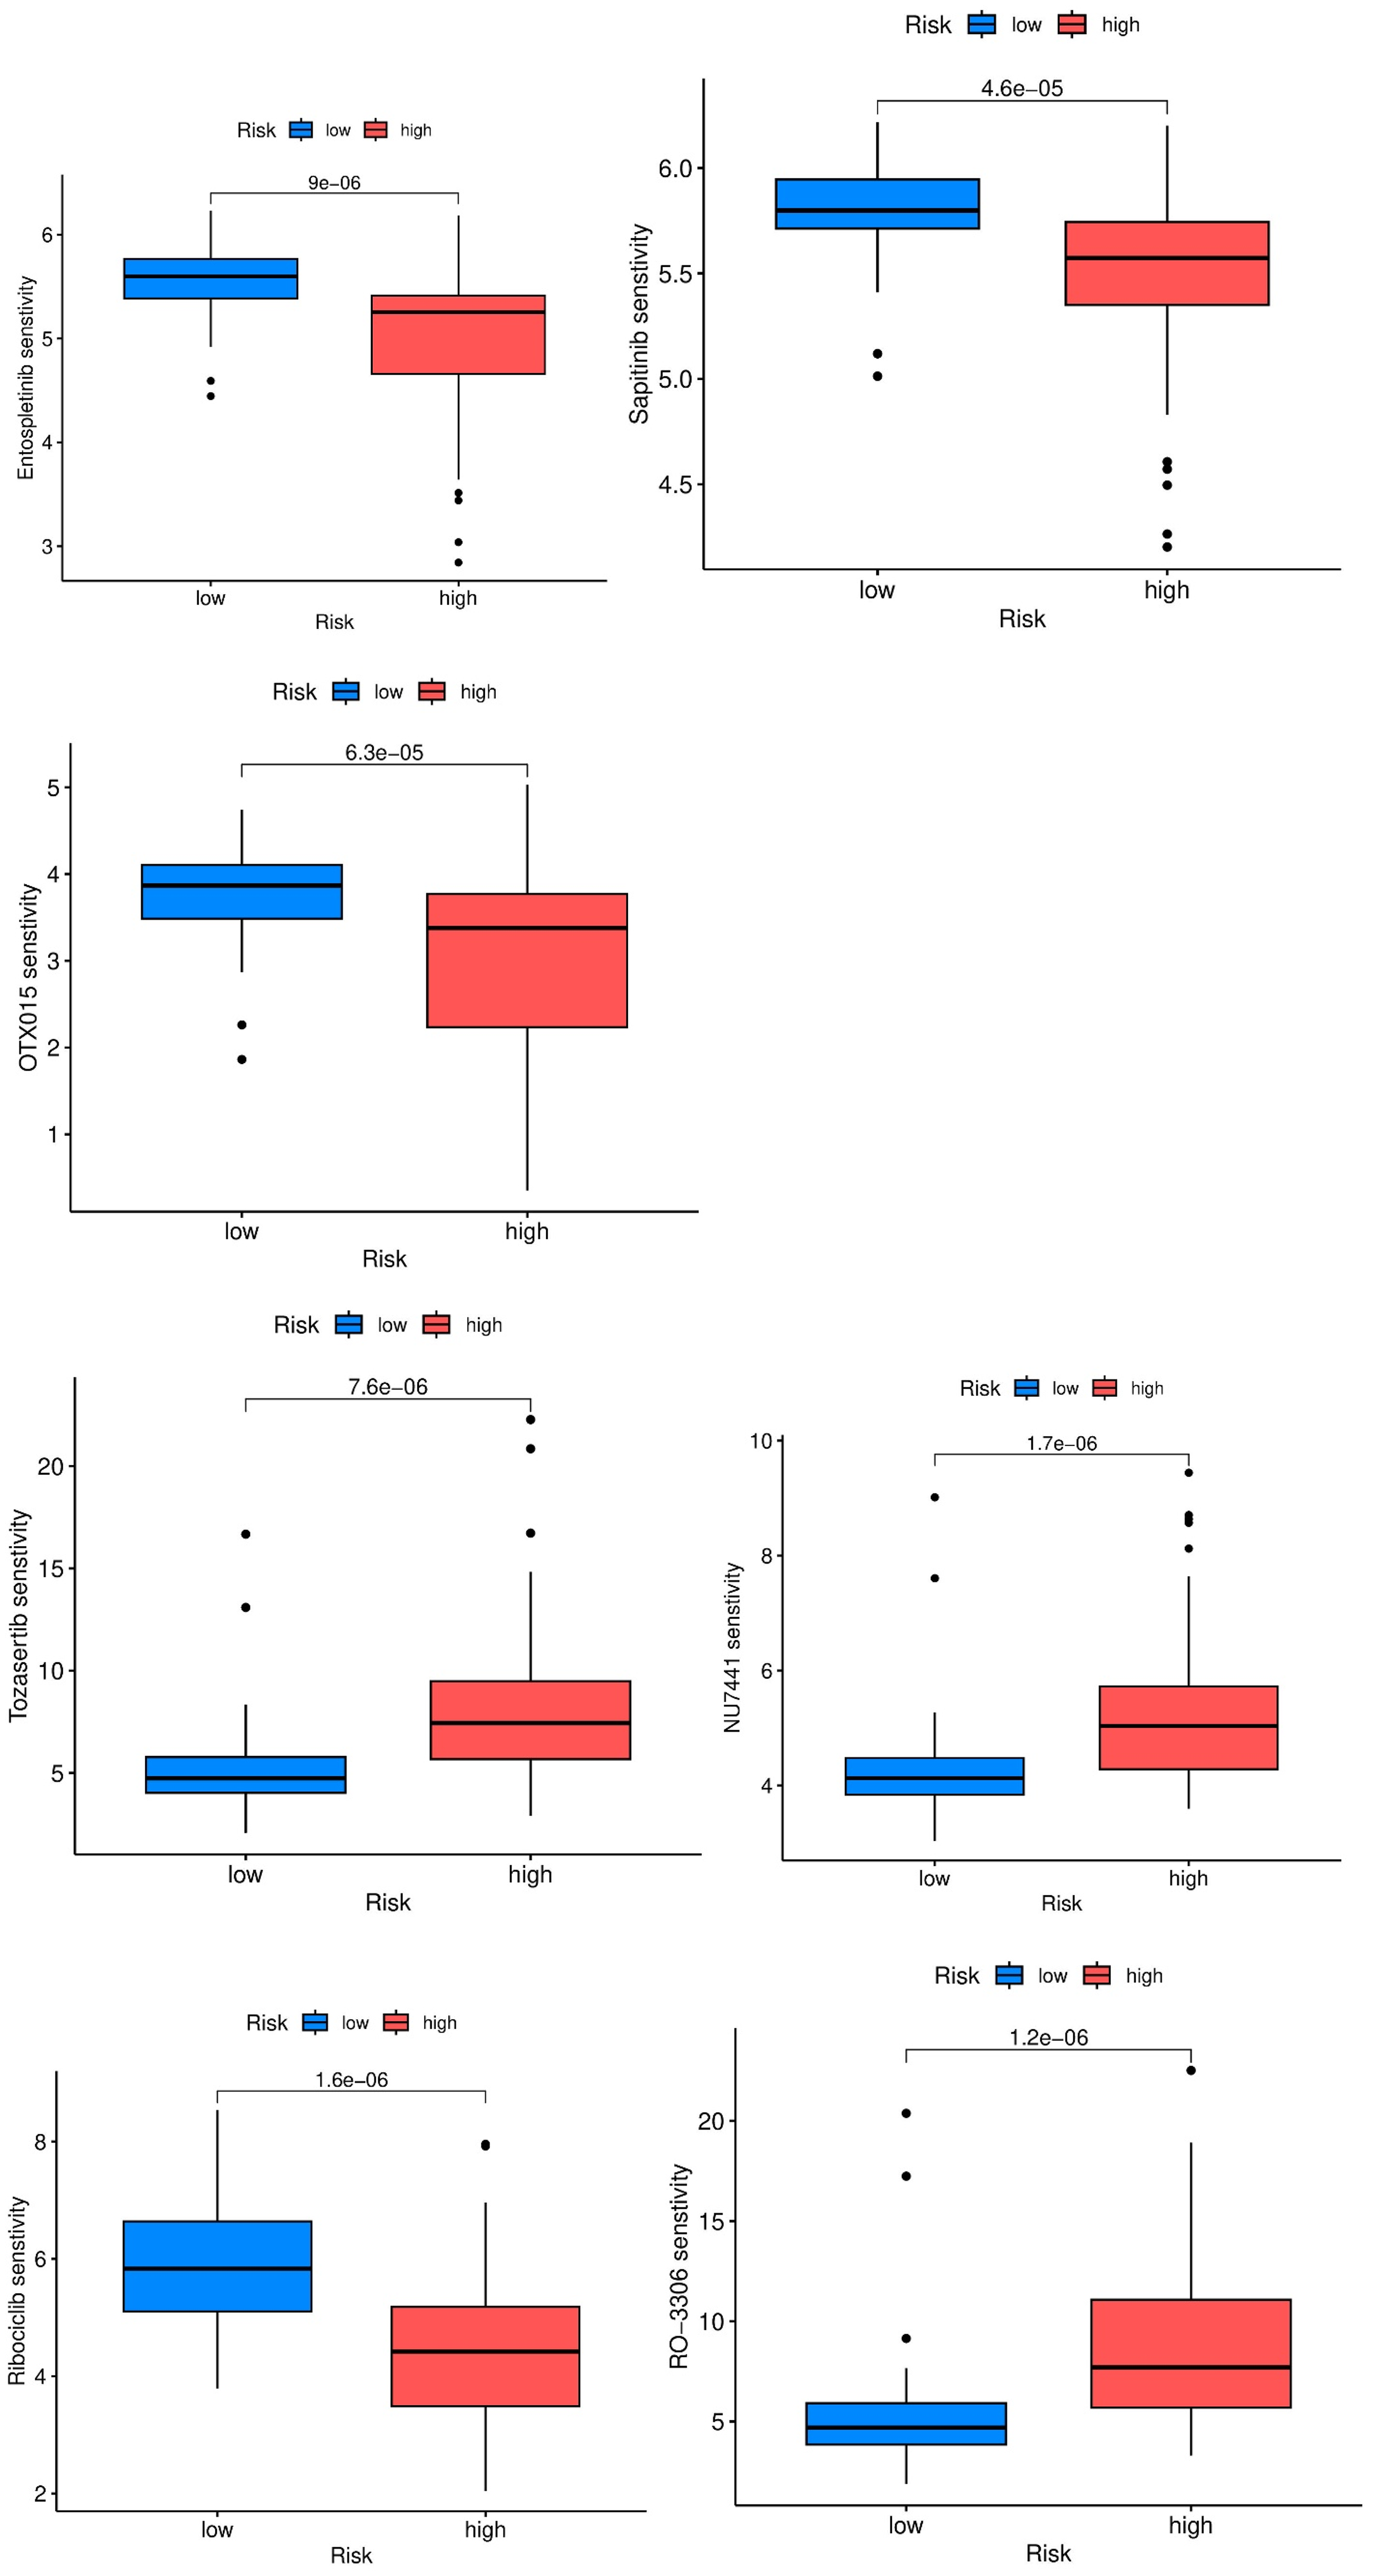
Association between TEX risk score and predicted drug sensitivity in TNBC patients. Boxplots depict estimated IC50 values in low-risk (blue) and high-risk (red) groups for: (A) Entospletinib, (B) Sapitinib, (C) OTX015, (D) Tozasertib, (E) NU7441, (F) Ribociclib, and (G) RO-3306. Lower IC50 values indicate higher drug sensitivity. Risk score classification effectively stratifies patient responses across multiple therapeutic agents. *P-values are indicated above each comparison; all shown differences are statistically significant.
In contrast, patients in the low-risk group showed greater sensitivity to 5-Fluorouracil, Afatinib, and Docetaxel (not shown), indicating differential therapeutic vulnerabilities between the two risk groups. These observations imply that TEX-related molecular signatures can serve not only as prognostic indicators but also as valuable tools for guiding personalized treatment strategies in TNBC, especially in the selection of cytotoxic agents and targeted therapies.
Discussion
TNBC is an aggressive and clinically challenging subtype of breast cancer, characterized by the absence of estrogen receptors (ER), progesterone receptors (PR), and HER2 overexpression. Owing to its molecular features, TNBC lacks effective targeted therapies and is associated with poor prognosis and high recurrence rates. These clinical limitations underscore the pressing need for novel prognostic tools and therapeutic strategies that can better inform treatment decisions and improve patient outcomes.
In this study, we focused on the tumor-exhausted T cell (TEX) phenotype—an emerging hallmark of dysfunctional anti-tumor immunity within the tumor microenvironment (TME). By integrating single-cell and bulk transcriptomic analyses, we revealed that TEX-related gene expression signatures are significantly associated with clinical prognosis in TNBC. Our results support the idea that T cell exhaustion, previously well-described in chronic viral infections and other cancers, plays a critical role in modulating immune responses in TNBC and may serve as a valuable prognostic indicator.
We identified a core set of 154 TEX-related candidate genes through differential expression and co-expression network analyses, from which five genes (CLEC2B, TNFRSF25, MS4A6A, AIF1, and CD82) were significantly associated with patient outcomes. These genes represent key players in immune modulation. For example, CLEC2B is involved in T cell activation and immune signaling; TNFRSF25 contributes to T cell proliferation and survival; and MS4A6A has been implicated in immune regulation. AIF1, a macrophage activation marker, and CD82, involved in cell adhesion and metastasis, further highlight the interplay between immune dysfunction and tumor progression. The prognostic model developed from these TEX-related genes effectively stratified patients into high- and low-risk groups and demonstrated strong predictive power in both internal and external validation cohorts. This model offers a promising framework for clinical risk assessment and individualized patient management.30–32
Functional enrichment analyses of TEX-related genes uncovered significant involvement in biological processes related to immune cell adhesion, signaling, and extracellular matrix remodeling. Particularly, integrin-mediated adhesion pathways and immune regulation mechanisms such as IL-17 and HIF-1 signaling were enriched, reflecting the intricate cross-talk between tumor and immune cells in shaping disease progression.33–36 These findings suggest that T cell exhaustion is not an isolated dysfunction but part of a broader immunological and stromal remodeling process within the TME. As such, therapies aimed at reversing TEX, especially those targeting inhibitory checkpoint receptors or metabolic stress, may have the dual benefit of reinvigorating immune responses while disrupting tumor-supportive niches.
In our immune cell infiltration analysis, high-risk patients exhibited elevated infiltration of T cells and macrophages alongside higher expression of immune checkpoint molecules such as TNFRSF4, HAVCR2, CD276, and CD86. This immunosuppressive profile may contribute to immune escape and resistance to therapy. More specifically, in our high-risk group, the upregulation of TNFRSF4 (OX40), HAVCR2 (TIM-3), and CD276 (B7-H3) consistent with an immunosuppressive tumor microenvironment. OX40, while capable of enhancing effector T-cell survival, is also expressed on Tregs (regulatory T cells), where its activation may reinforce suppression if not selectively targeted, thus complicating its therapeutic exploitation. Recent multi-omics and translational studies link high OX40/OX40L axis activity with tumor progression and variable survival, and show context-dependent synergy with PD-1 blockade when OX40 agonism drives stem-like CD8+ cells toward functional rescue while limiting Treg support.37–40 TIM-3 is a canonical exhaustion receptor whose engagement (e.g., by galectin-9 or CEACAM1) reinforces dysfunctional CD8+ states and is linked to resistance to PD-1 blockade. Mechanistic work shows that TIM-3 surface stability is enhanced by DHHC9-mediated palmitoylation, intensifying exhaustion; clinically, high TIM-3 correlates with poor outcomes and resistance to anti-PD-1 that can be partially overcome by dual blockade (anti-TIM-3 + anti-PD-1/IL-2 pathway support). These findings align with our observation that TIM-3 is elevated in high-risk cases and suggest a role in sustaining dysfunctional CD8+ states and attenuating response to ICB.41–44 CD276, broadly expressed on tumor and stromal cells, not only inhibits T-cell activation but also promotes tumor invasion and therapy resistance. 45 Collectively, the enrichment of these checkpoints in high-risk TNBC suggests that TEX-related prognosis is shaped by both T-cell intrinsic exhaustion and tumor-intrinsic immune evasion, highlighting the rationale for rational combination therapies targeting PD-1, TIM-3, OX40, or B7-H3. Conversely, VTCN1 was upregulated in low-risk patients, potentially serving as a marker of preserved immune surveillance. These results provide a mechanistic explanation for why high TEX scores are associated with worse survival and suggest that checkpoint blockade strategies may be more effective when tailored to TEX profiles.46–48 In addition, our single-cell communication analysis highlighted the CD137 (TNFRSF9) signaling axis as a key node of intercellular interaction in TNBC. While this observation suggests a potential role in shaping T-cell activation and exhaustion dynamics, our current study does not provide direct functional validation. Therefore, these results should be interpreted cautiously, and future experiments, such as blocking or agonizing CD137 in co-culture models of TNBC T cells, or validating pathway activity in independent cohorts, will be required to establish the causal contribution of this pathway to TEX progression.
Our single-cell RNA sequencing data further illuminated the immune complexity of TNBC. We identified 12,477 high-quality cells distributed across seven subpopulations, including epithelial cells, fibroblasts, macrophages, monocytes, and T cells. This detailed cellular atlas supports the notion that the immune landscape of TNBC is heterogenous and tightly linked to prognosis and therapeutic response. The enrichment of T cells and myeloid populations in high-risk patients highlights the potential of leveraging these populations in future immunotherapy designs.49,50
Moreover, integration of the TEX risk score with tumor mutation burden (TMB) analysis revealed that low-TMB/low-risk patients exhibited the most favorable survival, while high-TMB/high-risk patients had the worst prognosis. This combined stratification strategy strengthens the clinical utility of our model and supports a multiparametric approach to immunotherapy prediction. Drug sensitivity analysis further revealed that high-risk patients may be more responsive to kinase inhibitors (e.g., Entospletinib, Tozasertib, NU7441), whereas low-risk patients showed higher sensitivity to chemotherapeutics such as 5-fluorouracil and docetaxel.
Beyond prognosis, the TEX risk model may have translational utility, as breast cancer prognosis and immunotherapy response could been predicted through specialized immune-associated gene signatures.51,52 First, because high-risk tumors in our cohort co-express multiple checkpoints, the model could act as a companion biomarker to prioritize patients for PD-1/PD-L1–based combinations (e.g., adding TIM-3 blockade, which has mechanistic and early clinical support for overcoming PD-1 resistance; phase I/II and preclinical data support co-blockade). 53 Second, CD276 (B7-H3) enrichment in high-risk cases suggests eligibility for B7-H3–targeted therapies; multiple ADCs and antibodies show activity and acceptable tolerability in solid tumors, supporting risk-guided trial referral. 54 Third, models akin to ours have already been used to stratify drug benefit in TNBC: for immunotherapy, the 27-gene DetermaIO signature prospectively predicted response to atezolizumab + chemotherapy; for targeted/chemo options, a gene-expression HRD classifier identified TNBCs more likely to benefit from PARP inhibitors/platinum, illustrating how transcriptomic risk tools can inform regimen choice. 55 Collectively, these data support evaluating the TEX score as a decision aid—to (i) enrich for ICI-combination strategies in high-risk disease and (ii) guide selection between cytotoxic and targeted agents when paired with complementary signatures.
Taken together, our findings establish the TEX signature as a powerful prognostic tool and mechanistic lens for understanding immune dysfunction in TNBC. By dissecting the immunogenomic landscape of exhaustion, we provide a foundation for future studies aimed at restoring anti-tumor immunity and guiding individualized treatment strategies.
Conclusion
In summary, this study highlights the clinical and biological relevance of T cell exhaustion in triple-negative breast cancer. Using single-cell and bulk transcriptomic data, we constructed a TEX-related prognostic model that robustly stratifies patients by survival risk and correlates with immune cell infiltration, immune checkpoint expression, mutation burden, and treatment sensitivity. The integration of these TEX features into clinical models and nomograms significantly enhances prognostic accuracy and may inform personalized immunotherapy approaches. Nonetheless, we acknowledge the limitations of this study, including the relatively small sample size, potential batch effects, and the need for functional validation in independent cohorts. Future studies integrating multi-omics and prospective clinical data will be critical for translating these findings into clinical practice. Ultimately, our work contributes to a growing body of evidence that underscores the importance of immune contexture, particularly T cell exhaustion, in shaping TNBC progression and therapy response.56,57
Limitations
Several limitations of this study should be acknowledged. First, the analyses were conducted on a relatively small number of TNBC samples, which may limit statistical power and generalizability of the findings. Second, heterogeneity across the integrated datasets (scRNA-seq, TCGA, ICGC, and immunotherapy cohorts) could introduce batch effects and biological variability, even though standardized preprocessing and normalization methods were applied to minimize such biases. Third, while we identified TEX-related signatures with prognostic and potential therapeutic relevance, our conclusions are based solely on computational and retrospective analyses; direct functional validation in vitro and in vivo will be essential to confirm the mechanistic roles of the candidate genes and to translate the risk model into clinical application. Despite these constraints, our study provides an important foundation for understanding T cell exhaustion in TNBC and offers a framework for future experimental and clinical validation.
Supplemental Material
sj-tiff-1-tct-10.1177_15330338251401265 - Supplemental material for Immunological and Prognostic Profiling of Triple-Negative Breast Cancer Based on Single-Cell and Bulk RNA Sequencing of T-Cell Exhaustion
Supplemental material, sj-tiff-1-tct-10.1177_15330338251401265 for Immunological and Prognostic Profiling of Triple-Negative Breast Cancer Based on Single-Cell and Bulk RNA Sequencing of T-Cell Exhaustion by Han Xiao, Qingling Mo, Li Wang, Xiaoling Leng and Guofu Huang in Technology in Cancer Research & Treatment
Supplemental Material
sj-xls-2-tct-10.1177_15330338251401265 - Supplemental material for Immunological and Prognostic Profiling of Triple-Negative Breast Cancer Based on Single-Cell and Bulk RNA Sequencing of T-Cell Exhaustion
Supplemental material, sj-xls-2-tct-10.1177_15330338251401265 for Immunological and Prognostic Profiling of Triple-Negative Breast Cancer Based on Single-Cell and Bulk RNA Sequencing of T-Cell Exhaustion by Han Xiao, Qingling Mo, Li Wang, Xiaoling Leng and Guofu Huang in Technology in Cancer Research & Treatment
Supplemental Material
sj-xls-3-tct-10.1177_15330338251401265 - Supplemental material for Immunological and Prognostic Profiling of Triple-Negative Breast Cancer Based on Single-Cell and Bulk RNA Sequencing of T-Cell Exhaustion
Supplemental material, sj-xls-3-tct-10.1177_15330338251401265 for Immunological and Prognostic Profiling of Triple-Negative Breast Cancer Based on Single-Cell and Bulk RNA Sequencing of T-Cell Exhaustion by Han Xiao, Qingling Mo, Li Wang, Xiaoling Leng and Guofu Huang in Technology in Cancer Research & Treatment
Footnotes
Acknowledgements
Thanks to all the authors for their contributions to this study, especially to HGF for his guidance and assistance.
Ethics and Patient Consent Statement
This study used publicly available data that do not include any patient-identifiable information; therefore, ethical committee approval and informed consent were not applicable.
Author Contributions
GFH conceived and supervised the study, and contributed to the revision of key content. HX collected and analyzed the data and was the primary author of the manuscript. QLM contributed to manuscript writing and validated the data analysis. XLL and LW reviewed and edited the final version of the manuscript.
Declaration of Conflicting Interests
The authors declare no competing interests.
Data Availability Statement
The original contributions presented in the study are included in this article. Further inquiries can be directed to the corresponding authors
Supplemental Material
Supplemental material for this article is available online.
References
Supplementary Material
Please find the following supplemental material available below.
For Open Access articles published under a Creative Commons License, all supplemental material carries the same license as the article it is associated with.
For non-Open Access articles published, all supplemental material carries a non-exclusive license, and permission requests for re-use of supplemental material or any part of supplemental material shall be sent directly to the copyright owner as specified in the copyright notice associated with the article.