
Abstract
Objective:
The aim of this study was to investigate the role and mechanism of CD79A+ B cells in mediating the microenvironment of breast cancer and the relationship with the prognosis of breast cancer.
Methods:
Single-cell RNA sequencing and bulk RNA sequencing analysis were combined to annotate breast cancer cell subtypes, perform cell communication and trajectory analysis. CD79A-related signature was constructed by LASSO and multivariate Cox analysis. CD79A+ B cell subsets in the tumor microenvironment were explored by immunoanalysis and multiple immunofluorescence analysis.
Results:
There were communication relationships between CD79A+ B cells and multiple cell types. A prognostic risk signature containing 6 genes was constructed by combining the TCGA dataset. The immune profile analysis showed that the low-risk group showed a higher immune response. In addition, multiple immunofluorescence analysis showed an attraction between CD79A+ B cells and tumor cells, and patients with high CD79A+ B cells expression had significantly higher survival rates.
Conclusion:
This study comprehensively explored the heterogeneity of CD79A+ B cells through transcriptome analysis and chromatin analysis, which contributes to an in-depth understanding of the function of CD79A+ B cells in biological processes as well as the molecular mechanism of breast carcinogenesis, providing a theoretical basis for treatment and prevention.
Keywords
Introduction
Breast cancer is one of the most common and significant health problems worldwide, affecting millions of women and men every year.1,2 It is a complex and heterogeneous disease characterized by the uncontrolled growth of abnormal cells in the breast tissue.3,4 The incidence of breast cancer varies in different populations and is influenced by various risk factors, including age, sex, genetic factors, hormonal factors, lifestyle choices, and environmental exposures.5,6 The disease has a wide range of clinical manifestations, molecular subtypes and prognosis, which brings many challenges to diagnosis and treatment.
The development and prognosis of breast cancer are affected by the complex interaction between tumor cells and the surrounding microenvironment, namely tumor microenvironment (TME).7,8 The TME is composed of multiple components, including immune cells, fibroblasts, endothelial cells, and extracellular matrix, which interact with tumor cells to form a unique ecosystem.9 -11 B cells are an important component of the TME and can exert antitumor effects by producing tumor-specific antibodies and presenting tumor antigens. 12 As a B cell surface molecule, CD79A is a widely recognized B cell marker and is crucial for the activation and survival of B cells. 13 CD79A is closely related to immunoglobulins and is involved in signaling pathways that affect normal and malignant B cell function in the context of cancer, indicating a potential role in modulating immune response in TME.14,15 However, the expression of CD79A is not consistent across all B cells. Based on previous studies and our analysis of single-cell RNA sequencing (scRNA-seq) data, we found that only approximately 57% of B cells express CD79A, revealing heterogeneity within the B-cell compartment.15,16 Currently, there is no literature that thoroughly explores this heterogeneity, and whether CD79A+ B cells influence the immune microenvironment and patient prognosis in breast cancer remains largely unclear, leaving a scientific gap.
In recent years, major technological advances have revolutionized our understanding of breast cancer biology. High-throughput genomic technologies such as DNA and RNA sequencing have enabled the comprehensive characterization of genetic and molecular alterations in breast cancer. 17 In addition, the advent of scRNA-seq has provided unprecedented solutions to reveal cellular heterogeneity within tumors, revealing previously unrecognized cell subsets and their functional states.18 -20 This technology enables the exploration of the cellular composition, spatial structure, and molecular dynamics of individual cells within a tumor, providing a deeper understanding of the impact of a tumor on disease progression and treatment response. 21
In this study, we constructed the transcriptomic landscape of breast cancer cells by scRNA-seq. Then, through comprehensive analysis of CD79A-related differentially expressed genes in B cells, bulk RNA-seq data and clinical data, the relationship between CD79A+ B cells and clinical prognosis of breast cancer and the regulatory effect of CD79A+ B cells on tumor immune environment were revealed. In addition, multiplex immunofluorescence technique further validated our study. It provides new insights and possible new ways of intervention for the prevention and treatment of breast cancer, so it has important scientific significance and clinical application value. The workflow of the entire study is shown in Figure 1.
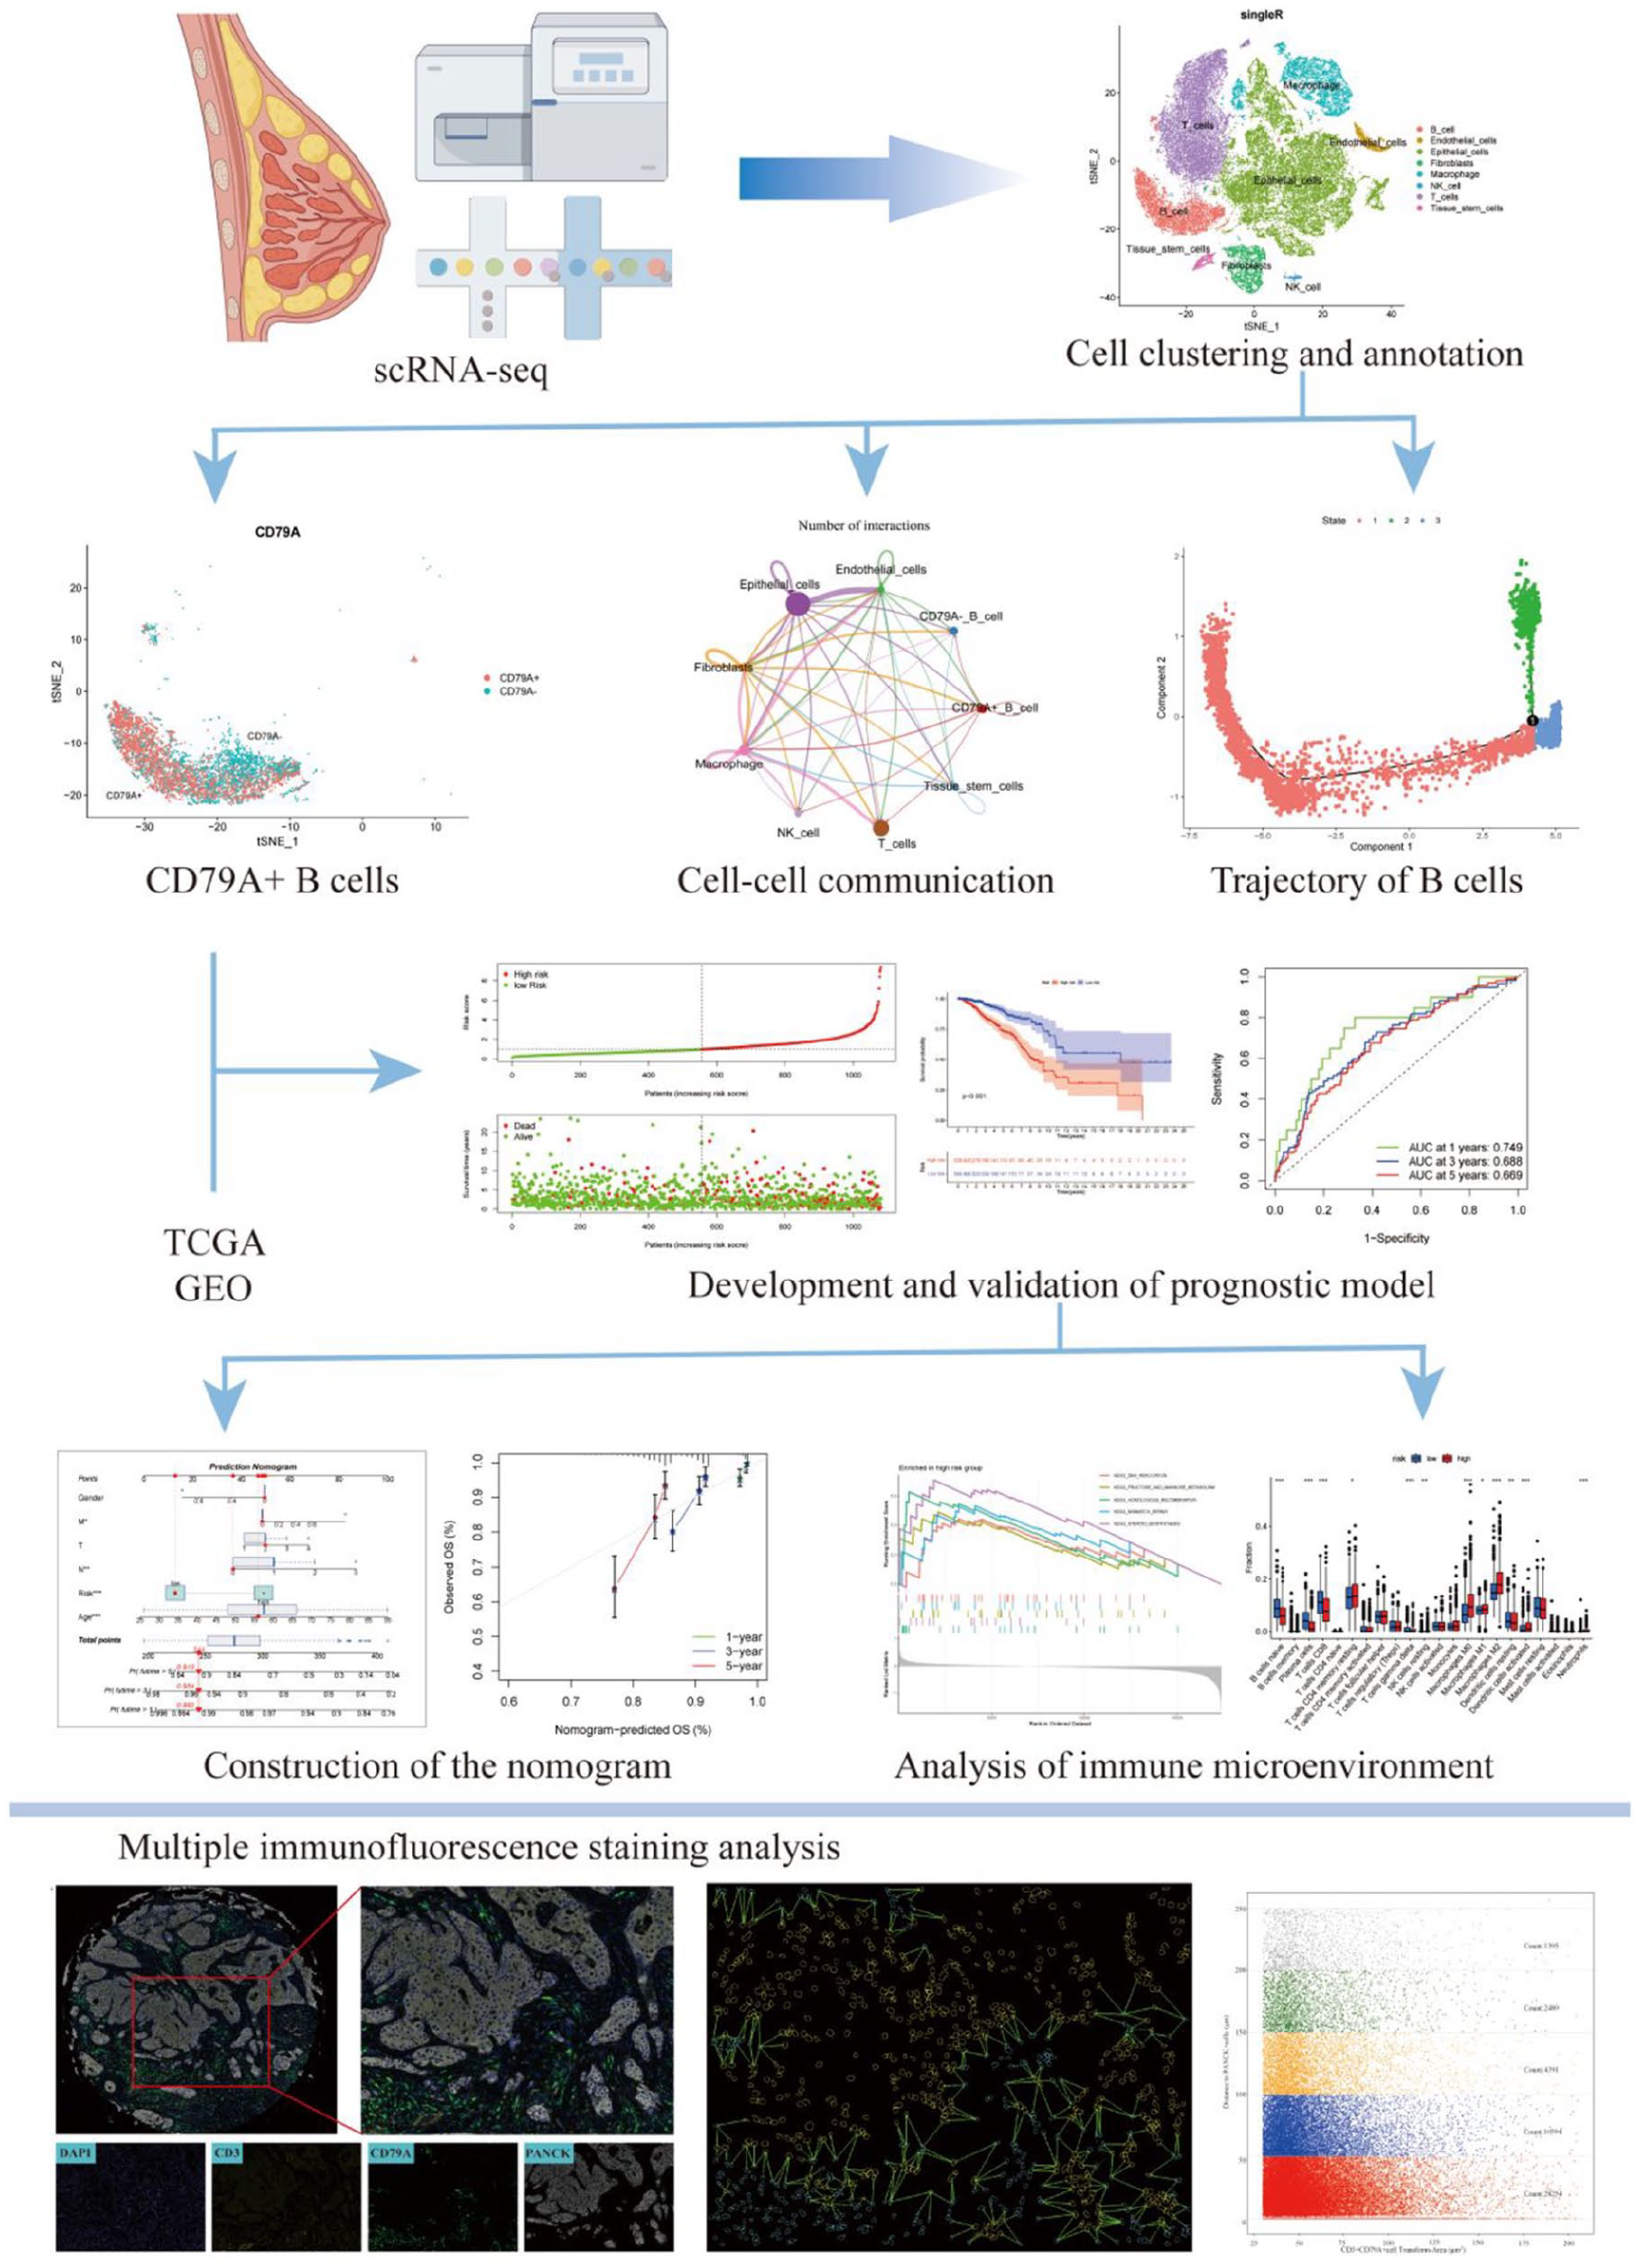
Workflow of the study.
Materials and Methods
Data Acquisition and Preprocessing
The scRNA-seq dataset file for breast cancer was downloaded from the Gene Expression Omnibus (GEO; http://www.ncbi.nlm.nih.gov/geo/) database with access number of GSE161529.22,23 Bulk RNA-seq data were obtained from the TCGA public database. Gene expression data and clinical data of breast cancer patients in the TCGA database were collected, including information on 1069 patients. In addition, data from 327 breast cancer patients were obtained by downloading GSE20685 from GEO data base as an external validation cohort. 24
scRNA-Seq Data Integration and Downscaling
A total of 6 samples were obtained for analysis. The data were read using the Read10X function of the Seurat package in the R software (versions 4.1.3 and 4.3.1), and the raw data were processed using the “CreateSeuratObject” function, which creates a Seurat object for a single sample, retaining the genes with expression data in at least 3 cells and at least 200 features. 25 Upon the amalgamation of Seurat objects, cell quality control and filtering process ensued to preserve cells adhering to stringent criteria. Specifically, retention encompassed cells exhibiting no fewer than 300 RNA features (genes) yet not exceeding 7000 RNA features. Furthermore, stringent parameters were applied, necessitating less than 10% expression of mitochondrial genes, less than 3% expression of Hemoglobin genes, and a total RNA count below 100 000 for inclusion. Additionally, data integration using the Harmony algorithm to address batch effects and the normalized data underwent dimensionality reduction via principal component analysis (PCA). 26 Subsequently, the analysis identified the top 3000 highly variable genes (HVGs) using the “FindVariableFeatures” method. These HVGs were then scaled using the “ScaleData” function to prepare for downstream analyses.
Cell Clustering and Annotation
Following the dimensionality reduction facilitated by the “RunPCA” function, the analysis transitioned to cell clustering utilizing the “FindNeighbors” and “FindClusters” functions.27,28 Subsequently, the t-distributed stochastic neighborhood embedding (tSNE) method was employed for data visualization, providing a comprehensive representation of the clustered cell populations. Marker gene analysis was then conducted on the clustered cell populations using the Wilcoxon algorithm. The “FindAllMarkers” function was applied to filter these marker genes, with criteria set at a minimum percentage of expression (min.pct = .25), a log-fold change threshold (logFC. threshold = .25), and a significance level (P < .05). 29 Furthermore, annotation for cell types was performed using the “SingleR” function which involved the inference of regulatory networks from single-cell RNA-Seq data to predict and annotate cell types within the clusters.
Pseudo-Time Trajectories Analysis
Pseudo-time trajectories of cells are analyzed using the Monocle2 package to understand the dynamics of the cell state. Initially, Seurat was used to preprocess the raw Unique Molecular Identifier (UMI) counts of the gene-containing cells. 30 The function “newCellDataSet” is used to create the analysis object with the parameter expressionFamily = negbinomial.size. Subsequently, genes with an average expression of less than 0.1 were filtered out. For dimensionality reduction, the function “reduceDimensio” is used with parameters reduction_method = “DDRTree” and max_components = 2. In addition, the plot_genes_jitter and plot_genes_violin functions were used to investigate the changes in gene expression in the cell sequencing data.
Cell-Cell Communication Analysis
Receptor-ligand interaction on the cell surface is a key biological process for cell communication and signaling. The CellChat software package was used to gain insight into ligand-receptor interactions between different cell types, which can help to understand intercellular signaling as well as the structure and function of cellular communication networks. 31 The createCellChat function instantiates a cellular communication object, setting the stage for extensive subsequent analysis. By extracting and processing the expression data of signaling genes, overexpressed genes and ligand-receptor pairs were identified and mapped to protein-protein interaction networks. The probability of cell-to-cell communication is calculated to reveal the network of cell-to-cell interactions. To ensure the reliability of the data, correspondence relationships containing less than three cells were removed after screening. In addition, decoding methods at the level of signaling pathways are employed to enable computation and visualization of communication networks at the level of aggregated cells.
Construction of the Prognostic Signature
The 798 differentially expressed genes in B cells were screened for subsequent analysis based on CD79A expression by the findmakers function. Using the TCGA-BRCA dataset, we randomly divided 1069 patients into a training set (N = 749) and a validation set (N = 320) according to the ratio of 7:3. An external validation cohort (GSE20685, N = 327) was also included. To develop a prognostic model, we first conducted univariate Cox regression to identify differentially expressed genes significantly associated with overall survival in the training set. Subsequently, the Least Absolute Shrinkage and Selection Operator (LASSO) Cox regression was applied using the glmnet package to further reduce dimensionality and prevent overfitting. The optimal lambda value was determined by 10-fold cross-validation, and genes with non-zero coefficients were selected as prognostic candidates. These candidate genes were then incorporated into a multivariate Cox proportional hazards model to construct a prognostic signature. The model was optimized using stepwise regression to retain only statistically significant predictors. The coefficient, hazard ratio (HR) and its confidence interval, as well as the associated P-value, were extracted from the fitted COX model, and the effect size of each gene was considered to determine whether each gene had a significant effect on survival time. The following formula was used to calculate the risk score:

After calculating the risk score, all breast cancer patients were categorized into high- and low-risk groups based on the median value. K-M survival analysis was performed using the Survminer packages to compare the overall survival of patients in the low- and high-risk groups. The survival status maps including the survival status and time of the patients were visualized by pheatmap package. The “TimeROC” package was used to construct time dependent receiver operating characteristic (ROC) curve to, and the performance of the risk signature was evaluated based on the area under the curve (AUC) of the ROC curve. 32
Construction of the Nomogram
Univariate and multivariate COX analyses were performed on clinical variables such as age, sex, TNM stage, and risk score. A nomogram was then constructed incorporating clinical variables and risk scores. Receiver operating characteristic (ROC) curve analysis was used to evaluate the performance of the nomogram by comparing age, gender, TNM stage, risk and nomogram. Decision curve analysis (DCA) was used to measure the utility of the nomogram in clinical decision making.
Enrichment Analysis of High and Low Risk Groups and Immune Cell Infiltration Analysis
To understand the biological differences between risk subgroups, GSEA enrichment analysis was performed by the R software package org.Hs.eg.db and clusterProfiler to identify biological pathways and functions associated with high- and low-risk groups in the gene expression data. 33 Differential expression analysis was first conducted to obtain the ranked gene list based on log-fold change between the groups. The GSEA() function was then used to assess whether predefined gene sets (eg, KEGG pathways) were significantly enriched, thereby identifying biological processes associated with different risk levels. ESTIMATE package is a method to assess the tumor microenvironment by analyzing gene expression data in tumor tissues, including the estimation of multiple factors, such as the proportion of immune and mesenchymal cells and tumor purity. 34 In addition, CIBERSORT was used to estimate the relative proportions of 22 immune cell types in each sample. Group comparisons were conducted between the high- and low-risk subgroups to evaluate differences in immune infiltration patterns. Boxplots were generated to visualize the distribution and variation of immune cell subsets. Immune checkpoint genes encode immune checkpoint proteins, which play a key role in regulating the interaction between immune cells and cancer cells.
Multiple Immunofluorescence Staining
The 80 samples without treatment were obtained to multiple immunofluorescence staining using Alpha TSA Multiplex IHC Kit (Beijing, China), in which XTSA 520 (Cat: ZA0293), XTSA 570 (Cat: HA720082) and XTSA 780 (ZM0069) were used to label CD79A, CD3 and PANCK, respectively. Tissues were de-paraffinized, hydrated, microwave-repaired, blocked, and incubated with primary and secondary antibodies, and then fluorescently stained, then stained for nuclear staining with DAPI, and finally sealed with anti-quencher.
Image acquisition was performed using a Zeiss Axioscan7 whole-layer imaging system to visualize the different fluorophores. Cell density, nuclear area per cell and expression per cell were quantified using Strata Quest analysis software (version 7.1.129, Tissue Gnostics GmbH, Vienna, Austria), and CD3+CD79A+ B cells with PANCK tumor cells were stained with 0 to 50 µm, 50 to 100 µm, 100 to 150 µm, 150 to 200 µm, and 200 to 250 µm distance gradients for quantitative counting of CD3+CD79A+ B cells and PANCK tumor cells.
Results
Single Cell Transcriptome Atlas of Breast Cancer
A total of 6 breast cancer patients were obtained for further scRNA analysis in this study (Figure 2A). The samples were integrated for analysis and sample batch differences were removed. Subsequently, the integrated data were subjected to PCA and tSNE downscaling, resulting to clustering into 17 clusters (Figure 2B). The expression of the top 10 marker genes of the 17 clusters was shown in Figure 2C. All cells were initially divided into immune cells and non-immune cells by the expression of immune cell marker PTPRC (Figure 2D and E). In addition, the above clusters were labeled as 8 different cell types, including B cells, Endothelial cells, Epithelial cells, Fibroblasts, Macrophage, Mast cells, T cells, and Tissue stem cells via SingleR (Figure 2F). The feature plot and violin plot of top 1 marker gene for all cell types were shown in Figure 2G and H. On this basis, we further analyzed the expression of CD79A in these cell subpopulations. As a marker of B cells, CD79A showed different expression patterns, mainly expressed in identified B cell clusters, but some B cells did not express CD79A (Figure 3A and B). In addition, a possible co-expression relationship was found between CD79A and CD20, which is considered a classical B-cell marker (Figure 3C and D).
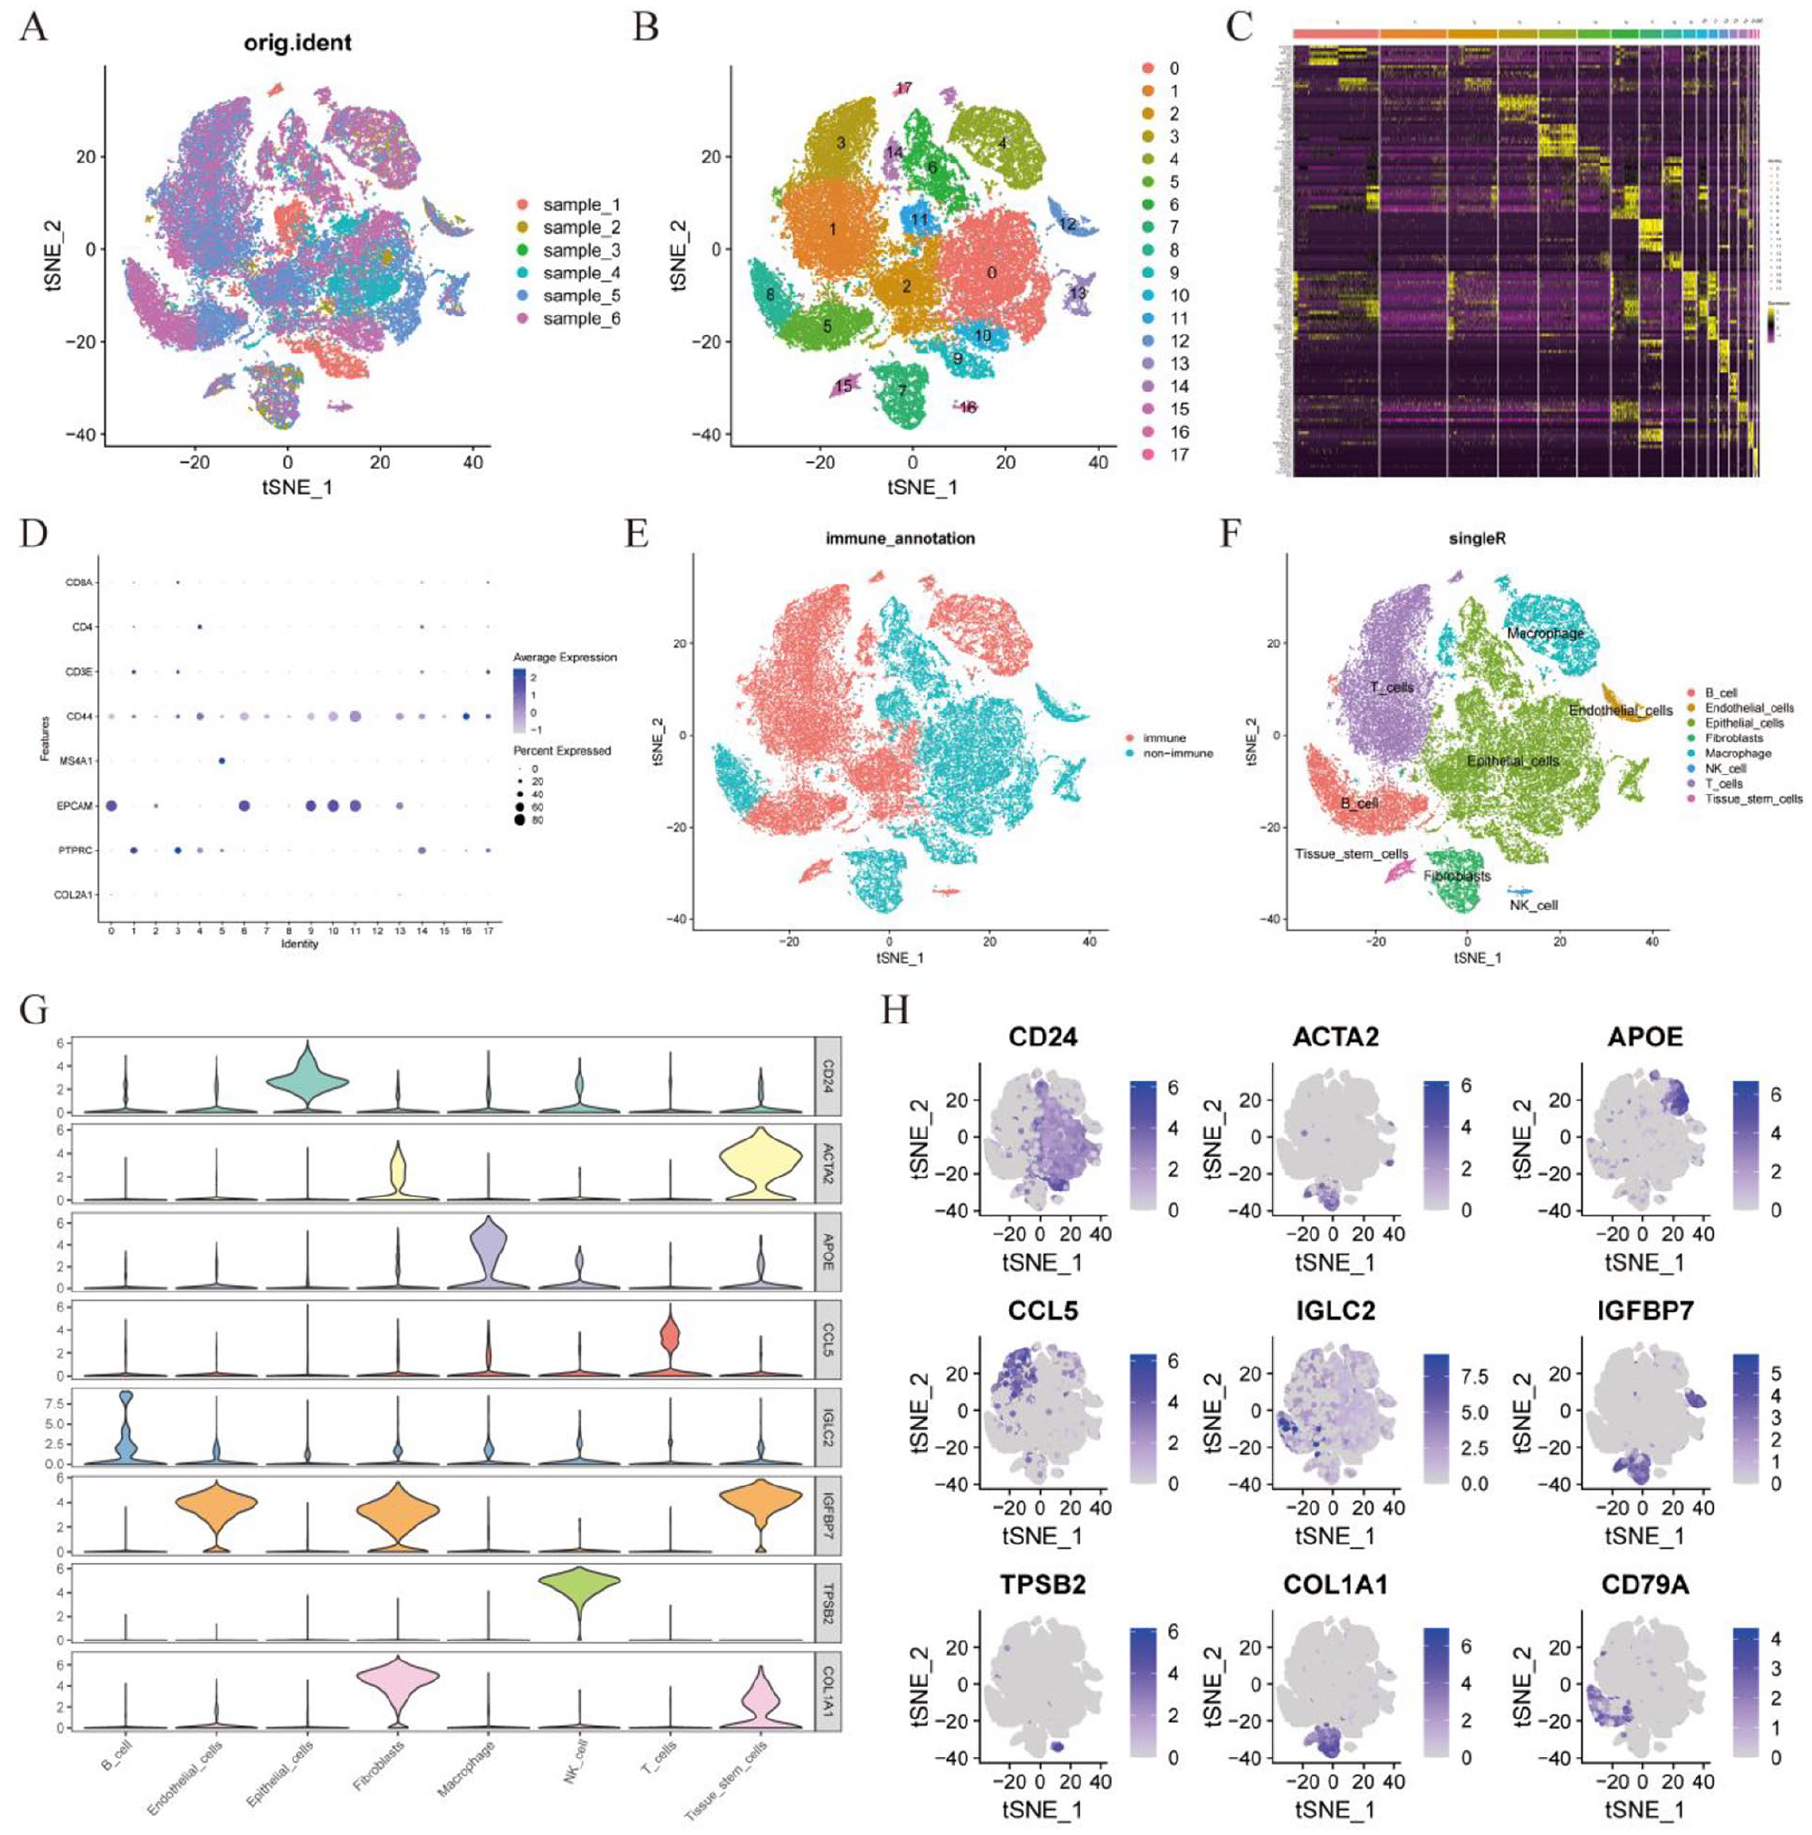
Integration and clustering of breast cancer scRNA-Seq data. (A) t-SNE visualization of 6 breast cancer samples. (B) t-SNE of 17 cell clusters. (C) Heatmap presenting the top 10 marker genes across the 17 cell clusters. (D) Bubble plots displaying expression levels of top marker genes specific to each of the 17 cell clusters. (E) The cells were stratified into immune and non-immune categories based on gene expression profiles. (F) Eight cell types were identified based on the marker genes. (G) Violin plot of top 1 marker gene expression in 8 cell types. (H) Profile of top1 marker gene expression in 8 cell types.
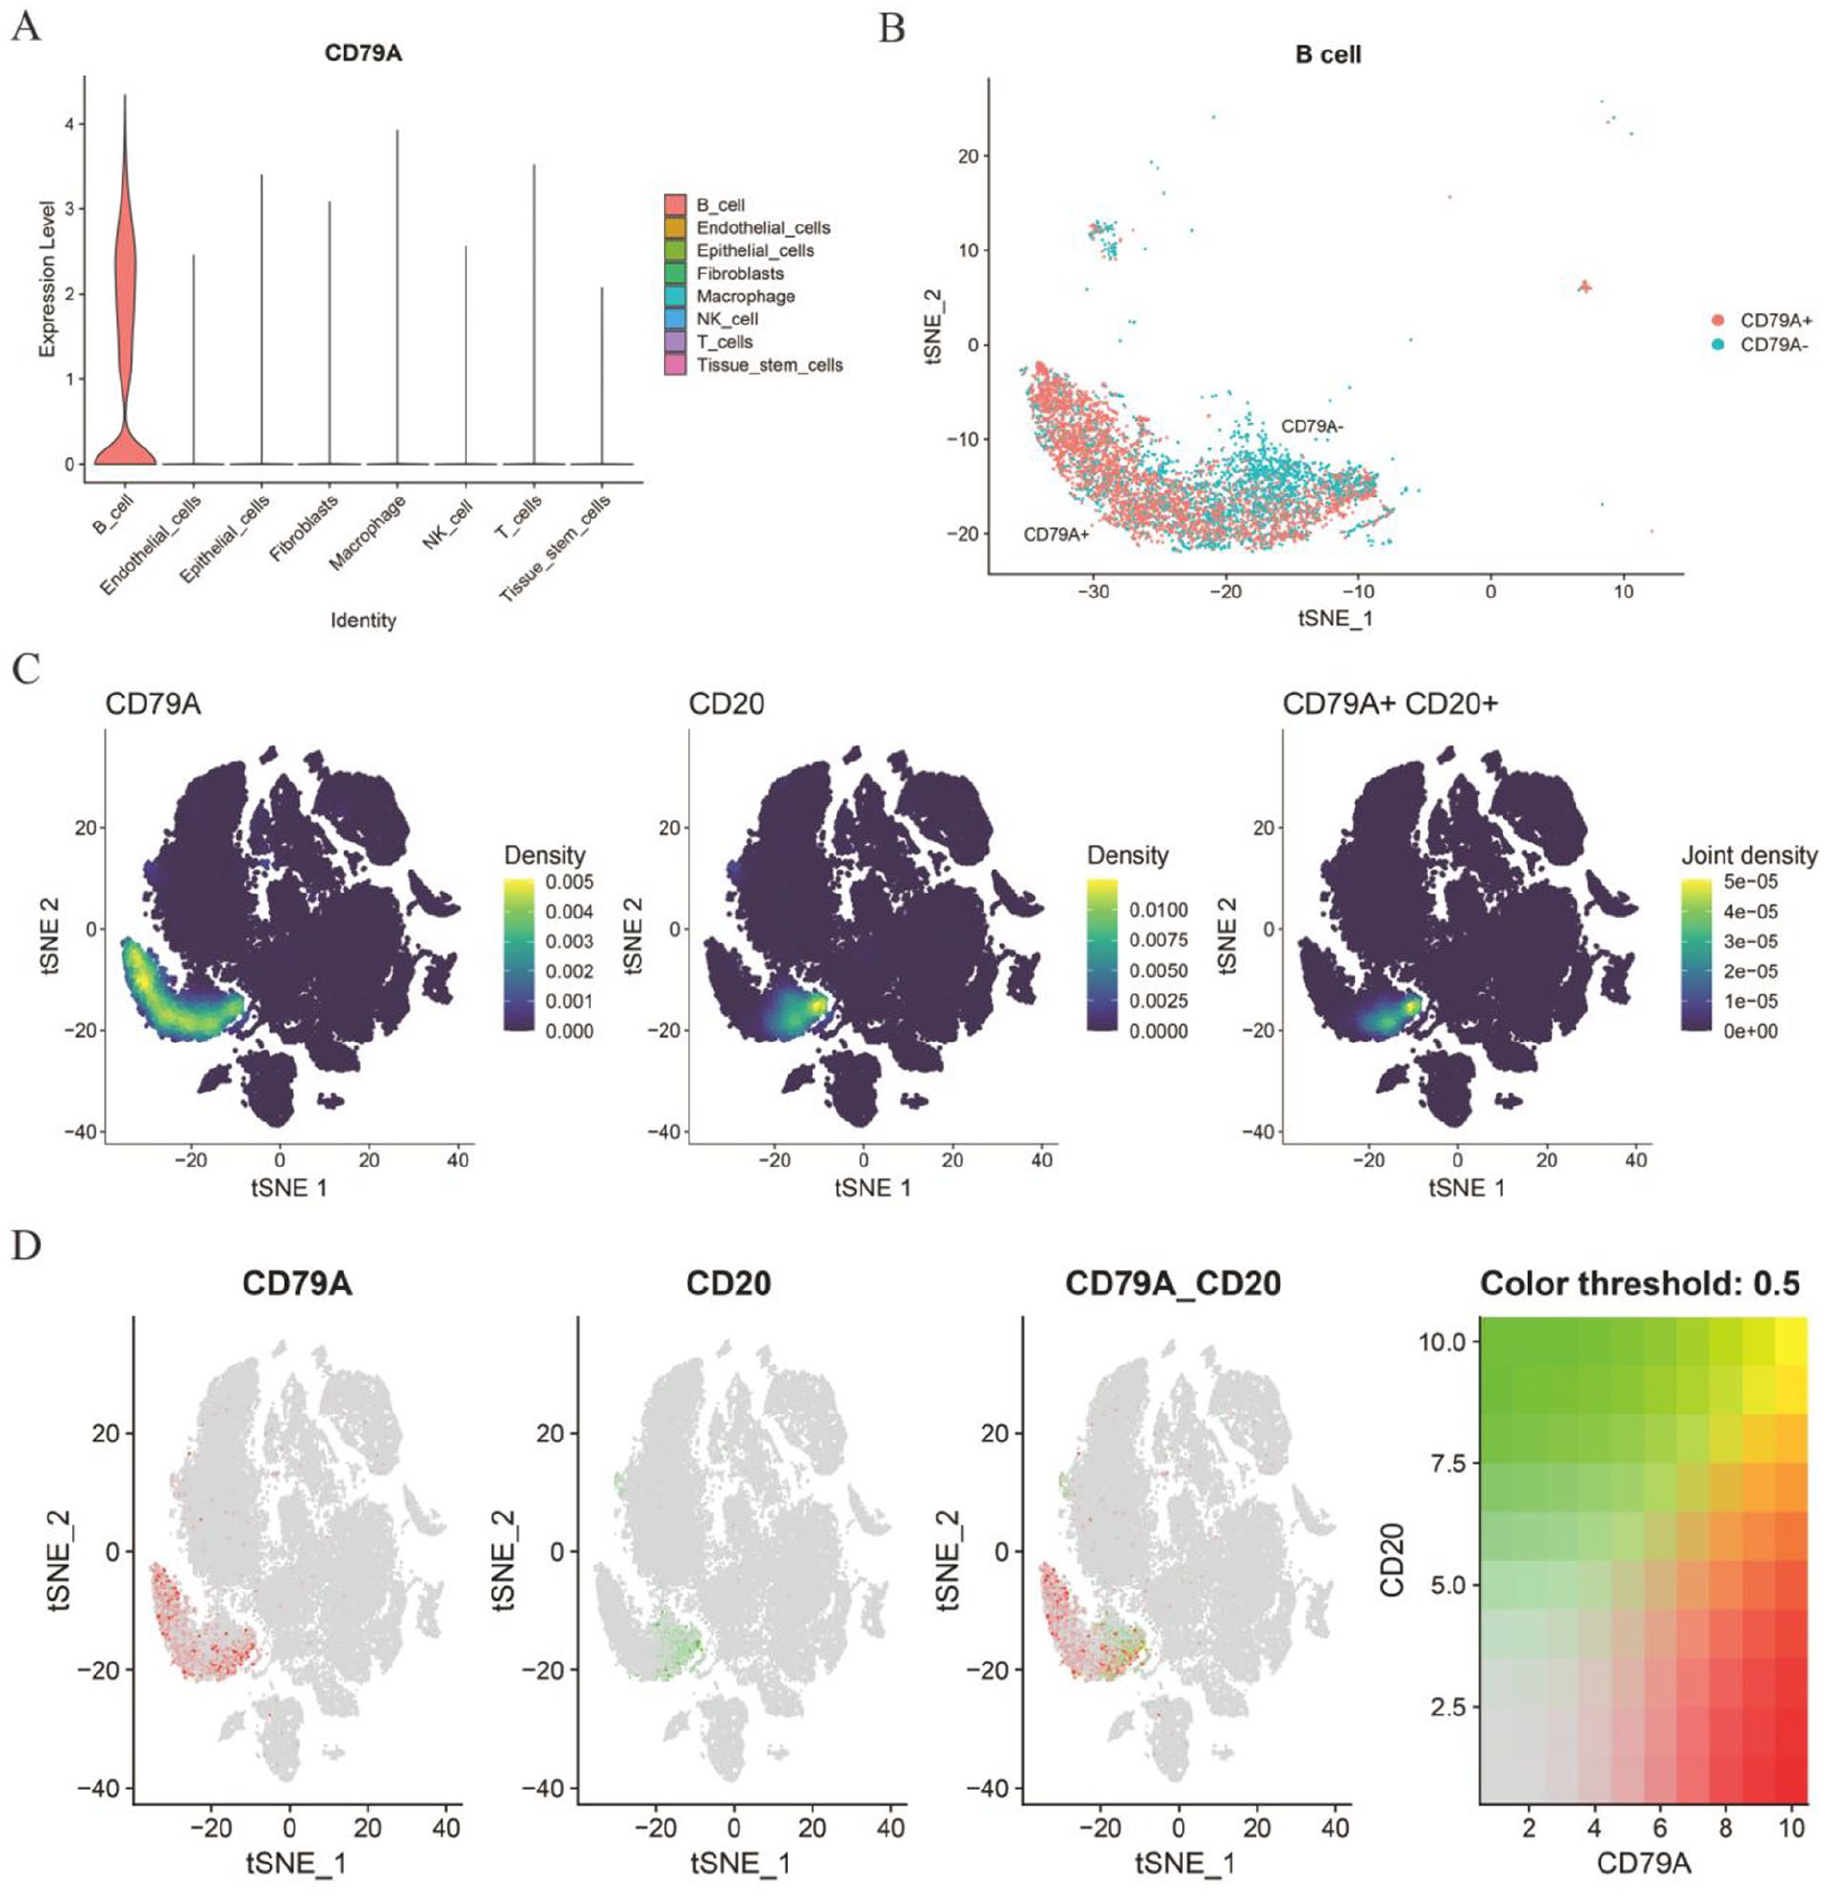
Summary of CD79A expression. (A) Violin plot illustrating CD79A expression across 8 identified cell types. (B) Classification of cells into CD79A+ B and CD79A− B subpopulations based on expression levels. (C) Density plots for CD79A, CD20, and their joint density in B cells. The joint density plot suggests areas where both markers are co-expressed. (D) The expression of CD79A, MS4A1, and their co-expression. Color Threshold Plot shows the co-expression density of cells.
Developmental Trajectory Analysis of CD79A+ B Cells
To explore the developmental trajectory of B cells and the expression of CD79A in different developmental stages, we extracted the expression matrix of B cells for pseudo-time locus analysis (Figure 4A). The development of B cells could be roughly divided into 3 differentiation states (Figure 4B and C). The timeline of cell subtype differentiation gradually was transitioned from dark to light colors, with darker colors indicating earlier developmental stages (Figure 4D). This result from the differentiation of the 2 clusters, with the cells in cluster 5 at an early stage of development and the cells in cluster 8 at the end of development (Figure 4E). Figure 4F shows the expression changes of CD79A and CD20 in different states and pseudo time, indicating that both CD79A and CD20 have higher expression in state 1 and early pseudo time. This suggests that CD79A and CD20 may play an important role in B cell function at these specific states and time points.

Analysis of B-cell trajectories in scRNA-seq. (A) Spatial distribution of B cells after dimensionality reduction. (B) Trajectory plot showcasing the different stages of B cell differentiation. (C) Trajectory plots showing the differentiation of the 3 subtypes. (D) Pseudo-temporal analysis of B cells, the color from dark blue to light blue indicates the progression of pseudo-time. (E) Distribution of different cluster in B cells in cell trajectory curve. (F) Expression of CD79A and CD20 in different states and pseudo times.
Cell Interactions Associated With CD79A+ B Cells
We then used R software package “cellchat” to further explore the interactions between different cell types (Figure 5A and B). The communication network between CD79A+ B cells and other cell types was explored based on ligand-receptor interactions between different cells and specific signaling pathways (Figure 5C and D). In the analysis of cellular communication, it was found that CD79A+ B cells may engage in potential signal transduction with other cell types such as macrophages, NK cells, and T cells via the macrophage migration inhibitor (MIF) signaling pathway (Figure 5E and F). Additionally, the ligand-receptor pairs MIF-(CD74+CXCR4) and MIF-(CD74+CD44) are potentially important in mediating signaling between CD79A+ B cells and Macrophage (Figure 5G and H), and their expression is increased in all the above cells (Figure 5I). On this basis, we further explore the main signaling pathways of these cells as signal transmitters and signal receivers respectively. It is worth noting that CD79A+ B cells subsets mainly signal to other cell subsets through the MIF signaling pathway, and the BAFF signaling pathway plays an important role as a signal receiver (Figure 5J).

Cell-to-cell communication analysis associated with CD79A+ B cells. (A) The number of interactions in the cell-cell communication network. (B) The weight/strength of interactions in cell-cell communication networks. (C) The number of interactions between CD79A+ B cells and other cellular communication networks. (D) The weights/strengths of interactions in the communication network between CD79A+ B cells and other cells. (E) Intercellular communication interactions in MIF signaling pathway. (F) Heat map showing the interaction patterns of ligand-receptor interactions in MIF signaling in different cell types. (G) Bubble plot of ligand-receptor pair-mediated interaction between CD79A+ B cells and other cells. (H) Expression profile of genes involved in MIF signaling pathway. (I) Ligand-receptor pair-mediated signaling between CD79A+ B cells and other cells. (J) Heatmap to visualize possible incoming and outgoing signal pathways between different cell types.
Development and Validation of CD79A-Related Signature
The 1069 samples with breast cancer were obtained from the TCGA database, and these patients were randomly divided into TCGA training group and TCGA testing group according to the ratio of 7:3. Furthermore, the GSE20685 cohort with 327 samples was used to verify the accuracy of the signature as an external validation. Detailed description of all cohorts was provided in Table 1. A total of 989 CD79A-related differential genes were obtained from the B cell subsets analyzed by scRNA. We then extracted the above genes from the expression matrix of breast cancer patients in TCGA to construct a prognostic signature. Specifically, 88 prognostic genes were identified in the TCGA cohort by univariate COX regression analysis. Subsequently, 10 breast cancer prognostic genes were further screened by LASSO cox regression in the TCGA training cohort (Figure 6A and B). Finally, 6 genes including RPL11, QPRT, IGHA1, SNX3, MRPL16, and NFKBIA were included in the construction of the prognostic signature by multivariate Cox regression analysis (Figure 6C). The calculation formula was shown as below: Risk Score = RPL11 * (−0.2470768) + QPRT * (0.22158854) + IGHA1 * (−0.1556514) + SNX3 * (0.5948117) + MRPL16 * (−0.3488748) + NFKBIA * (−0.2571059). All patients in distinct cohorts were categorized into high- and low-risk groups based on the median risk score value. The risk score distribution curves and survival status characteristics showed that patients in the high-risk group had shorter survival time. P-value of K-M survival curves was less than .05, with significant survival differences and higher OS for patients in the low-risk group. Auc of ROC curves for each cohort at 1, 3, and 5 years was greater than .6, which validated that the signature performed well (Figure 6D-G).
The Clinical Characteristics of Breast Cancer in TCGA Cohort and GSE20685.

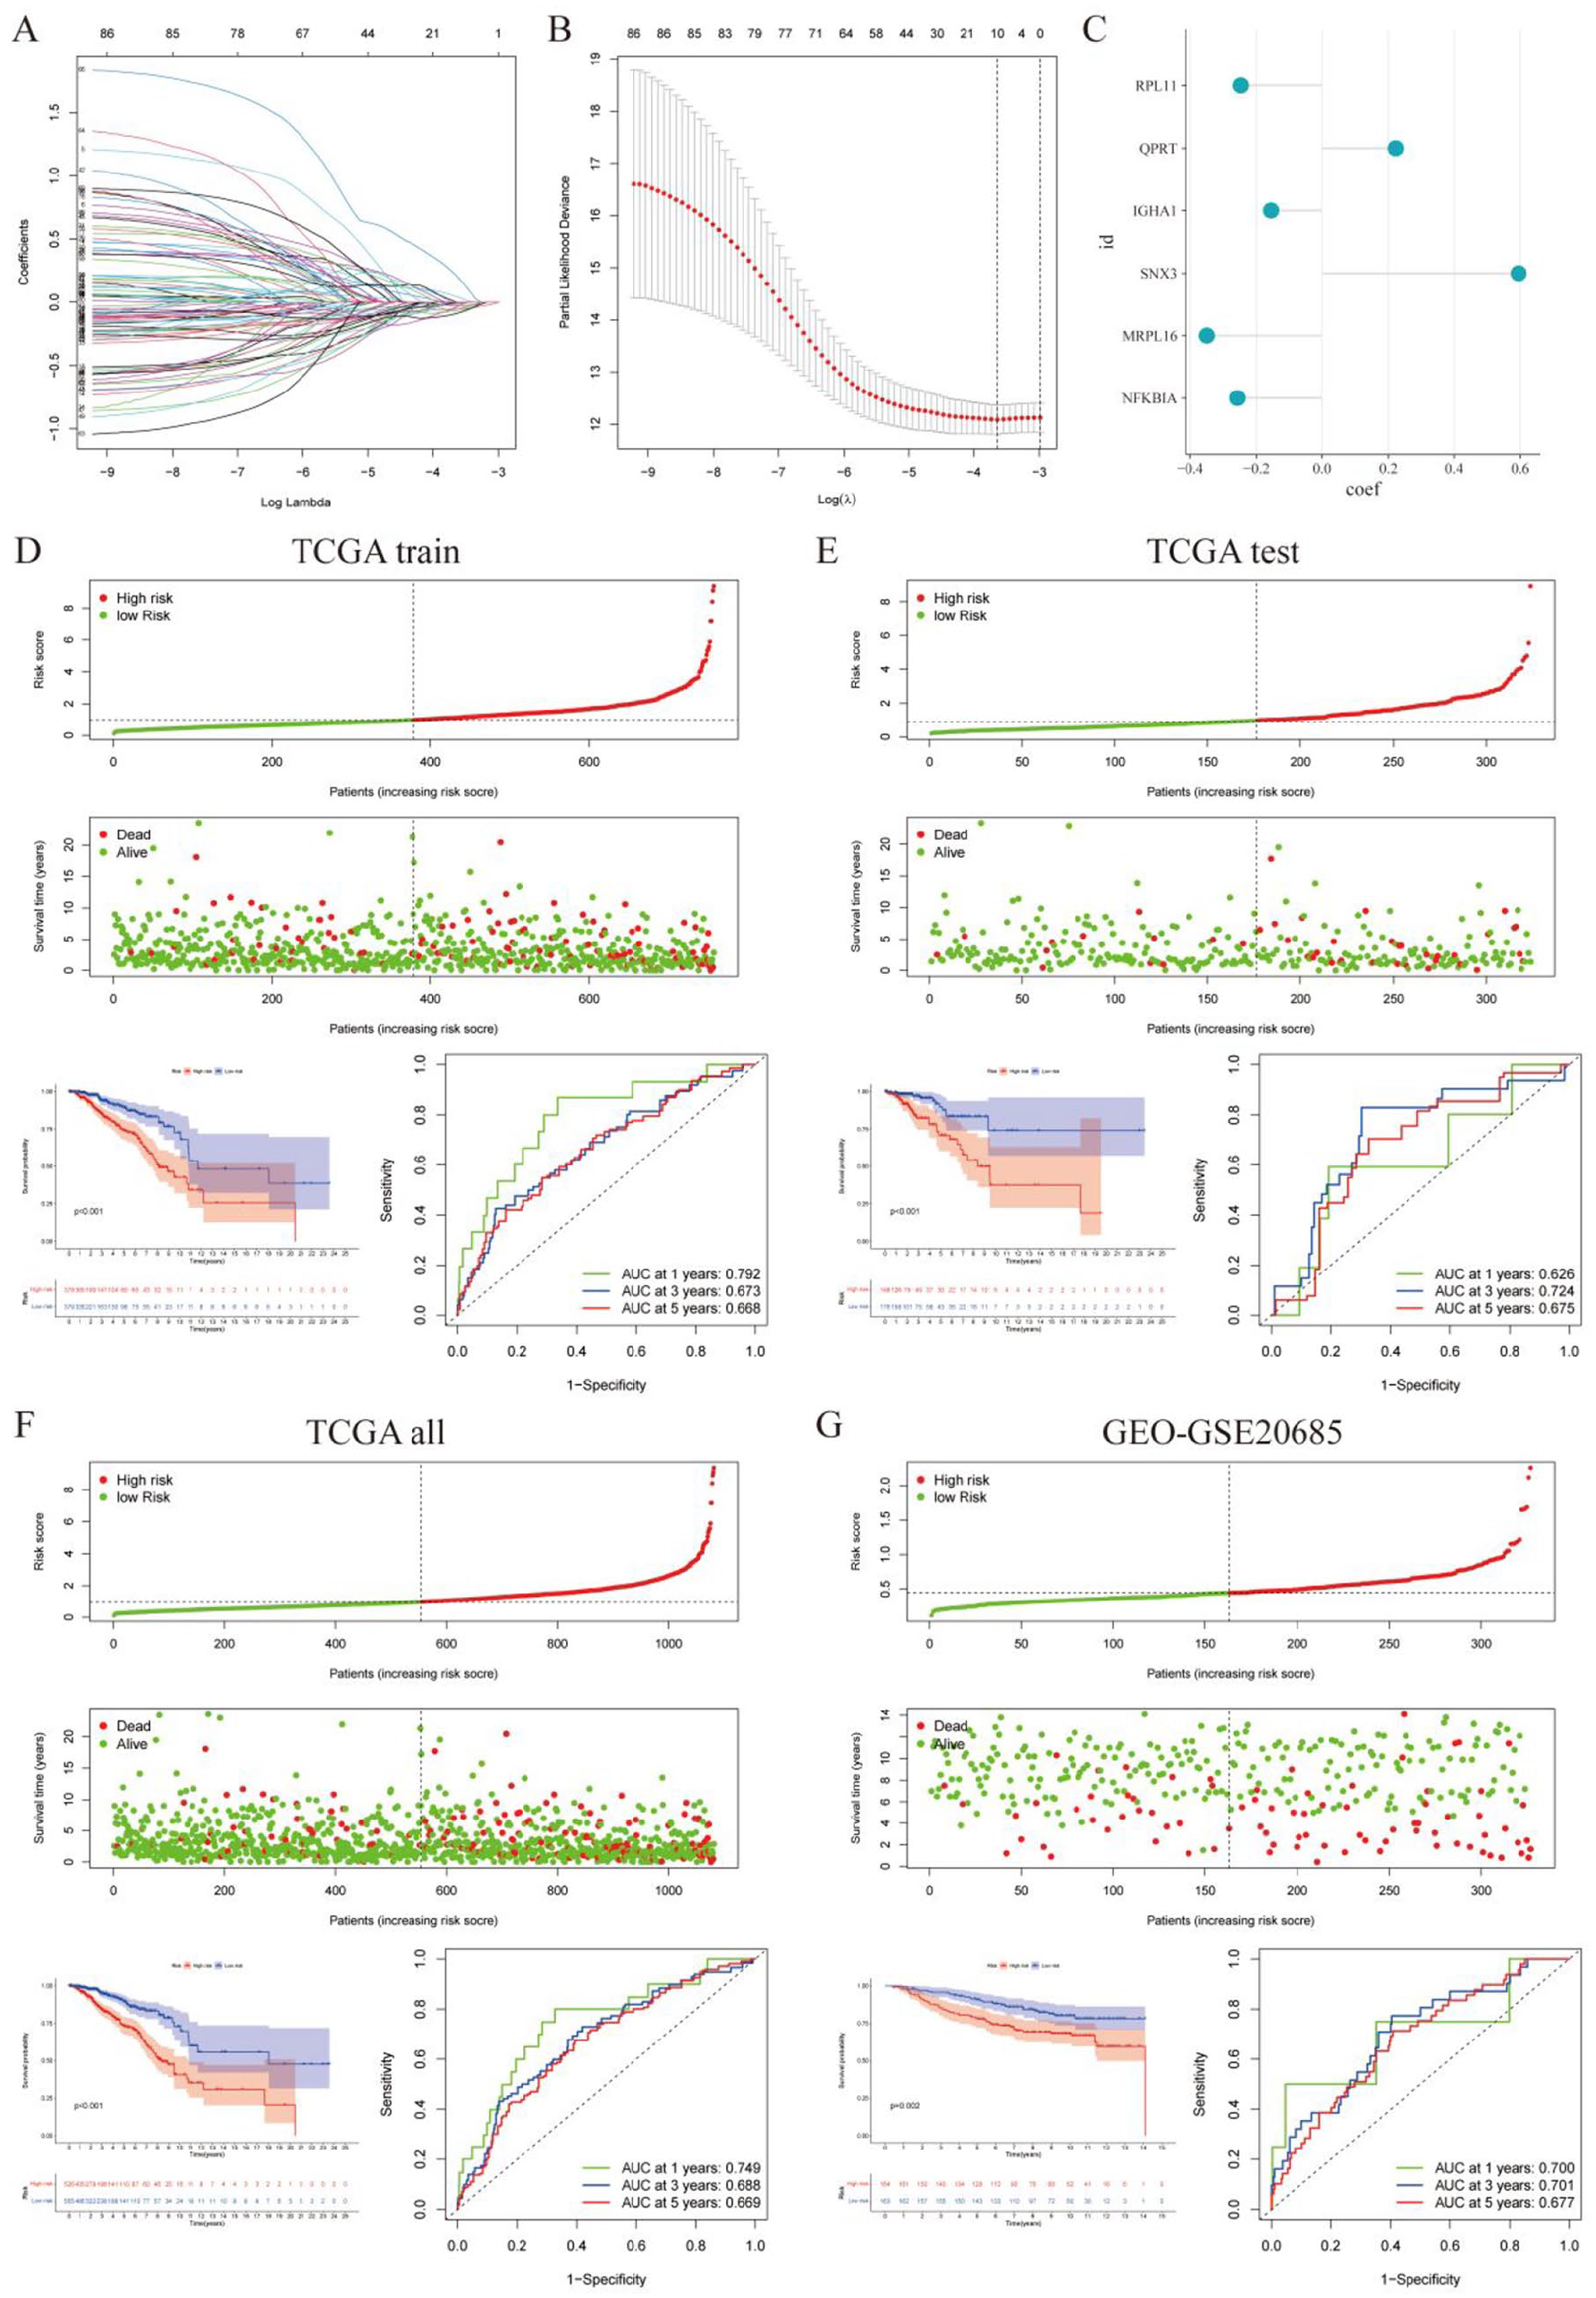
Construction and validation of prognostic signature. (A and B) Least absolute shrinkage and selection operator (LASSO) further screen for genes associated with prognosis. (C) Coefficient of the prognostic model was used to calculate the risk score. (D-G) Risk score distribution map, survival status map, survival curve and ROC curve of TCGA train cohort (D), TCGA test cohort (E), TCGA all cohort (F), and GEO cohort (G).
Construction and Validation of the Nomogram
Univariate cox analysis showed that age, TNM stage and risk score were closely related to the prognosis of breast cancer (Figure 7A). Among them, multivariate cox regression analysis further found that only age, M, N and risk score could be used as independent prognostic factors for breast cancer (Figure 7B). Therefore, in order to improve the accuracy of the prognostic signature, we constructed a nomogram integrating risk scores and clinical variables (Figure 7C and D). The sum of the individual scores for each variable is the patient’s final score, which corresponds to a 1, 3, and 5-year probability of survival. The ROC curve verified that the nomogram had better performance than age, gender, TNM stage, or risk alone at 1, 3 and 5 years (Figure 7E-G). The DCA results further show that nomogram has higher prediction accuracy compared to other parameters (Figure 7H-J).

Nomogram for predicting OS. (A) Univariate COX analysis for age, gender, TNM stage and risks core. (B) Multivariate COX analysis of age, gender, TNM stage and risks core. (C) Nomogram combining age, gender, TNM stage and risks core. (D) The calibration curve showed good performance of the nomogram. (E-G) Performance comparison of nomogram with other parameters at 1(E), 3(F), and 5(G) years by ROC curve. (H-J) Performance comparison of nomogram with other parameters at 1(H), 3(I) and 5(J) years by DCA.
Immune characteristics of different risk groups
The results of GSEA showed that the high-risk group was significantly enriched in DNA replication, fructose and mannose metabolism, homologous recombination, mismatch repair, steroid biosynthesis. The low-risk group was significantly enriched in chemokine signaling pathway, cytokine-cytokine receptor interaction, hematopoietic cell lineage and primary immunodeficiency (Figure 8A). The high-risk group had lower ESTIMATE, immune, and stromal score than the low-risk group except for tumor purity (Figure 8B), which suggested that the low-risk group may have higher levels of infiltrating immune cells. Therefore, we further compared the infiltration levels of 22 different immune cells in the high and low risk groups. The infiltration level of naive B cells, Plasma cells, CD8 T cells, gamma delta T cells, resting dendritic cells was significantly higher in high-risk group. In contrary, resting memory CD4 T cells, M0 Macrophages, M2 Macrophages and activated dendritic cells showed similar results in the high-risk group (Figure 8C). In addition, there was a correlation between the level of infiltration of immune cells and the risk score (Figure 8D). The expression of immune checkpoint genes, including CD40, CD86, CD48, IDO1, VTCN1, HAVCR2, CD27, TNFRSF14, LAIR1, and LGALS9, were significantly higher in the low-risk group than those in high-risk group, suggesting that patients in the low-risk group might benefit more when treated with immune checkpoint inhibitors (Figure 8E).

Immunological characteristics of the different risk subgroups. (A) GSEA analysis shows different pathways enriched in high and low risk subgroups. (B) Analysis of the difference of tumor microenvironment between the 2 risk groups showed that the ESTIMATE, immune score and interstitial score were lower in the high-risk group, and the tumor purity was higher. (C) Differential analysis of immune infiltration cells between 2 risk groups. (D) Correlation analysis between risk score and immune infiltrating cells. (E) Expression analysis of immune checkpoint genes.
CD79A+ B Cell Subsets in the Tumor Microenvironment
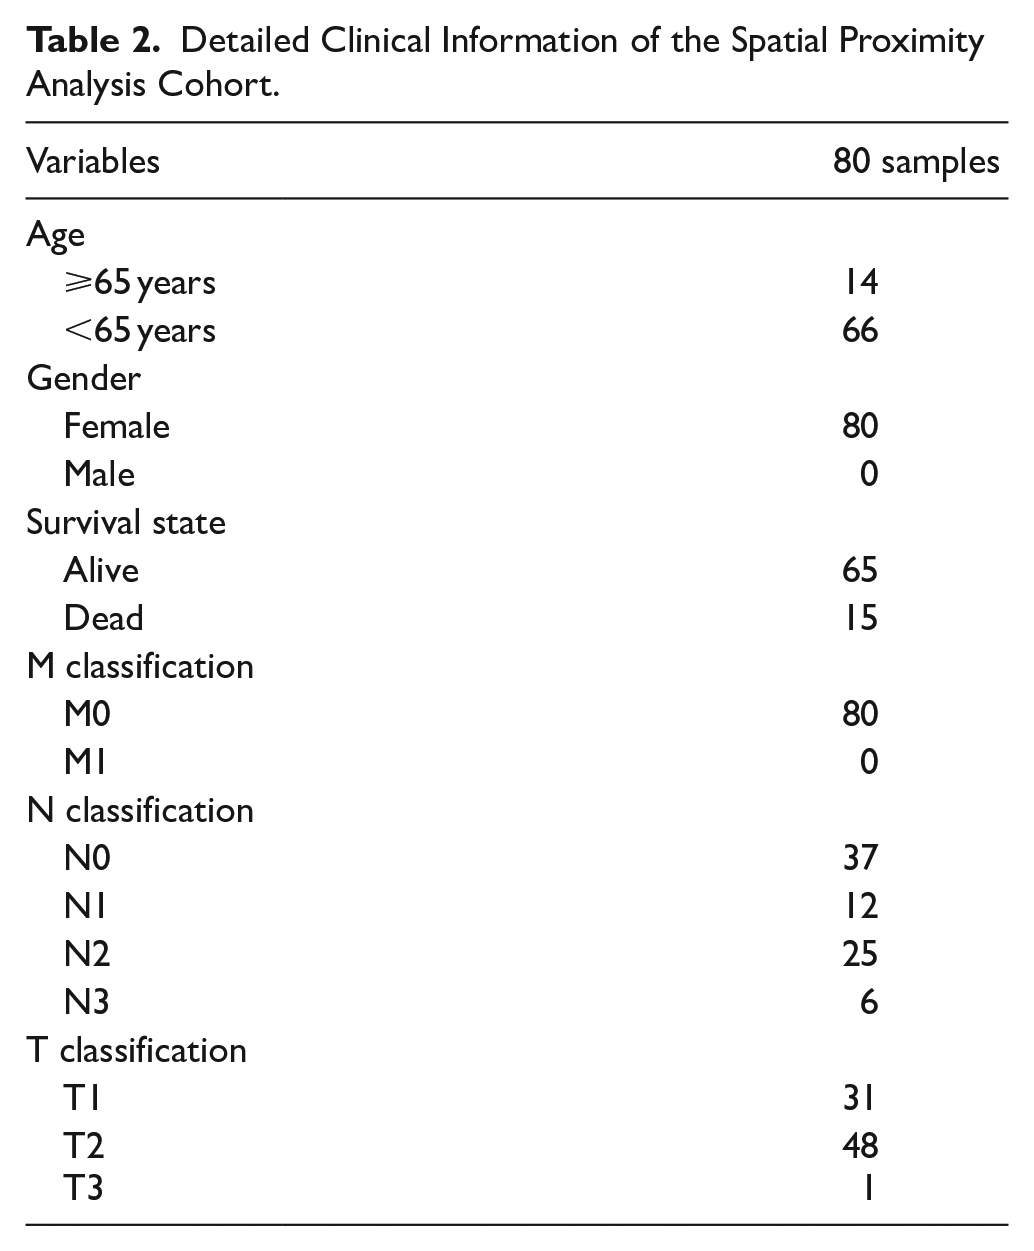
To further explore the tumor microenvironment of breast cancer mediated by CD79A+ B cells, we collected 80 breast cancer samples that were not treated with drugs for multiple immunofluorescence analysis (Figure 9A). Detailed clinical information on the cohort shown in Table 2. Spatial proximity analysis showed the distance between tumor cells and CD79A+ B cells (Figure 9B). For further spatial analysis, quantified the number of CD79A+ B cells within the distance gradients of tumor cells (0-50 µm, 50-100 µm, 100-150 µm, 150-200 µm, and 200-250 µm). As expected, closer proximity to tumor cells resulted in more CD79A+ B cells, showing an increasing trend (Figure 9C), which confirms the attraction between tumor cells and CD79A+ B cells. Importantly, CD79A+ B cells are closely related to the prognosis of breast cancer patients, and the survival rate of patients with higher CD79A+ B cells expression is significantly higher than that of patients with lower expression (P = .02; Figure 9D), reflecting the positive role of CD79A+ B cells in the tumor microenvironment and the clinical prognosis of patients.

The spatial distribution of CD79A+ B cells. (A) Representative polychromatic staining of breast cancer patients: DAPI (blue), CD3 (yellow), CD79A (green), PANCK (gray). (B) Spatial proximity analysis. (C) Representation of the spatial distribution of CD79A+ B cells within the distance gradients of tumor cells subpopulation (0-50 μm, 50-100 μm, 100-150 μm, 150-200 μm, and 200-250 μm). (D) Kaplan–Meier survival curves of patients with different IHC scores associated with CD79A.
Detailed Clinical Information of the Spatial Proximity Analysis Cohort.
Discussion
Breast cancer is a critical issue in women’s health globally, known for its diverse manifestations from early stages to metastasis. 35 Researchers have delved into its molecular mechanisms, pathology, and prognostic factors, 36 yet significant clinical challenges persist despite advancements in treatment. 37 The advent of scRNA-seq technology offers new insights into breast cancer’s cellular diversity, especially immune cells in the tumor microenvironment.38,39 Understanding these subsets, including CD79A+ B cells, could illuminate their impact on clinical outcomes and tumor immunity in breast cancer.
In this study, the differentially expressed genes of CD79A in B cells were screened, and RPL11, QPRT, IGHA1, SNX3, MRPL16, and NFKBIA were most relevant to breast cancer prognosis. These genes may reflect malignant potential, treatment resistance, and immune cell infiltration status. RPL11, a ribosomal protein involved in regulating cell growth and apoptosis, is implicated in tumor progression and poor prognosis. 40 QPRT, highly expressed in HER2-positive breast cancers, 41 is linked to macrophage function and immune regulation through PI3K-AKT and Wnt pathways.42,43 IGHA1, as part of membrane-bound or secreted immunoglobulins, indicates active B-cell responses in the tumor microenvironment and may reflect favorable outcomes.44 -46 SNX3 affects dendritic cell function and EGFR signaling, especially in triple-negative breast cancer, suggesting its role in tumor progression and immune evasion.47,48 MRPL16, involved in mitochondrial function, is associated with improved survival in breast cancer.49,50 NFKBIA regulates the NF-κB pathway, a key driver of proliferation and invasion in various cancers including breast cancer. 51
Based on the prognostic signature constructed by the above genes, all breast cancer patients were divided into high and low risk groups according to the median risk score. We analyzed the infiltration of immune cells in the high and low risk groups. Low-risk patients had greater infiltration of naive B cells, plasma cells, CD8+ T cells, and γδ T cells, suggesting a more active anti-tumor immune landscape. Plasma cells and CD8+ T cells enhance humoral and cytotoxic responses, respectively, and are both linked to better outcomes and immunotherapeutic responsiveness.52 -55 γδ T cells, particularly Vδ1 cells, exert dual mechanisms of tumor suppression and correlate with favorable prognosis.56 -60 Conversely, high-risk patients showed elevated M0 and M2 macrophages, which promote immunosuppression and metastasis. TAMs, particularly M2-type, contribute to immune escape and poor prognosis by producing IL-10 and supporting tumor progression.61 -64 The imbalance between M1 and M2 macrophages plays a central role in breast cancer immune evasion and resistance.65,66
CD79A, also known as CD79α, IgM-α, and Ig-α, is an integral part of the B-cell receptor (BCR) complex. 67 CD79A is mainly expressed on B cells and B-cell tumors. Its expression precedes immunoglobulin (Ig) heavy chain gene rearrangement and CD20 expression during B-cell ontogeny, 68 marking the early stages of B-cell development. The presence of CD79A is critical for the proper assembly and function of the BCR complex. Mutations or deficiencies in CD79A can lead to impaired B-cell development and function, resulting in immunodeficiency disorders. Antibodies targeting CD79A have proven to be valuable in differentiating B-cell neoplasms from T-cell or myeloid neoplasms. 69 These antibodies can specifically bind to CD79A, making it easier to identify B-cell lineage in various hematological malignancies. We found that the MIF signaling pathway plays a key role in the interactions between CD79A+ B cells and other immune cells as well as tumor cells, suggesting that the MIF signaling pathway may play a role in regulating the localization of B cells in the tumor microenvironment. The MIF signaling pathway involves MIF interacting with receptors on the surface of immune cells, such as CD74, CXCR4, CD44, resulting in various downstream effects that affect cell migration, survival, and cytokine production.70,71 If B cells express MIF receptors, such as CD74, they may be attracted to regions with high concentrations of MIF, which are typically found in and around tumors. This could explain the proximity of B cells to tumor cells. Activation of the MIF signaling pathway may promote an immunosuppressive environment that contributes to tumor growth and metastasis. This suggests that interventions targeting the MIF signaling pathway may alter the behavior of B cells in the tumor microenvironment, providing new therapeutic strategies.
The close interaction between tumor cell subsets and CD79A+ B cells, which may be a key factor in the immune response, was found by using multiple immunofluorescence techniques and spatial proximity analysis. This interaction is supported by research indicating that B cells within TME can produce antibodies and cytokines that influence tumor progression. These B cells can differentiate into regulatory B cells (Bregs) and plasma cells, affecting tumor growth positively or negatively depending on the secreted factor. 72 In addition, CD79A, as a key component of the BCR complex, plays an important role in signaling pathways that influence normal and malignant B cell function, contributing to the immune landscape within TME. Recent findings also suggest that B cells can support anti-tumor immune responses by producing antibodies and cytokines that activate other immune cells, such as T cells and natural killer (NK) cells. 73
This study also has some limitations. First, reliance on publicly available data sets may limit the applicability of research findings. While a large sample size has advantages for robust statistical analysis, the diversity of data sets can introduce bias. In addition, differences in sequencing methods and depth between different databases may also affect the consistency of data analysis. Second, results based on bioinformatics analysis may require more in-depth biological experimental validation, which is not possible due to resource constraints to conduct more in-depth biological experiments to elucidate the specific mechanisms of the findings. Finally, there may be limitations to the function of CD79A+ B cells in the tumor microenvironment and their communication with other cell types. Although the study identified the interaction between CD79A+ B cells and tumor cells through immunoassay and immunofluorescence analysis, further biological experiments may be needed to verify the specific mechanism of action, which is also a limitation due to resource constraints. Therefore, future studies need to include a broader and diverse data set, employ a rigorous experimental design to validate the study findings, and provide greater insight into understanding the mechanisms of action of CD79A+ B cells in the development of breast cancer.
Conclusion
In summary, the study combined scRNA-seq and bulk RNA-seq analysis to delineate the transcriptomic profile of CD79A+ B cell subtype in breast cancer, and revealed the interaction between CD79A+ B cell subtype and other cell populations, as well as the trajectory of B cell development and differentiation. The positive regulatory effects of CD79A+ B cells on the prognosis and immune microenvironment of breast cancer were confirmed. This will contribute to further study of the treatment and prognosis of breast cancer.
Footnotes
Acknowledgements
We would like to express our heartfelt gratitude to the TCGA database and GEO database for providing valuable resources for data analysis. We also thank Figdraw platform provides part of the drawing material and thank TissueGnostics Asia Pacific limited (Beijing, China) for their technical support in the analysis of multi-immunofluorescence staining images.
Ethical Considerations
The relevant content of this study has been approved by the Medical Ethics Committee of the First Affiliated Hospital of the University of South China (No. 2024LL0515001).
Consent to Participate
As this is a retrospective study that does not involve patient identity information or privacy and poses no risks or harm, it has been granted exemption from informed consent by the Ethics Committee.
Author Contributions
TZ, HH, and WZ conceived and designed the study. HH, WZ, HZ, BH, TY, SW, and JZ conducted data analysis. HH, WZ, and HZ drafted the manuscript. TZ and HH strictly revised the manuscript. The final manuscript was reviewed and approved by all authors.
Funding
The author(s) disclosed receipt of the following financial support for the research, authorship, and/or publication of this article: This study received funding from the National Natural Science Foundation of China (grant number 82003802), the Natural Science Foundation of Hunan Province (grant numbers 2019JJ50542, 2023JJ50156 and 2025JJ90146), the Science and Technology Program of Hunan Health Commission (grant number 20201978), the China Scholarship Council (grant number 201808430085), Clinical Research 4310 Program of the First Affiliated Hospital of the University of South China (grant number 20224310NHYCG04) and Science and Technology Innovation Program of Hengyang City (grant number 202250045223).
Declaration of Conflicting Interests
The author(s) declared no potential conflicts of interest with respect to the research, authorship, and/or publication of this article.
Data Availability Statement
All raw data used in this study are available in the UCSC xenabrowser (https://xenabrowser.net/) and GEO database (![]() ).
).