
Abstract
Background
Canopy FGF signalling regulator 3 (CNPY3) is involved in immune regulation, tumorigenesis and development, nevertheless, its role in glioma remains largely unexplored. Our study aimed to explore the regulatory role of CNPY3 as a prognostic biomarker in human glioma cell migration, invasion and immune infiltration.
Methods
Bioinformatics analysis of CNPY3 and clinical relevance of glioma in public databases was performed. COX regression analysis was performed to assess the relationship between CNPY3 and glioma prognosis. GO and Kyoto Encyclopedia of Genes and Genomes analyses were conducted to predict the signaling pathways of CNPY3 in gliomas. Tumor immune infiltration was explored using TIMER, CIBERSORT, and Pearson correlation analysis. GSVA analysis and single-cell sequencing data were employed for further validation. The effects of CNPY3 on the migration and invasion of glioma cells were investigated through cell scratch assay and transwell assay.
Results
CNPY3 was positively correlated with IDH mutation status, 1p/19q status, histopathologic grade, and MGMT promoter methylation status, but negatively with the overall survival of glioma patients (P < 0.05). CNPY3 was significantly associated with tumor immune response, inflammatory response, and lipopolysaccharide-mediated signaling pathway. CNPY3 influenced different types of immune cells which affected the immune microenvironment of glioma. CNPY3 promoted the increase of M2 macrophage and was negatively correlated with the positive regulation of macrophages apoptotic process. In vitro data suggested the promotion of CNPY3 in U87MG cells was associated with an increased capacity for cell migration and invasion (P < 0.05). Tumor drug sensitivity analysis showed more sensitivity towards temozolomide, irinotecan, and cisplatin among high CNPY3 expression patients (P < 0.05).
Conclusion
Increased CNPY3 expression impacts the immune microenvironment of glioma and enhances the migration and invasion of glioma. CNPY3 is recommended as a prognostic biomarker for glioma patients.
Introduction
Glioma, a prevalent malignant brain tumor, exhibits notable characteristics including rapid infiltrating growth, multilayered heterogeneity, and a pronounced inhibitory tumor immune microenvironment. 1 It is reported that approximately 50% of glioma patients present with glioblastoma multiforme (GBM). 2 The current consensus on optimal treatment for high-grade glioma is optimal tumor resection coupled with adjuvant radiotherapy combined oral temozolomide chemotherapy. 3 Despite comprehensive treatment, however, the prognosis for glioma patients remains unsatisfactory. It is reported that the median survival period for low-grade glioma (LGG) patients is 5∼10 years, whereas for GBM patients, the survival period is merely 14.6 months. 4 The immunosuppressive tumor microenvironment, which can lead to tumor immune escape by suppressing immune cells or regulating the expression of relevant cytokines, can cause poor prognosis of glioma patients.5–7 Many studies have found that certain molecular biomarkers play a significant role in determining the sensitivity of gliomas to radiotherapy and chemotherapy, as well as in predicting patient prognosis.7–10 As such, it is crucial to investigate the molecular mechanism driving the progression of glioma to inform targeted interventions in the biological process of the tumor and accurate prediction of the prognosis of glioma patients. Such endeavors hold promise in providing new therapeutic strategies tailored for the specific needs of glioma patients.
Canopy FGF signalling regulator 3 (CNPY3), which is highly conserved among a variety of species,11,12 is widely expressed, with highest levels in neurons, gastrointestinal tract, and other glandular epithelia.13,14 CNPY3 protein serves as a specific molecular chaperone for Toll-like receptors (TLRs) which assists TLRs in proper folding and transportation. 15 The TLR family is pivotal to the specific and nonspecific immunity.16,17 Human CNPY3 consists of 278 amino acids, including 6 cysteine residues, a feature shared with saposin-like proteins that form a shell-like dimer. 18 Given that saposin-like proteins are known for their antimicrobial and cytolytic activities which are closely associated with innate immune responses, 19 it is reasonable to infer that CNPY3 is related closely to innate and adaptive immune responses. In addition, CNPY3 regulates the auto-activation of caspase-1 and release of interleukin-1β that can effectively activate the inflammasome in human macrophages. 16 It is reported that Biallelic CNPY3 Variants lead to early-onset epileptic encephalopathies. 20 Furthermore, CNPY3 also influences tumor progression. Specifically, the SLITRK4-CNPY3 axis has been found to enhance liver metastasis of gastric cancer by promoting endocytosis and recycling of tyrosine kinase receptor B (TrkB) in gastric cancer cells. 21 Overall, CNPY3 is evidently involved in regulating cellular stress responses.
To date, nevertheless, it is still unknown how CNPY3 influences tumor immune response, tumorigenesis, and progression. To address this gap, we explored CNPY3 in terms of its specific expression, immunological characteristics, and prognostic value in glioma through bioinformatics analyses. Additionally, we also examined how CNPY3 influences glioma cell migration and invasion in vitro.
Materials and methods
Data sources
Figure 1 summarizes the protocol and process of this study. The clinical information and RNA sequencing data from 168 glioblastoma patients and 529 LGG patients were obtained from The Cancer Genome Atlas (TCGA) database (https://portal.gdc.cancer.gov). The RNA sequencing data of 1152 normal brain tissue samples were obtained from the Genotype-Tissue Expression database (https://commonfund.nih.gov/gtex). In addition, RNA sequencing data and clinical information of 325 glioma patients were downloaded from the Chinese Glioma Genome Atlas (CGGA) database (http://www.cgga.org.cn). The immunohistochemistry results of glioma samples of various grades and normal brain tissue samples were gathered from the Human Protein Atlas (HPA) database (https://www.proteinatlas.org).
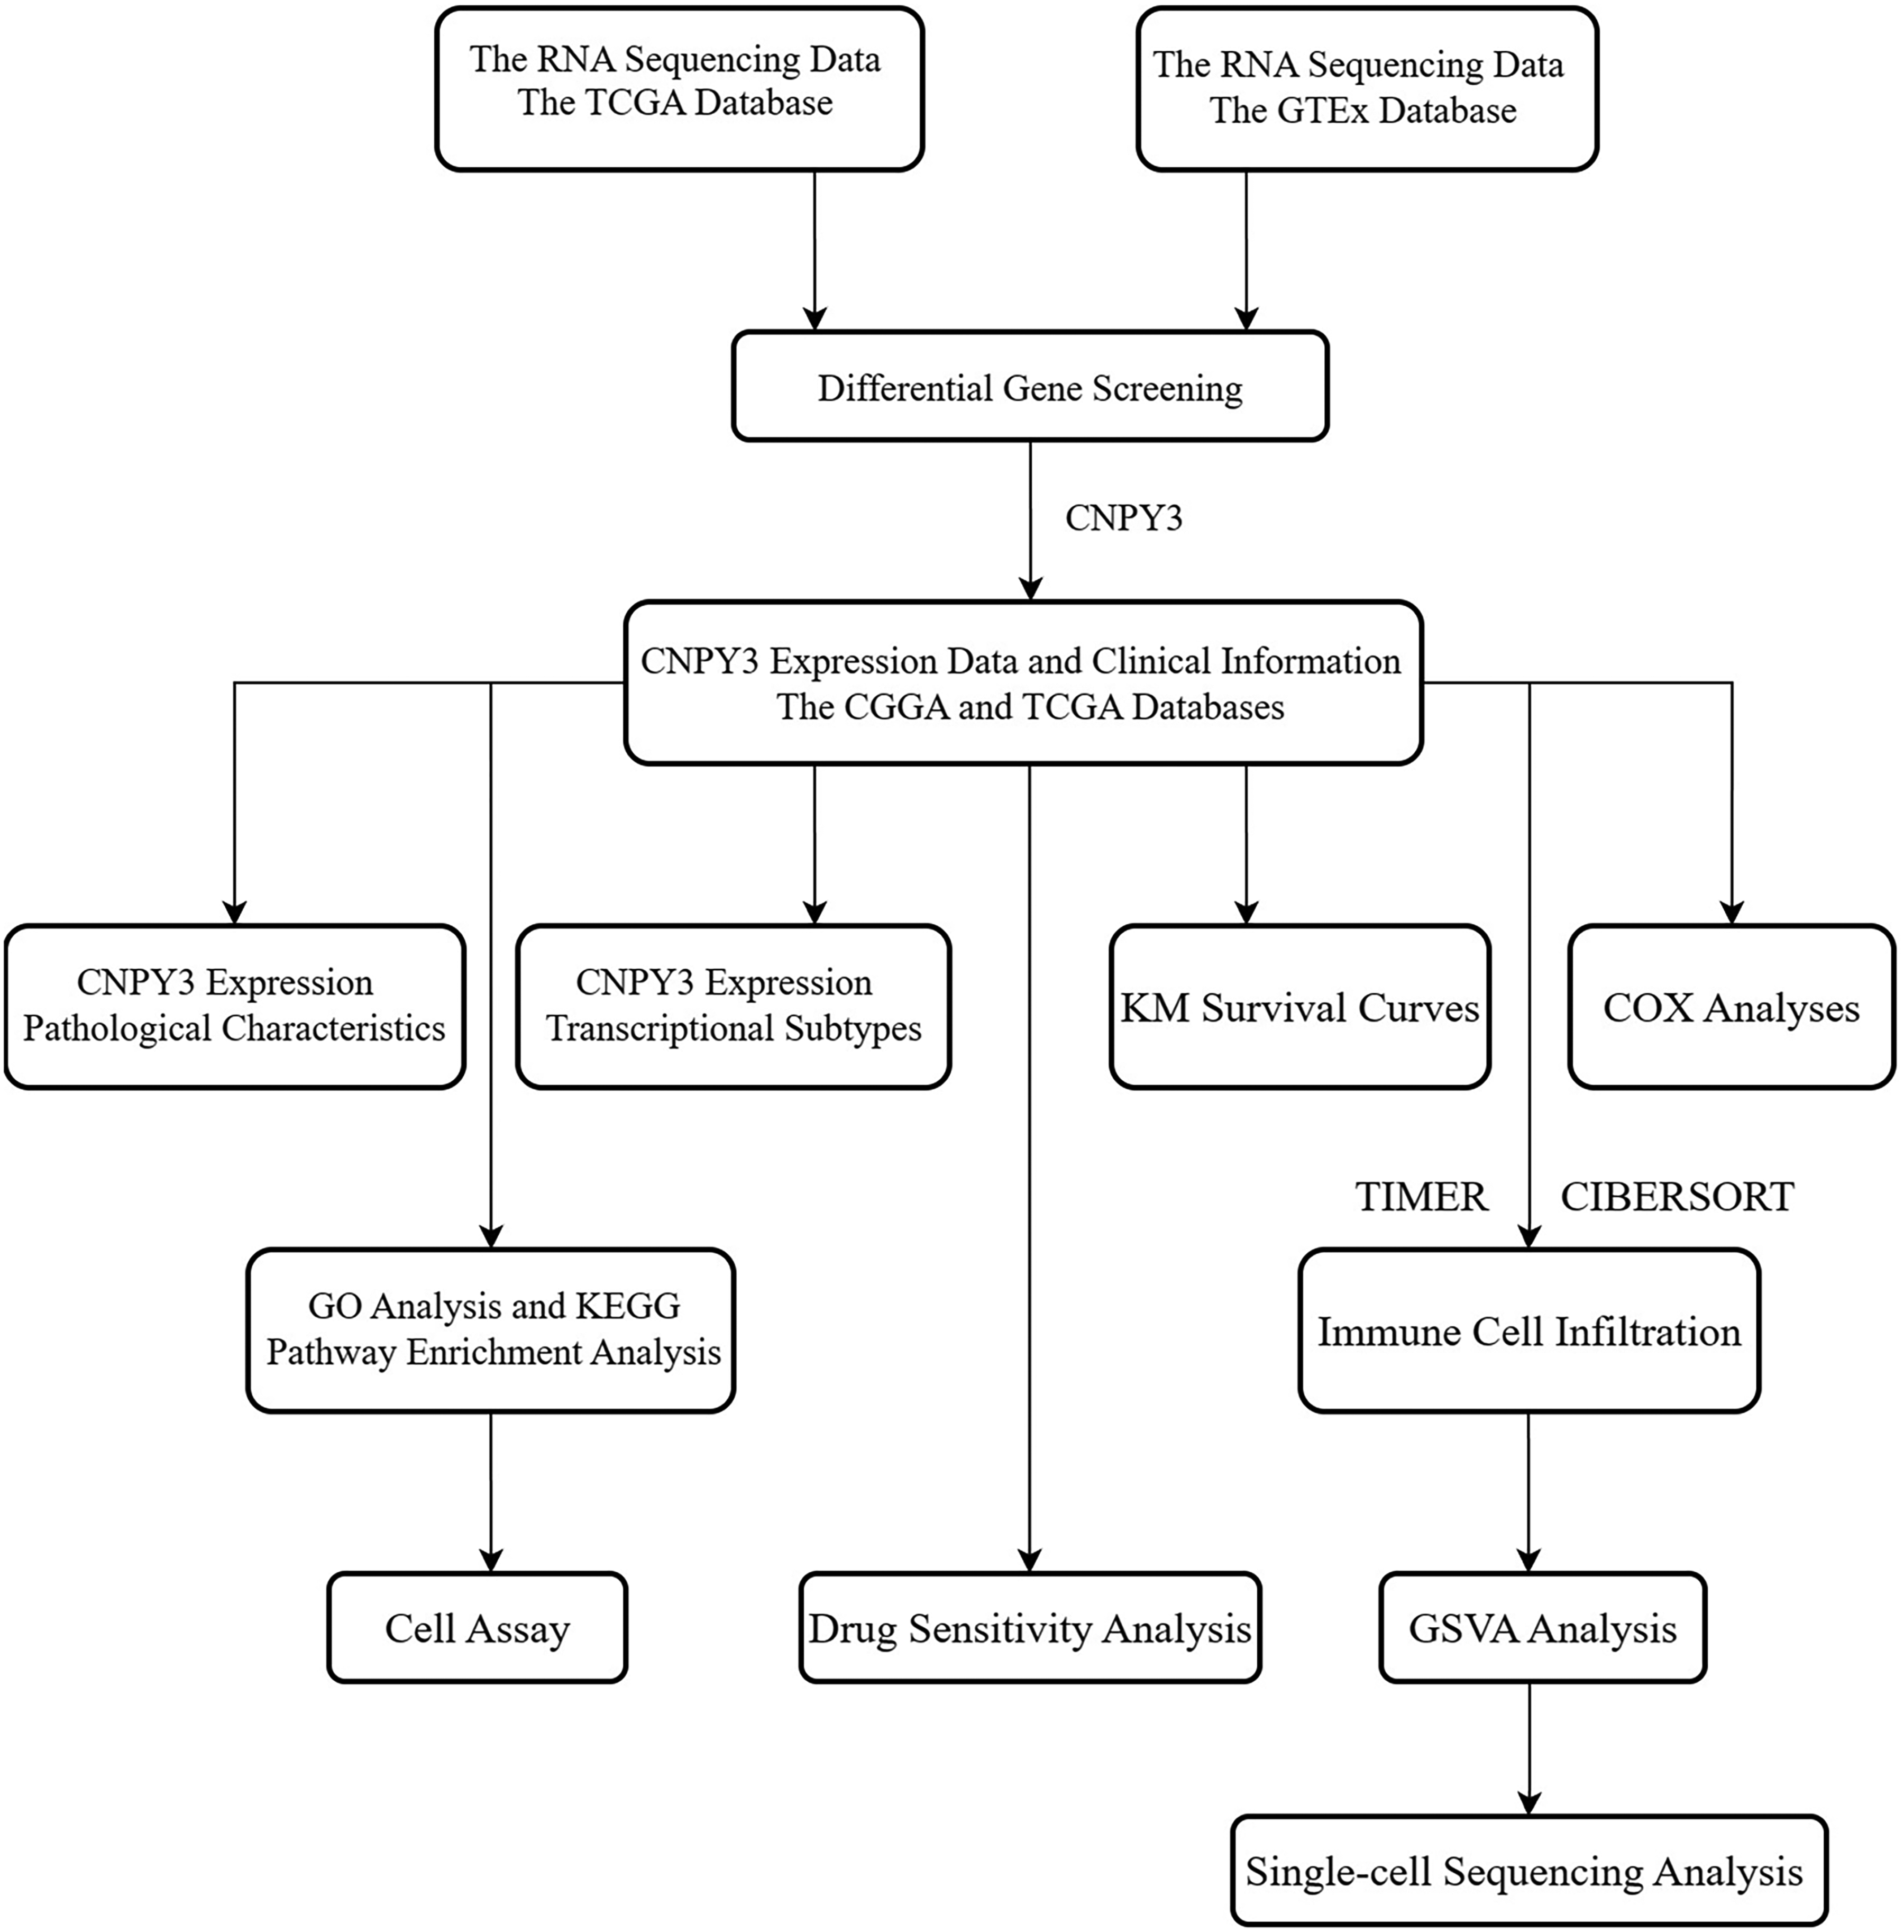
The protocol and process of this study.
Differential gene screening
The control group consisted of the mRNA sequencing data from 1152 samples of normal brain tissue. The experimental group consisted of the mRNA sequencing data from 168 GBM patients and 529 LGG patients. The differential genes were screened utilizing “limma” package in R, with a cutoff over 2 for the absolute log2FC and a P-value below 0.05. 22 Finally, the intersection of respective differential gene sets was taken to select differential genes.
Analysis of CNPY3 expression and glioma prognosis
Initially, CNPY3 expression and glioma patients’ clinical information were retrieved from the CGGA and TCGA databases. The median CNPY3 expression was employed as the threshold to categorize high expression glioma patients and low expression patients. Kaplan-Meier survival curves was used to investigate the effect of CNPY3 on the survival of glioma patients. Afterwards, the relationship of CNPY3 expression with transcriptional subtyping was examined via ROC analysis. Then, the prognosis significance of CNPY3 expression and clinical factors for glioma patient was assessed through univariate and multivariate COX regression analyses.
Analysis of gene function enrichment
Using glioma patients’ gene expression data retrieved from the CGGA and TCGA databases, the gene sets most tightly connected with CNPY3 were identified through Pearson correlation analysis. Besides, Gene Ontology (GO) analysis and Kyoto Encyclopedia of Genes and Genomes pathways were conducted on these sets. 23
Analysis of immune infiltration
The TIMER database systematically analyzes immune infiltration across various types of cancer using a variety of immune inverse plethysmography algorithms and provides visualization of tumor-infiltrating immune cells. 24 We examined how CNPY3 is linked to the infiltration level of immune cells in LGG and GBM respectively using via TIMER. Using LM22 expression data of 22 common immune infiltrate cells provided by CIBERSORT, 25 we calculated the abundance of immune cells infiltration for glioma patients.
Gene set variant analysis
A set of known immune function-related genes were retrieved from AmiGO2 website (https://amigo.soybase.org/amigo/amigo/landing), from which representative immune cell biological functions were selected. 26 To examine the link between CNPY3 expression and immune cell biological functions, CNPY3 expression in each glioma sample was transformed into an enriched score for immune cell biological functions using the GSVA package in R. Heatmaps were generated using the “heatmap” package for visualization.
Single-cell sequencing analysis
Single-cell sequencing data GSE89567 came from Gene Expression Omnibus database (https://www.ncbi.nlm.nih.gov/geo/query/acc.cgi?acc = GSE89567). Sequencing data were processed using “Seurat” package in R (Seurat Version 5.0.2). 27 Individual cells with less than 200, more than 7,500, or more than 20% mitochondrial gene expression were removed. Subsequently, genes displaying significant heterogeneity between cells were identified using the “FindVariableFeature” function, followed by Principal Component Analysis utilizing these genes. Data dimensions were determined according to ElbowPlot and 12 principal components were selected as parameters for subsequent analyses. Clustering was performed using the KNN algorithm (resolution = 0.5). Cells were clustered via Uniform Manifold Approximation and Projection dimensional reduction analysis, and the cluster biomarkers (min.pct = 0.25, logfc.threshold = 0.25) were found via FindMarkers. The cell marker database and pertinent literature on cell markers were consulted to reclassify distinct cell subgroups using representative cell markers.
Cell culture and transfection
The glioblastoma cell line U87MG was purchased from Qingqi Biotechnology (Shanghai, China). U87MG were cultured in DMEM (Gibco, Grand Island, USA) with 10% fetal bovine serum (FBS; Gibco, Grand Island, USA) and 1% penicillin/streptomycin (Solarbio Science & Technology, Beijing, China) in a 37°C humidified environment with 5% CO2. 28 CNPY3 overexpression plasmid (Miaoling Biotechnology, Wuhan, China) was transfected into U87MG cells employing Lipofectamine 3000 kit (Invitrogen, Carlsbad, USA). 29
Real-time quantitative PCR
First, TRNzol reagent was utilized to obtain total RNA from experimental cells. Afterwards, cDNA was prepared following the instructions of the reverse transcription kit (Toyobo Biotech, Shanghai, China). The cDNA samples were combined with primers, probes, DNA polymerase, and other reaction components to make qPCR reaction solution as instructed by PCR kit (Toyobo Biotech, Shanghai, China). Subsequently, the mixture was subjected to amplification using a Real-time PCR Amplifier. The primer sequences of CNPY3 (forward: 5′-CTTGCGGTTAATCGAAGTCACT-3′, reverse: 5′-TGTGTACCAGGTTGTGTAATGTC-3′) and the primer sequences of β-actin (for-ward: 5′-GGCTGTATTCCCCTCCATCG-3′, reverse: 5′-CCAGTTGGTAACAATGCCATGT-3′) were applied.
Cell scratch assay
CNPY3 overexpression plasmid was introduced into U87MG cells, and trypsin was added to digest the cells after 24 h of culture. An appropriate amount of cell suspension was collected in a centrifuge tube, and the cells were resuspended after centrifugation and cultured in the cell culture plates. After 24 h of incubation, a scratch was made perpendicular to the cell surface with a 200μl lance tip on the 6-well plate. The cell surface was washed 3 times with sterile PBS to clear suspended cells. We added Serum-free medium to each well to incubate the cells, and photographed the migrated areas of the cells at 0, 24, and 48 h, respectively. Data were analyzed using ImageJ 2.3.0.
Cell invasion assay
The upper chamber of culture plate was filled vertically with matrigel and incubated for 3 h to make the matrix gel into a film. The lower chamber was filled with 500μl of DMEM containing 10% FBS. The upper chamber lined with matrix gel was placed inside the plate. After adding 200μl of cell suspension to the upper chamber, we incubated the cells for 48 h. We fixed the cells with 4% paraformaldehyde (Beyotime, Shanghai, China) for 30 min at room temperature before staining them using crystal violet. The cells were observed in randomly chosen fields under the microscope and calculated, and the average value was taken.
Chemotherapy drug sensitivity analysis
RNA sequencing data and glioma patients’ clinical data were downloaded from TCGA database. Sensitivity of each sample to multiple chemotherapeutic drugs was predicted using the “oncoPredict” package in the R to analyze data from the Genomics of Drug Sensitivity in Cancer (GDSC) database. The final results of sensitivity analyses related to chemotherapeutic drugs for glioma were obtained. 30
Statistical analysis
R 4.0.3 and SPSS 28 were utilized to perform statistical analyses. Means ± standard error of the means (SEM) or standard deviation (SD) was used to present the data. A P-value < 0.05 was regarded valid (* for P < 0.05, ** for P < 0.01, *** for P < 0.001, **** for P < 0.0001). For comparisons between two groups, Student's t test was employed, and analysis of variance (ANOVA) was utilized for multiple groups. To investigate the differential expression of CNPY3 in normal brain tissues and tumor tissues, Wilcoxon signed-rank tests and ANOVA were performed. Dunn's test and Kruskal-Wallis test were run to assess the connection between CNPY3 expression and clinicopathological features. The significance of CNPY3 expression for the prognosis of the patients was assessed utilizing Kaplan-Meier and COX regression analyses. How CNPY3 expression was linked to transcriptional subtyping of glioma was analyzed using ANOVA.
Results
CNPY3 is differentially expressed in normal brain tissues and glioma tissues
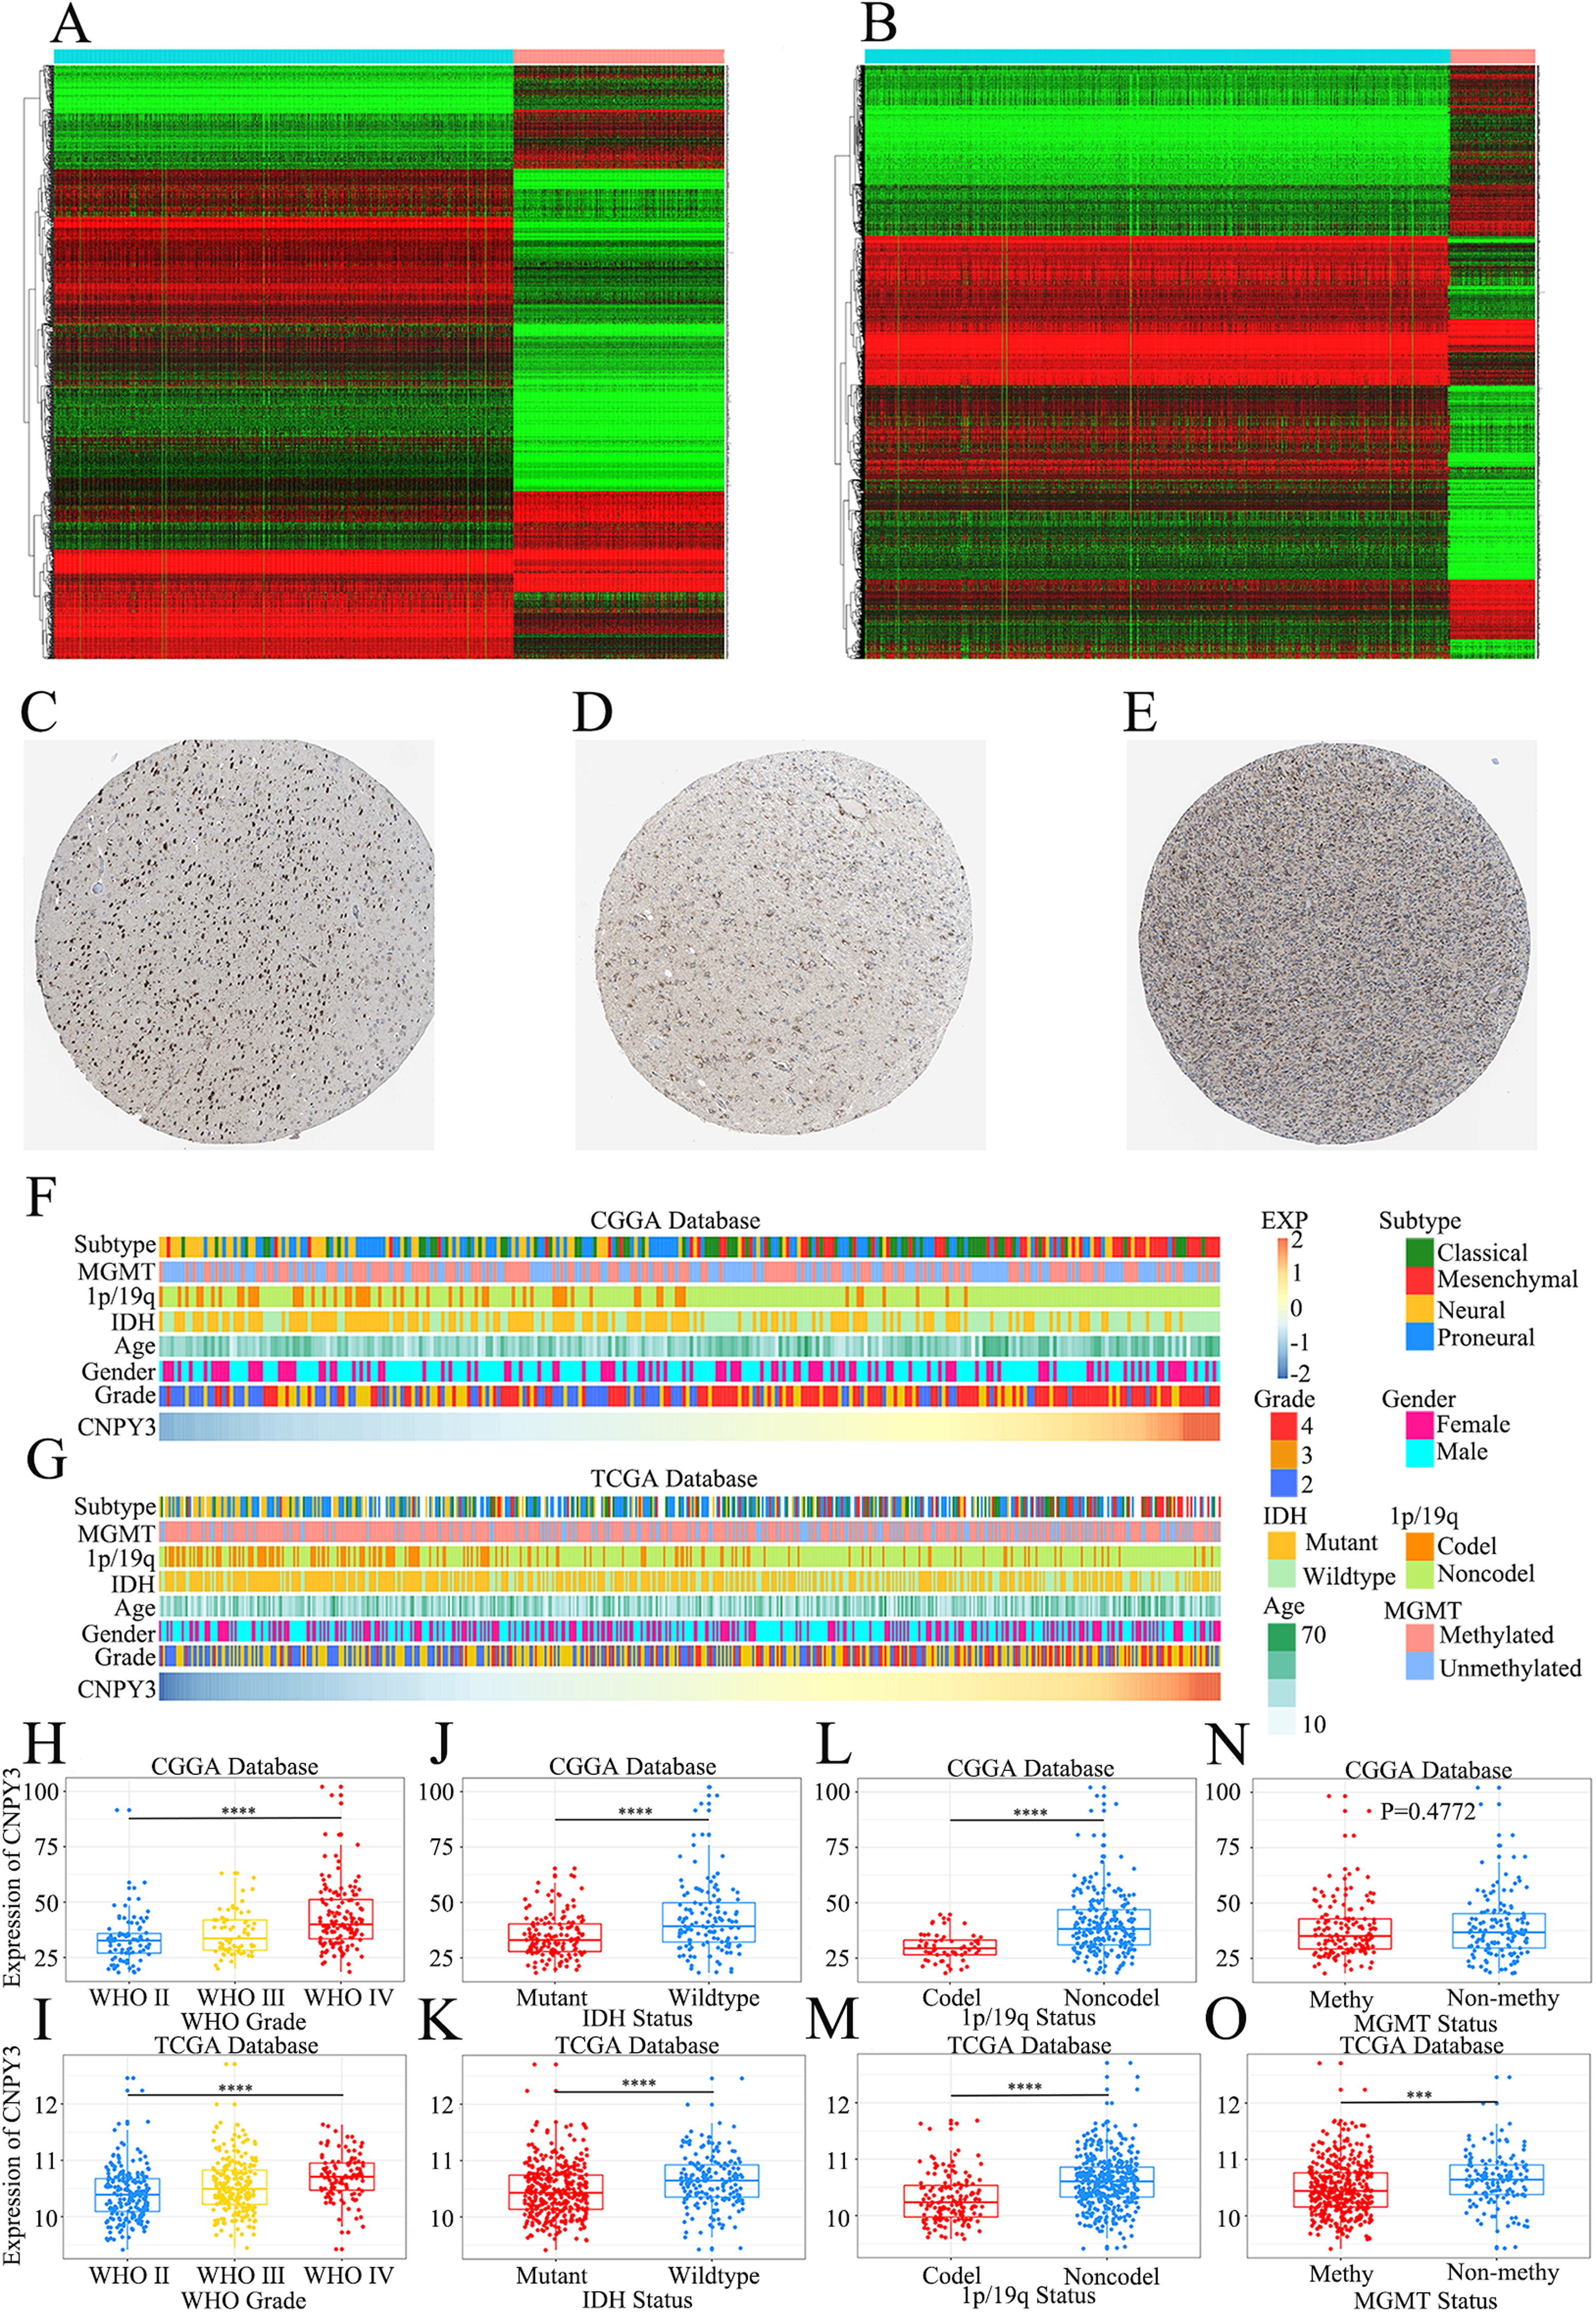
Figure 2(A) displays the differentially expressed genes in normal brain tissues and LGG samples, and Figure 2(B) illustrates those in normal brain tissues and glioblastoma samples. The intersection of these two sets yielded genes that are characteristic of both glioblastoma and LGG. Using this gene set as a range, we screened genes with high clinical relevance that had never been investigated according to the relevant clinical features of glioma to identify CNPY3. Furthermore, informed by the clinicopathological data of glioma patients from the HPA database, differential expressions of CNPY3 between normal brain tissues and glioma were confirmed (Figure 2(C)–(E)). Collectively, these findings imply a specific expression pattern of CNPY3 in glioma, suggesting its potential involvement in tumorigenesis and progression.
CNPY3 is positively related to the malignancy of glioma.
CNPY3 is positively correlated with the malignancy of glioma
CNPY3 expression level was found to be significantly associated with WHO grade, IDH mutation status, 1p/19q status, and MGMT promoter methylation status of glioma patients (Figure 2(F)–(G)). The WHO grade of glioma patients was positively related with CNPY3 expression level (Figure 2(H)–(I)), which echoes the results of CNPY3 immunohistochemistry in the HPA database. IDH-wildtype glioma is highly aggressive, so patients with this pathology type have a poor prognosis. 31 Glioma patients without 1p/19q codeletion also have a poorer prognosis. 32 CNPY3 was expressed at a higher level in IDH-wildtype glioma patients (P < 0.001, Figure 2(J)-(K)) and glioma patients without 1p/19q codeletion (P < 0.001, Figure 2(L)–(M)). In CGGA database, CNPY3 had a trend of high expression in glioma patients without MGMT promoter methylation, but it was not statistically significant (P = 0.4772, Figure 2(N)). By contrast, in the TCGA database with a larger sample size, CNPY3 showed high expression in glioma patients without MGMT promoter methylation (P < 0.001, Figure 2(O)). Overall, it suggests that the more malignant the glioma pathology the higher the CNPY3 expression level.
CNPY3 is highly expressed in different transcriptional subtypes of GBM
Transcriptional subtyping of GBM, the most malignant type of glioma, has specific differential features that can provide guidelines for tumor-targeted therapy. 33 CNPY3 displayed high expression in various GBM transcriptional subtypes, particularly demonstrating the highest expression level in the mesenchymal subtype of GBM. The mesenchymal subtype of GBM is widely recognized as the most aggressive, often correlating with unfavorable prognostic outcomes. 34 In the CGGA database, the area under the curve of CNPY3 expression level was notably high at 79.3% (Figure 3(A)–(B)). Similarly, these findings were validated in the TCGA database (Figure 3(C)–(D)). Furthermore, we compared the area under the curve of CNPY3 with those of well-established biomarkers specifically expressed in GBM, including EGFR and BRAF. Our analyses revealed that in both the CGGA and TCGA datasets, CNPY3 exhibited a higher area under the curve than either EGFR or BRAF. 35 Collectively, our results underscored CNPY3 expression was related to the malignancy of glioma.
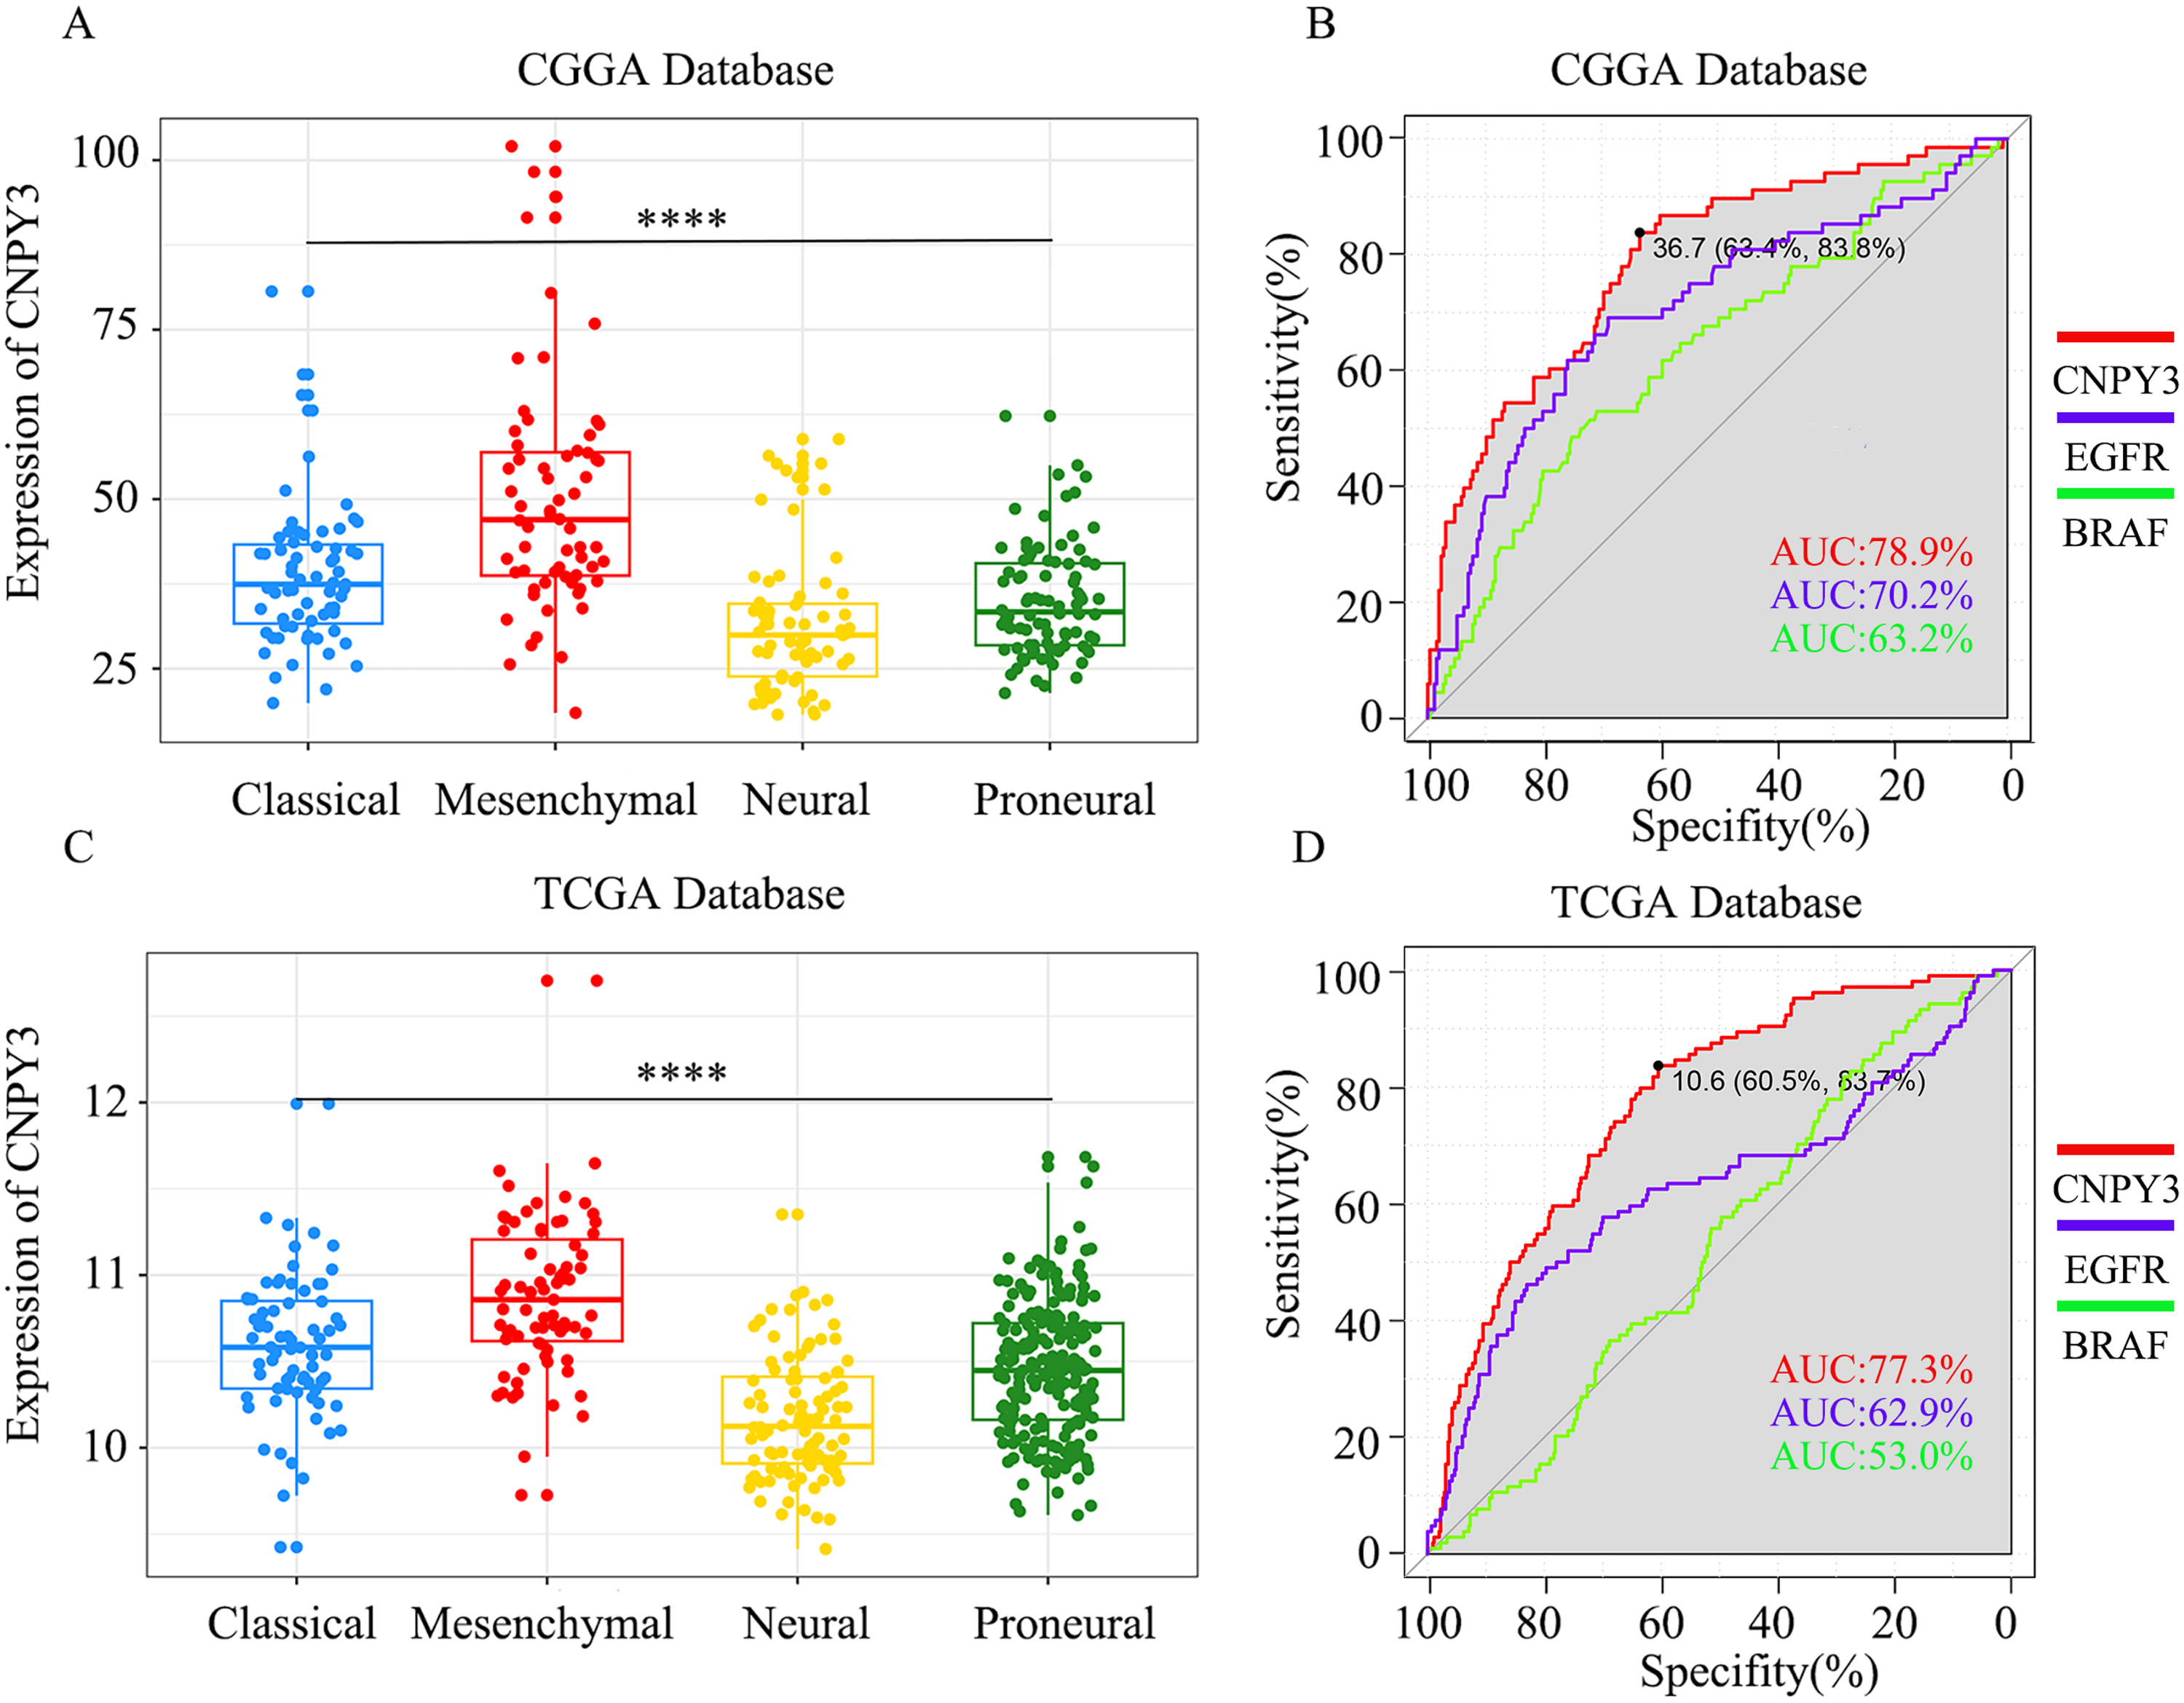
CNPY3 is highly expressed in different transcriptional subtypes of GBM. (****P < 0.0001).
CNPY3 can be used as a valuable prognostic indicator
A negative link was discovered between increased CNPY3 expression and the survival of glioma patients through Kaplan-Meier analysis (P < 0.001, Figure 4(A)–(B)). The overall survival (OS) of glioma patients were observed to closely associated with CNPY3 expression level, WHO grade, age, IDH status and 1p/19q status through univariate COX regression analysis. Incorporating these factors into the multivariate COX regression model highlighted the value of CNPY3 as a prognostic indicator (Figure 4(C)–(F)).
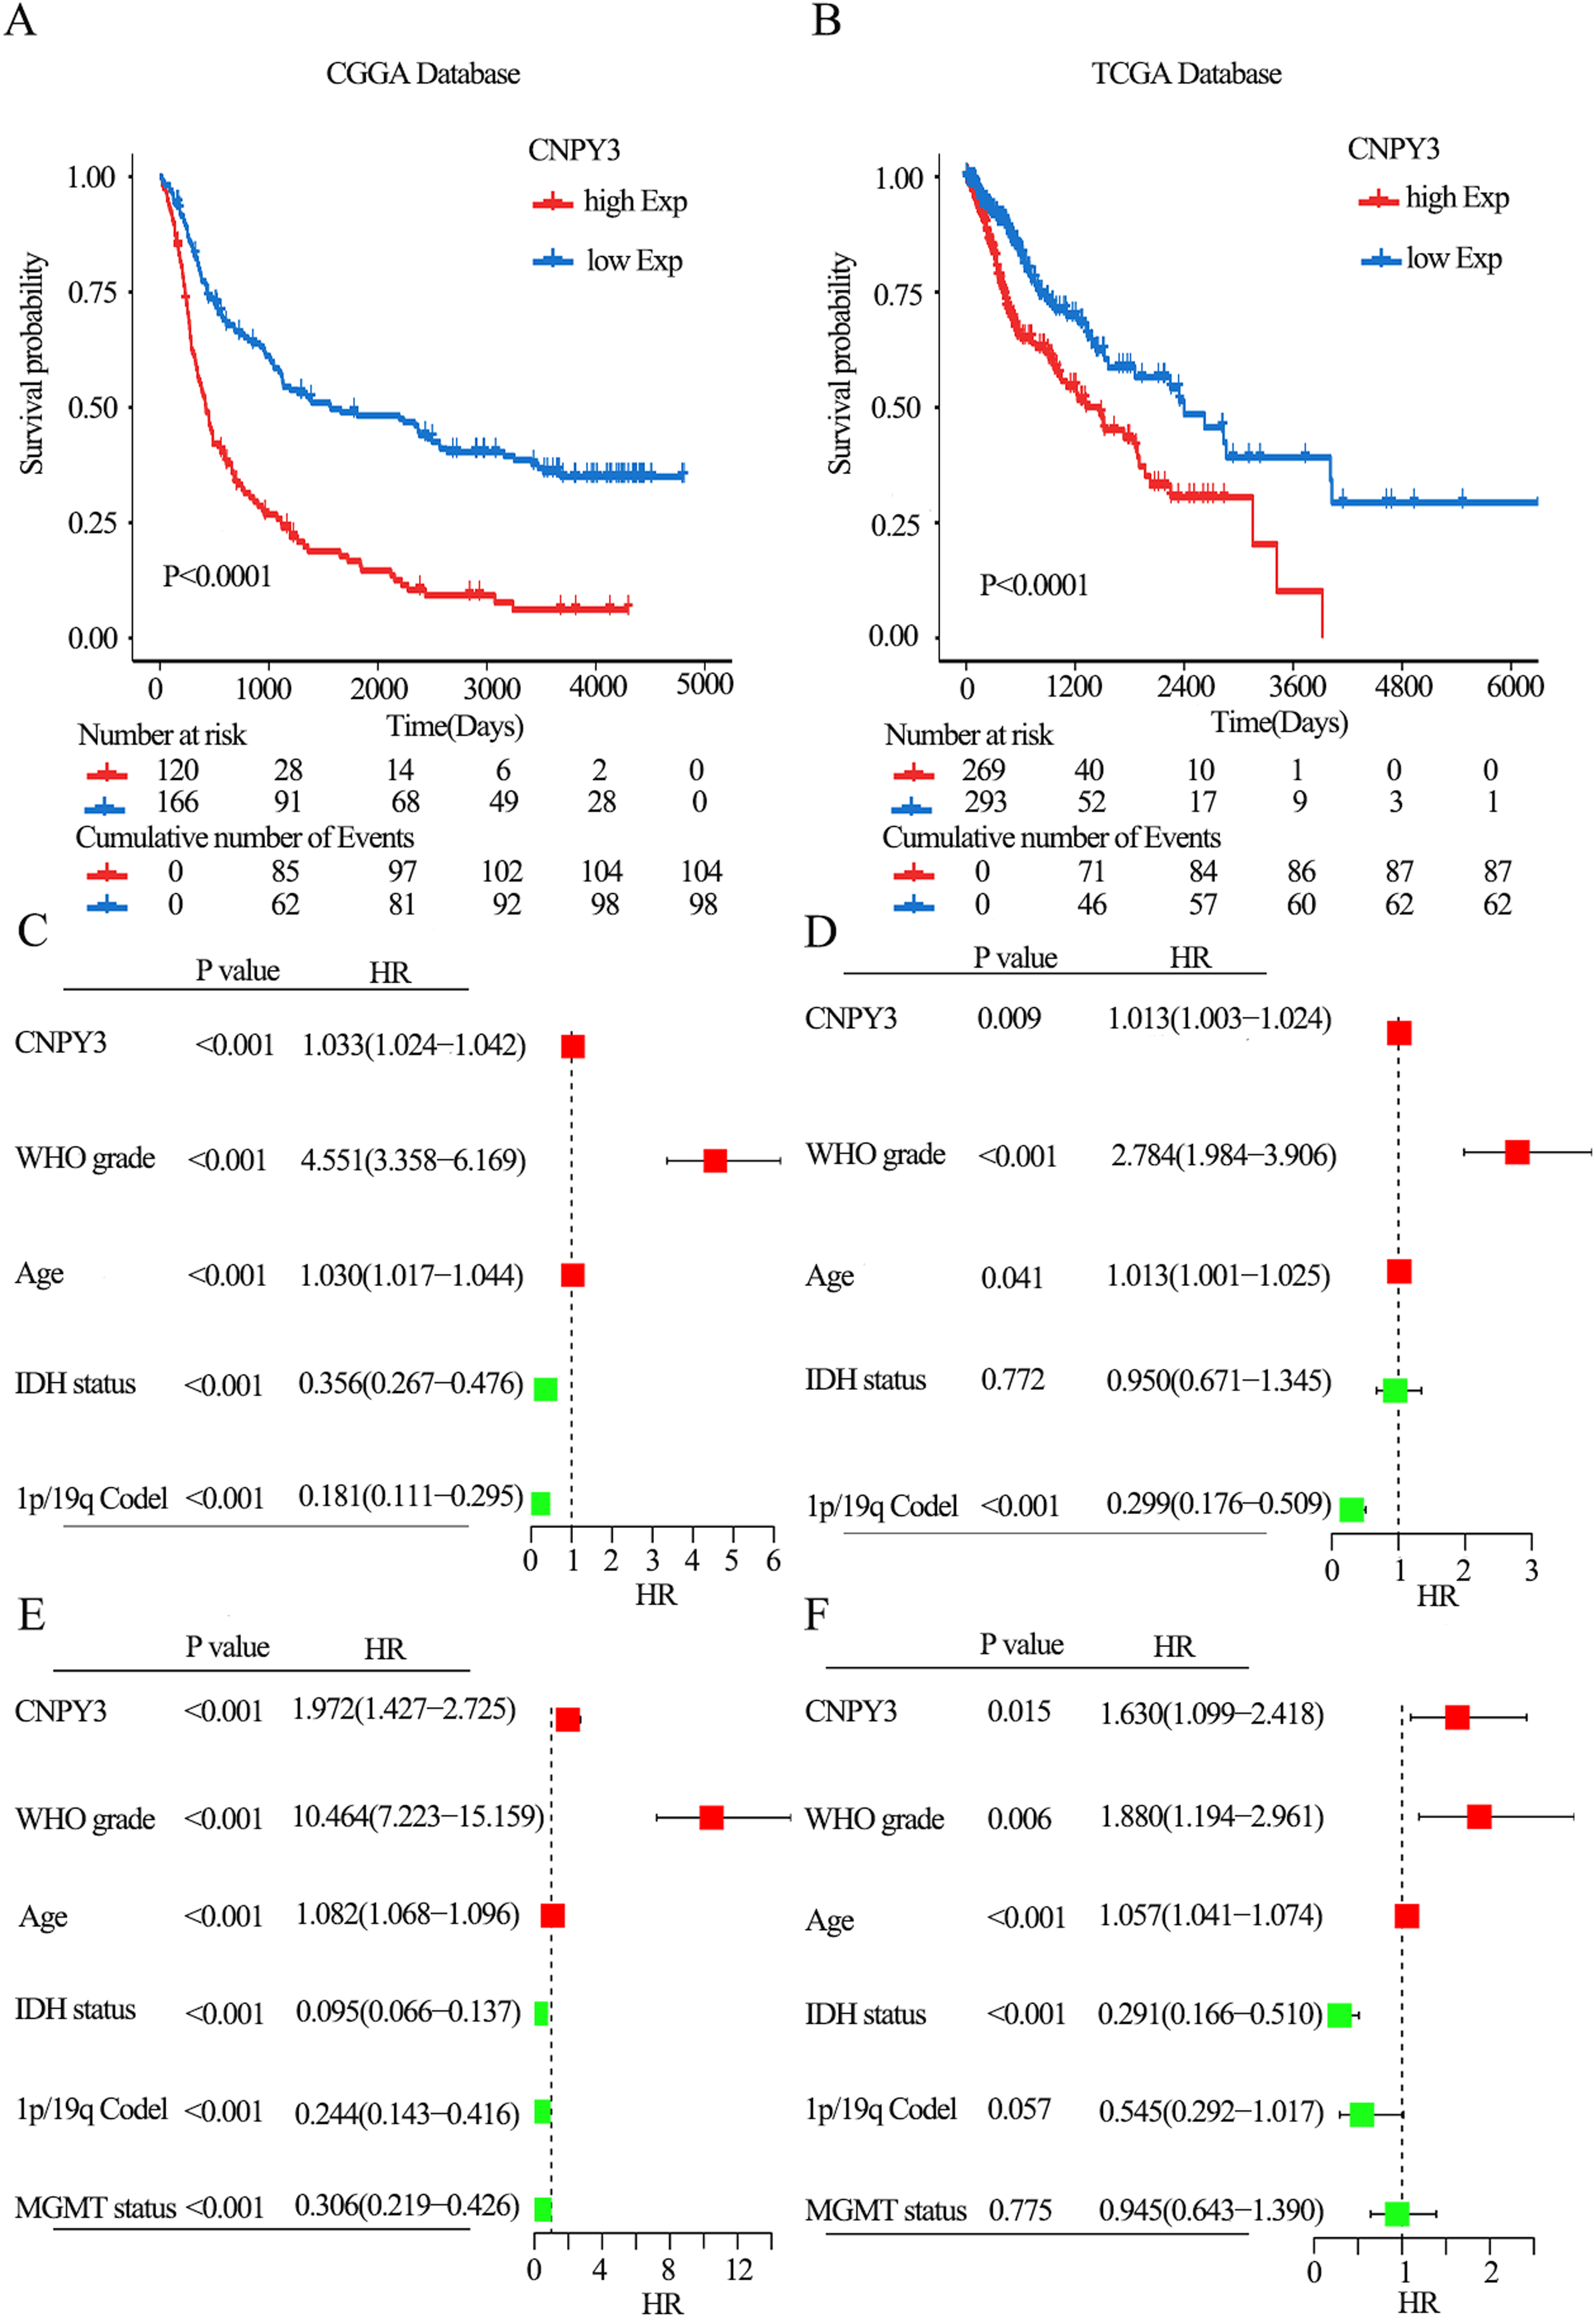
CNPY3 was an independent prognostic indicator for glioma.
CNPY3 is involved in glioma progression and linked with tumor immune response
To identify the link between the biological functions of CNPY3 and glioma, we conducted gene enrichment analysis in the CGGA and TCGA databases to obtain gene sets that are most closely associated with CNPY3. The biological processes which were most intimately connected with CNPY3 included innate immune response, signal transduction, positive regulation of production of tumor necrosis factor (TNF) and interleukin 6, etc. (Figure 5(A)–(B)). The signaling pathways most associated with CNPY3 were tuberculosis, Fcγ receptor-mediated phagocytosis, and osteoclast differentiation (Figure 5(A)–(B)). The biological processes of CNPY3 that were identical in both databases included immune response, lipopolysaccharide-mediated signaling pathway, positive regulation of TNF production, and signal transduction etc. (Figure 5(C)–(D)). In addition, the signaling pathways of CNPY3 that were identical in both databases were Fcγ receptor-mediated phagocytosis, lysosomes, B-cell receptor signaling pathway, and phagosomes (Figure 5(E)–(F)). This indicates that CNPY3 can influence the invasion and migration of glioma and the associated immune response.
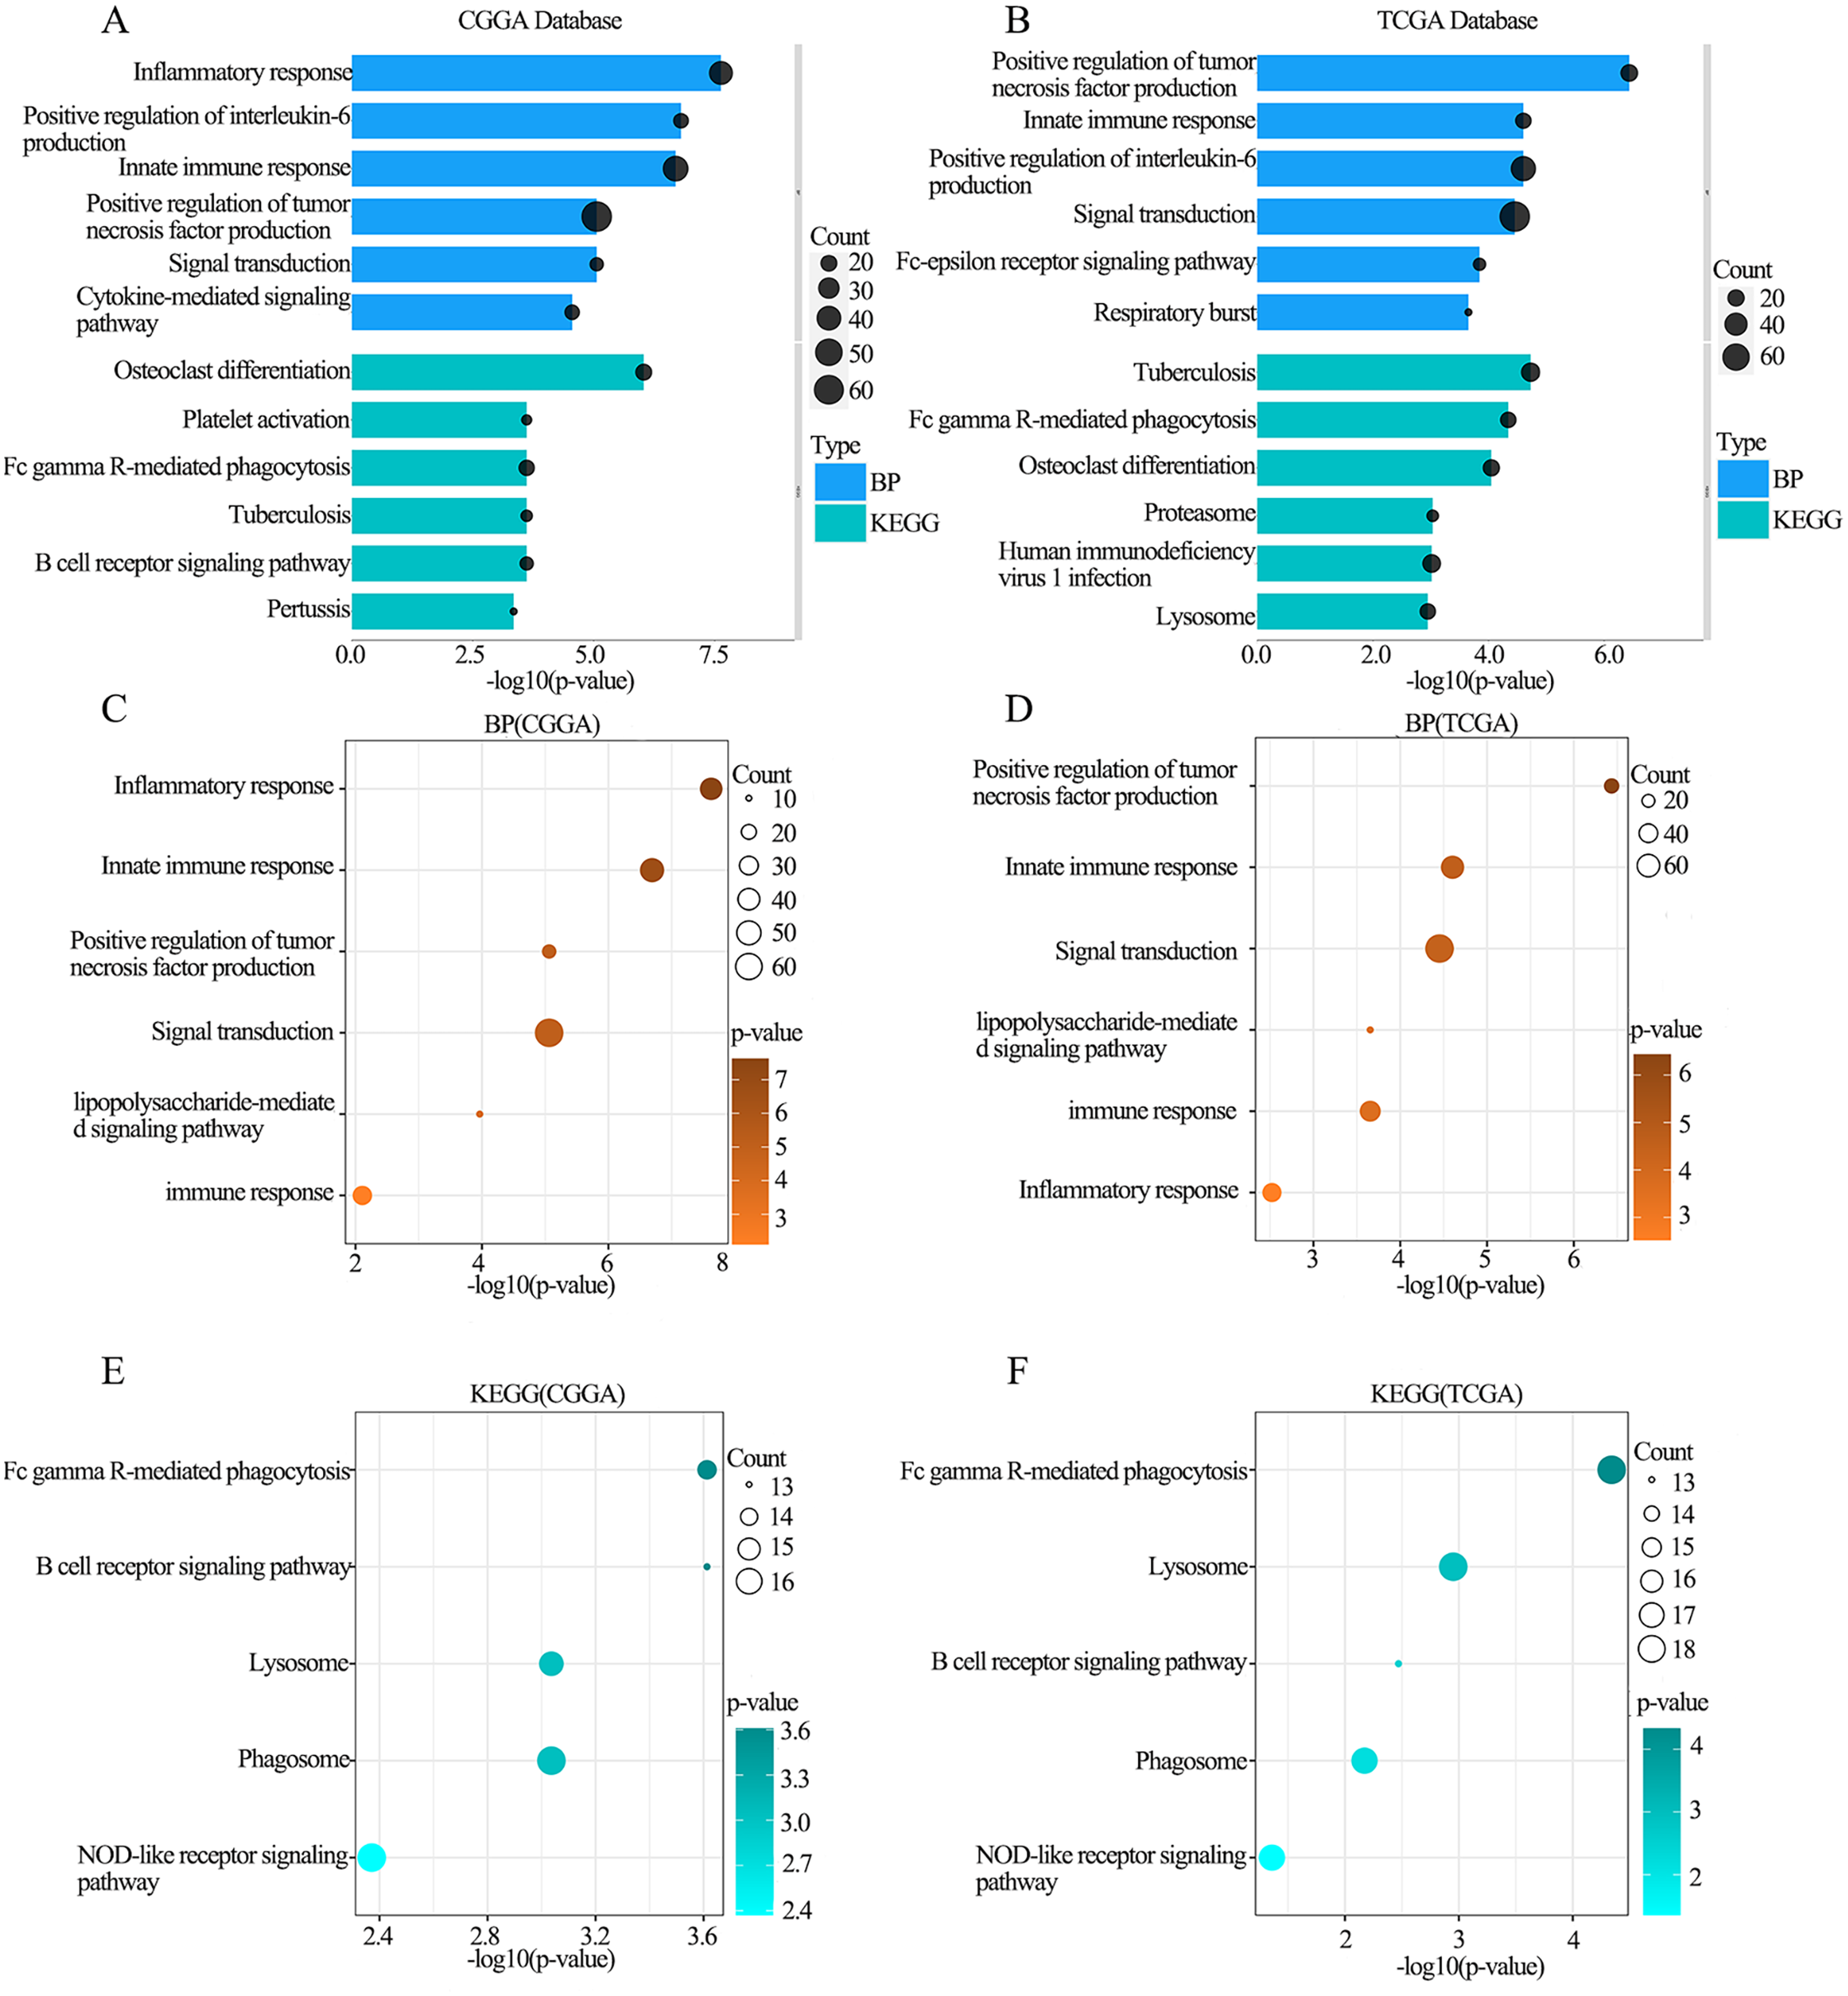
The result of gene enrichment analysis.
CNPY3 affects the level of immune infiltration in glioma
CNPY3 expression was positively related to the infiltration levels of B cells, CD4+ T cells, macrophages, neutrophils, and dendritic cells in glioma but negatively to the infiltration levels of CD8+ T cells (Figure 6(A)). CNPY3 expression was found to positively linked with the infiltration levels of M2 macrophages, CD8+ T cells, and regulatory T cells, and negatively with the infiltration levels of naive CD4+ T cells, activated NK cells, and activated mast cells, and M2 macrophages is the most abundant among them (Figure 6(B)–(C)). It suggests that CNPY3 can influence both the glioma immune infiltration and the activation and functional regulation of multiple immune cells.
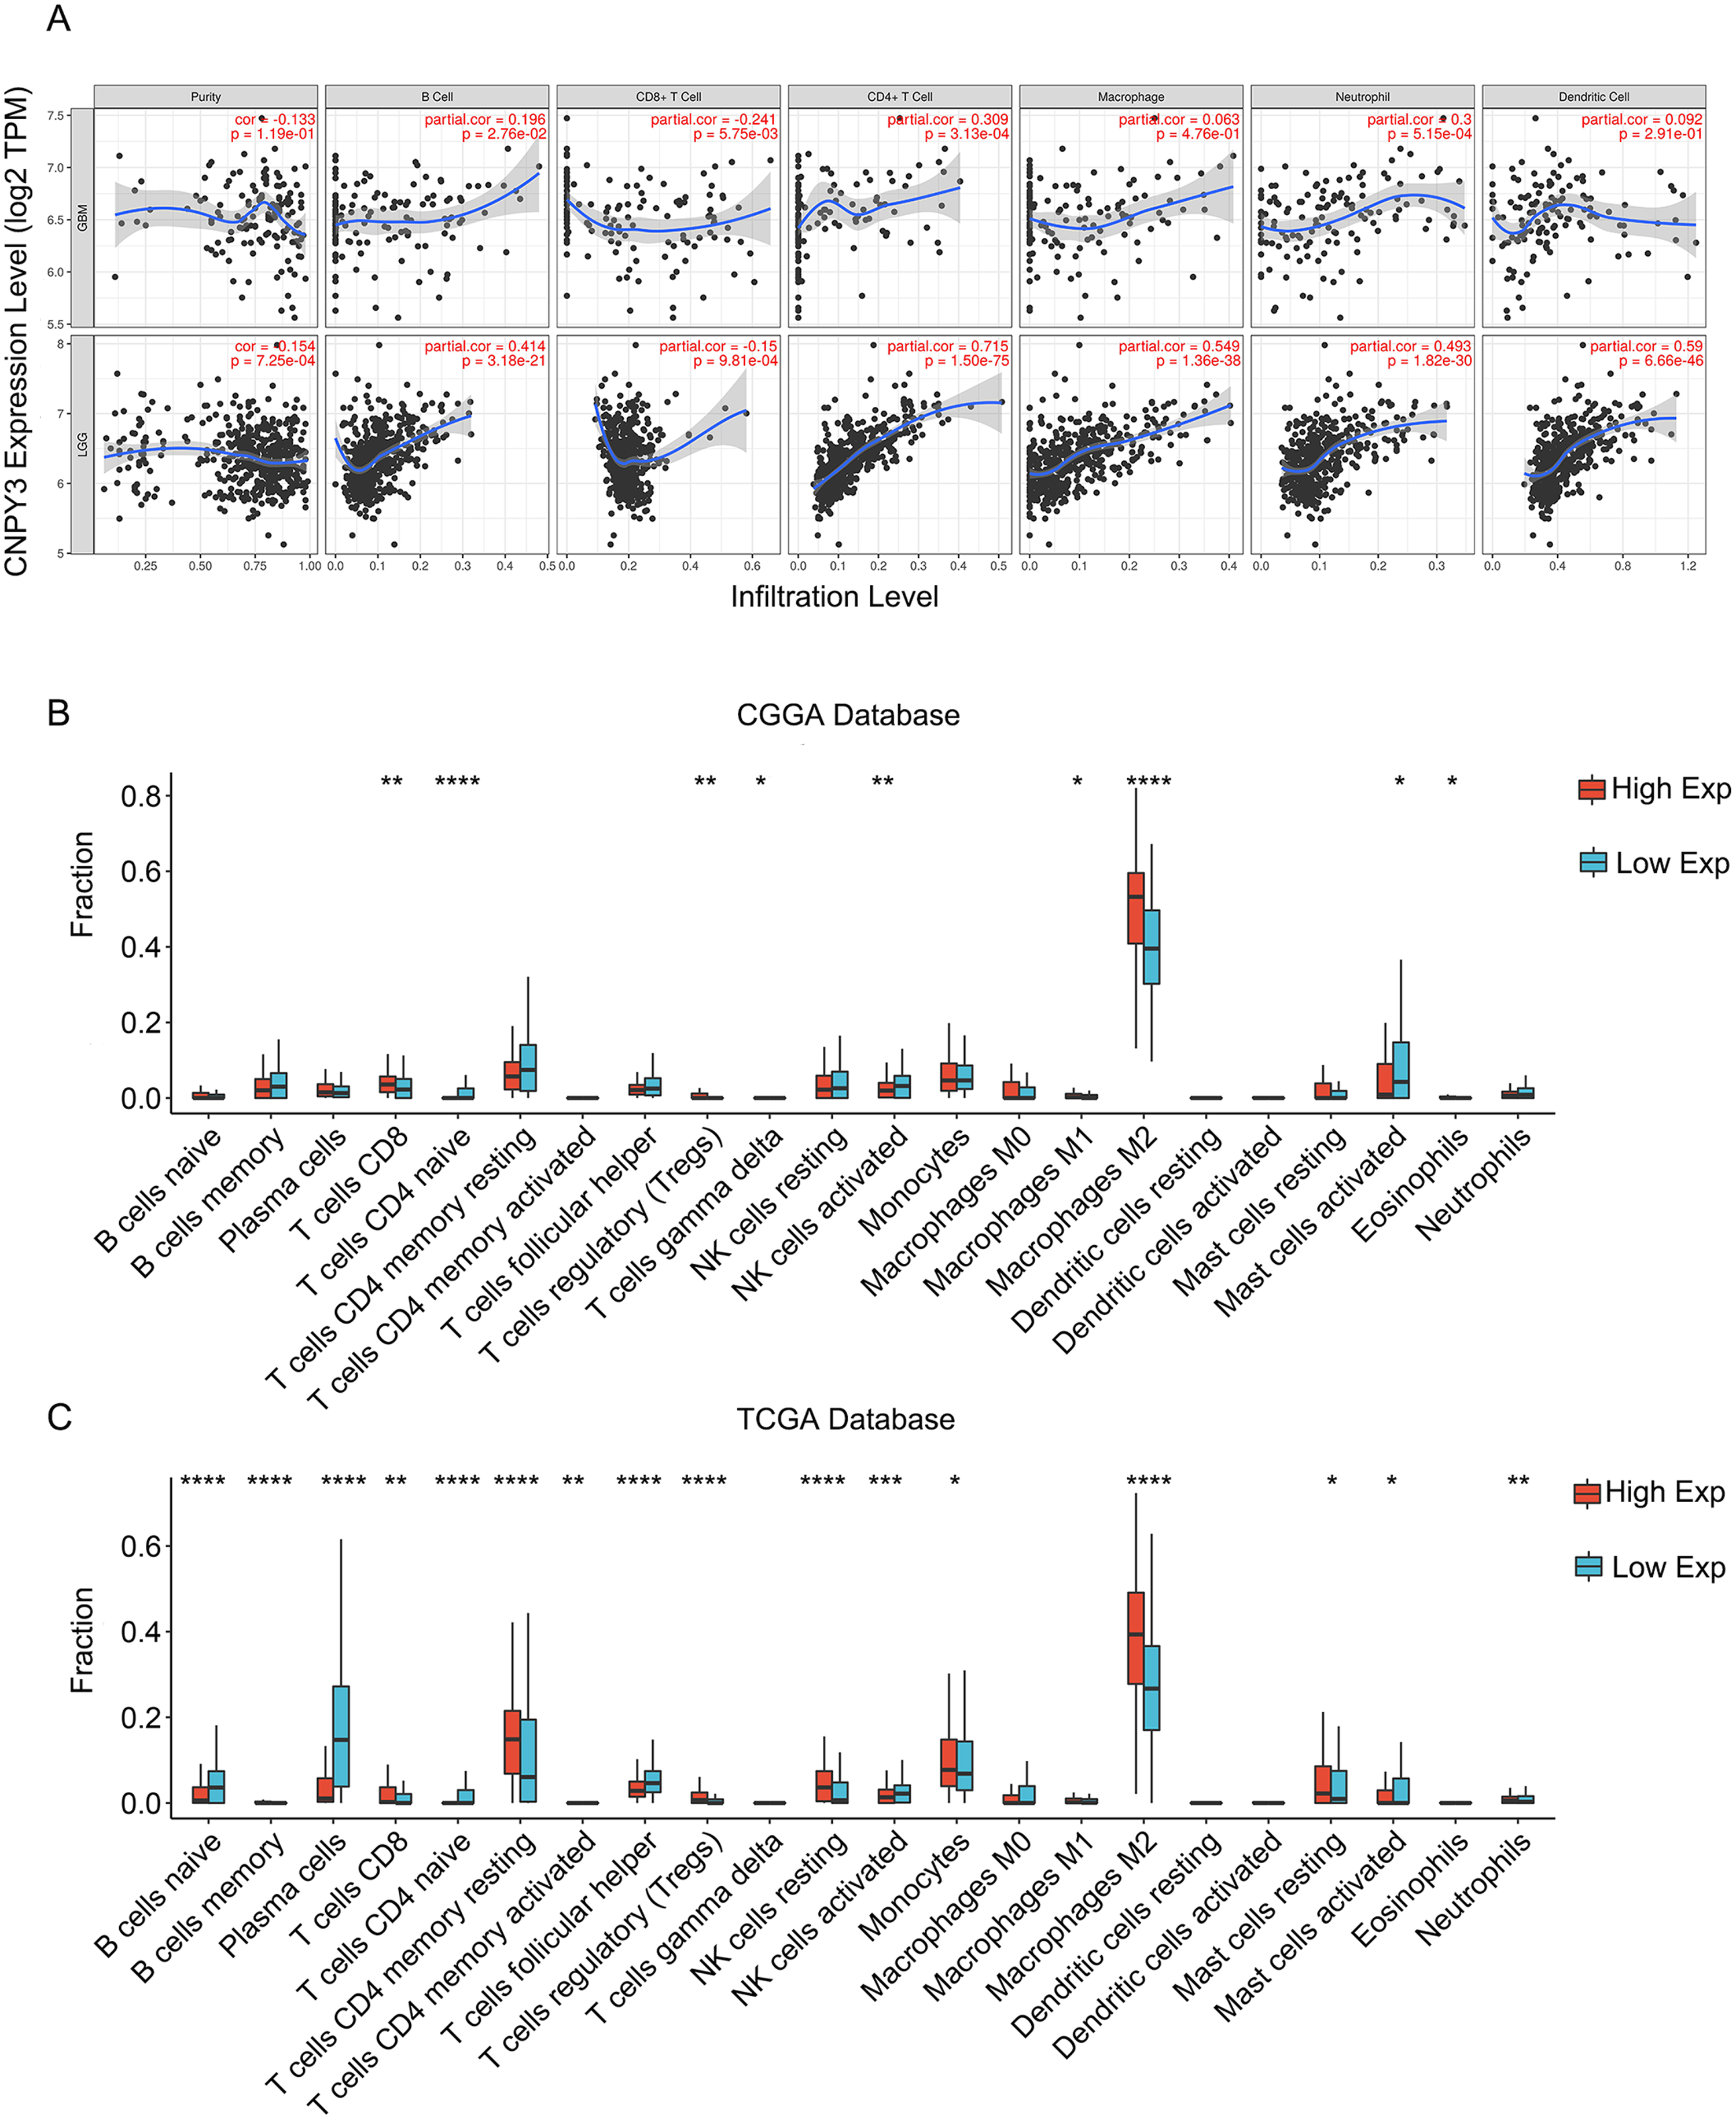
The expression of CNPY3 affected immune cell infiltration in glioma.
CNPY3 is negatively associated with positive regulation of macrophage apoptotic process
CNPY3 expression was found to positively linked with most immune cell functions, except for the positive regulation of macrophage apoptotic processes (Figure 7(A)–(B)), demonstrating a link between CNPY3 and macrophage apoptotic processes in the glioma immune microenvironment. To further verify the association between CNPY3 and macrophages in the immune microenvironment of glioma, we performed single-cell sequencing analysis on GSE89567, a public dataset in the GEO database. Fourteen clusters of cells were obtained after cell clustering (Figure 7(C)–(D)). These cells in these 14 clusters were recategorized based on cell markers (Figure 7(E)–(H)). High CNPY3 expression was found in glioma-associated macrophages (Figure 7(I)), suggesting that CNPY3 influences the regulation of the glioma immune microenvironment, and macrophages are involved in this process.
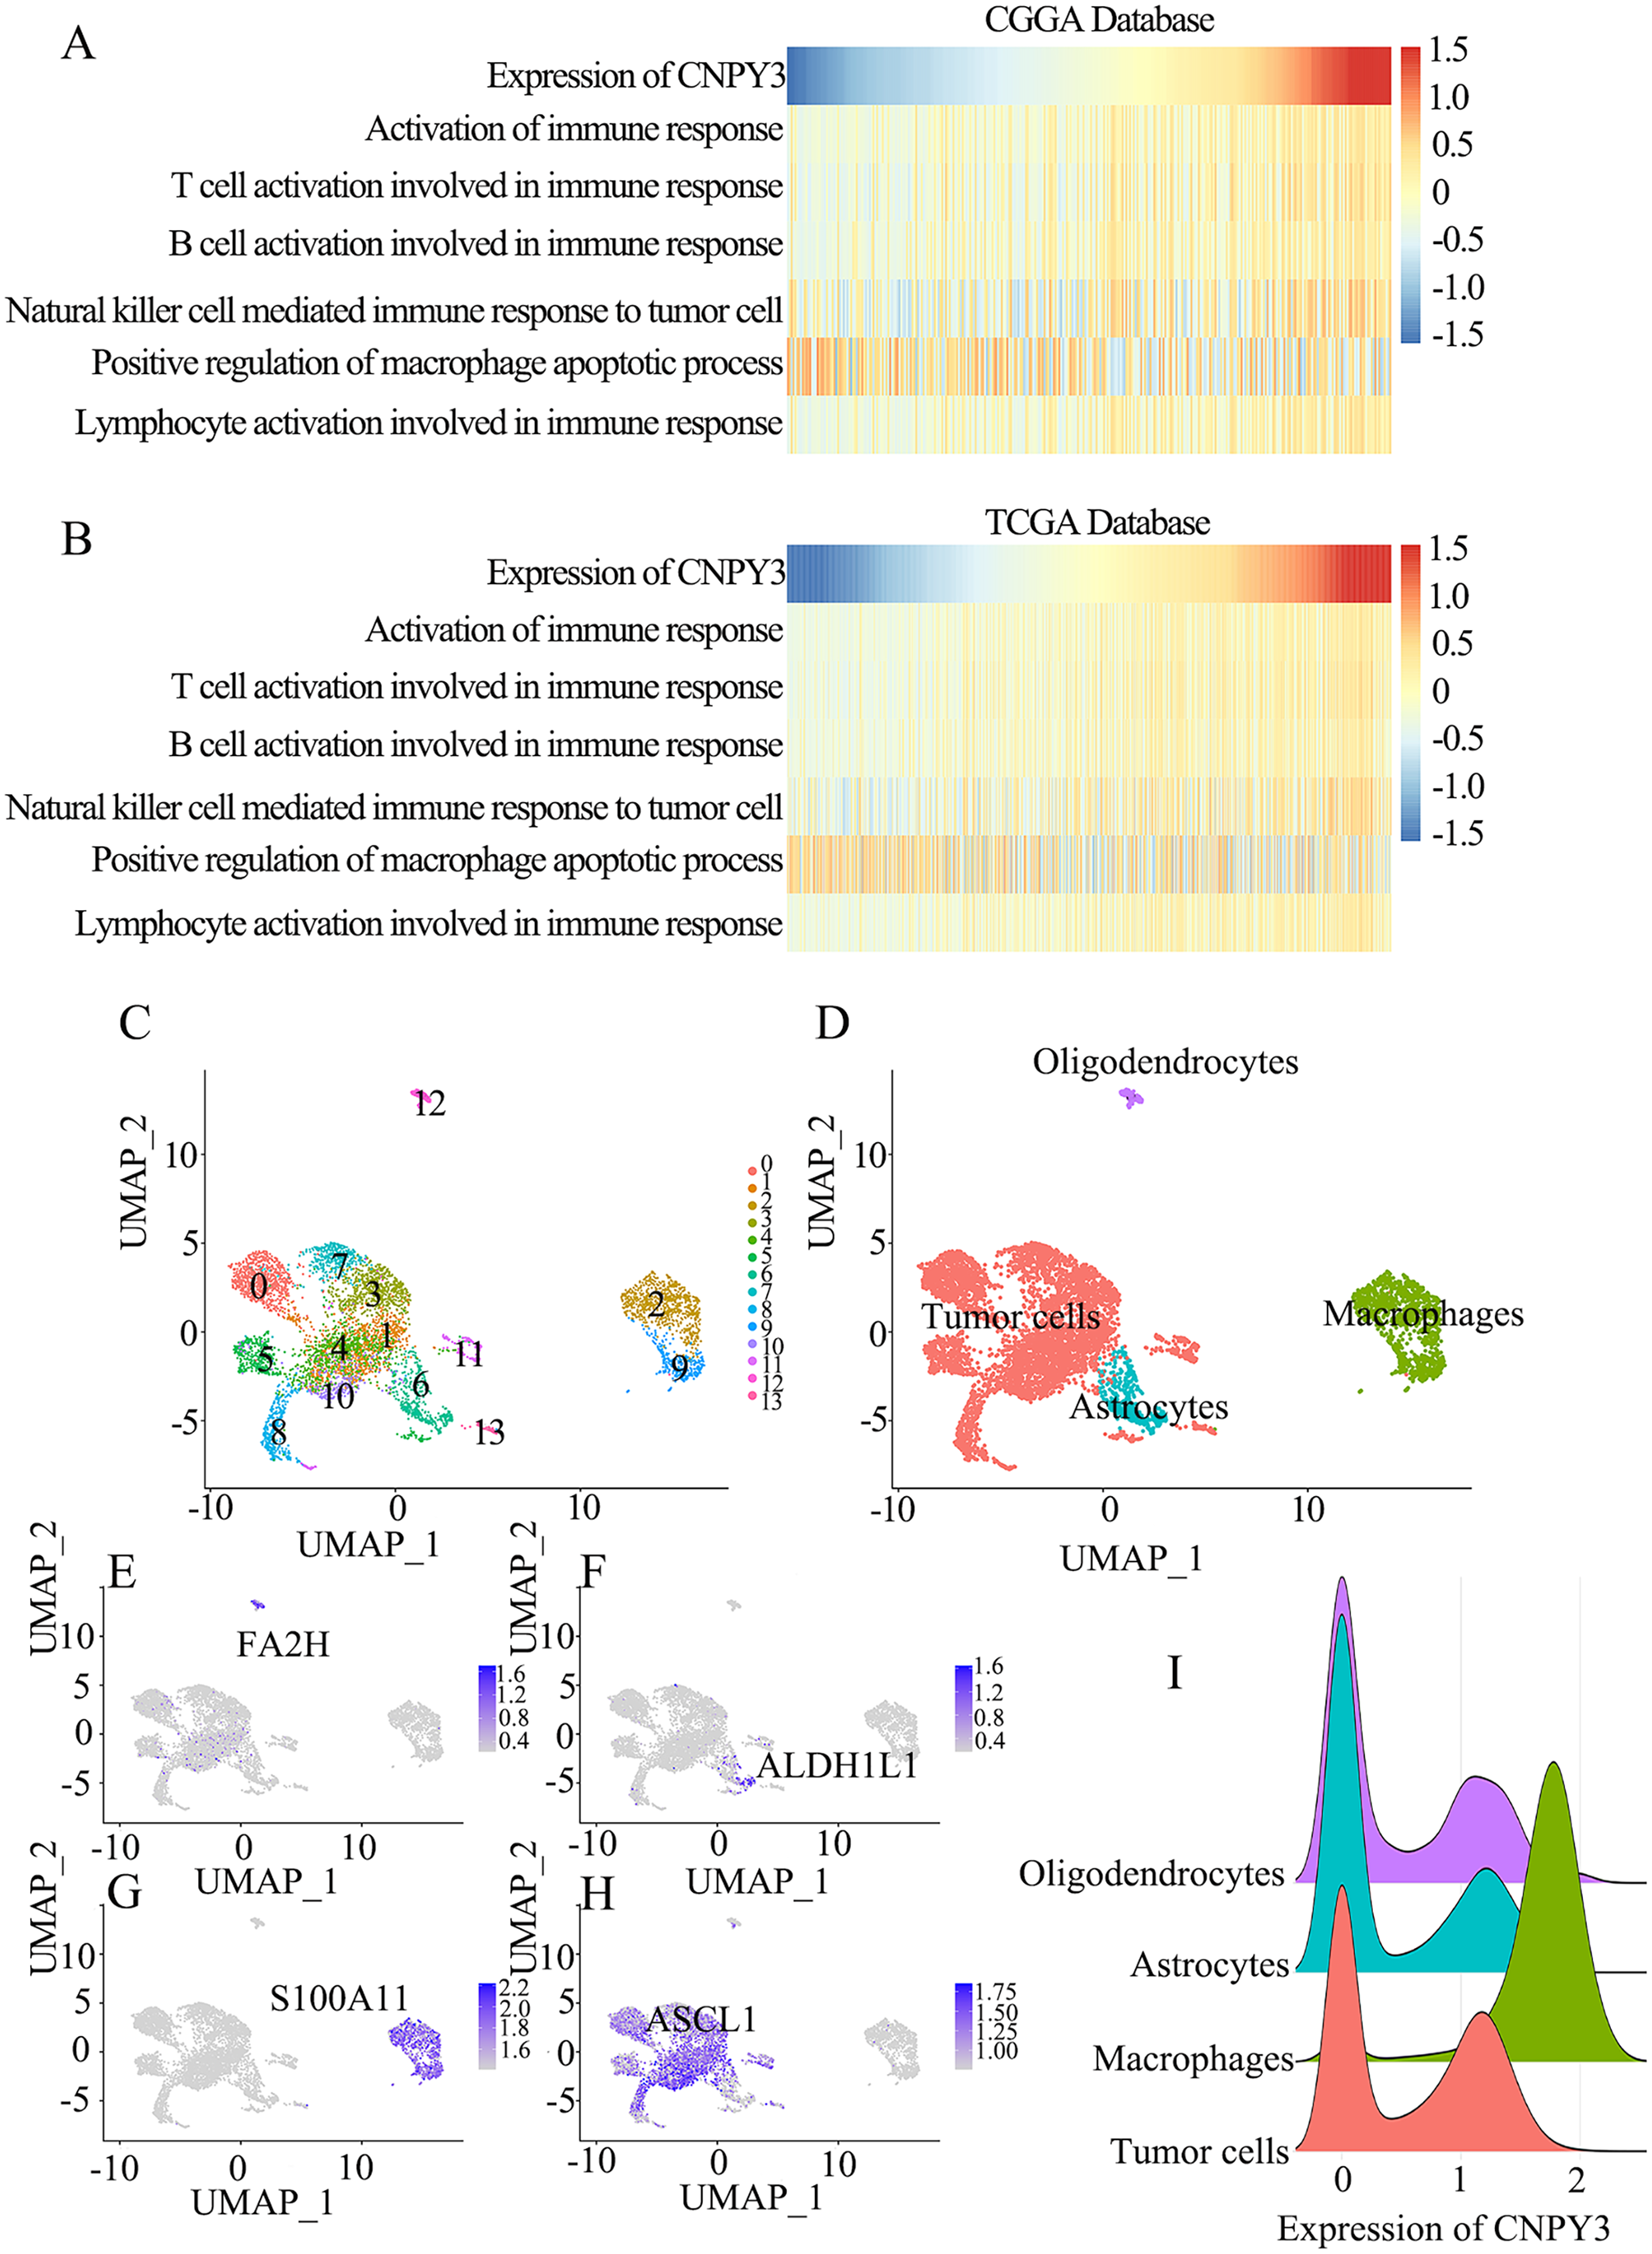
CNPY3 was related to glioma associated macrophages in the CGGA and TCGA databases.
CNPY3 overexpression promotes glioma cell migration and invasion
The above analysis showed that the biological functions associated with CNPY3 also include lipopolysaccharide-mediated signaling pathway. Through the Akt signaling pathway, lipopolysaccharide can promote glioma invasion and migration. 36 The transwell assays revealed that overexpression of CNPY3 promoted the invasive capacity of U87MG cells (Figure 8(B)–(C)). The scratch assays demonstrated that overexpression of CNPY3 promoted the migratory capacity of U87MG cells (Figure 8(D)–(E)). This indicates that CNPY3 overexpression can strengthen the invasive and migratory ability of glioma cells.
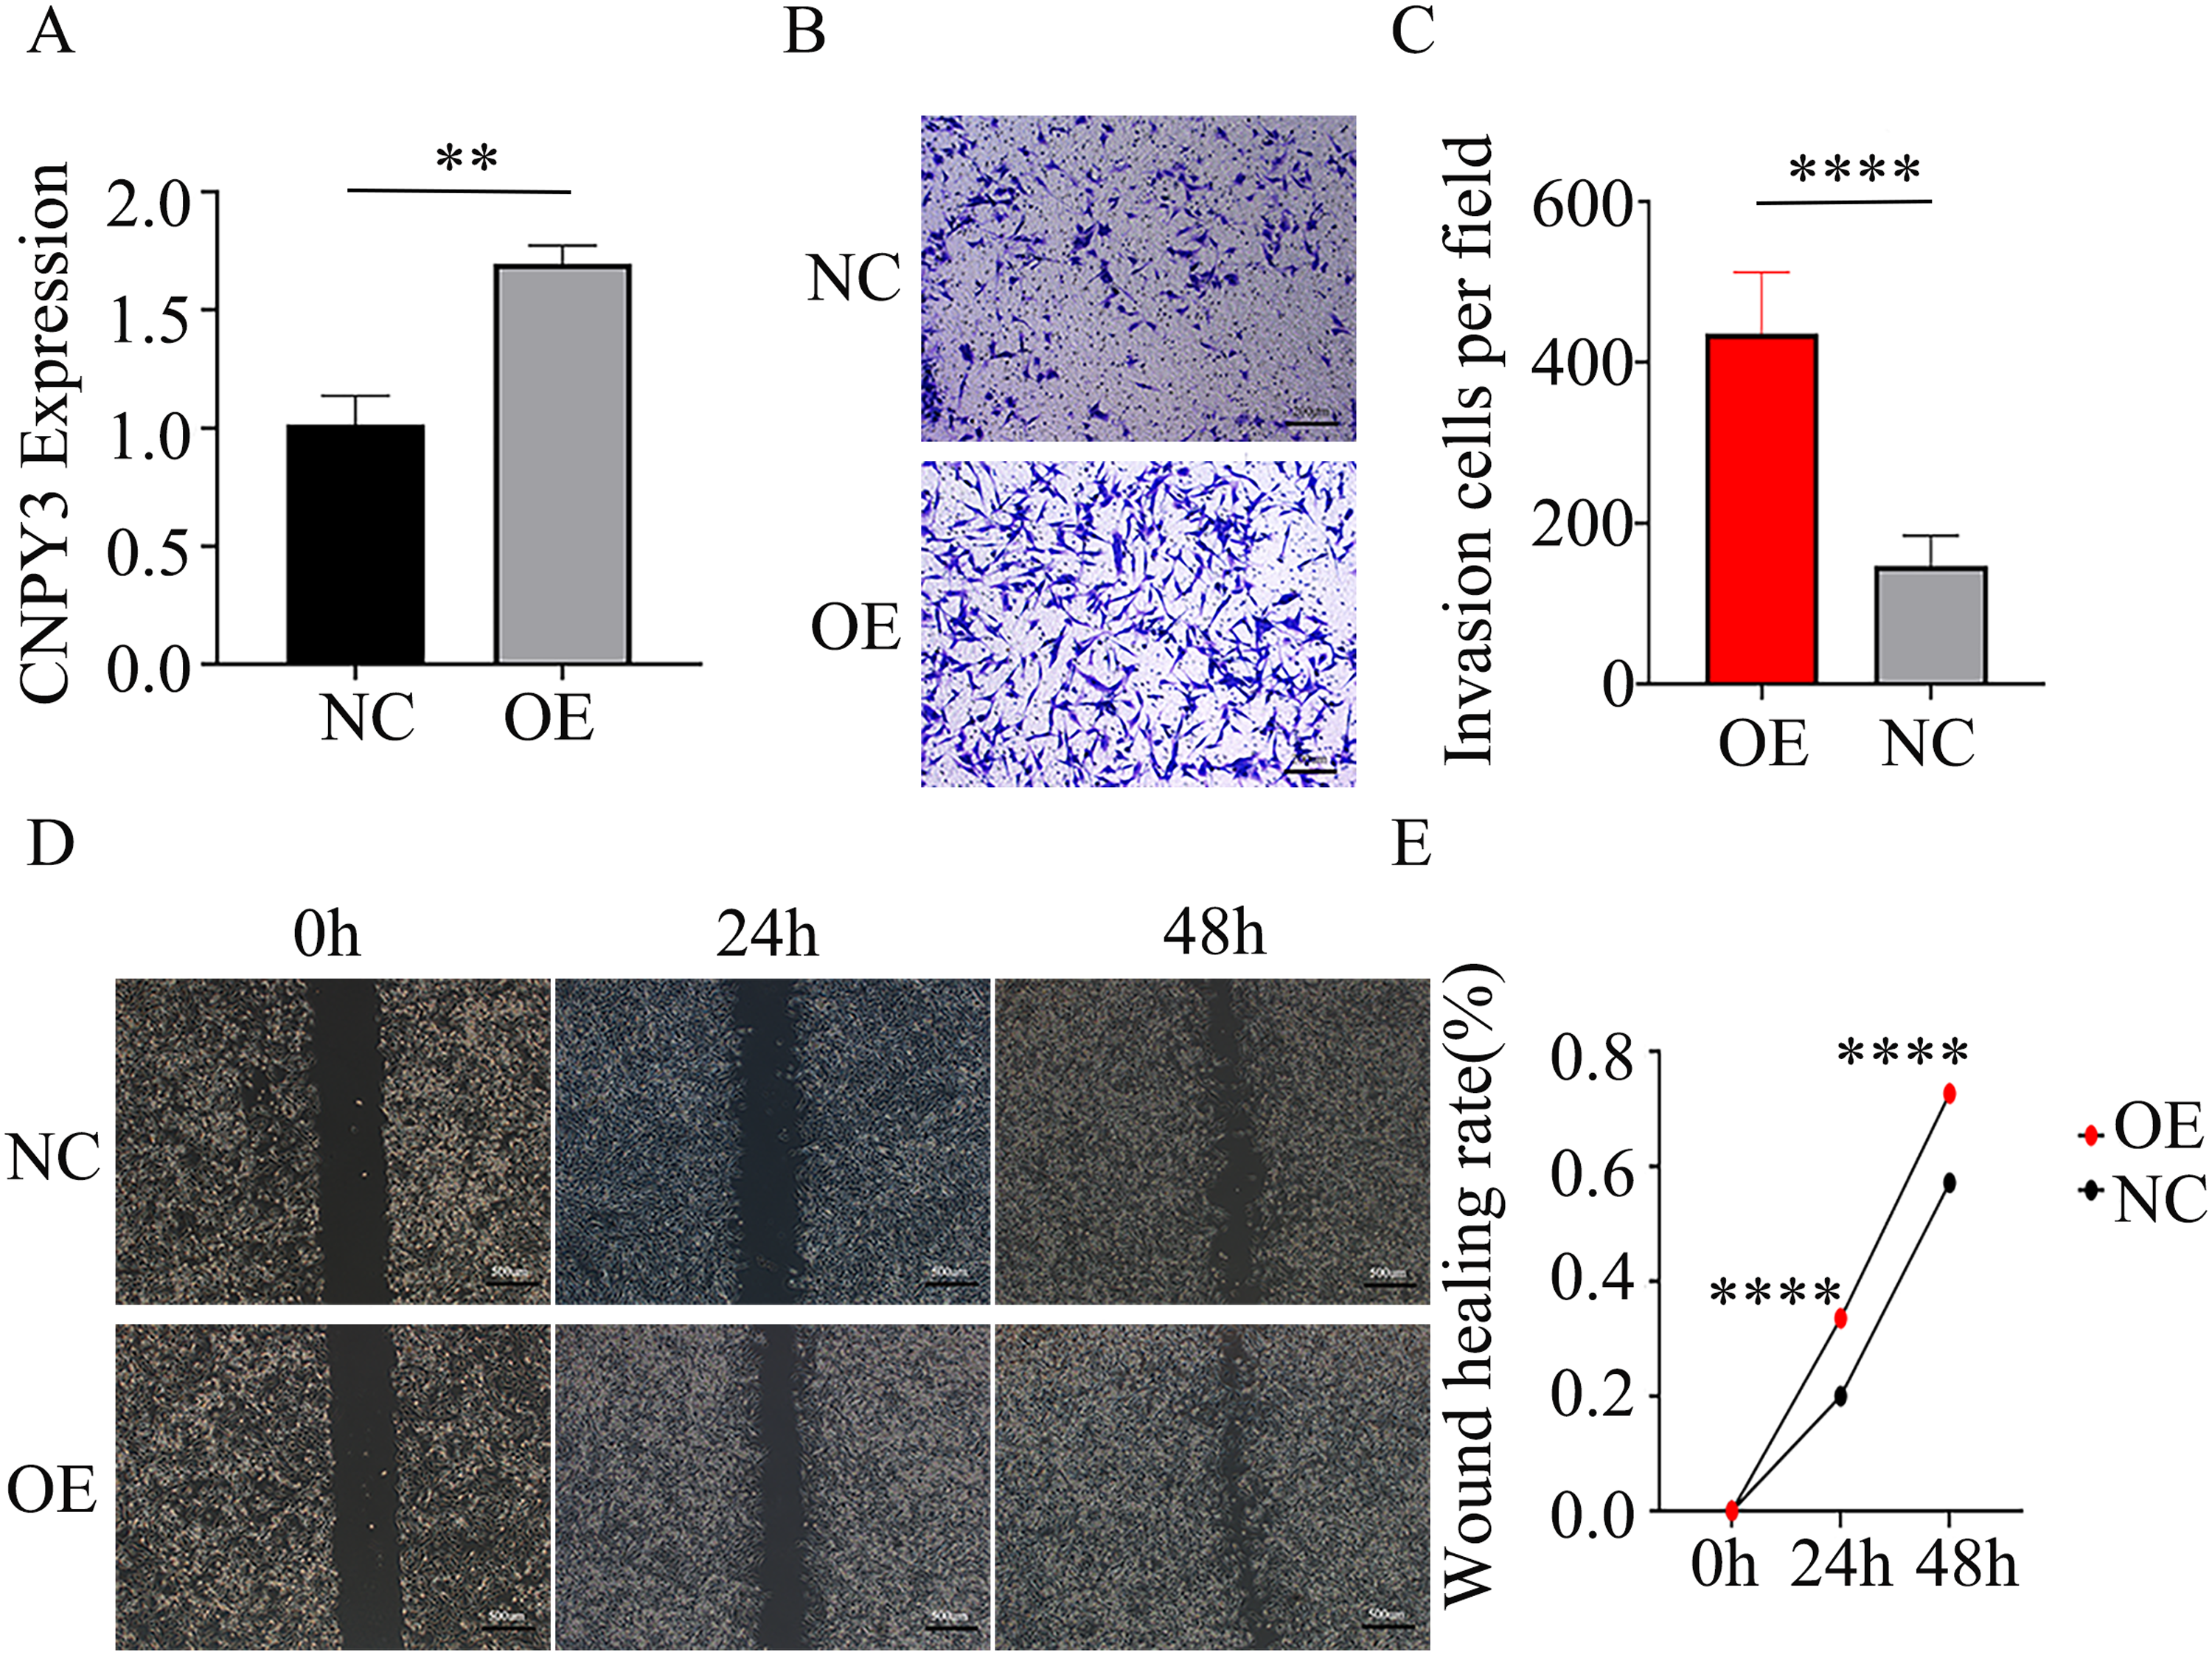
Overexpression of CNPY3 promoted the invasive and migratory ability of U87MG cells.
CNPY3 expression level correlates with anticancer drug sensitivity
Chemotherapy resistance occurs commonly among glioma patients. 37 CNPY3 shows a trend of high expression in glioma patients without MGMT promoter methylation (Figure 2(O)), and MGMT promoter methylation status is intimately related to drug resistance in glioma patients. 38 Patients with high CNPY3 expression were found to be more sensitive to drug treatment with temozolomide, irinotecan, and cisplatin (Figure 9(A)–(C)), but resistant to carmustine (Figure 9(D)). This suggests that CNPY3 expression level has a significant correlation with drug resistance in glioma patients.
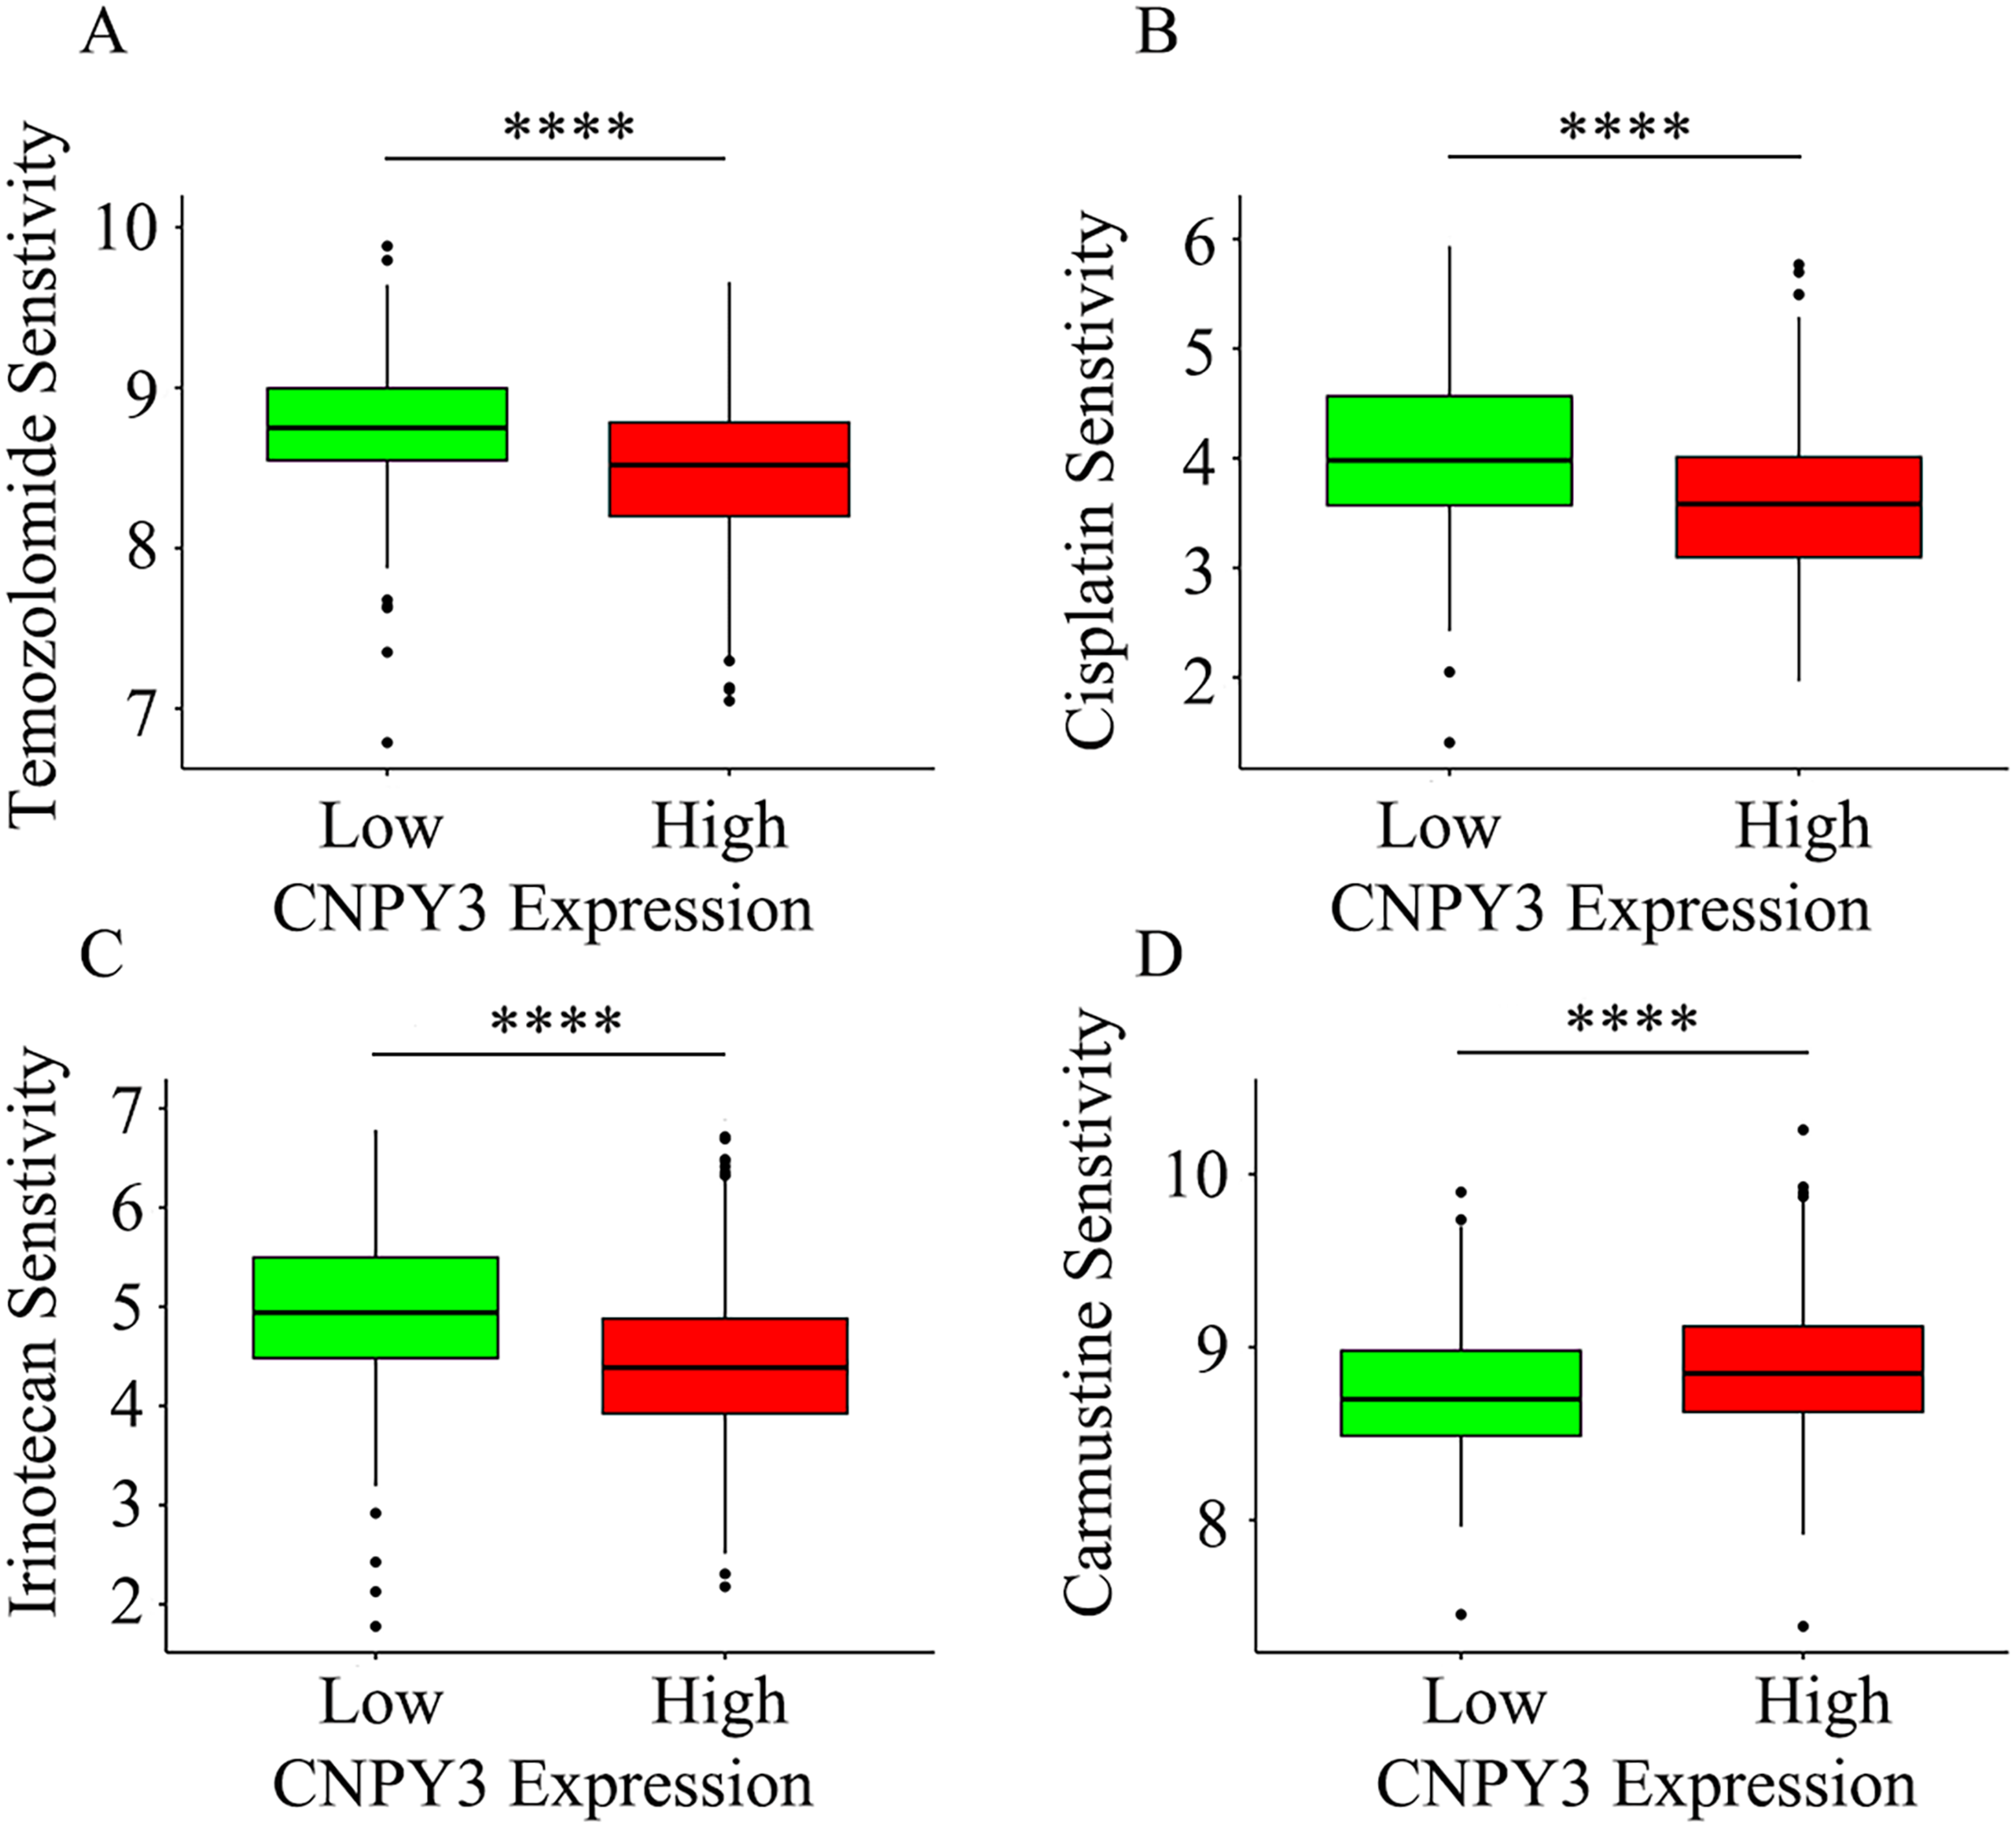
The expression level of CNPY3 was related to sensitivity to anticancer drugs.
Discussion
In our study, we comprehensively analyzed the molecular biological features of the human glioma based on the CGGA and TCGA databases by applying various bioinformatics methods. We found for the first time the high expression of CNPY3 in glioma, its correlation with clinical prognosis, and its role in the immune microenvironment of glioma. The results suggest that CNPY3 is closely associated with the histological grade and molecular pathological characteristics of glioma, and it can influence the immune microenvironment of glioma. CNPY3 is especially involved in the regulation of macrophage function and can promote glioma migrative and invasive ability. On this basis, we believe that CNPY3 can be considered a potential independent prognostic biomarker for glioma patients and a possible therapeutic target for glioma. These novel findings could significantly advance the development of anti-glioma treatments.
The CNPY family, with its five members (CNPY1-5), influences various biological processes like central nervous system development, tumorigenesis and development, immune regulation, inflammatory response and so forth. 14 Our study, by comparing the mRNA sequencing of glioma and that of normal brain tissues, found higher CNPY3 expression in glioma, especially in high-grade glioma. This corroborates findings on CNPY4, which, with 38% homology to CNPY3, 15 is also overexpressed in glioma and impacts immune infiltration, thus can serve as a prognostic biomarker.39,40 While the CNPY family is linked to tumorigenesis, the specific role of CNPY3 in glioma progression remains largely unexplored, with current research limited to gastric cancer. 21 In this study, the in-depth analysis of mRNA sequencing data and clinical properties of glioma patients of different grades in the CGGA and TCGA database demonstrated that CNPY3 expression levels elevated alongside the pathological grade of glioma and peaked in GBM (WHO grade 4). This suggests that CNPY3 levels could be utilized in early diagnosis to gauge malignancy and guide more precise and targeted treatment strategies. Our study also examined CNPY3 expression across different GBM transcriptional subtypes, revealing its high expression in all subtypes, with the mesenchymal subtype exhibiting the highest levels. This subtype is particularly invasive and immunosuppressive, indicating a potential link between CNPY3 expression and aggressive GBM characteristics. This finding further highlights CNPY3's link to glioma malignancy and its close association with the tumor's aggressiveness. Notably, CNPY3 is significantly elevated in IDH-wildtype glioma and those without 1p/19q codeletion, both of which are associated with a poorer patient prognosis,31,32 indicating its potential as a biomarker for severe glioma characteristics.
Given that CNPY3 is intimately linked with glioma malignancy, it is necessary to explore how CNPY3 expression level impacts patient prognosis. Our analysis of CGGA and TCGA databases revealed that increased CNPY3 expression was negatively linked to the OS of glioma patients. The findings that the OS of glioma patients was closely related with the CNPY3 expression level, WHO grade, age at diagnosis, IDH status, and 1p/19q coding status indicate that a high expression of CNPY3 status predicts a lower survival rate. Therefore, CNPY3 may serve as a prognostic predictor for glioma patients, offering valuable insights for crafting diagnostic and therapeutic strategies.
The CNPY family, which is linked to protein folding and features a conserved saposin-like domain, shows commonalities in immune function, tumor progression, and neurological conditions. 41 However, the precise biological functions of CNPY3 in glioma remain unknown. Our study adds to this knowledge by revealing a close association of CNPY3 with biological functions in glioma. Furthermore, signaling pathways most closely related to CNPY3, such as the B cell receptor signaling pathway and NOD-like receptor signaling pathway, were also found to link with immune regulation. These findings solidify the similarity in immune regulatory functions between CNPY3 and other members of the CNPY family. Based on these results, we predict that CNPY3 exerts an important function in immune infiltration in glioma.
The tumor microenvironment significantly impacts immunotherapy efficacy and patient prognosis, 42 with macrophages being key immune cells among others such as microglia, fibroblasts, and endothelial cells. 43 Macrophages, influenced by tumor microenvironment and stimuli, 44 can become M1 (anti-tumor) or M2 (pro-tumor) types according to their activation state, function, and secretion of cytokines. 45 M2 macrophages particularly foster tumor growth and progression through various pathways such as secretion of multiple cytokines, promotion of angiogenesis, and enhancement of invasion. 46 The TIMER analysis in our study found CNPY3 expression level in glioma was positively related to and the infiltration levels of macrophages, B cells, CD4+ T cells, neutrophils, and dendritic cells, but negatively to the infiltration level of CD8+ T cells. Furthermore, the CIBERSORT analysis revealed that M2 macrophages, CD8+ T cells, regulatory T cells, activated NK cells, and activated mast cells are the main immune cells affected by CNPY3 expression, with M2 macrophages being the most abundant among them. Informed by the results of immune infiltration analysis, we speculate that elevated expression of CNPY3 may cause polarization of macrophages towards M2 phenotype in the tumor microenvironment, which consequently results in tumor progression and less favorable prognosis.
Moreover, the results of GSVA analysis showed a negative correlation between CNPY3 expression and the positive regulation of macrophage apoptosis, which represents a novel discovery about CNPY3 and malignancies. Previous research indicates that tumor-associated macrophages and microglia constitute about half of all viable cells in GBM, which facilitate tumor growth and creating an immunosuppressive environment that allows the tumor to evade immune responses. 47 Our study generates novel insights that CNPY3 influences the glioma immune microenvironment by modulating macrophage apoptosis. Given that macrophages express various TLRs and require molecular chaperone for their distribution and activation, 48 CNPY3 may serve as a regulator in the function of tumor-associated macrophages. 49 On this basis, we conducted in-depth analysis of single-cell sequencing data from glioma and found high CNPY3 expression in tumor-associated macrophages within the tumor microenvironment. We speculate that as CNPY3 expression increases in macrophages, the binding of TLRs to CNPY3 on the surface of macrophages will also increase, which further activates the pro-tumor effects of macrophages and lead to the malignant biological behavior of glioma. This corroborates the results of GSVA analysis, confirming that CNPY3 expression level affects the function of tumor-associated macrophages in the glioma immune microenvironment. In this light, we propose CNPY3 to be a new target for immunotherapy of glioma.
We also pioneered in discovering that CNPY3 is closely related to the lipopolysaccharide-mediated signaling pathway in glioma. Gao et al. found that lipopolysaccharide can promote tumor invasion and migration through Akt signaling pathway. 36 Our result suggests that CNPY3 may also be associated with glioma invasion and migration, and the lipopolysaccharide-mediated signaling pathway is likely to be one of the mechanisms. These results motivated us to explore the function of CNPY3 in the migratory and invasive ability of U87MG cell in vitro, and we found that high CNPY3 expression could promote the ability of U87MG cell. This supports the finding that the interaction between SLITRK4 and CNPY3 can enhance the proliferation and migration of gastric cancer cells. 21 The SLITRK4-CNPY3 axis enhances TrkB pathway by promoting the endocytosis and recycling of TrkB, which is a key factor in cancer proliferation, invasion and metastasis. 50 However, whether the mechanism by which CNPY3 promotes glioma cell invasion and migration is related to TrkB signaling pathway requires further investigation. In conclusion, our results demonstrate that CNPY3 and the malignant biological process of glioma are closely related, which is consistent with the clinical characterization of CNPY3 in glioma.
Drug resistance is a key factor leading to poor chemotherapeutic efficacy, making it crucial to reduce this resistance in glioma treatment. 51 The correlation analysis of IC50 of antitumor drugs and CNPY3 expression displayed a high sensitivity of patients with high CNPY3 expression to chemotherapy with temozolomide, irinotecan and cisplatin, but resistant to carmustine. Hence, CNPY3 expression levels could guide personalized chemotherapy regimens for glioma patients.
This study has some limitations to be further improved in the future. First, we mainly used bioinformatics methods and limited in vitro experiments, which shed some light on the function of CNPY3. Future studies should conduct in vivo experiments and gather tumor tissue samples from glioma patients to further validate the influence of CNPY3 on glioma. Second, this study was limited to a small number of cell lines in vitro. More cell lines or even animal experiments are preferred to validate the findings. Third, limited resources constrained a more profound investigation of the molecular mechanism of CNPY3 in this study, which is a priority for our subsequent work.
Conclusions
In summary, CNPY3 expression is up-regulated in glioma, which affects the tumor immune response and the immune microenvironment, especially the positive regulation of macrophage apoptotic process. High expression of CNPY3 promotes glioblastoma migration and invasion, which gives rise to poor prognosis of glioma patients. Based on these findings, CNPY3 may act as an effective biomarker for glioma patients with diagnostic and prognostic significance, and lead to new glioma immunotherapy in the future.
Footnotes
Acknowledgements
We thank the public database for providing data for our research.
Author contributions
Conceptualization: DJ and LZ; methodology: DJ and LZ; software: LZ, FZ and JZ; validation: LZ, FZ, JZ and SC; formal analysis: DJ, LZ and ZZ; investigation: FZ and ZZ; resources: DJ; data curation: LZ and SC; writing—original draft preparation: LZ and DJ; writing—review and editing: DJ, LZ, FZ, JZ, SC and ZZ; visualization: LZ and JZ; supervision: DJ; project administration: DJ; funding acquisition: DJ. All authors have read and agreed to the manuscript.
Funding
The authors received no financial support for the research, authorship, and/or publication of this article.
Declaration of conflicting interests
The authors declared no potential conflicts of interest with respect to the research, authorship, and/or publication of this article.
Data availability
The dataset used in this research has been written in the Methods section and the data generated in the research has been stored in Zenodo at the link: https://doi.org/10.5281/zenodo.10998001.