
Abstract
Background
This study aimed to identify hub genes linked to hepatocellular carcinoma (LIHC) pathogenesis using bioinformatics analysis.
Method
A total of 3865 samples from 12 datasets in the HCCDB database were analyzed to identify prognostic expression genes (PDGs). Enrichment analysis using DAVID and GSCA databases unveiled biological processes and signaling pathways associated with PDGs. Cytohubba app was utilized to identify 6 hub genes from the PDGs. Verification of hub genes was conducted using three GEO datasets and Western blot. Histopathological staining data of hub genes in LIHC patients were retrieved from the Human Protein Atlas database. Comprehensive analyses of hub genes were performed, including immune infiltration, prognosis, survival, methylation, gene mutation, related miRNA, and single-cell type. Potential therapeutic drugs were predicted using GDSC and CTRP databases.
Result
A total of 1259 differential genes were screened, yielding 82 PDGs (36 up-regulated and 46 down-regulated genes). Hub genes identified included CDC20, TOP2A, CDK1 (up-regulated), and CAT, TAT, FTCD (down-regulated). These hub genes exhibited strong associations with immune cells and showed promising prognostic value based on AUC analysis. Reduced promoter methylation levels of TOP2A, CDK1, and FTCD in LIHC were observed. Single nucleotide polymorphisms analysis highlighted prevalent variants and miRNA expression associations impacting patient survival. Hub genes were enriched in various cell types. Trametinib, selumetinib, RDEA119, and teniposide were identified as potential drugs for LIHC treatment.
Conclusion
CDC20, TOP2A, CDK1, CAT, TAT, and FTCD may contribute to LIHC development and serve as novel prognostic biomarkers.
Keywords
Highlights
CDC20, TOP2A, CDK1, CAT, TAT, and FTCD may play a role in the development of HCC through DNA damage response, PI3 K/AK, EMT, and apoptosis signaling pathway. Trametinib, selumetinib, RDEA119, and teniposide have a high degree of association with hub genes, which were associated with prognosis in patients with LIHC and may be a potential biomarker and therapeutic drugs for prognosis.
Introduction
Hepatocellular carcinoma (HCC, LIHC), is the most prevalent type of primary liver cancer, and has a poor prognosis due to recurrence and lack of effective treatment. Currently, LIHC is the sixth most common cancer in the world, with the third highest mortality rate. 1 It is estimated that by 2030 China will have the largest number of LIHC patients in the world, an increase of 82% from 2016. 2 The treatment methods for LIHC patients mainly include surgical resection, transplantation, and targeted drug therapy, but these measures are only effective for 30%∼40% of patients, and the remaining patients are only suitable for palliative and symptomatic treatment, and the recurrence rate of 5 years after LIHC resection can reach 40%∼70%.3,4 LIHC is correlated with several well-known etiologies, including chronic hepatitis B virus (HBV) or hepatitis C virus (HCV) infection, alcohol abuse, nonalcoholic fatty liver disease, and exposure to dietary toxins such as aflatoxins. 5 Approximately 80%-90% of primary liver cancers are LIHC. 6 Most LIHC patients have a poor prognosis, and curative therapy can only be used in a limited number of patients because most LIHC is diagnosed at an advanced stage; 7 this makes the treatment of liver cancer full of challenges. The occurrence and development of LIHC is a multi-step phenomenon, which is controlled by the accumulation of genetic and epigenetic changes, leading to inactivation of tumor suppressor gene, activation of oncogene, 8 and ultimately lead to the dysregulation of basic cellular processes. Systemic anti-tumor therapy offers hope for treating patients with advanced LIHC. Despite the emergence of new systemic therapies, the survival rate of patients with advanced LIHC remains low. The intricate pathogenesis of LIHC has spurred researchers to explore various molecular-targeted therapies aimed at specific targets. Understanding the molecular mechanisms underlying LIHC development is crucial for seeking effective targeted therapies. Research on biomarkers for LIHC treatment is also advancing. 9 A small retrospective cohort study showed that sorafenib improved the survival rate of LIHC patients with VEGFA amplification significantly, suggesting that VEGFA may serve as a potential biomarker for predicting the efficacy of sorafenib. 10 A study on the role of ACSL4 (a positive activator of ferroptosis) in sorafenib-induced cell death and prognosis of LIHC patients found that ACSL4 protein expression was negatively correlated with the IC50 value of sorafenib in LIHC cell lines. ACSL4 is essential for sorafenib-induced ferroptosis and contributes to the prediction of sorafenib sensitivity in LIHC. 11 Therefore, we need to determine the mechanism of LIHC to detect and treat early LIHC at the molecular level.
To date, the common treatment methods for LIHC include surgical resection, transplantation, percutaneous therapy, transarterial chemoembolization, systemic chemotherapy, hormone therapy, immunotherapy, etc. Patients with tumors of different stages choose different treatment methods, but intrahepatic spread and recurrence rates are still very high after 5 years. 12 A biomarker-a molecule, a process, or a structure that can be measured in body fluids, cells, or tissues-predicts the presence and risk of cancer. 13 The α-fetoprotein (AFP) has been considered to be the most useful biomarker for LIHC evaluation, ever since it was discovered in the serum of LIHC patients in 1964. 14 GPC-3 is identified as a novel biomarker typically expressed as a cell surface protein tethered to the cell membrane via a glycosylphosphatidylinositol anchor, engaging in interactions with various extracellular protein molecules. It serves as an oncofetal protein that remains quiescent in the adult liver but becomes activated in LIHC, demonstrating associations with tumor suppression and cell proliferation. 15 LIHC serum biomarkers also include Golgi protein 73 (GP73 or Golph2), Des gamma carboxyprothrombin (DCP), Annexin A2 (ANXA2), Osteopontin (OPN), squamous cell carcinoma antigen (SCCA), Gamma-glutamyl transferase (GGT), Dickkopf-1 protein (DKK1), and Matrix metalloproteinases (MMPs). 16 The combination of AFP (cutoff 5 ng/mL), AFP-L3 (cutoff 4%), and DCP (cutoff 20 mAU/mL) showed better performance for the detection of LIHC at a very early stage than single biomarkers. Until new biomarkers with higher performance in detecting LIHC can be found, AFP may still have a role in the surveillance of LIHC, and AFP-L3 and DCP could be used as supplementary tests to AFP in conjunction with imaging tests. 17 Biomarkers play a crucial role in the clinical care of cancer patients, acting a significant role in improving patient survival rates. 18 They enable patient classification based on shared characteristics, aiding in risk assessment, early detection, diagnosis, and predicting prognosis or response to treatment. Despite being a rapidly growing area of research, only a few biomarkers for LIHC have been integrated into clinical practice, however, there has been a growing focus on identifying biomarkers throughout the cancer care spectrum, from risk assessment to early detection, prognosis, and treatment response.
In recent years, microarrays have rapidly developed and have become the most successful tool for conducting multiple combinatorial chemistry, genomics, and proteomics assays simultaneously. 19 Currently, a large number of microarray datasets have been made available, lackage of thorough data analysis, however, bioinformatics analysis can be utilized to interpret large and complex datasets. In our study, we examined 12 LIHC datasets in the HCCDB, identified prognostic different genes (PDGs) through a comparison of human LIHC with adjacent normal samples, and used bioinformatics analysis to identify hub genes and conduct a series of functional analyses.
Materials and methods
Datasets from the HCCDB
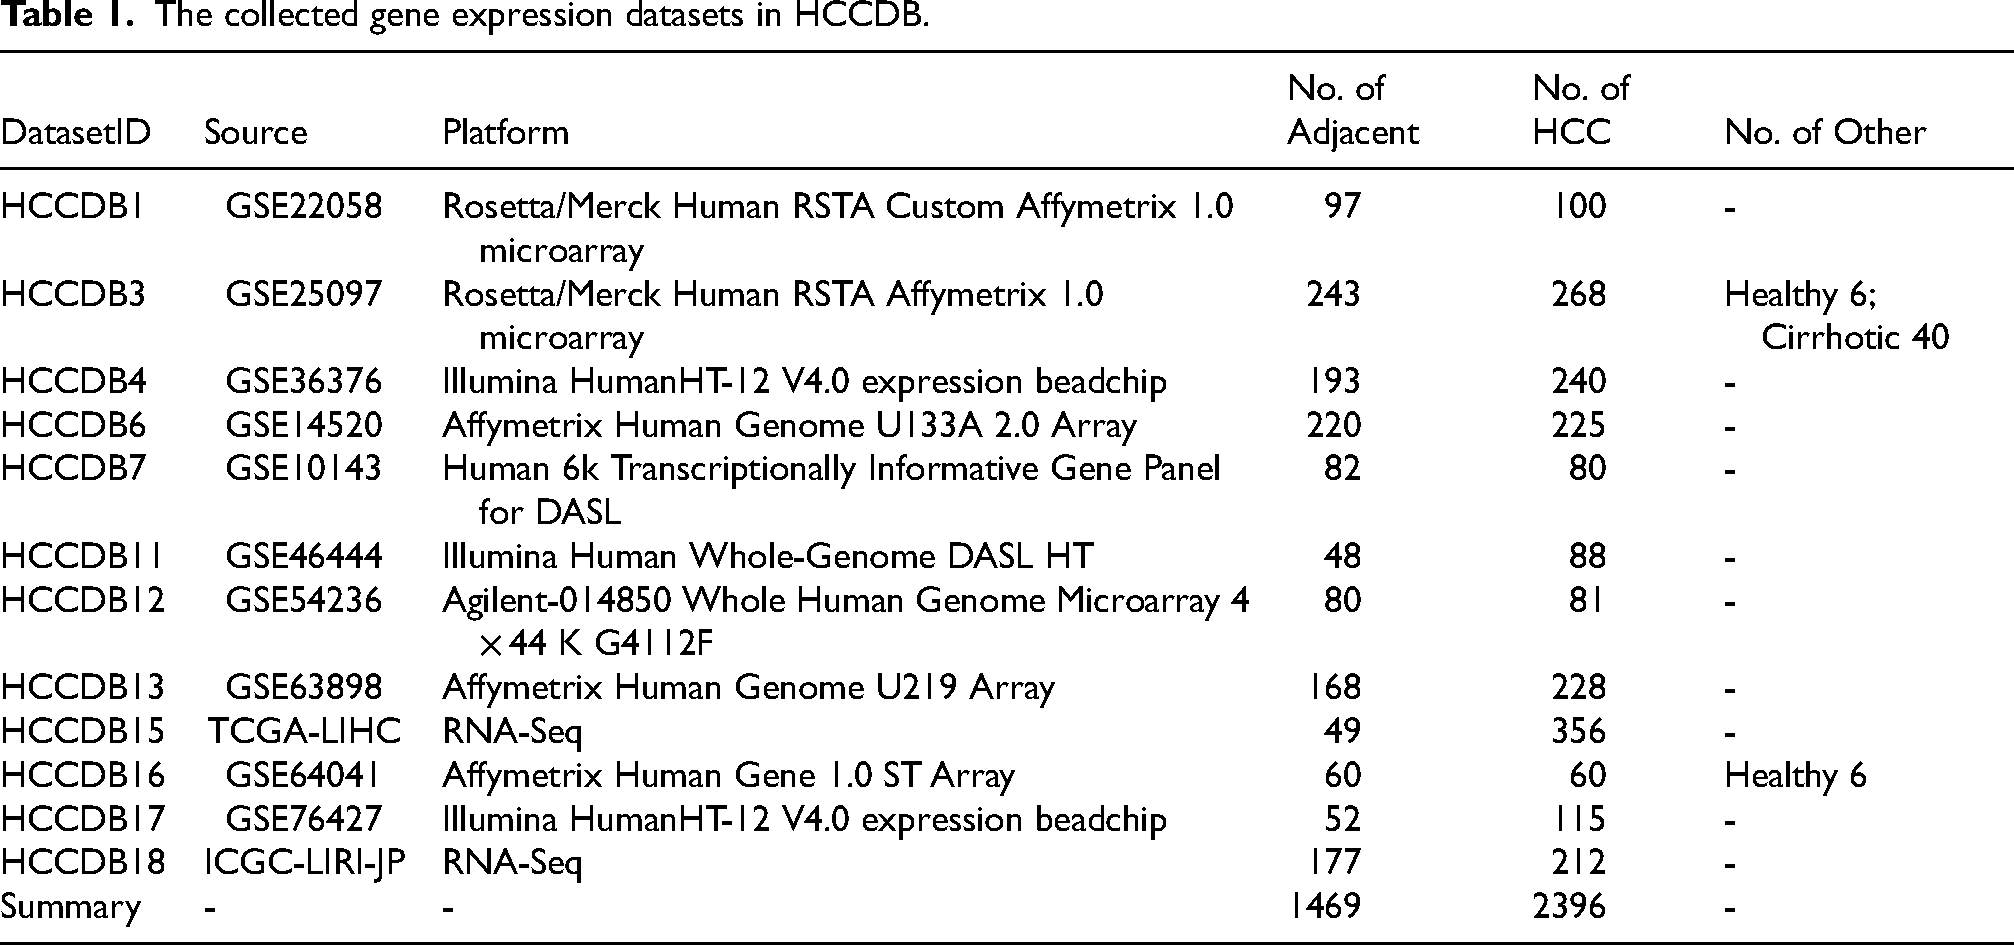
In the current database release, we archived 12 datasets containing both tumor and the adjacent normal samples containing a totally of 3865 samples from the HCCDB database (Table 1) (http://lifeome.net/database/hccdb/home.html). 20 Differential genes can be downloaded directly from the HCCDB database. The prognostic performance of each gene was measured in three datasets (HCCDB6, 15, 18) with overall survival times. In each dataset, HCC samples were classified into high-/low-expression groups by median expression value of each gene. Then log-rank test was taken to compare the survival distributions of samples in two groups. Genes with adjusted P < 0.001 (Benjamini-Hochberg correction) in at least one dataset or adjusted P < 0.01 in at least two datasets were identified as prognostic genes. These genes were tagged as “favorable genes” if their cox coefficients were negative, which meant the higher expression levels, the lower risk extents. Conversely, they were tagged as “unfavorable genes” if their cox coefficients were positive. To reduce the noise of disease irrelevant deaths, survival time that was greater than five years was truncated to five years and the status of the corresponding patient was set to be “alive”.
The collected gene expression datasets in HCCDB.
Functional annotation of the PDGs
The DAVID database (https://david.ncifcrf.gov/) 21 and Gene Set Cancer Analysis (GSCA) database (http://bioinfo.life.hust.edu.cn/web/GSCALite/) 22 were used to perform a preliminary analysis of the obtained PDGs with systematic and comprehensive biological function and pathway activity notes, which includes Gene Ontology biological process (GOBP), cellular component (CC), molecular function (MF) enrichment. In our study, the threshold Pvalue < 0.05 was considered statistically significant. Use the GSCA database in the signaling pathway enrichment analysis, input LIHC related gene set, select “Expression&Pathway activity” to analyze LIHC related signal pathways and the roles of different genes in the signaling pathway.
Protein-Protein interaction network of the PDGs
To identify the hub regulatory genes and to examine the interactions between the PDGs, a protein-protein interaction (PPI) network was generated with the Search Tool for the String database (https://string-db.org/). 23 These genes required an interaction score ≥ 0.4 and a maximum number of interactors = 0, and the genes were imported into Cytoscape software (version 3.6.1) with the cytoHubba app 24 to screen the hub genes with Degree, MCC, and MNC algorithms.
Hub gene reliability verification
To better understand the differential expression, the Clinical Proteomic Tumor Analysis Consortium (CPTAC) (https://ualcan.path.uab.edu/) 25 and GEO (https://www.ncbi.nlm.nih.gov/geo/) 26 databases were used to assess CDC20, TOP2A, CDK1, CAT, TAT, and FTCD protein levels from a LIHC perspective. Using the CPTAC, we analyzed the protein expression and DNA methylation. Z-values represent standard deviations from the median across samples for the given cancer type. Log2 spectral count ratio values from CPTAC were first normalized within each sample profile and then normalized across samples. Meanwhile, we used normal hepatocytes (HL7702) and hepatocellular carcinoma cells (HepG2) for western blot, including CDC20 (abcam: ab183479), TOP2A (abcam: ab52934), CDK1 (abcam: ab133327), CAT (abcam: ab112801), TAT (abcam: ab134921), and FTCD (abcam: ab133016), and retrieved the expression of the aforementioned proteins in different clinical samples using the Human Protein Atlas (HPA) database (https://www.proteinatlas.org/). 27 The position of genes in chromosomes is plotted using R (4.2.1): circularize [0.4.15]. Gene expression profiling interactive analysis (GEPIA2) database (http://gepia2.cancer-pku.cn/#index) was used to analyze the relationship between hub genes expression and tumor pathological stage, and the prognostic values of CDC20, TOP2A, CDK1, CAT, TAT, and FTCD including overall survival (OS) and disease free survival (DFS). In this study, GEPIA was utilized to analyze the expression levels of LIHC and the input gene symbols. LIHC and datasets (TCGA and GTEx) were selected for analysis. Within GEPIA, the “Expression DIY” feature was accessed to choose the tumor type and pathological stage for analysis. The names of the hub genes were entered, and their expression patterns across different pathological stages of LIHC were examined. A boxplot visualization tool was employed to demonstrate the relationship between gene expression and pathological stage. To analyze the prognostic value of the genes, the “Survival Analysis” feature in GEPIA2 was utilized. The genes and tumor type to be analyzed were selected, and the type of survival to be analyzed (such as OS or DFS) was chosen. Hazard ratios were calculated based on the Cox PH model, with 95% CIs added as dashed lines.
Immunoinfiltration and area under curve analysis
From TCGA database (https://portal.gdc.cancer.gov) 28 to download and organize TCGA - LIHC project STAR process of RNAseq data and extract the TPM format of data as well as clinical data RNAseq [424], adjacent [50], data filtering strategy: remove normal, data processing method: log2(value + 1), using R (4.2.1) version of R package: ggplot2[3.3.6]. The correlation between the main variables in the data and the immune infiltration matrix data and AUC was analyzed, using R (4.2.1) package: timeROC[0.4] and the analysis results were visualized by the ggplot2[3.3.6] package. Perform proportional hazards hypothesis testing and Cox regression analysis using the R (4.2.1) package Survival [3.3.1], and construct nomogram related models using the rms6.3-0 package for visualization.
Gene functional analysis and therapeutic drug prediction
We used the cBioPortal tool (https://www.cbioportal.org/) 29 and the GSCALite database to explore the mutation frequency, mutation type, site information, and mRNA expression of CDC20, TOP2A, CDK1, CAT, TAT, and FTCD across LIHC. At the single-cell type, we explored correlation data between gene expression and LIHC by searching the HPA (https://www.proteinatlas.org/) database. We used the GDSC (https://www.cancerrxgene.org/) and CTRP (https://portals.broadinstitute.org/ctrp/) databases to calculate the relationship between gene expression and drug sensitivity.
Statistical analysis
In GEPIA2, we used the analysis of variance (ANOVA) method to compare tumors with normal samples. The Spearman rank correlation coefficient was used to evaluate the correlation between the two groups. We used the Kaplan-Meier method to evaluate the relationship between patient prognosis and gene expression or mutation levels. P < 0.05 is considered a statistically significant difference.
Results
Differential gene acquisition
A total of 557 up-regulated genes and 702 down-regulated genes were obtained (Supplementary Table S1). The location of 1259 genes in chromosomes is shown in Supplementary Figure S1. Compared with the adjacent group, the prognostic analysis of the differential genes was carried out through the database HCCDB6, HCCDB15, and HCCDB18, and 82 PDGs were obtained in the LIHC group, including 36 up-regulated genes (Figure 1A) and 46 down-regulated genes (Figure 1B).
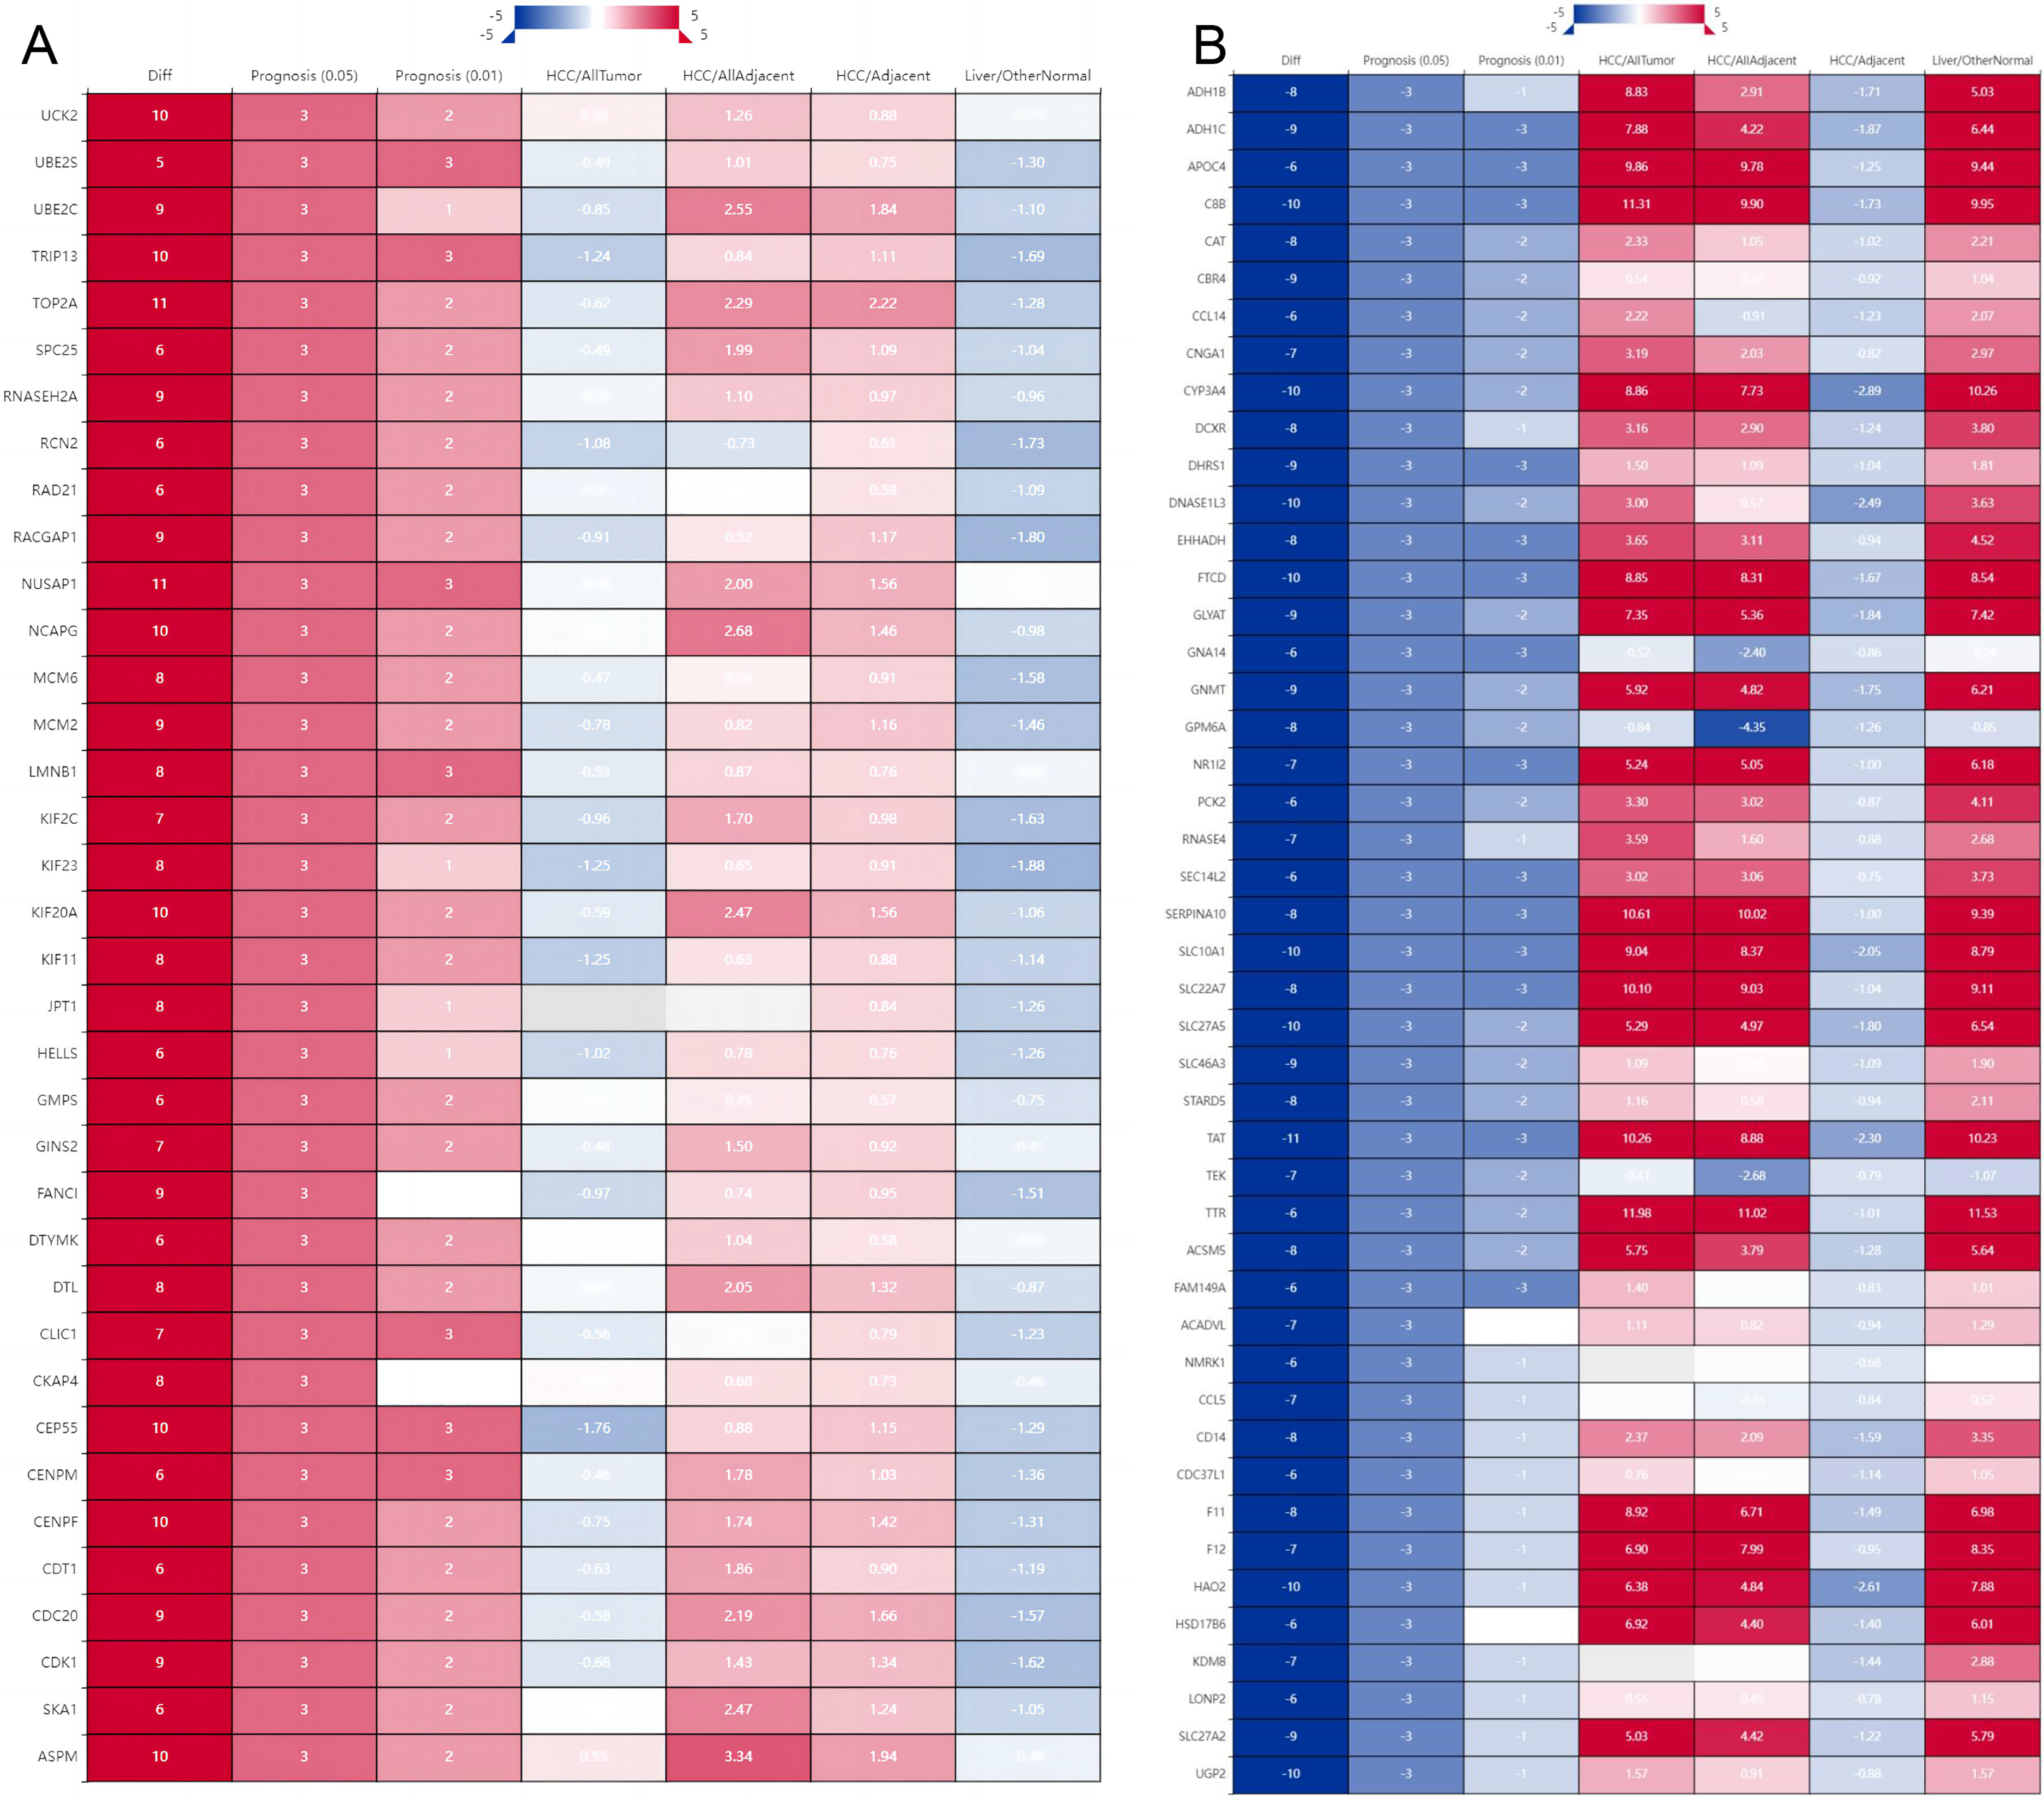
Prognostic gene analysis of hepatocellular carcinoma. (A: Up-regulated gene prognostic analysis; B: Down-regulated gene prognostic analysis. Diff: the number of differentially expressed datasets; Red/Blue for consensus up-regulated/down-regulated; Prognosis: the number of significant datasets by survival analysis; Red/Blue for UNFavorable/Favorable; LIHC/AllTumor: Red/Blue for positive/negative fold change in log2 scale by comparing LIHC with all tumors; LIHC/AllAdjacent: Red/Blue for positive/negative fold change in log2 scale by comparing LIHC with all adjacent samples; LIHC/Adjacent: Red/Blue for positive/negative fold change in log2 scale by comparing LIHC with adjacent samples; Liver/Other Normal: Red/Blue for positive/negative fold change in log2 scale by comparing liver with normal tissues).
Functional annotation of the PDGs
The biological function enrichment analysis of PDGs was performed for 371 GOBP terms (P<0.05), mainly including nuclear division, organelle fission, mitotic nuclear division, chromosome segregation, sister chromatid segregation, nuclear chromosome segregation, mitotic sister chromatid segregation, fatty acid metabolic process (Figure 2A). 51 GOCC terms (P<0.05) were obtained, mainly including chromosomal region, spindle, microtubule, chromosome, centromeric region, condensed chromosome, condensed chromosome, centromeric region, and mitotic spindle (Figure 2B). 74 GOMF terms (P<0.05) obtained, mainly including ATPase activity, microtubule binding, tubulin binding, oxidoreductase activity, lipid transporter activity, catalytic activity, anion transmembrane transporter activity, amide binding, microtubule motor activity (Figure 2C).
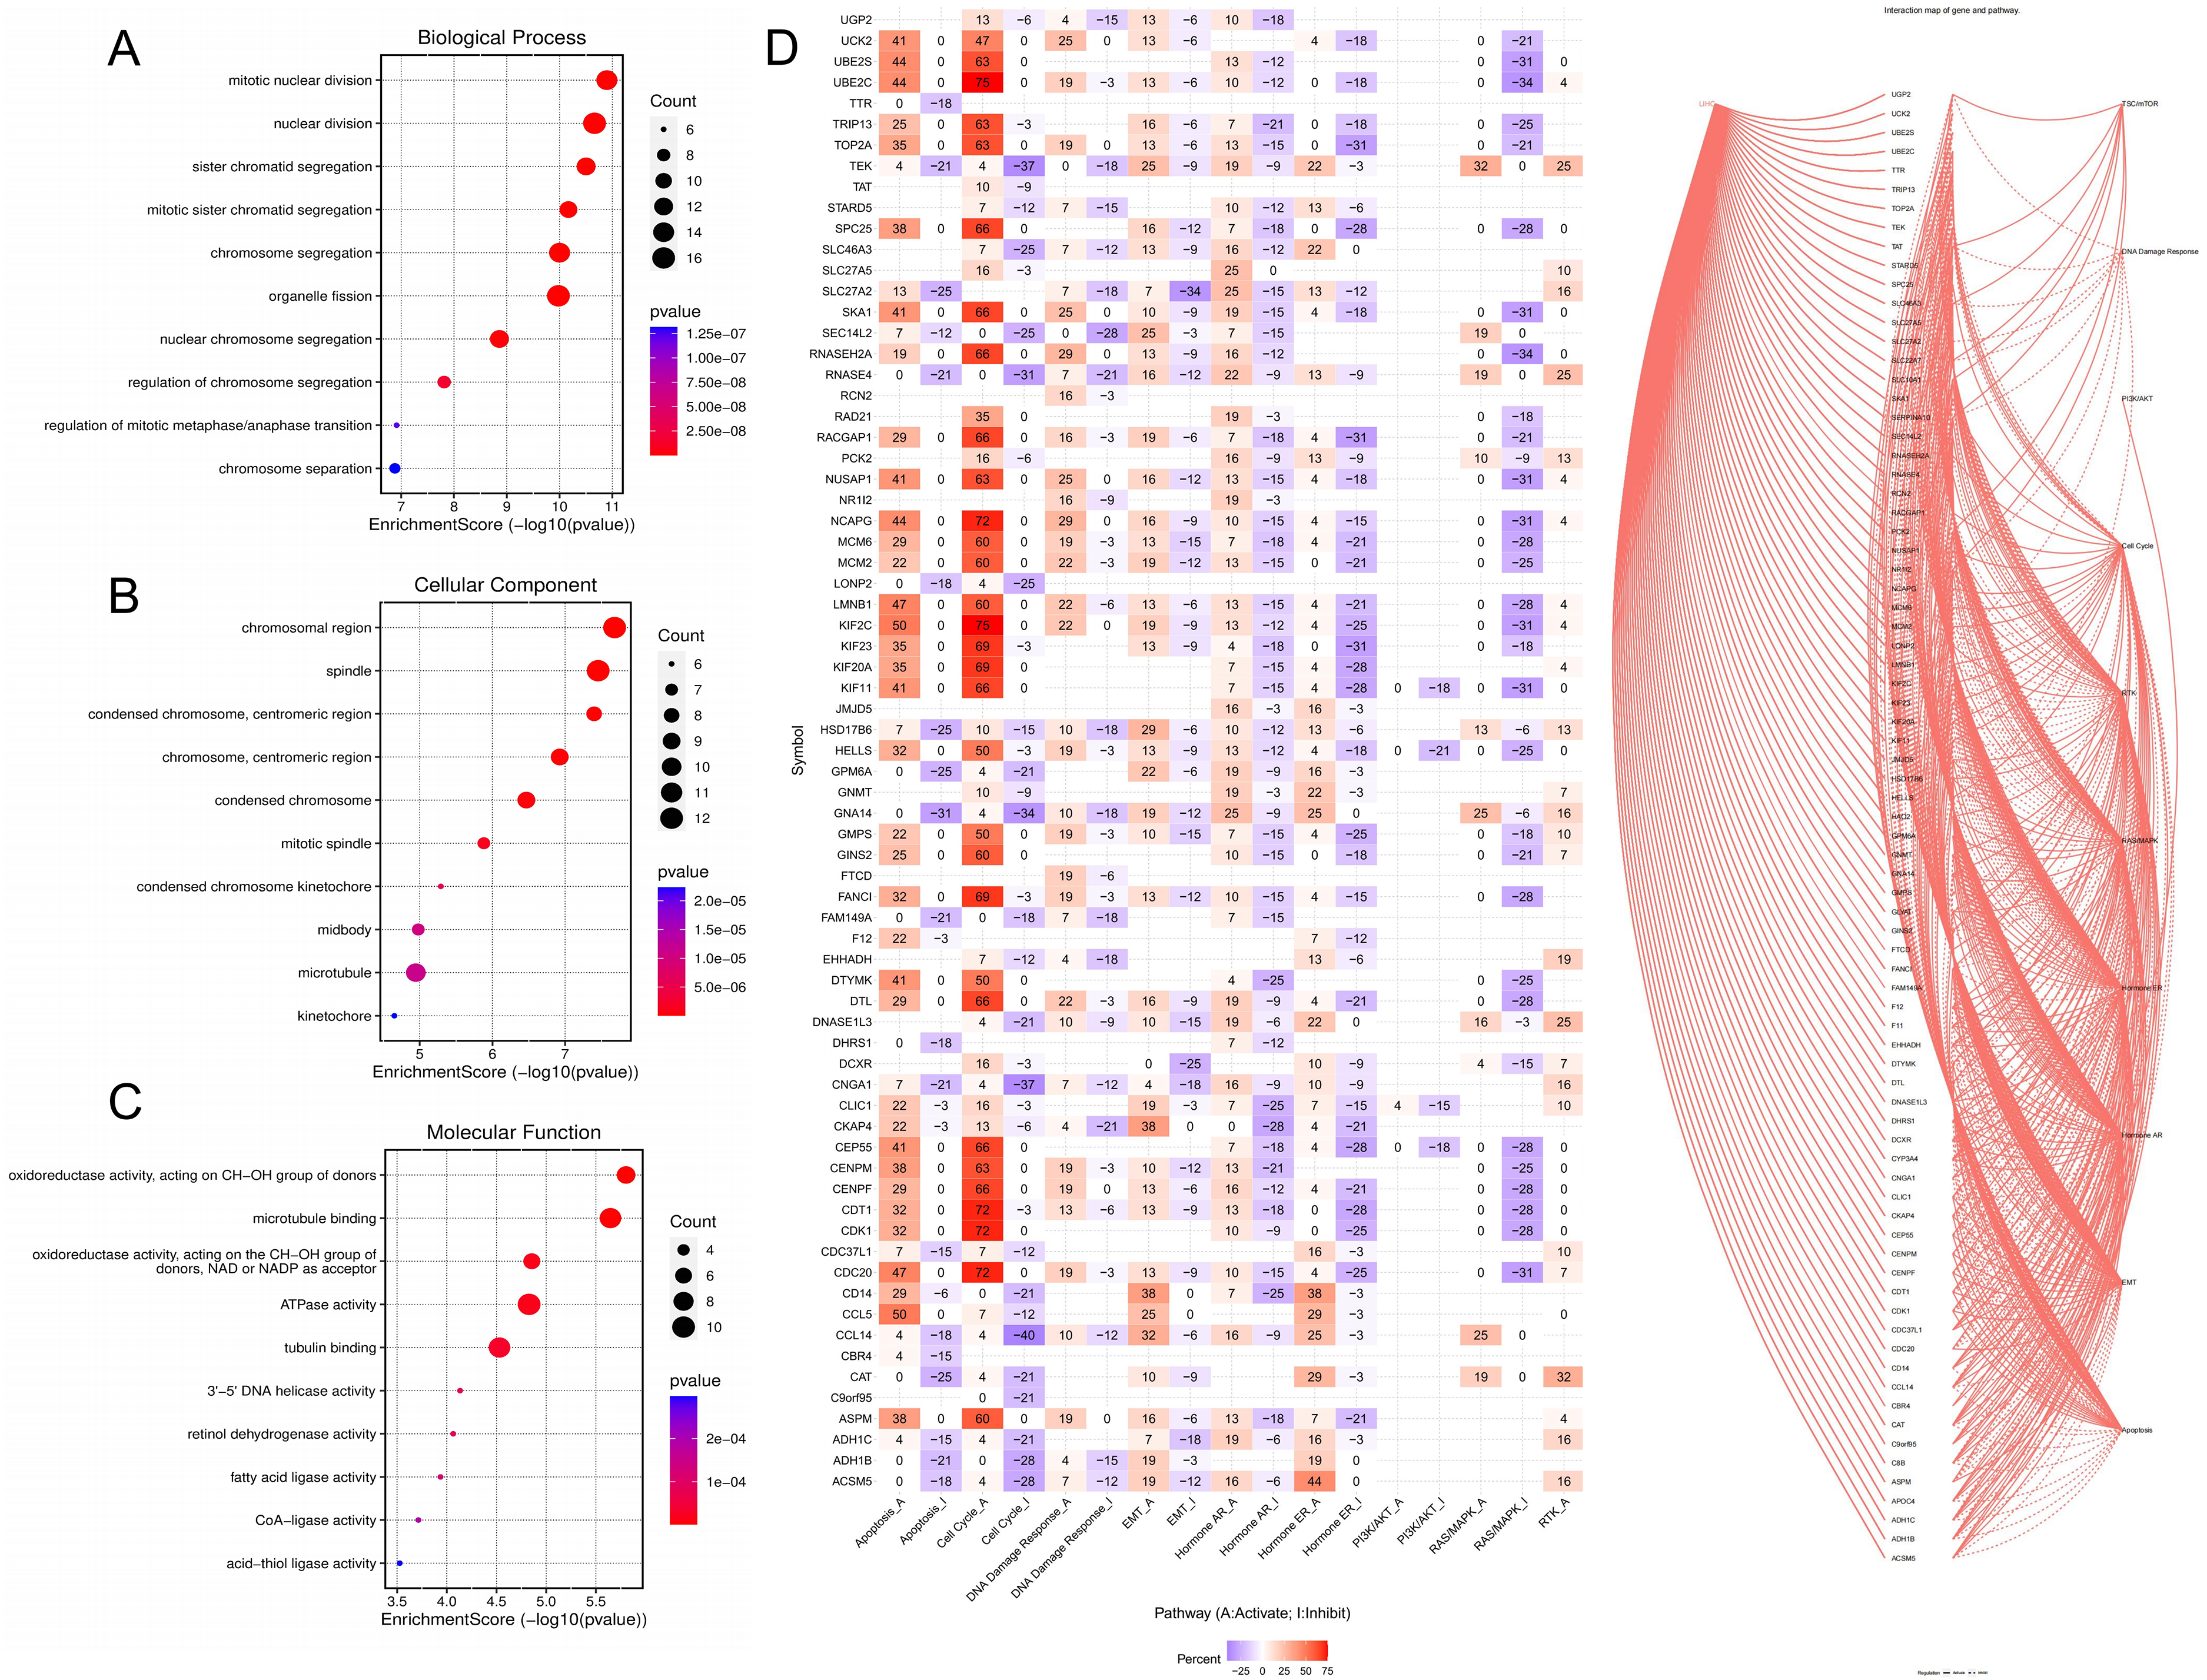
Biological function enrichment and pathway activity analysis of PDGs (A: GOBP analysis; B: GOCC analysis; C: GOCC analysis; D: Pathway analysis).
As shown in Figure 2D, it is the molecular mechanism of LIHC, mainly including p53, TGF-β, Wnt, and MAPK signaling pathways. Through the analysis of signal pathway activity, PDGs could affect signaling pathways such as TSC/mTOR, DNA damage response, PI3 K/AKT, cell cycle, RTK, RAS/MAPK, AR, ER, EMT, apoptosis, etc., red, “A” and solid line represented activation, blue, “I” and dotted line represented inhibition, and the higher the number, the greater the degree of activation or inhibition. It could be concluded that PDGs could activate apoptosis, cell cycle, DNA damage response, and EMT. The LIHC signaling pathway is shown in Supplementary Figure S2.
PPI analysis of the PDGs
The PPI analysis was performed to explore the interactions of PDGs, showing that 36 nodes number, 356 edges number, average node degree was 19.8, avg. local clustering coefficient was 0.854 (Figure 3A) and 46 nodes number, 55 edges number, average node degree was 2.39, avg. local clustering coefficient was 0.406 (Figure 3B). The hub genes obtained by the Degree, MCC, and MNC algorithms include up-regulated genes CDC20, TOP2A, and CDK1 and down-regulated genes CAT, TAT, and FTCD (Figure 3C, 3D). Compared with License/Other Normal and LIHC/Adjacent, high expression of CDC20, TOP2A, and CDK1, as well as low expression of CAT, TAT, and FTCD in LIHC/All Tumor and LIHC/All Adjacent (Supplementary Figure S3).
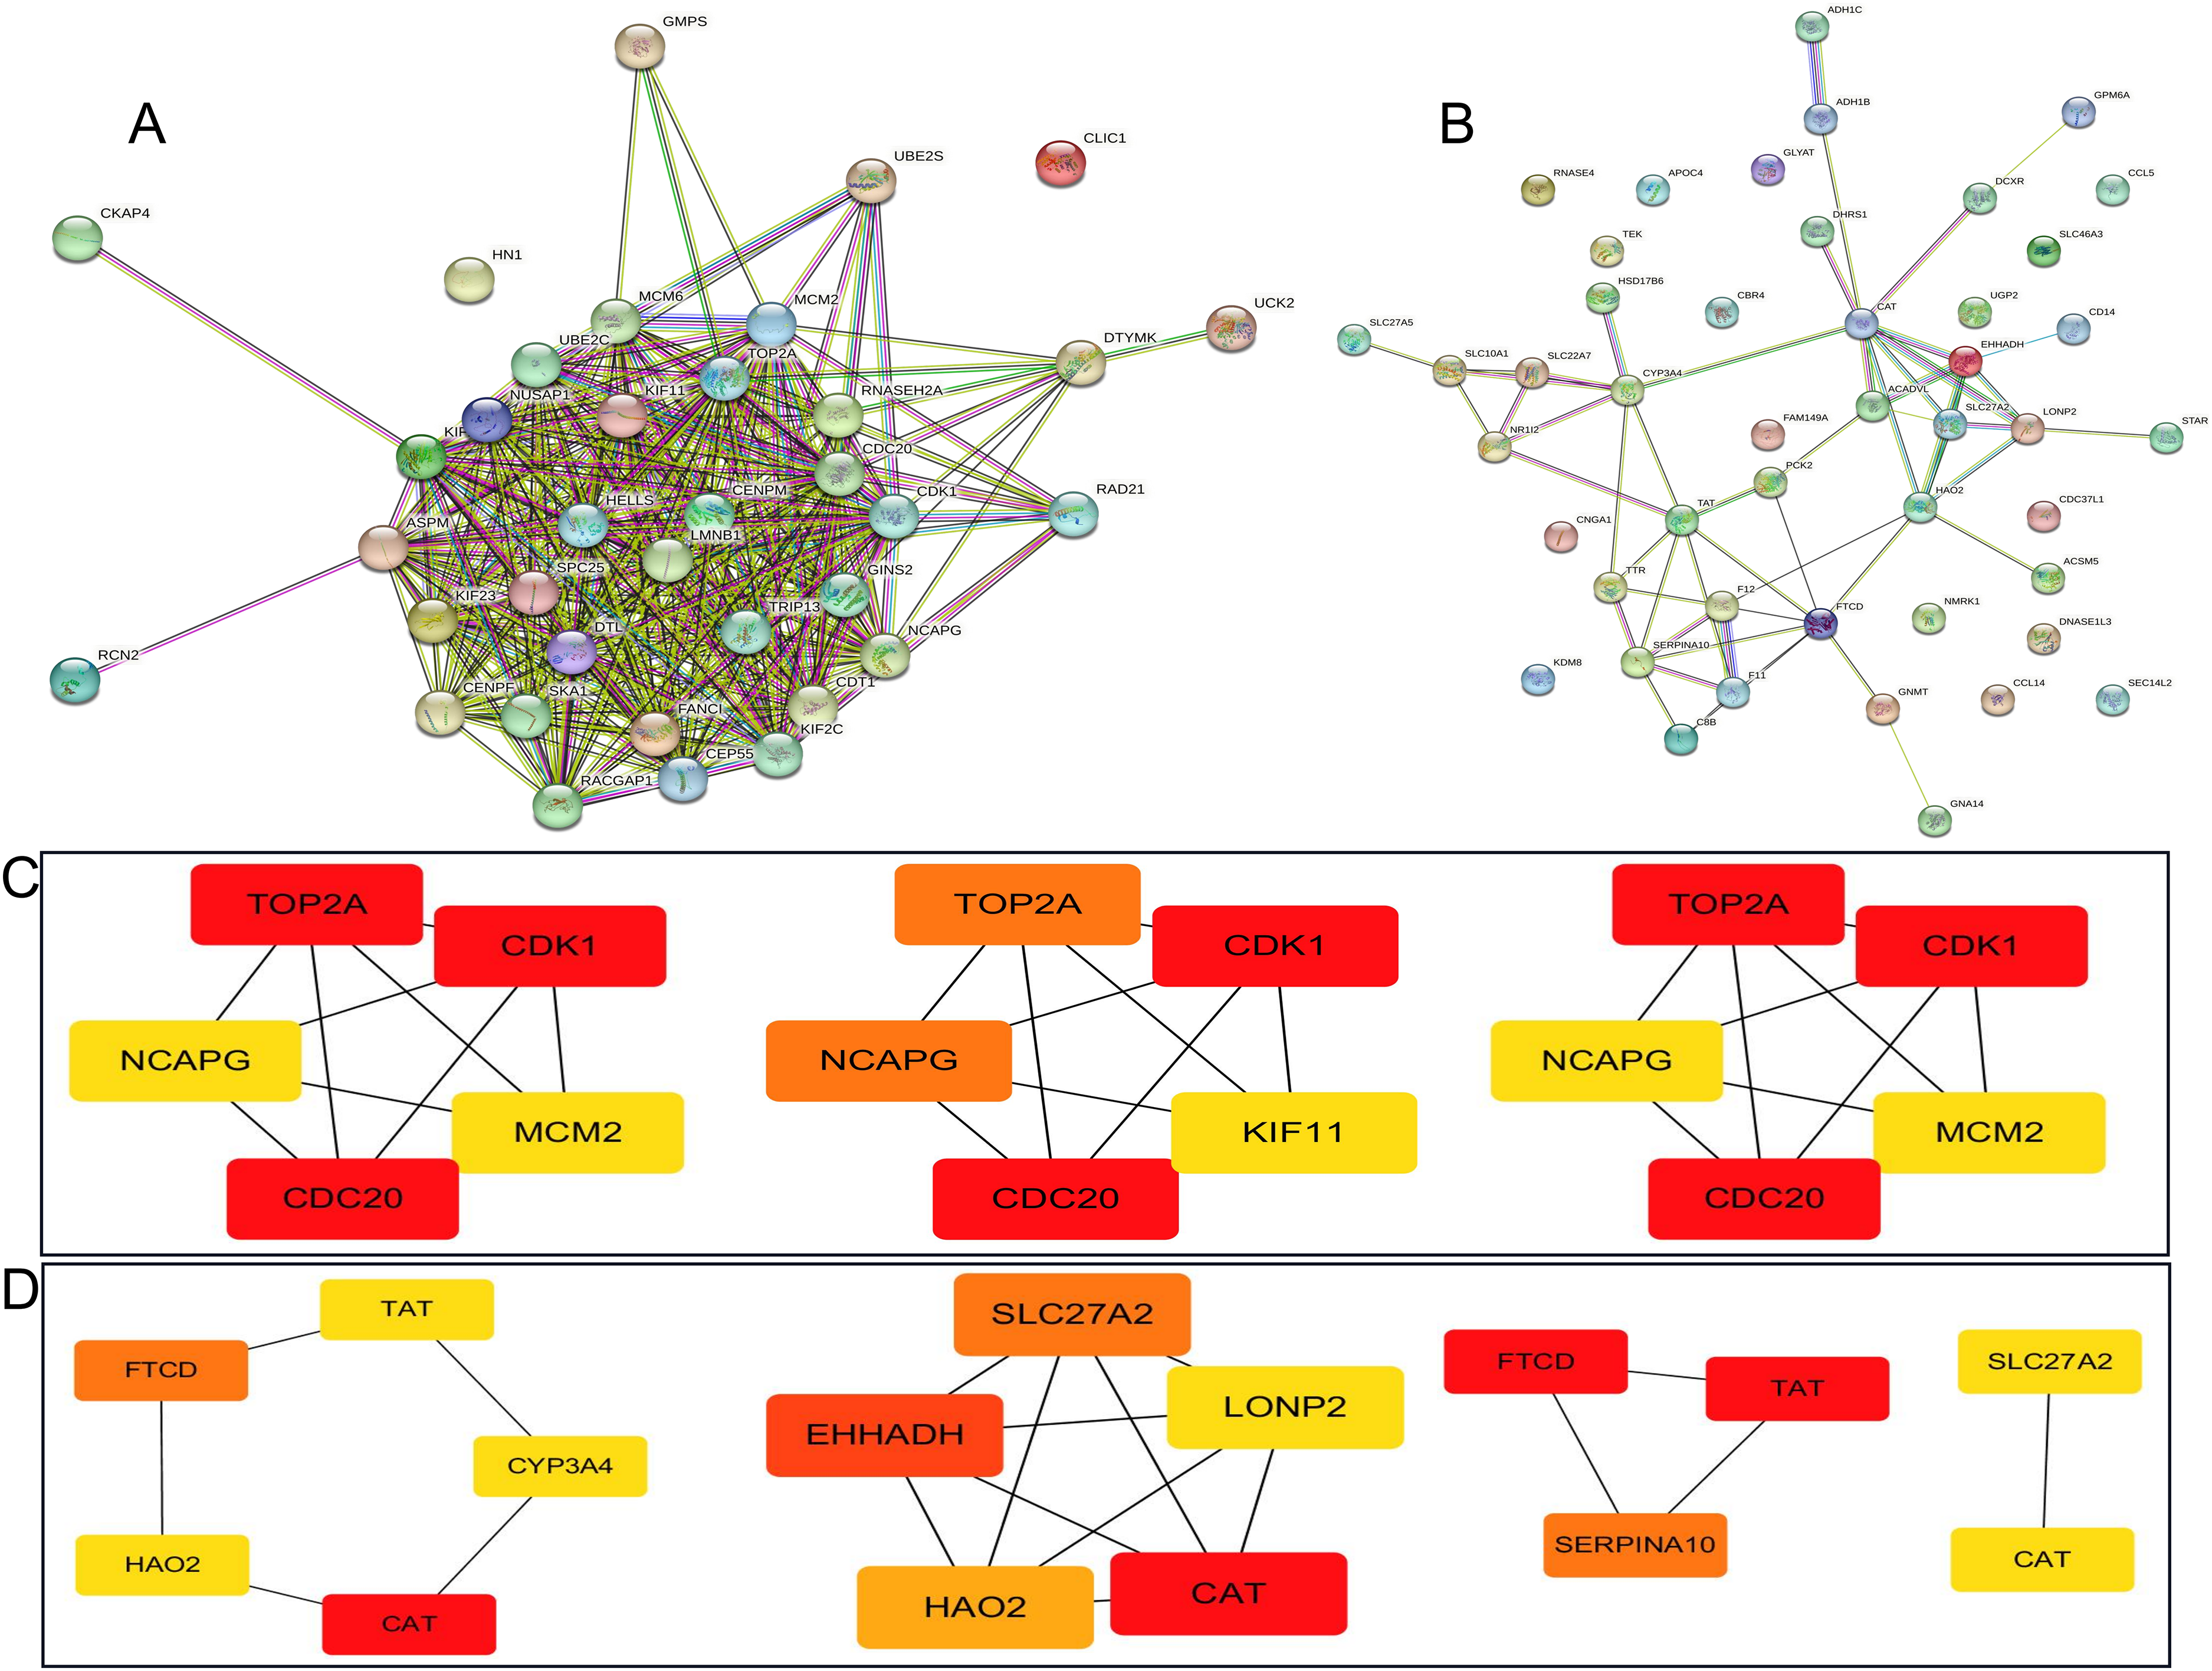
Protein-Protein Interaction Network of the PDGs (A: The up-regulated genes PPI analysis; B: The down-regulated genes PPI analysis; C: Degree, MCC, and MNC algorithm selected the hub up-regulated genes; D: Degree, MCC, and MNC algorithm selected the hub down-regulated genes).
Hub genes reliability verification
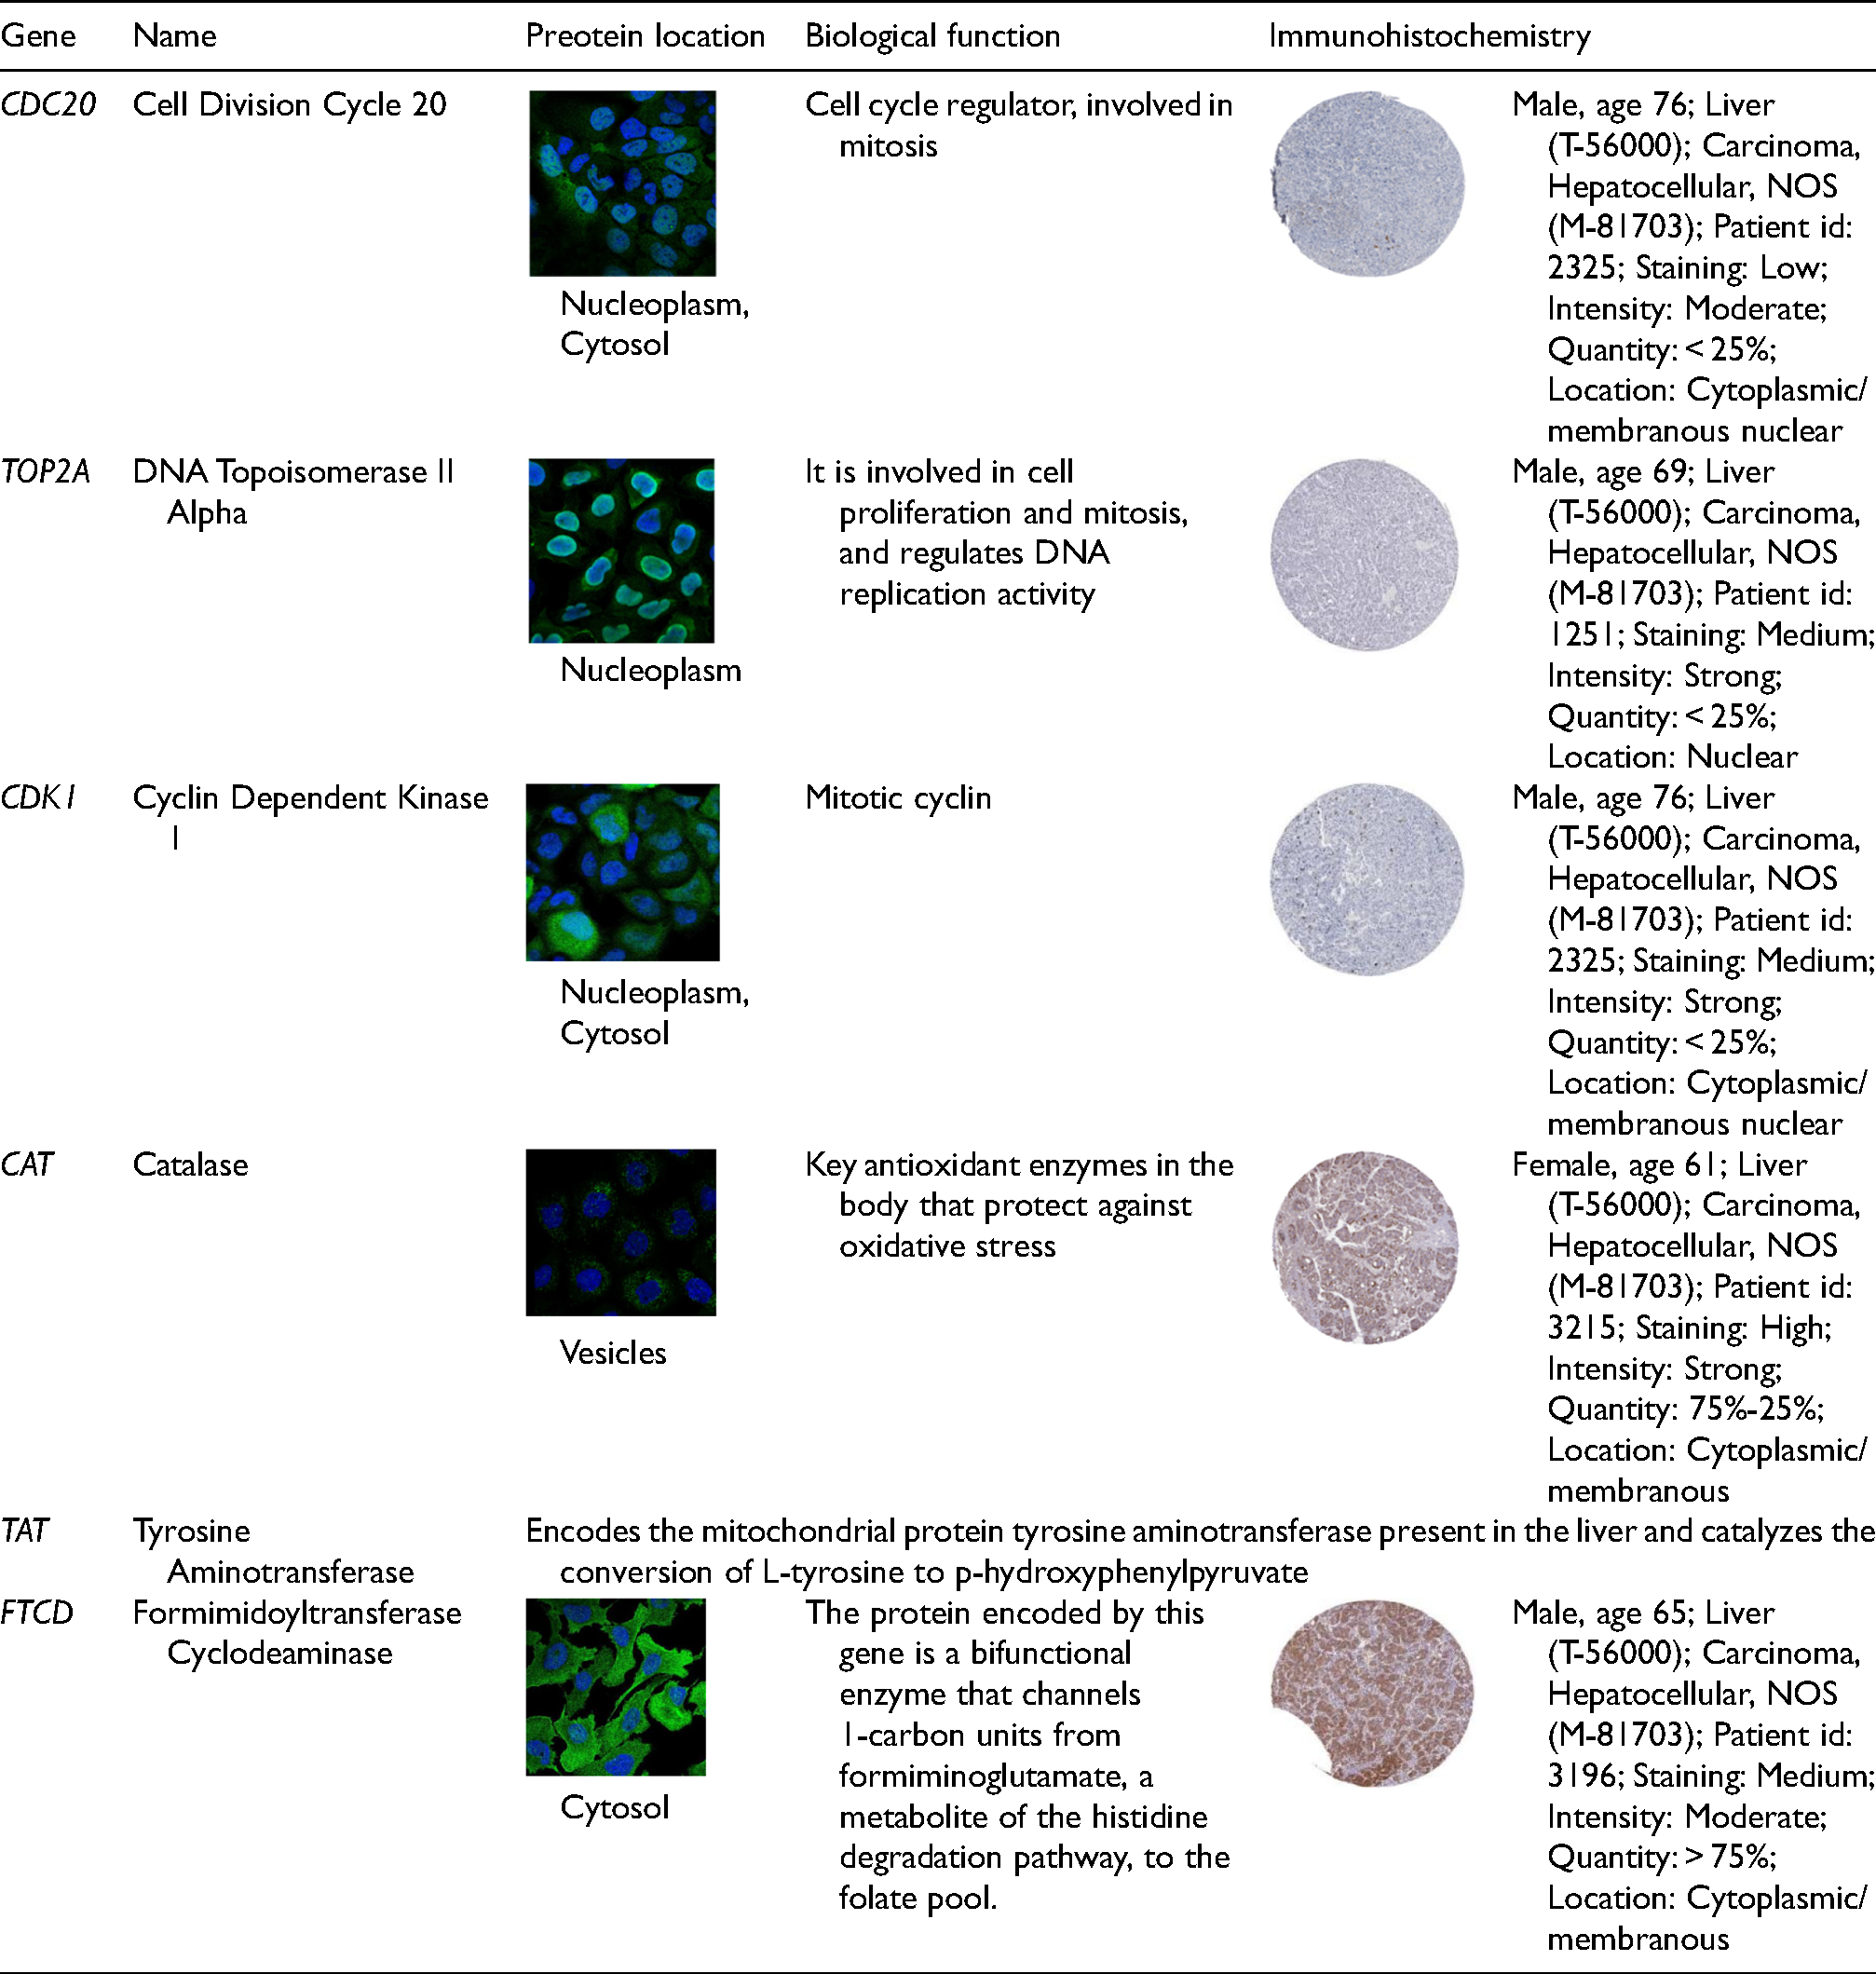
Validation datasets were obtained from GSE57957 (Platform: GPL10558 Illumina HumanHT-12 V4.0 expression beadchip), GSE101728 (Platform: GPL21047 Agilent-074348 Human LncRNA v6 4X180 K), and GSE62232 (Platform: GPL570 [HG-U133_Plus_2] Affymetrix Human Genome U133 Plus 2.0 Array) (Figure 4A-4C). Meanwhile, the expression of total protein of hub genes in LIHC and healthy control group was analyzed using the UALCAN database (Supplementary Figure S4A), next, normal hepatocytes (HL7702) and hepatocellular carcinoma cells (HepG2) were used to detect the expression of up-regulated hub genes (Figure 4D) and down-regulated hub genes (Figure 4E). Compared with the normal group, the expression of CDC20, TOP2A, and CDK1 was high, and the expression of CAT, TAT, and FTCD was low in HepG2 cells (P < 0.05) (Figure 4F). We used the HPA database to search the expressions of CDC20, TOP2A, CDK1, CAT, and FTCD in the liver pathology of different clinical samples, and the results showed that the above proteins were widely distributed in the liver (Figure 4G). Table 2 shows the biological functions, protein expression localization, and pathological immunostaining of hub genes. GEPIA2 was used to analyze the relationship between hub genes expression and tumor pathological stage. As shown in Supplementary Figure S4B, stage-specific changes in CDC20, TOP2A, CDK1, CAT, TAT, and FTCD were observed in LIHC (P < 0.05).
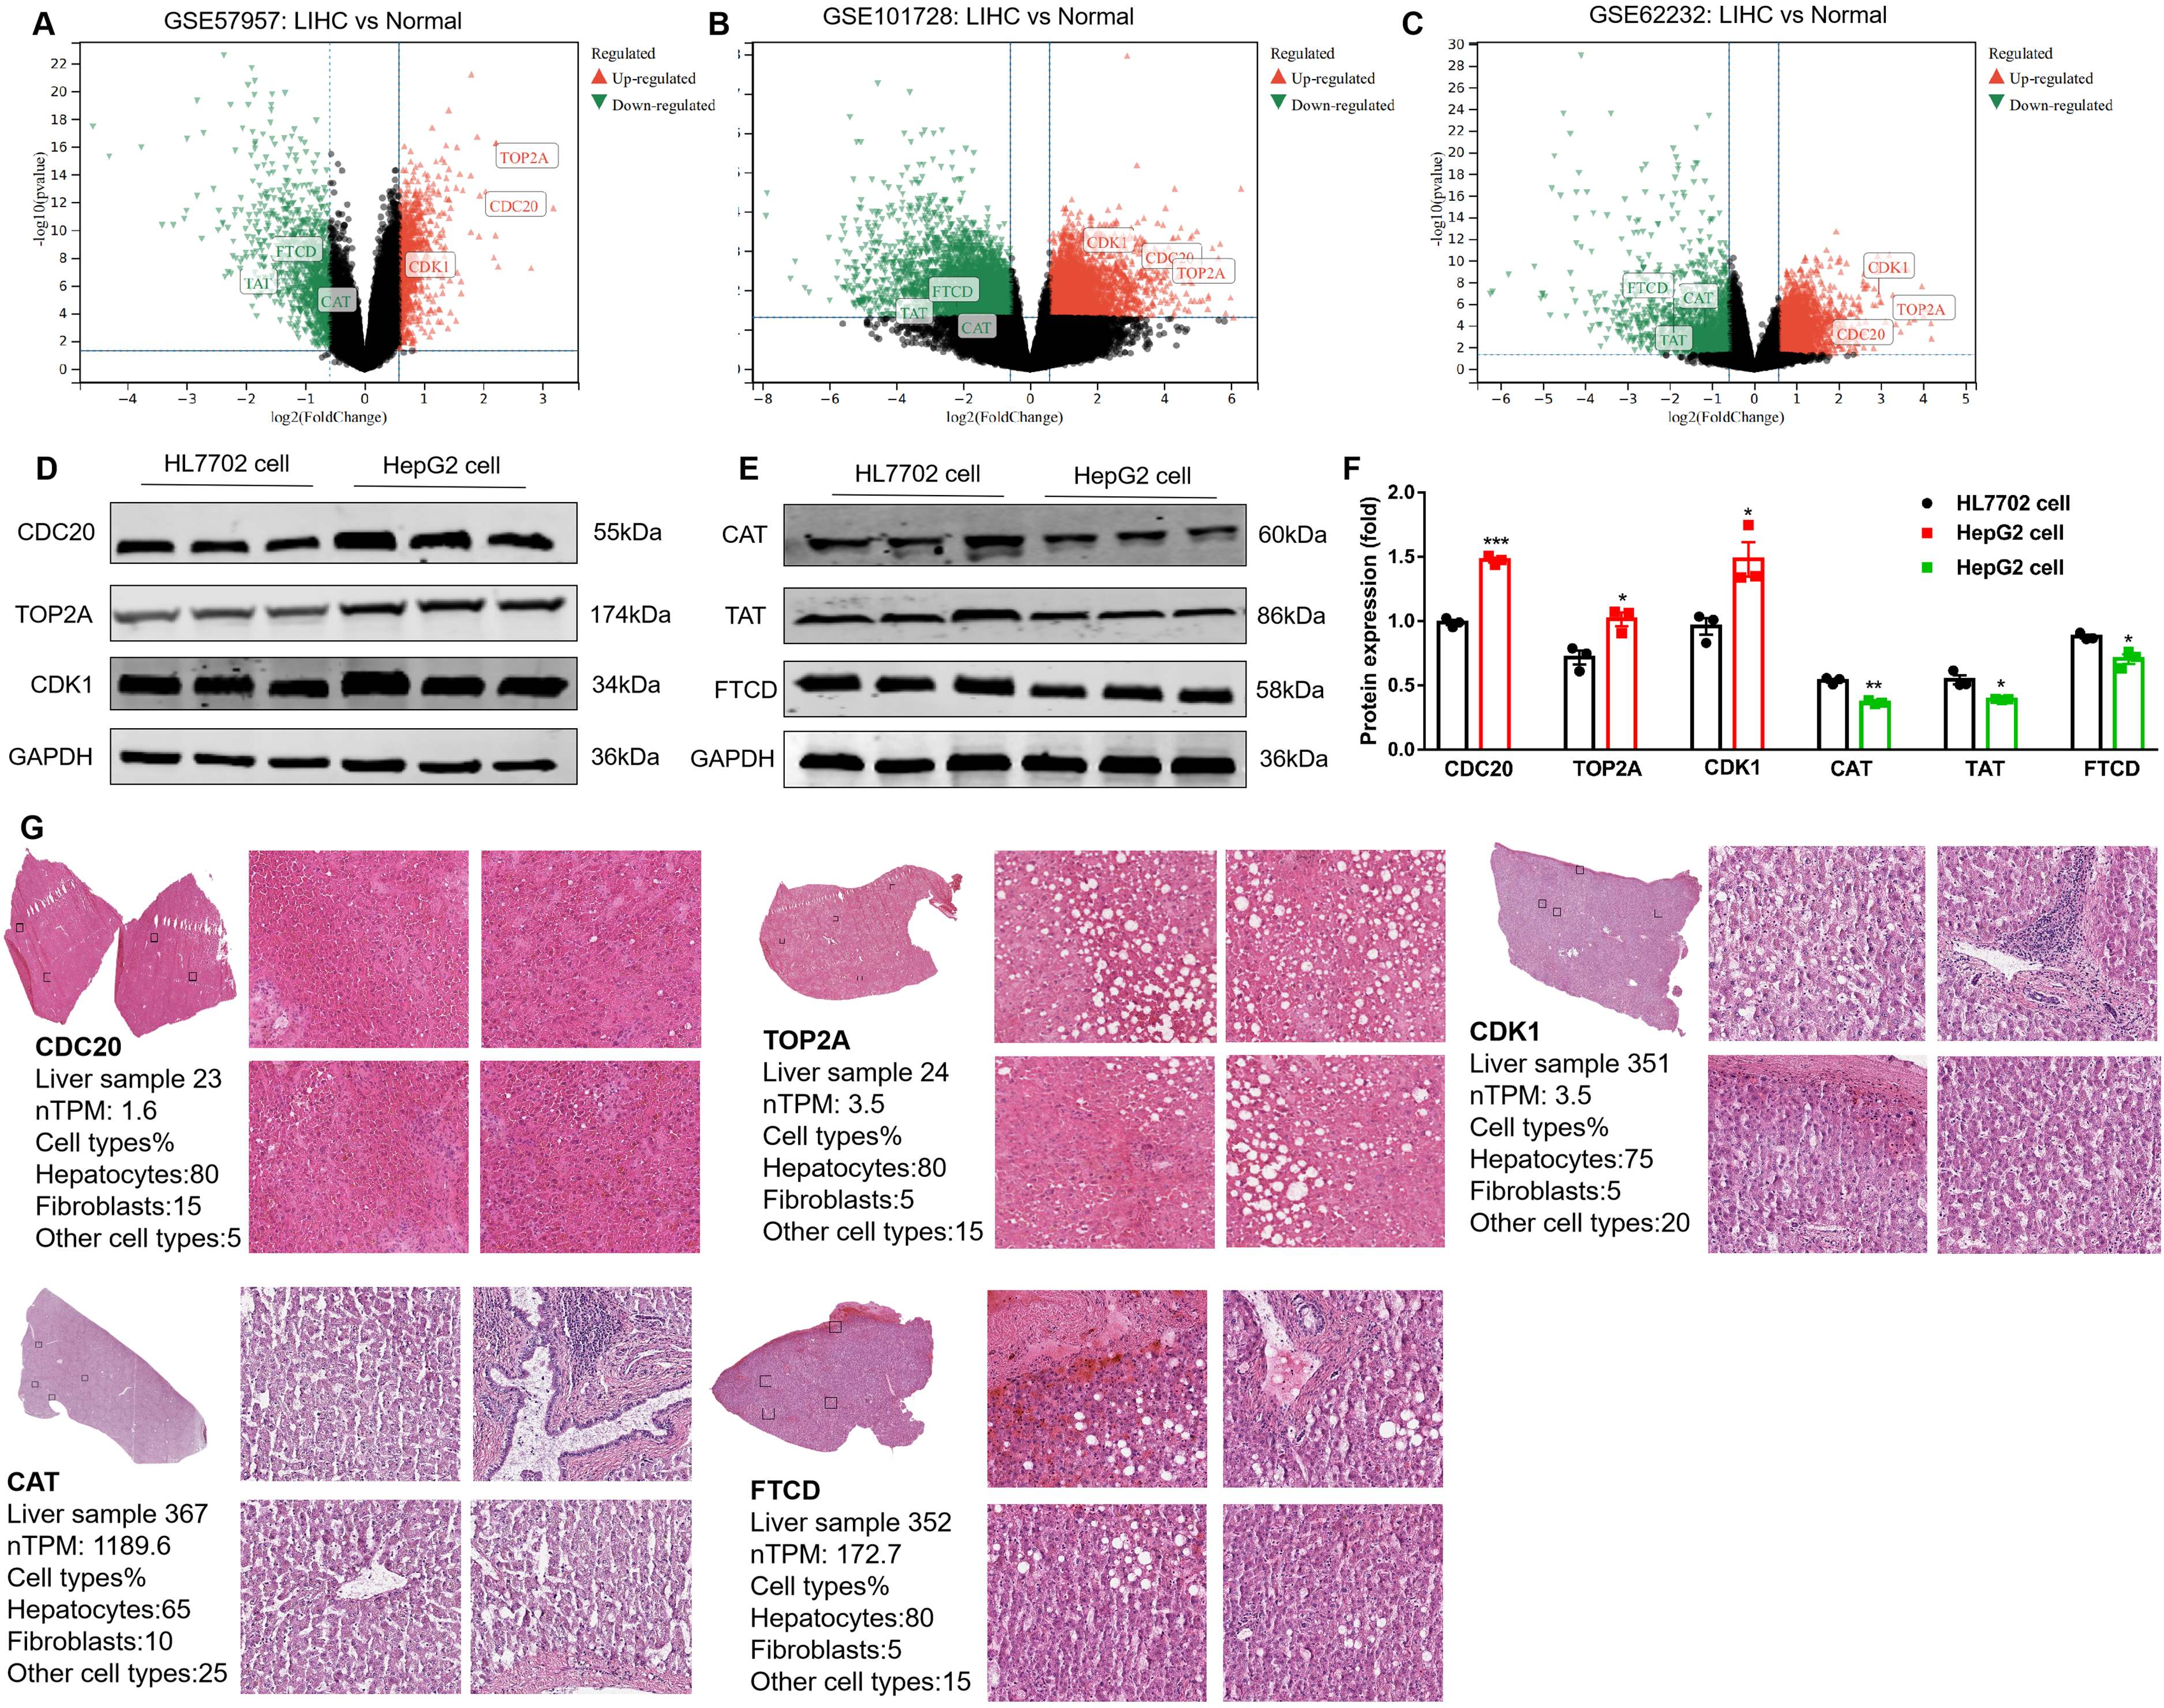
Hub gene reliability verification (A: Hub genes were differentially expressed in GSE57957; B: Hub genes were differentially expressed in GSE101728; C: Hub genes were differentially expressed in GSE62232; D-F: The expression of hub genes was detected by Western blot; G: The expressions of CDC20, TOP2A, CDK1, CAT, and FTCD in the liver pathology of different clinical samples).
The biological functions, protein expression localization, and pathological immunostaining of hub genes.
Immunoinfiltration analysis
The tumor microenvironment of LIHC plays a crucial role in the occurrence and development of LIHC. The tumor microenvironment of LIHC is composed of stromal cells (including immune cells, fibroblasts and endothelial cells), structural components (such as extracellular matrix), and signaling components (chemokines, cytokines, and growth factors), which affect tumor immune escape, response to immunotherapy, and patient prognosis. Therefore, we analyzed hub genes for association with 24 immune cells, including aDC [activated DC]; B cells; CD8 T cells; Cytotoxic cells; DC; Eosinophils; iDC [immature DC]; Macrophages; Mast cells; Neutrophils; NK CD56bright cells; NK CD56dim cells; NK cells; pDC [Plasmacytoid DC]; T cells; T helper cells; Tcm [T central memory]; Tem [T effector memory]; TFH [T follicular helper]; Tgd [T gamma delta]; Th1 cells; Th17 cells; Th2 cells; TReg (Supplementary Table 2). Hub gene are highly associated with immune cells, for example, Th2 cells were positively correlated with CDC20 (R = 0.784), TOP2A (R = 0.710), and CDK1 (R = 0.731). Th17 cells were positively correlated with CAT (R = 0.312), TAT (R = 0.294), and FTCD (R = 0.4) (Figure 5). Among immune infiltrates, hub genes associated with T cell subsets, especially Th2 and Th17 cells. Th2 cells correlated with CDC20, TOP2A, and CDK1, suggesting a role in shaping Th2 response in LIHC. Th17 cells, proinflammatory, correlated with CAT, TAT, and FTCD, indicating hub gene contribution to proinflammatory milieu. Macrophages, neutrophils, and NK cells also correlated with hub genes, highlighting their roles in LIHC. Immunoinfiltration analysis provides insights into hub gene-immune infiltrate relationships in LIHC, emphasizing tumor microenvironment importance and potential therapeutic avenues targeting hub genes.
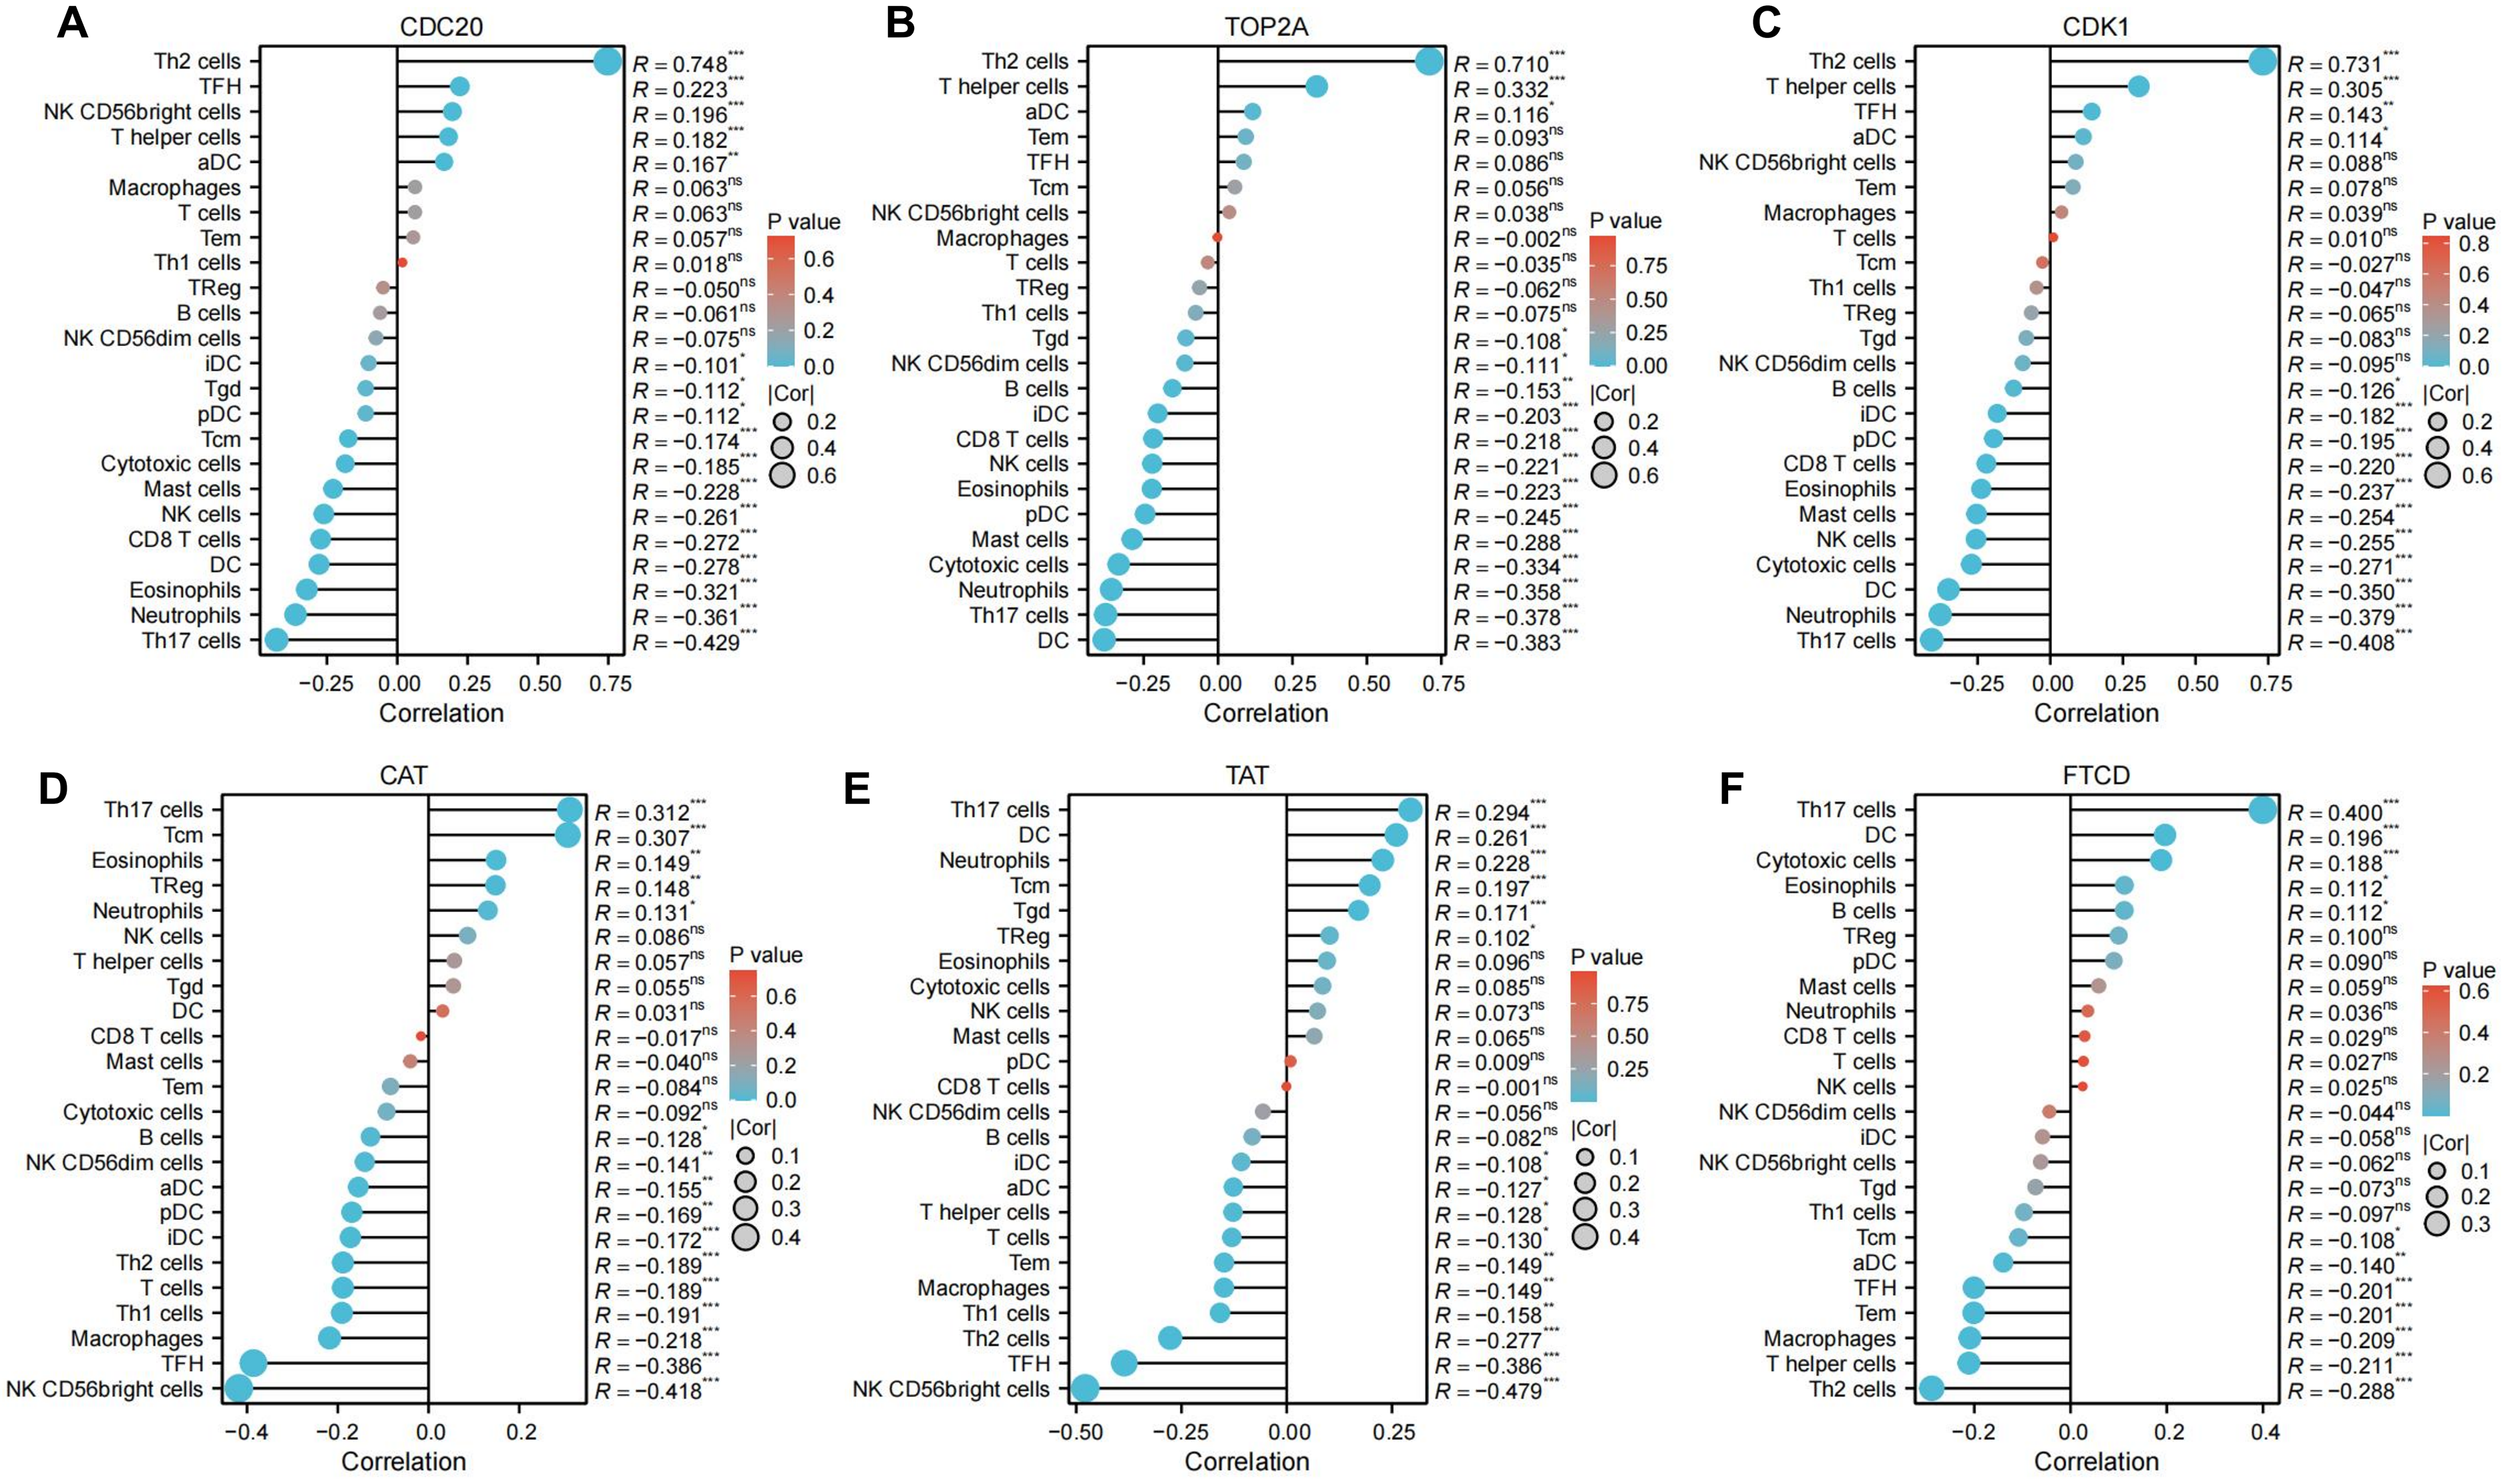
Immunoinfiltration analysis of hub genes, including (A) CDC20, (B) TOP2A, (C) CDK1, (D) CAT, (E) TAT, and (F) FTCD. The absolute value of correlation coefficient represents the degree of correlation, and 0-0.3 represents weak or no correlation. 0.3-0.5 represents weak correlation; 0.5-0.8 represents moderate correlation; 0.8-1 represents a strong correlation. *P < 0.05; **P < 0.01; ***P < 0.001.
Prognostic and survival analysis
The chromosomal location of CDC20, TOP2A, CDK1, CAT, TAT, and FTCD are shown in Figure 6A. These genes have a good prognosis in LIHC (P < 0.05) (Figure 6B), such as CDC20 (HR = 1.34374548), TOP2A (HR = 1.252426195), CDK1 (HR = 1.302853104), CAT (HR = 0.81583186), FTCD (HR = 0.875480481), TAT (HR = 0.917340329). We used GEPIA2 to explore the role of hub genes in patient prognosis, including OS and DFS. In OS, high expression of CDC20, TOP2A, and CDK1 was associated with poor prognosis in patients with LIHC (P < 0.05); inversely, high expression of CAT and TAT was associated with good prognosis in patients with LIHC (P < 0.05) (Figure 6C and Figure 7A). In DFS, high expression of CDC20, TOP2A, and CDK1 was associated with poor prognosis (P < 0.05); inversely, high expression of TAT was associated with good prognosis (P < 0.05) (Figure 6D and Figure 7B). The closer the AUC was to 1, the better the prognostic efficacy was. When AUC was above 0.9, the prognostic efficacy was better, such as CDC20 (AUC = 0.980), TOP2A (AUC = 0.973), and CDK1 (AUC = 0.977) (Figure 6E). We also analyzed the prognosis of genes at 1-, 3-, and 5-year intervals, and found that CDC20, TOP2A, and CDK1 have a good prognosis and can serve as potential therapeutic and preventive targets for LIHC (Figure 8A). With increasing survival time, the AUC of CDC20, TOP2A, and CDK1 showed a significant downward trend, while the AUC of CAT, TAT, and FTCD showed an upward trend. In the Figure 8B, each gene is divided into two levels: low-risk and high-risk, and corresponding points are given for each level. These points are summarized as Total Points and converted into a continuous prediction value through a Linear Predictor. Based on this predicted value, survival probabilities of 1-, 3-, and 5-year are also provided. The impact of CDC20, TOP2A, CDK1, CAT, TAT, and FTCD gene expression on the survival of LIHC patients. These indicators may have prognostic value in LIHC, as their expression levels or status may be correlated with the patient's survival probability.
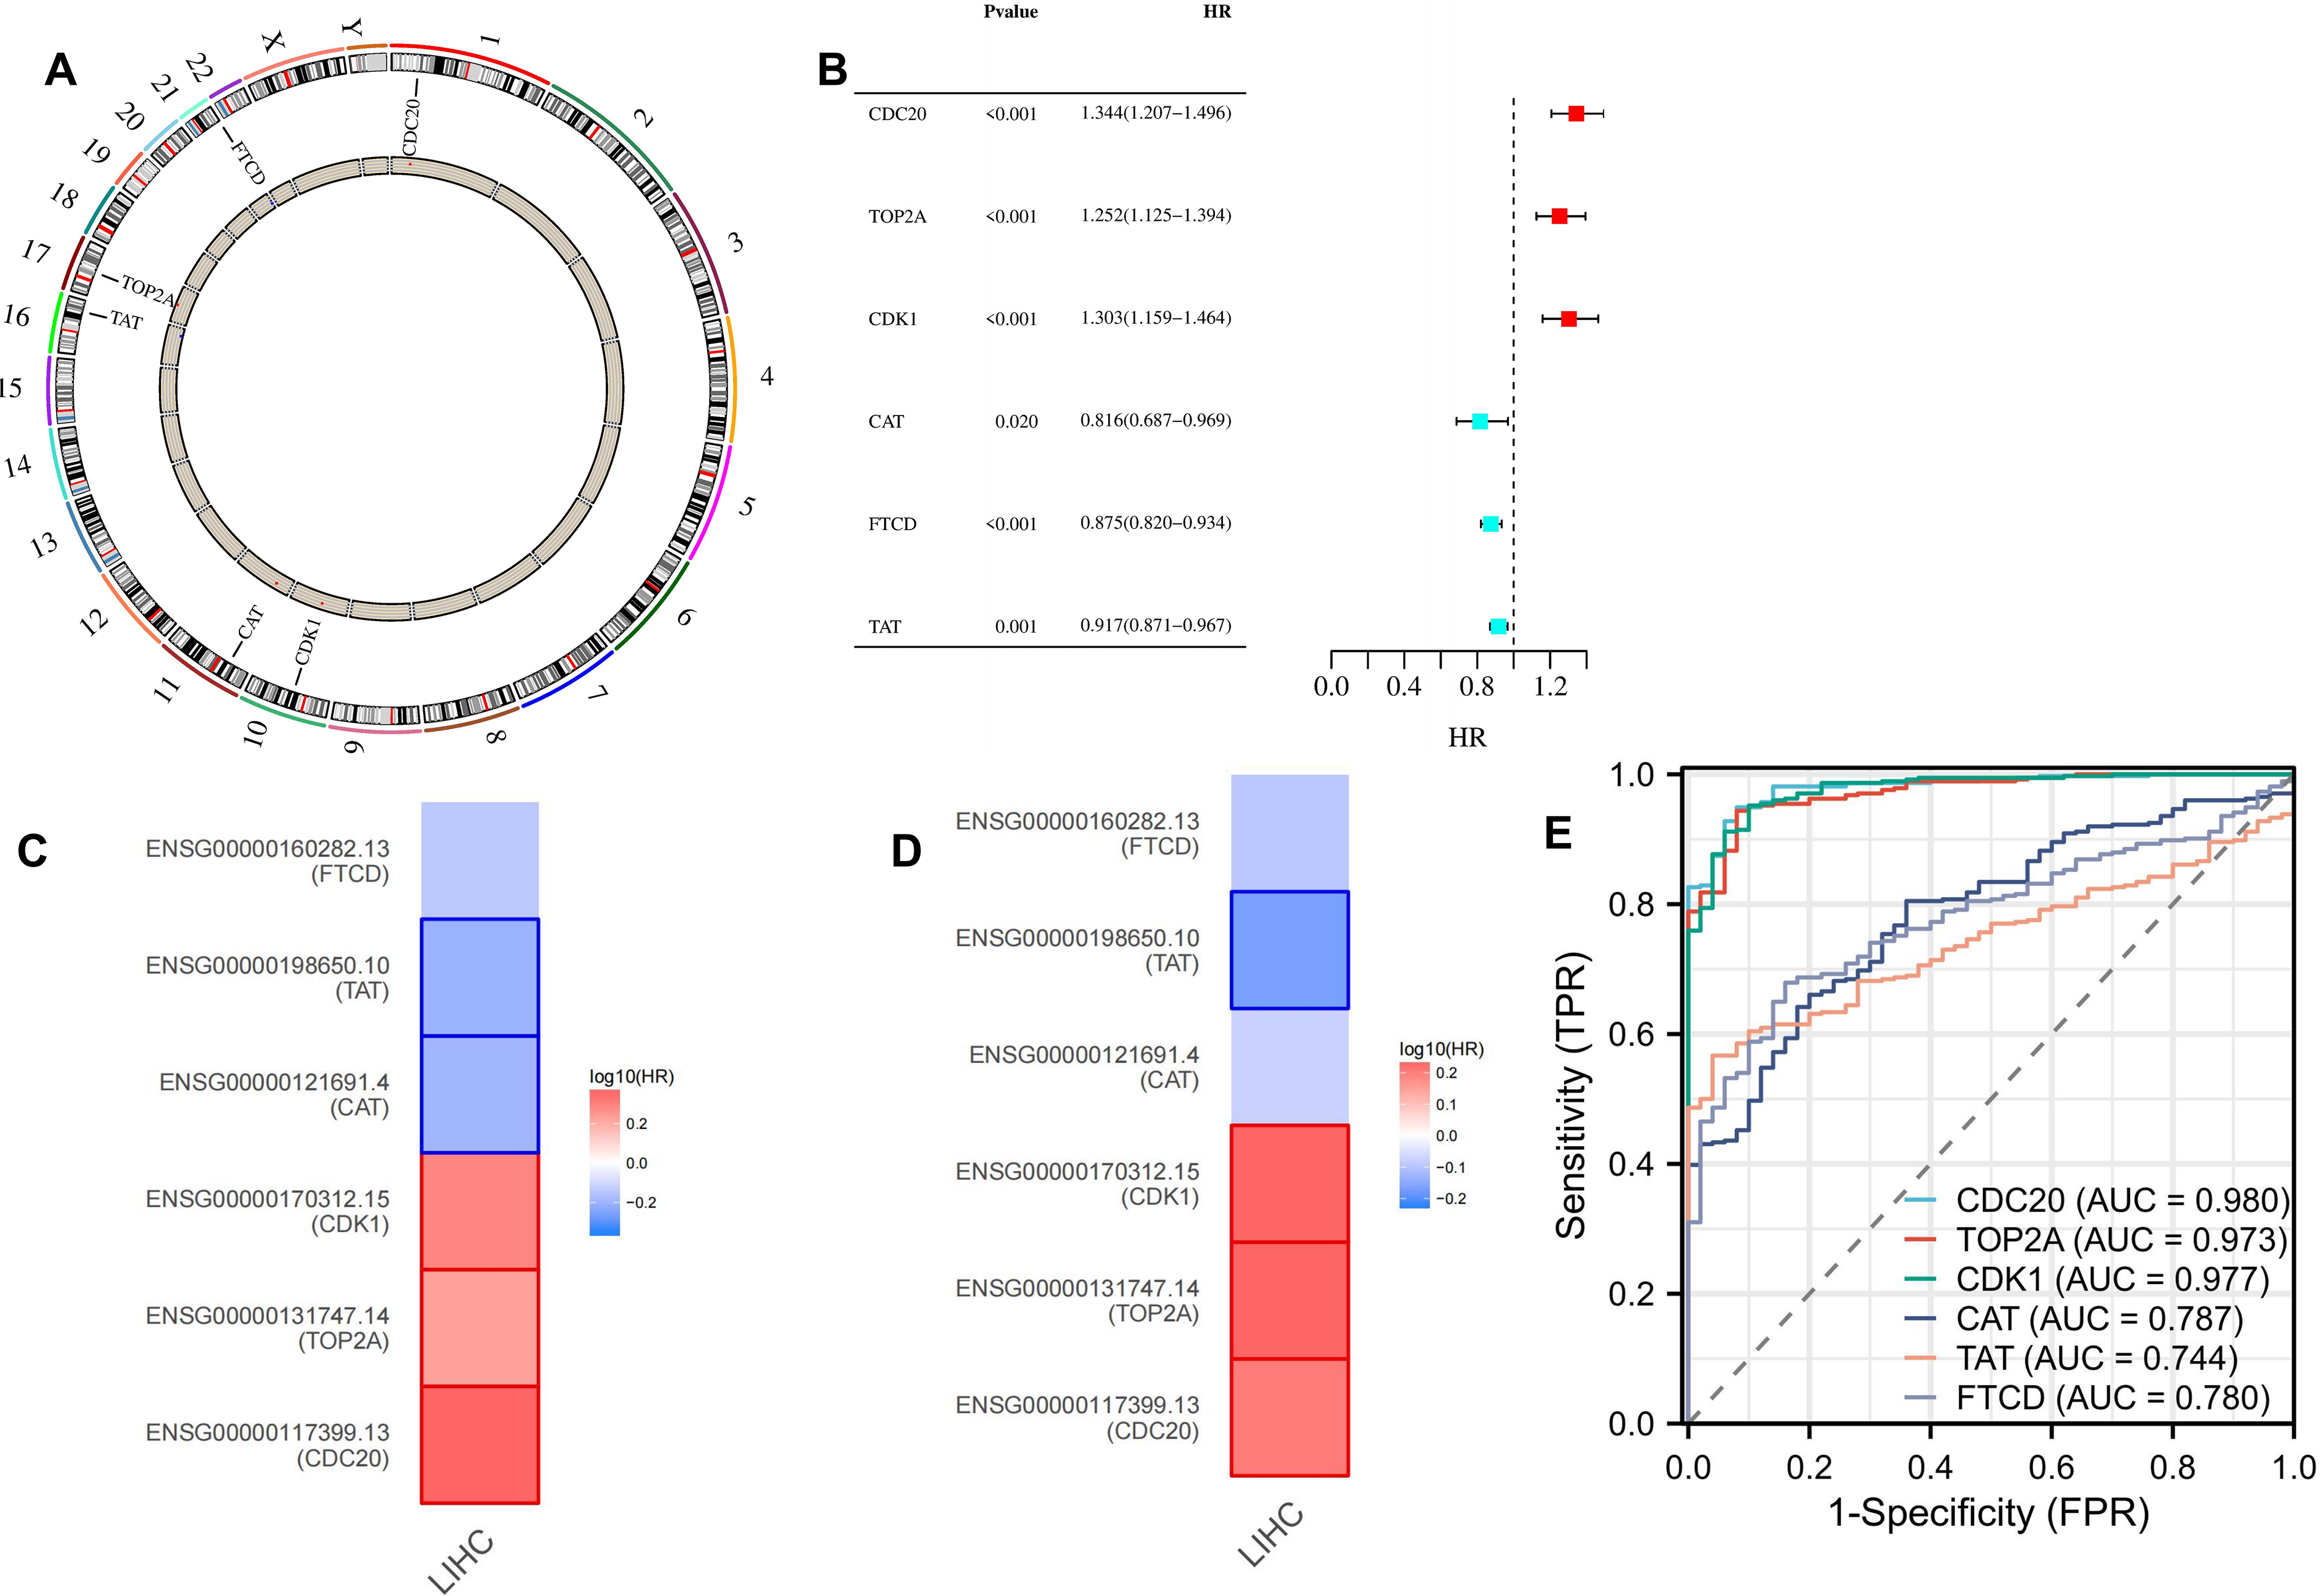
Survival and prognostic analysis of hub genes. (A: The gene is located on the chromosome; B: Prognostic analysis of CDC20, TOP2A, CDK1, CAT, TAT, and FTCD; C and D: GEPIA2 indicated the roles of hub genes expression in patients’ prognosis, including OS (C) and RFS (D); E: Diagnostic value of CDC20, TOP2A, CDK1, CAT, TAT, and FTCD).
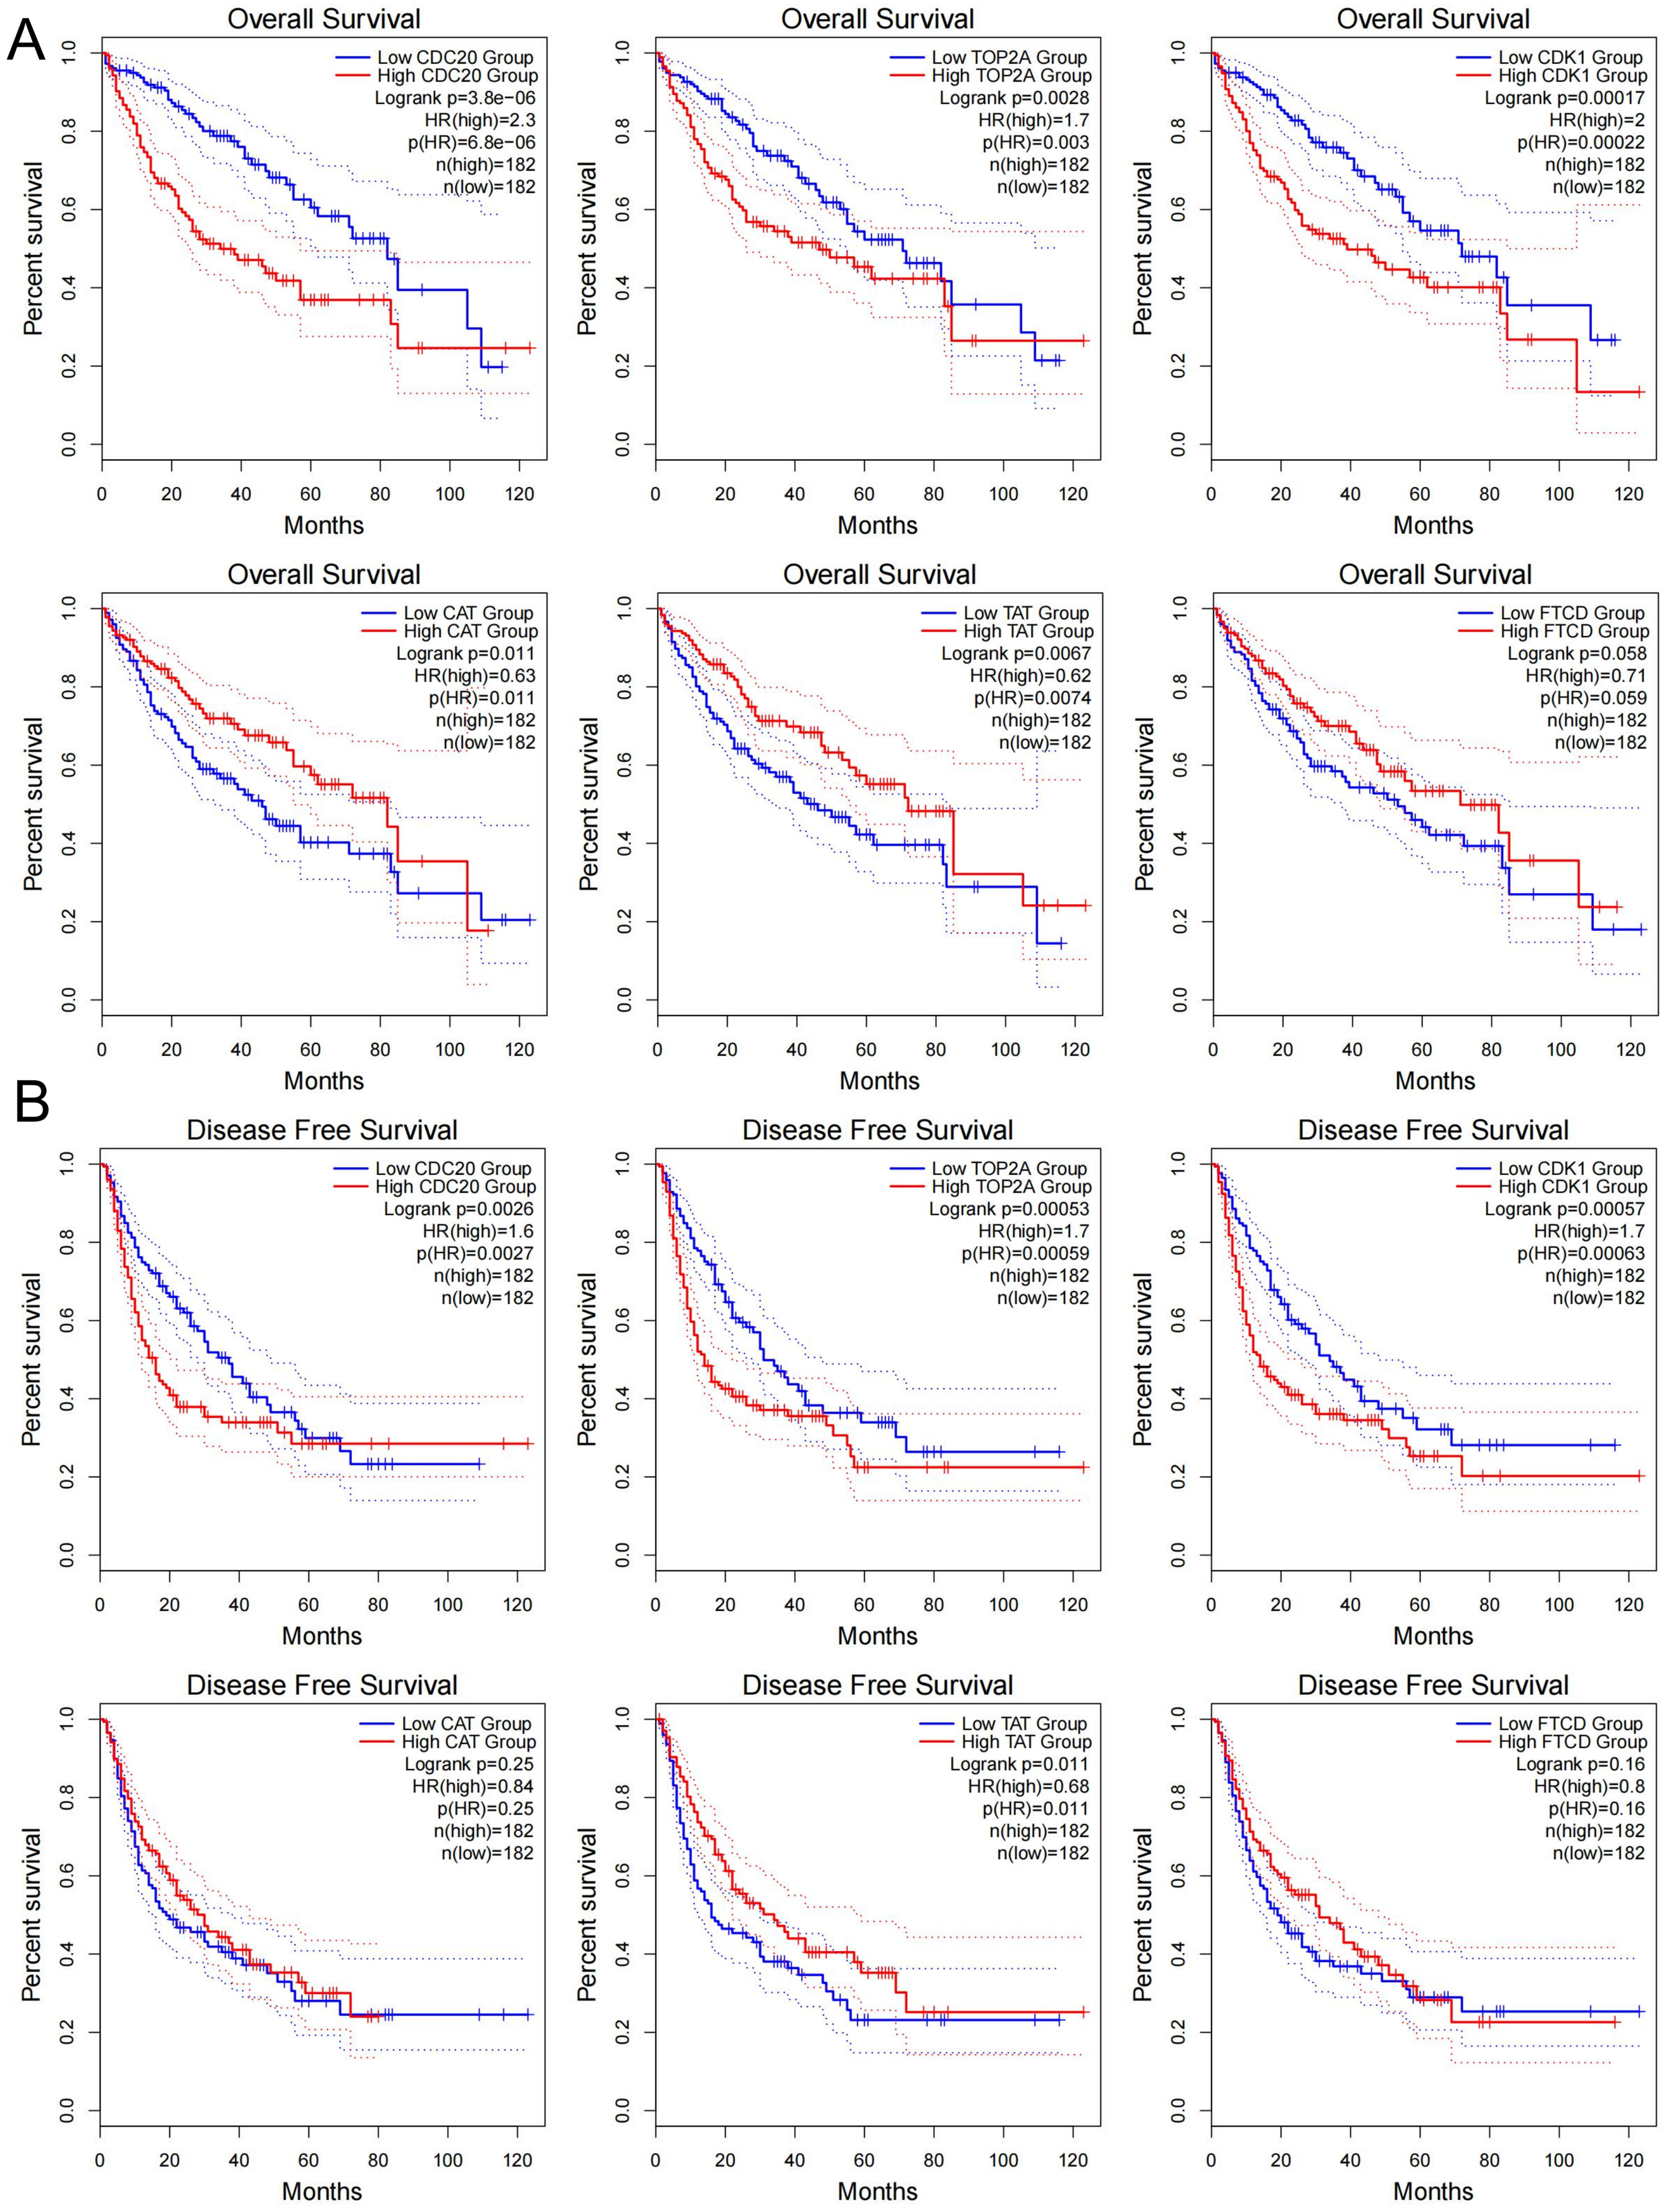
GEPIA2 indicated the roles of CDC20, TOP2A, CDK1, CAT, TAT, and FTCD expression in patients’ prognosis, including OS (A) and DFS (B).
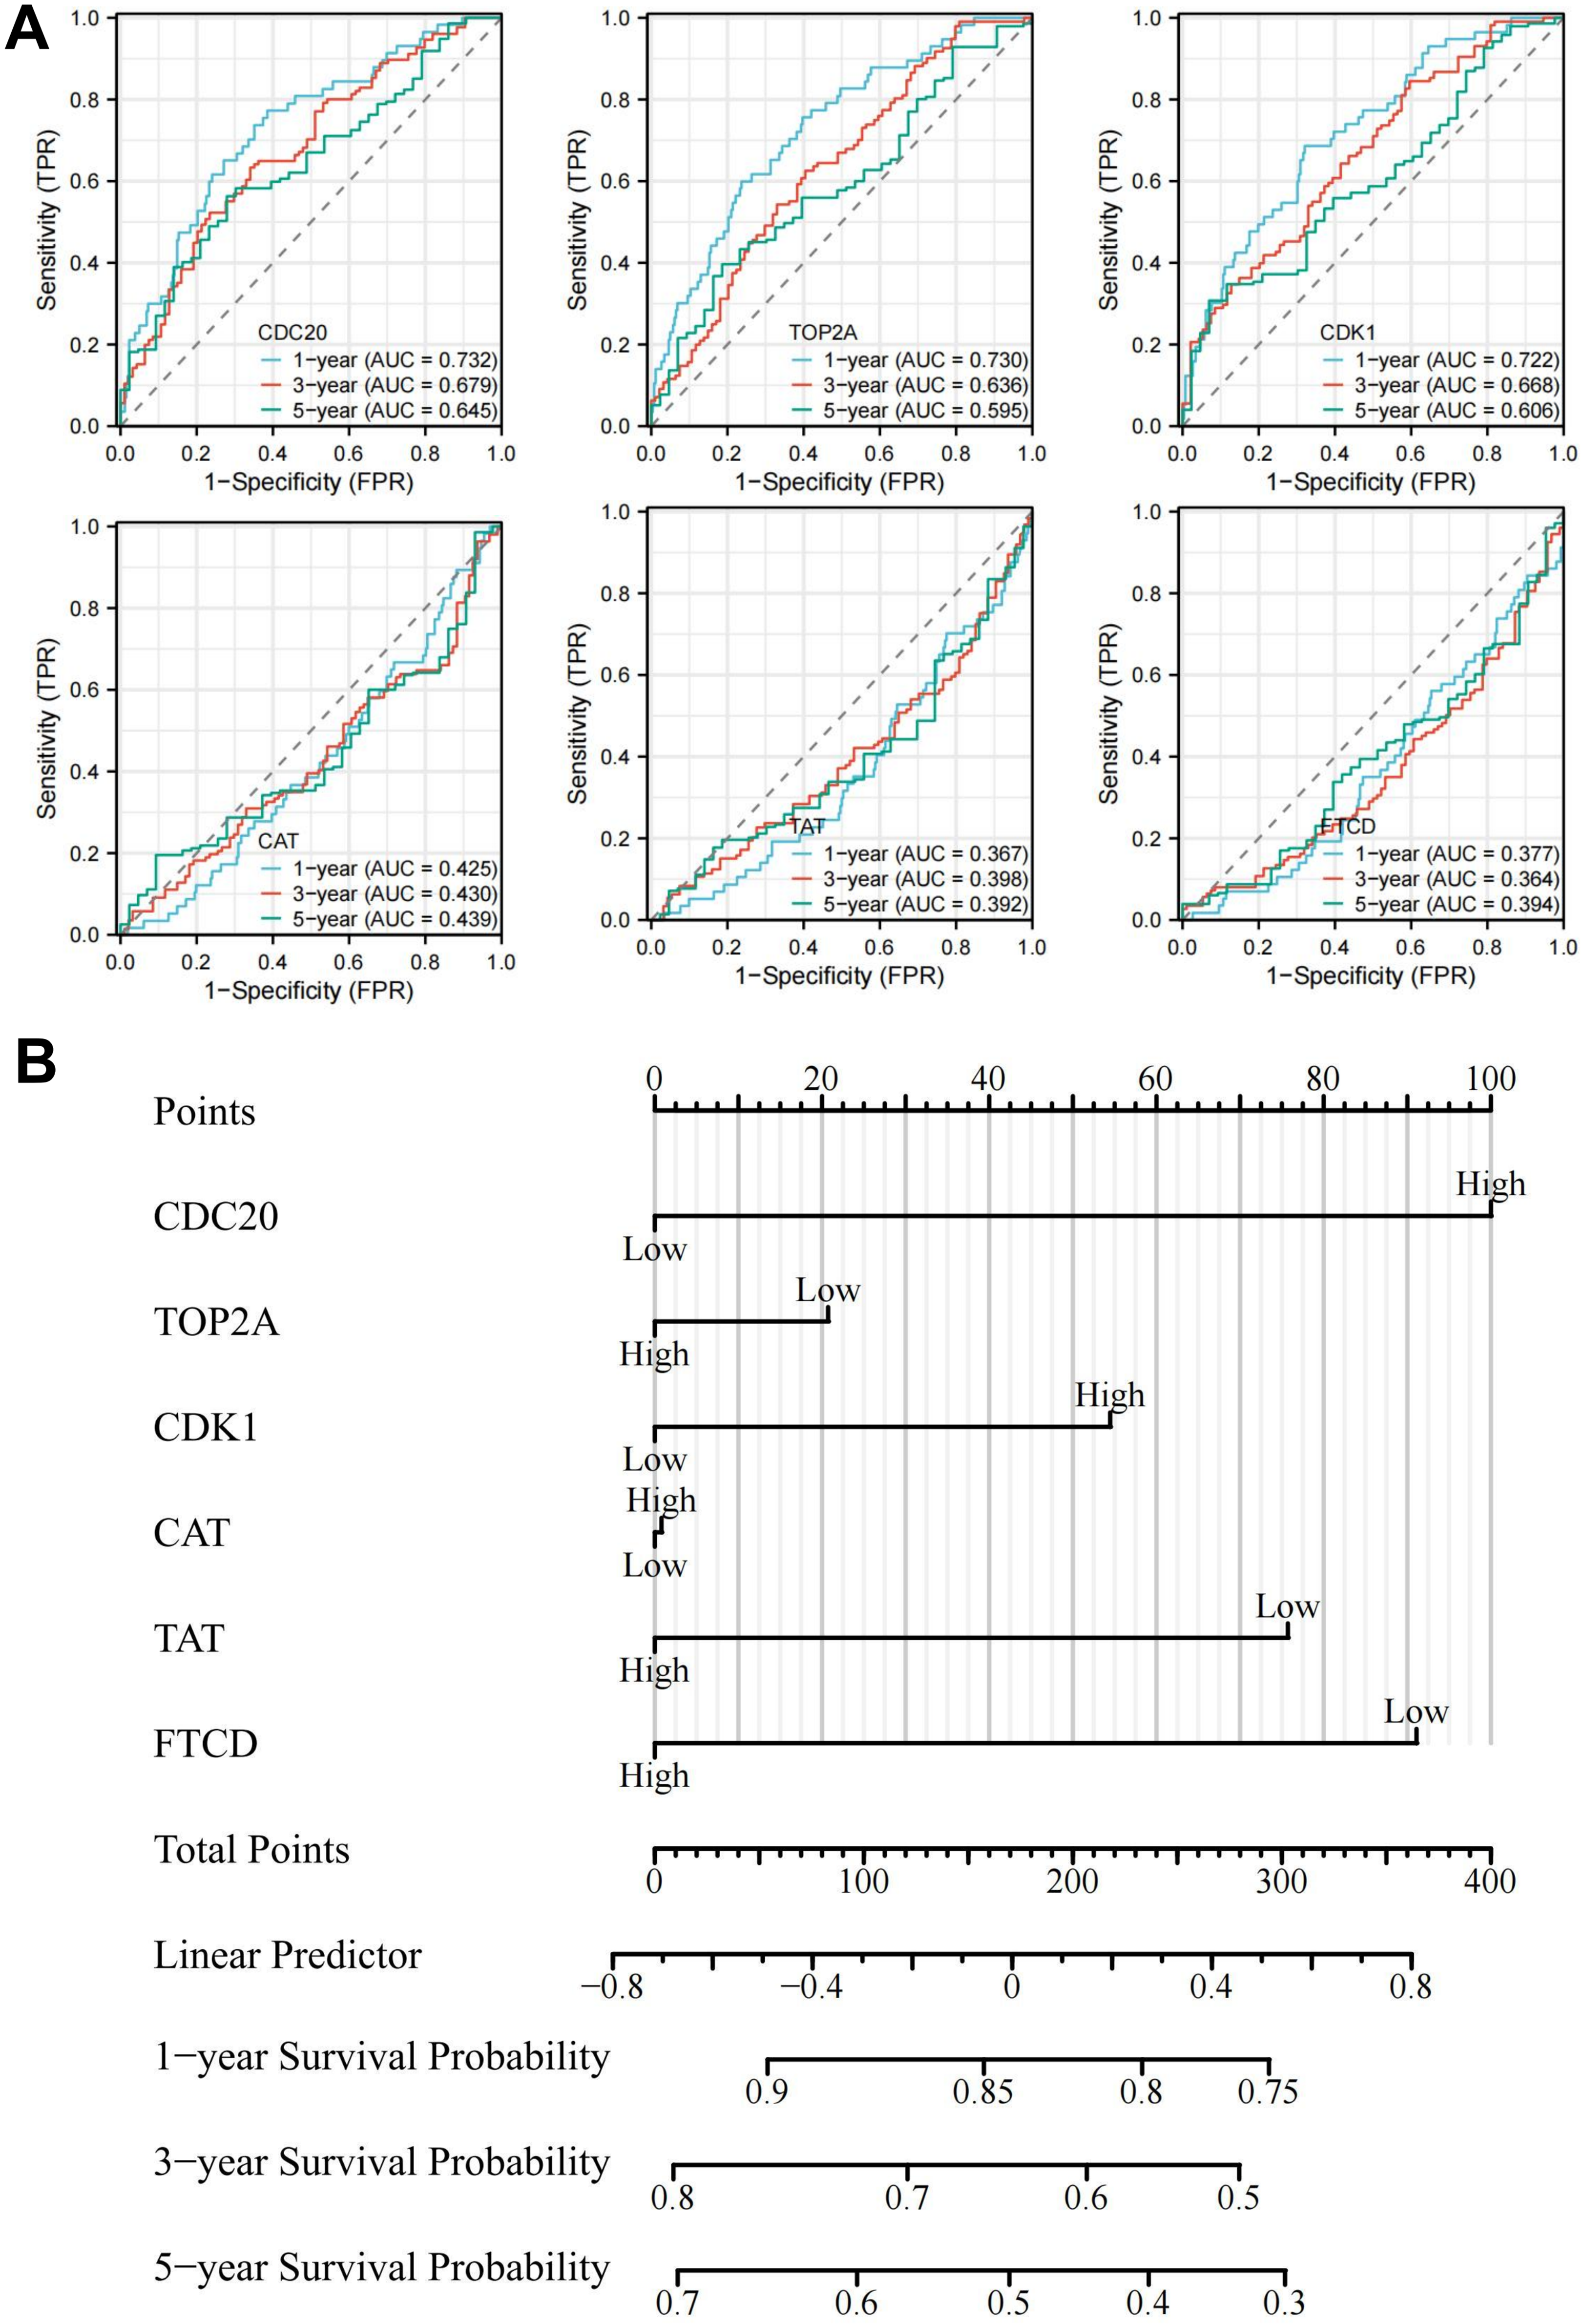
Prognostic analysis and survival analysis of hub genes. (A) 1-, 3-, and 5-year prognostic analysis of CDC20, TOP2A, CDK1, CAT, TAT, and FTCD. (B) Nomogram of hub genes.
Gene functional analysis
Tumorigenesis is a complex process involving multiple genes and steps. More and more studies have shown that DNA methylation plays an important role in the occurrence, development, and metastasis of tumors, and characteristic methylation sites are of great significance for the diagnosis, classification, prognosis, and treatment of tumors. 30 DNA methylation throughout the genome is an epigenetic modification that contributes to the regulation of cancer-associated genes. DNA methylation throughout the genome is an epigenetic modification that contributes to the regulation of cancer-associated genes. In our study, we demonstrated decreased promoter methylation levels of TOP2A, CDK1, and FTCD in LIHC (Figure 9). The reduction of methylation level activates proto-oncogenes and retrotransposons and reduces chromosome stability.
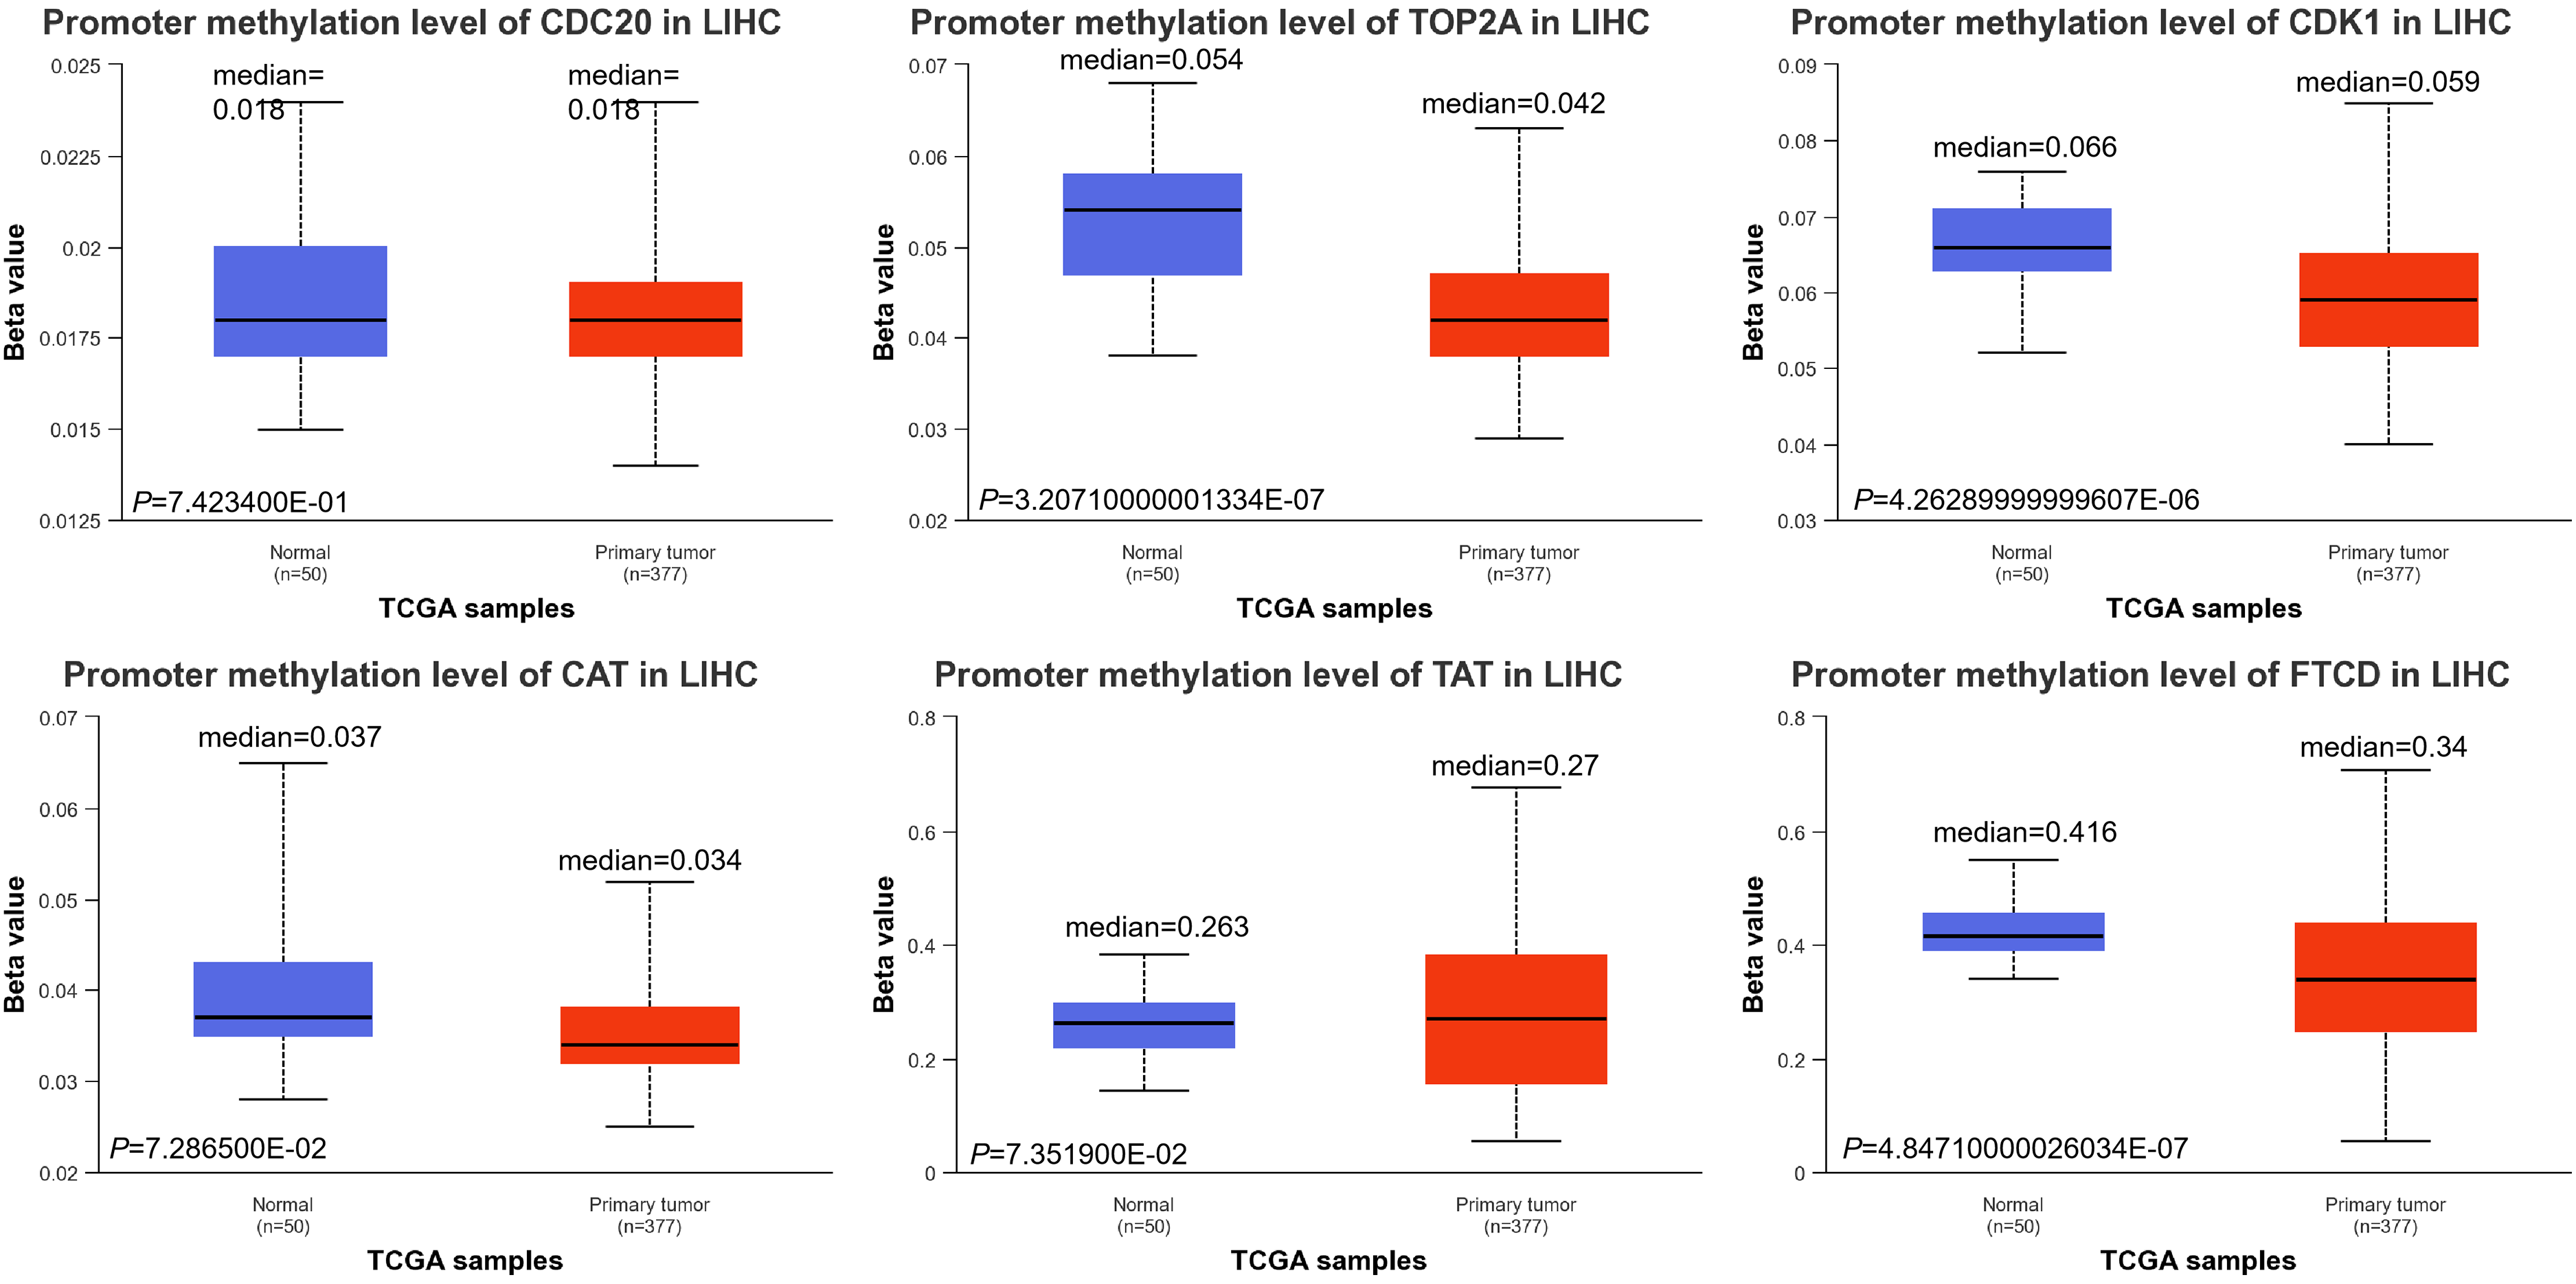
DNA methylation levels of CDC20, TOP2A, CDK1, CAT, TAT, and FTCD.
According to the classification of mutations, we noticed that missense mutation was the most frequent (Supplementary Figure S5A). The single nucleotide polymorphism (SNP) was the most prevalent variant type, C > A and T>C (4) ranked at the top in the single nucleotide variant (SNV) classes. We also found that TOP2A (1%), TAT (1%), CDK1 (1%), and FTCD (1%) showed higher mutation frequencies than others (Supplementary Figure S5B). There were 3 mutations in the full sequence of CDC20. Also, “mutation” seemed to be the main type of Frame_Shift_Ins, which is mainly located within the CDC20: DNA-binding domain (300–499) with potential clinical significance, G390Wfs*49 alteration in LIHC (Figure 10A). There are 18 mutations in the full sequence of TOP2A. The main type of “mutation” was Missense, which is mainly located in the DNA binding domain (0–1531) V90D/X90_splice alteration (Figure 10B). There are 2 mutations in the full sequence of CDK1. The main type of “mutation” was Missense, which is mainly located in the DNA binding domain (200–297) L213P alteration (Figure 10C). There are 7 mutations in the full sequence of CAT. The main type of “mutation” was Nonsense, which is mainly located in the DNA binding domain (0–527) Q288* alteration (Figure 10D). There are 10 mutations in the full sequence of TAT. The main type of “mutation” was Missense, which is mainly located in the DNA binding domain (200–454) C353R alteration (Figure 10E). There are 14 mutations in the full sequence of FTCD. The main type of “mutation” was Nonsense, which is mainly located in the DNA binding domain (0–500) E251* alteration (Figure 10F). Cancer is caused by mutations in somatic genes that lead to malignancy and uncontrolled growth. Therefore, precise treatment based on mutation sites provides a theoretical basis for LIHC prognosis.
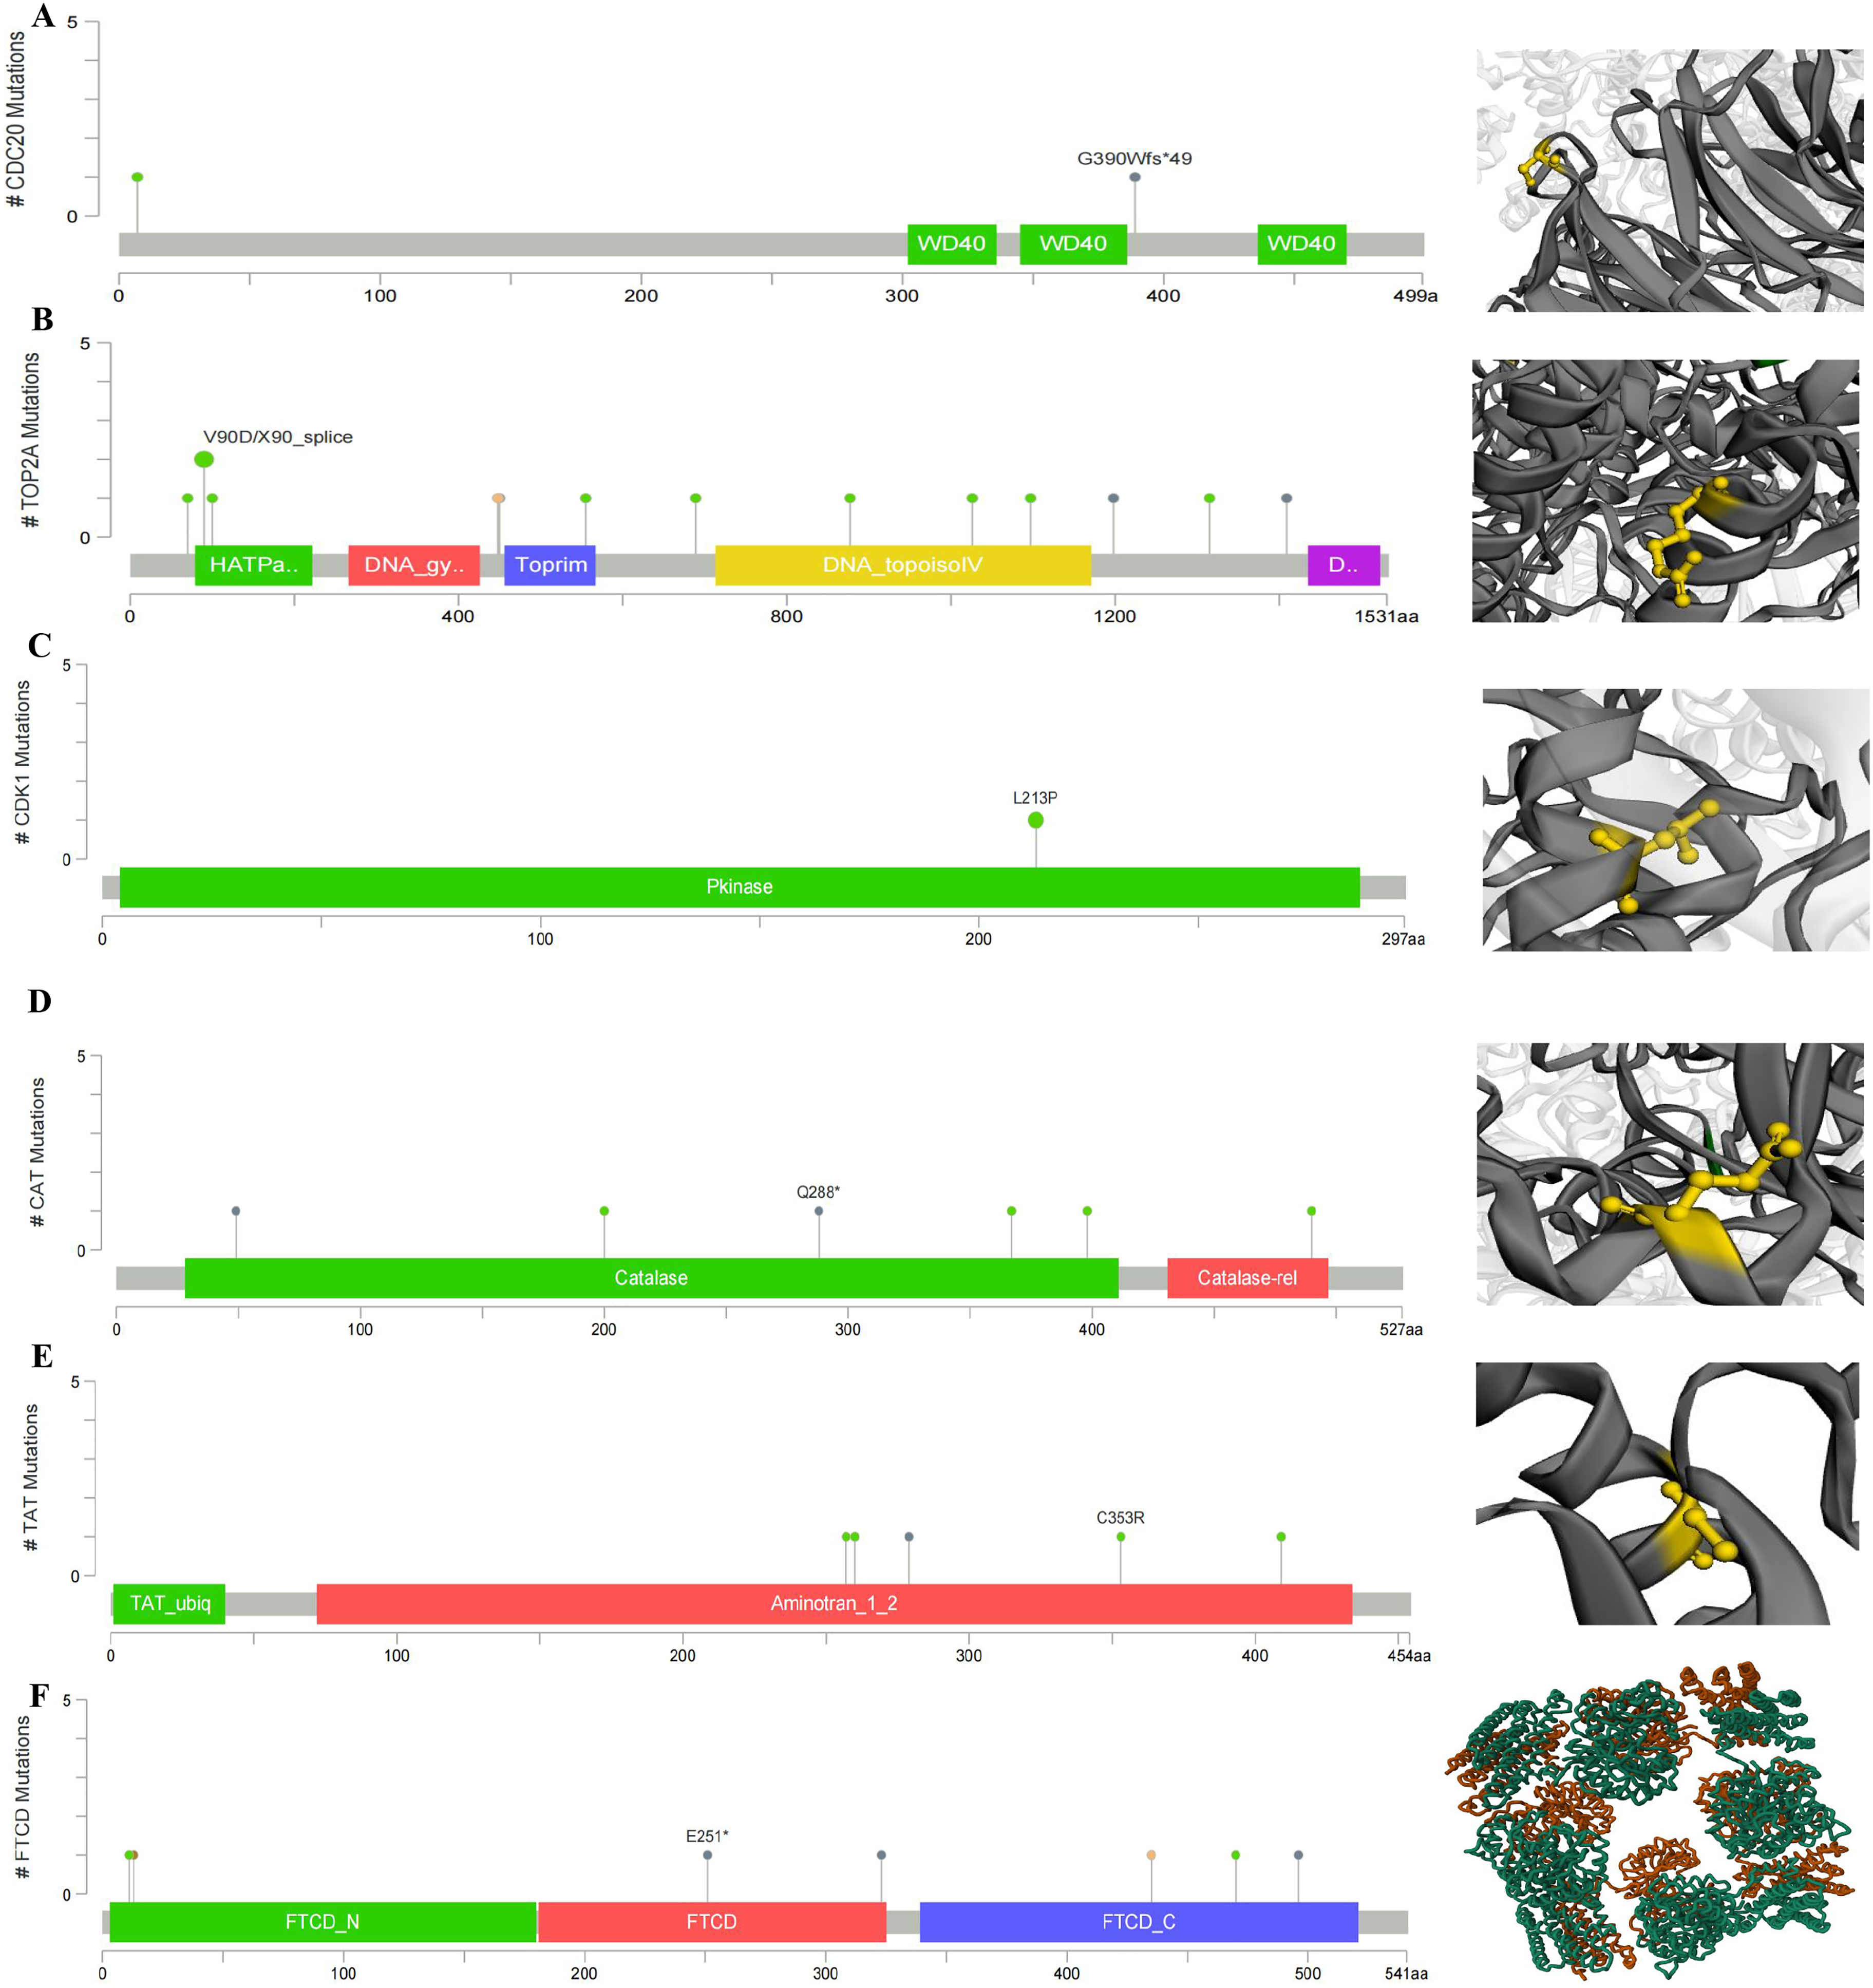
Main mutation types of (A) CDC20, (B) TOP2A, (C) CDK1, (D) CAT, (E) TAT, and (F) FTCD.
MicroRNA (miRNA) is closely related to the occurrence and development of tumors and is abnormally expressed in a variety of tumors. Controlling the expression of cancer-related miRNAs is expected to become a new generation of drug models for the treatment of advanced cancers. Therefore, we analyzed the miRNA related to core genes, and the miRNA with high confidence were hsa-miR-30a-5p, hsa-miR-139-5p, and hsa-miR-7 (Figure 11A). We also analyzed the survival curve of patients with their expression in LIHC and found that patients with low expression of hsa-miR-30a-5p and hsa-miR-7 and high expression of hsa-miR-139-5p had a longer survival period (Supplementary Figure S6). Then, we also detected the expression of hub genes in hepatocytes and found that they were enriched in different hepatocytes, T cells, and macrophages (Figure 11B), and their expression scores were positively correlated (Figure 11C). The wide distribution of protein expression indicates that they can be used as potential biomarkers for the treatment of LIHC.
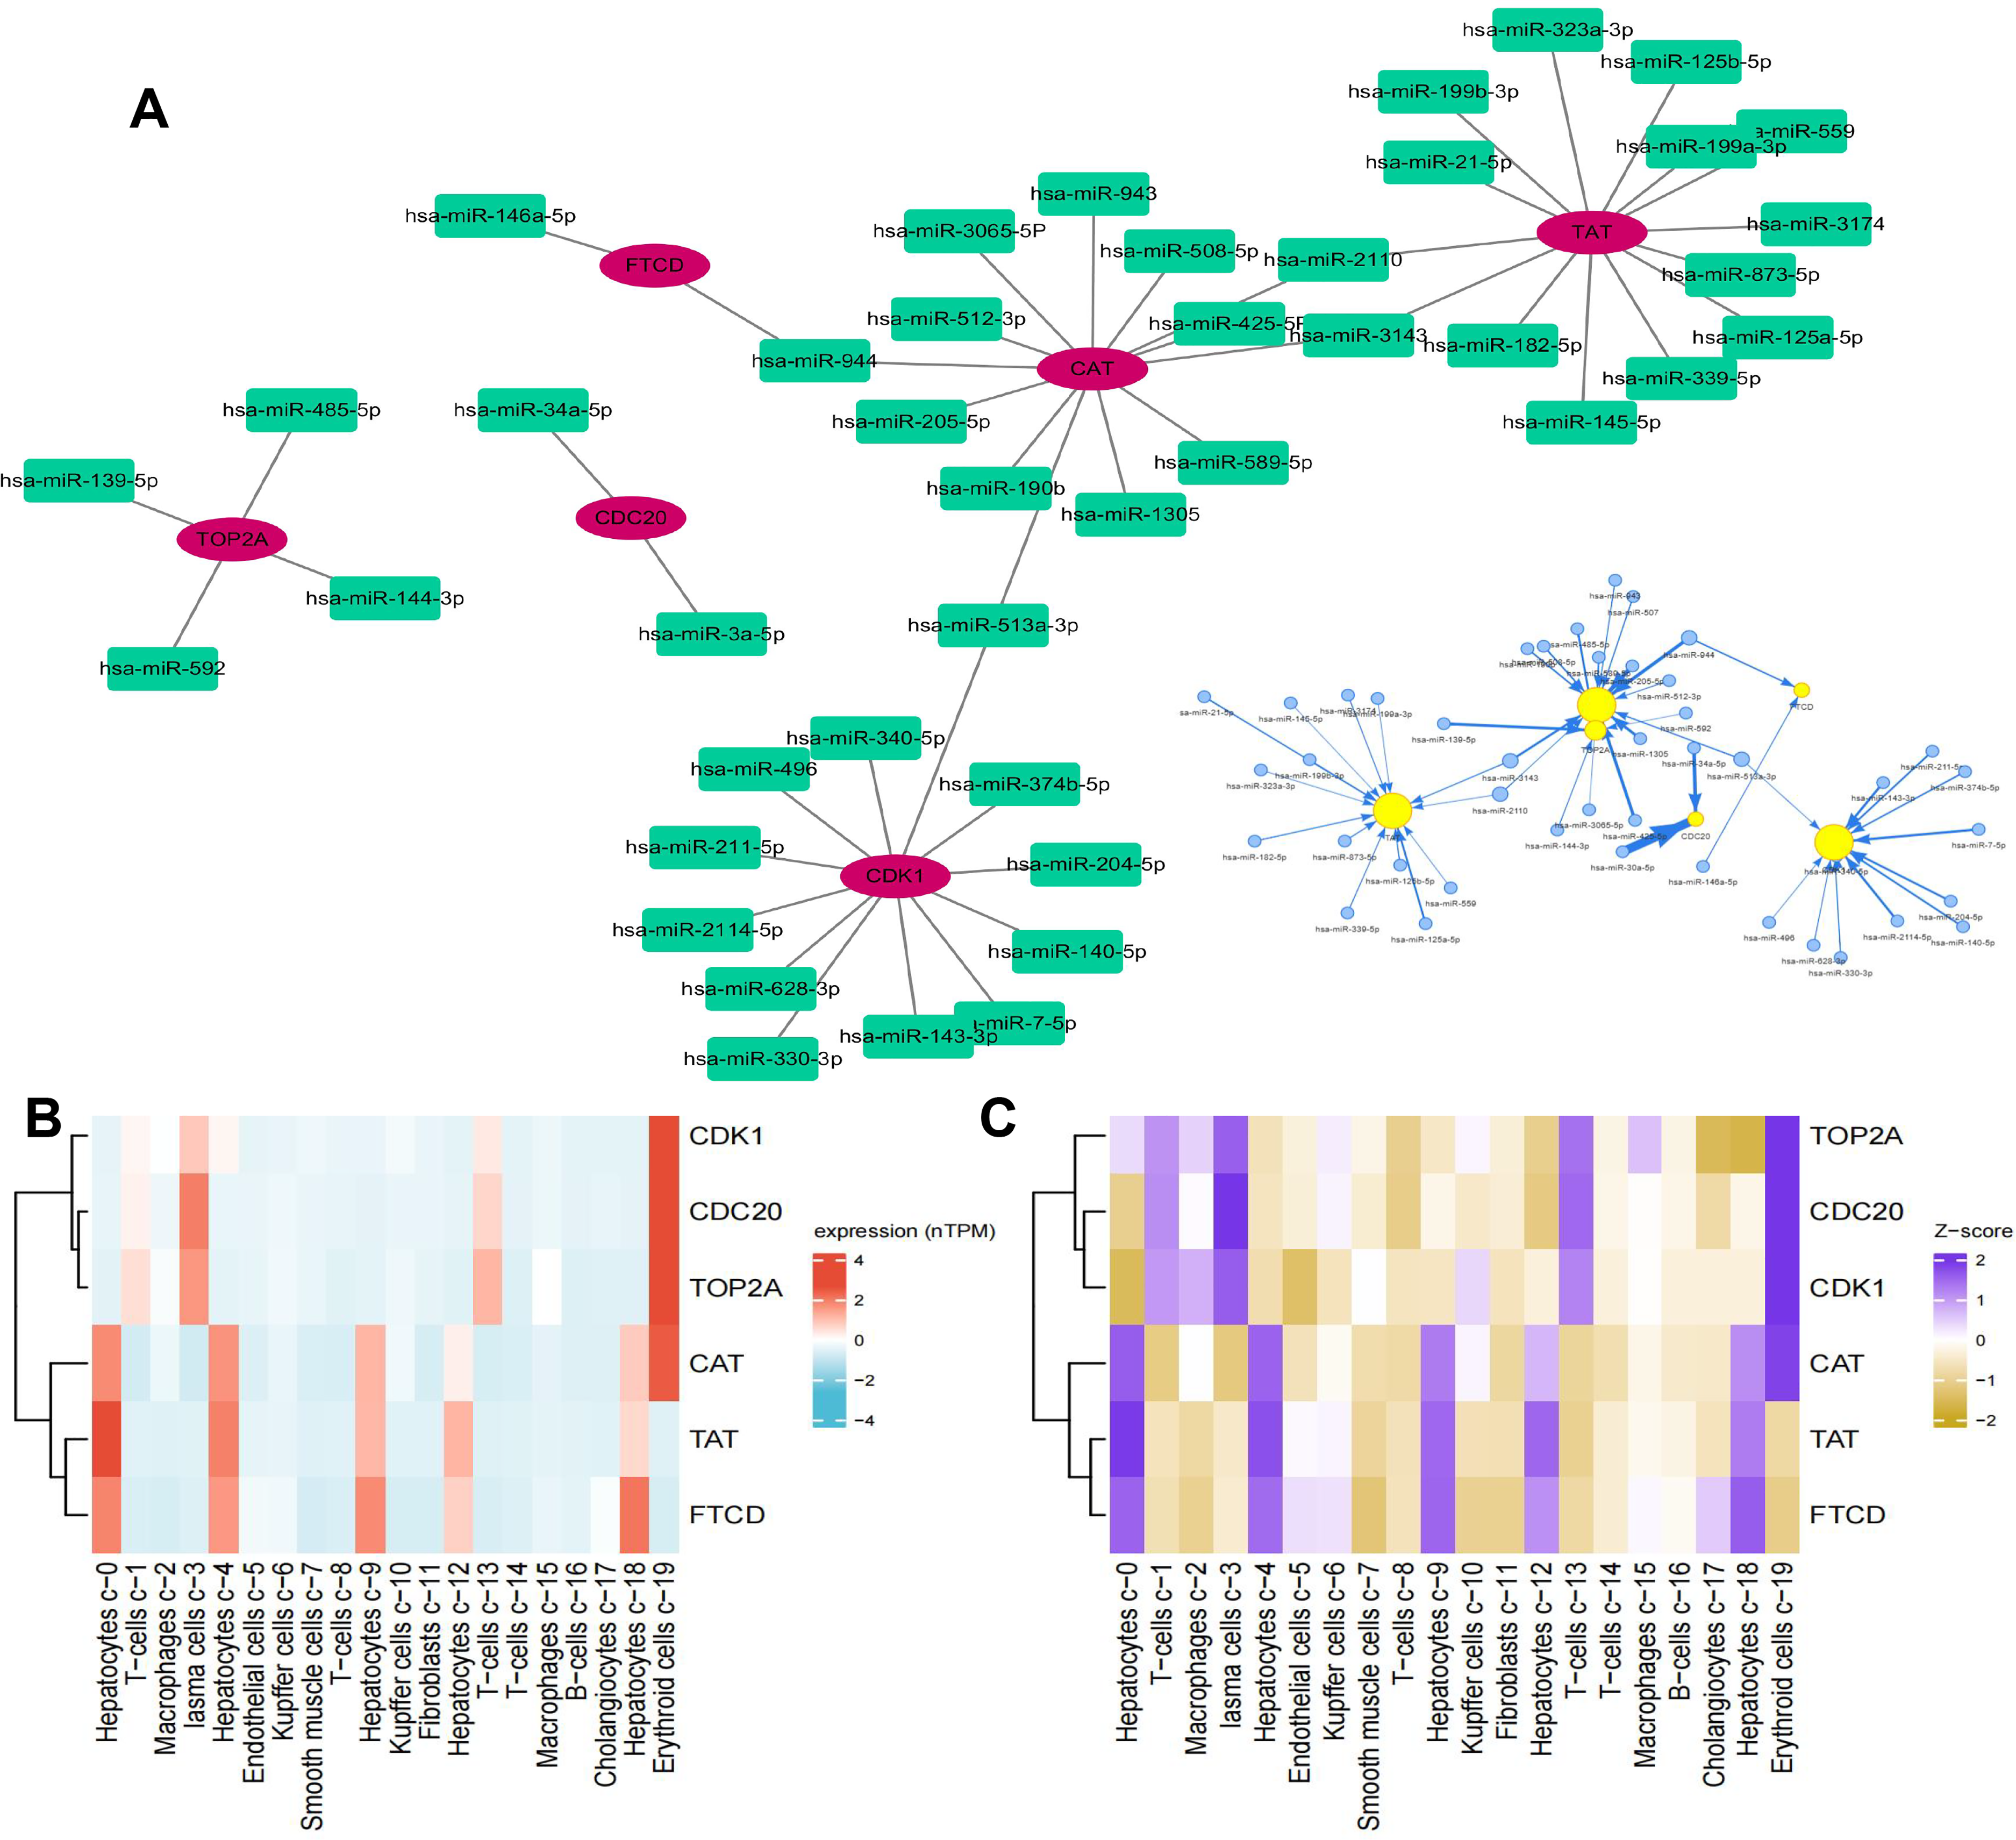
Hub gene-related miRNA analysis and single-cell type analyze (A: The miRNA expression of genes; B: Single-cell sequencing was used to analyze the expression of hub genes in the liver; C: Expression Z-scores of hub genes in 19 cells in the liver).
Therapeutic drug prediction
We used the GDSC and CTRP databases to calculate the relationship between gene expression and drug sensitivity. The correlation between the hub gene and the drug is shown in Figure 12A, 12B, red indicates a positive correlation, the higher the gene expression, the more sensitive to the drug, and blue is vice versa. We found trametinib, selumetinib, RDEA119, teniposide for TOP2A and CDK1, and mitomycin, etoposide, CD−437 for TOP2A. The therapeutic drugs for CAT targets include Sunitinib and Linifanib. The therapeutic drugs for CDC20 targets include Nutlin-3. The chemical structures of these drugs are shown in Figure 12C. Most of these drugs have entered phase I, phase II, and phase III clinical trials, bringing hope to cancer treatment.
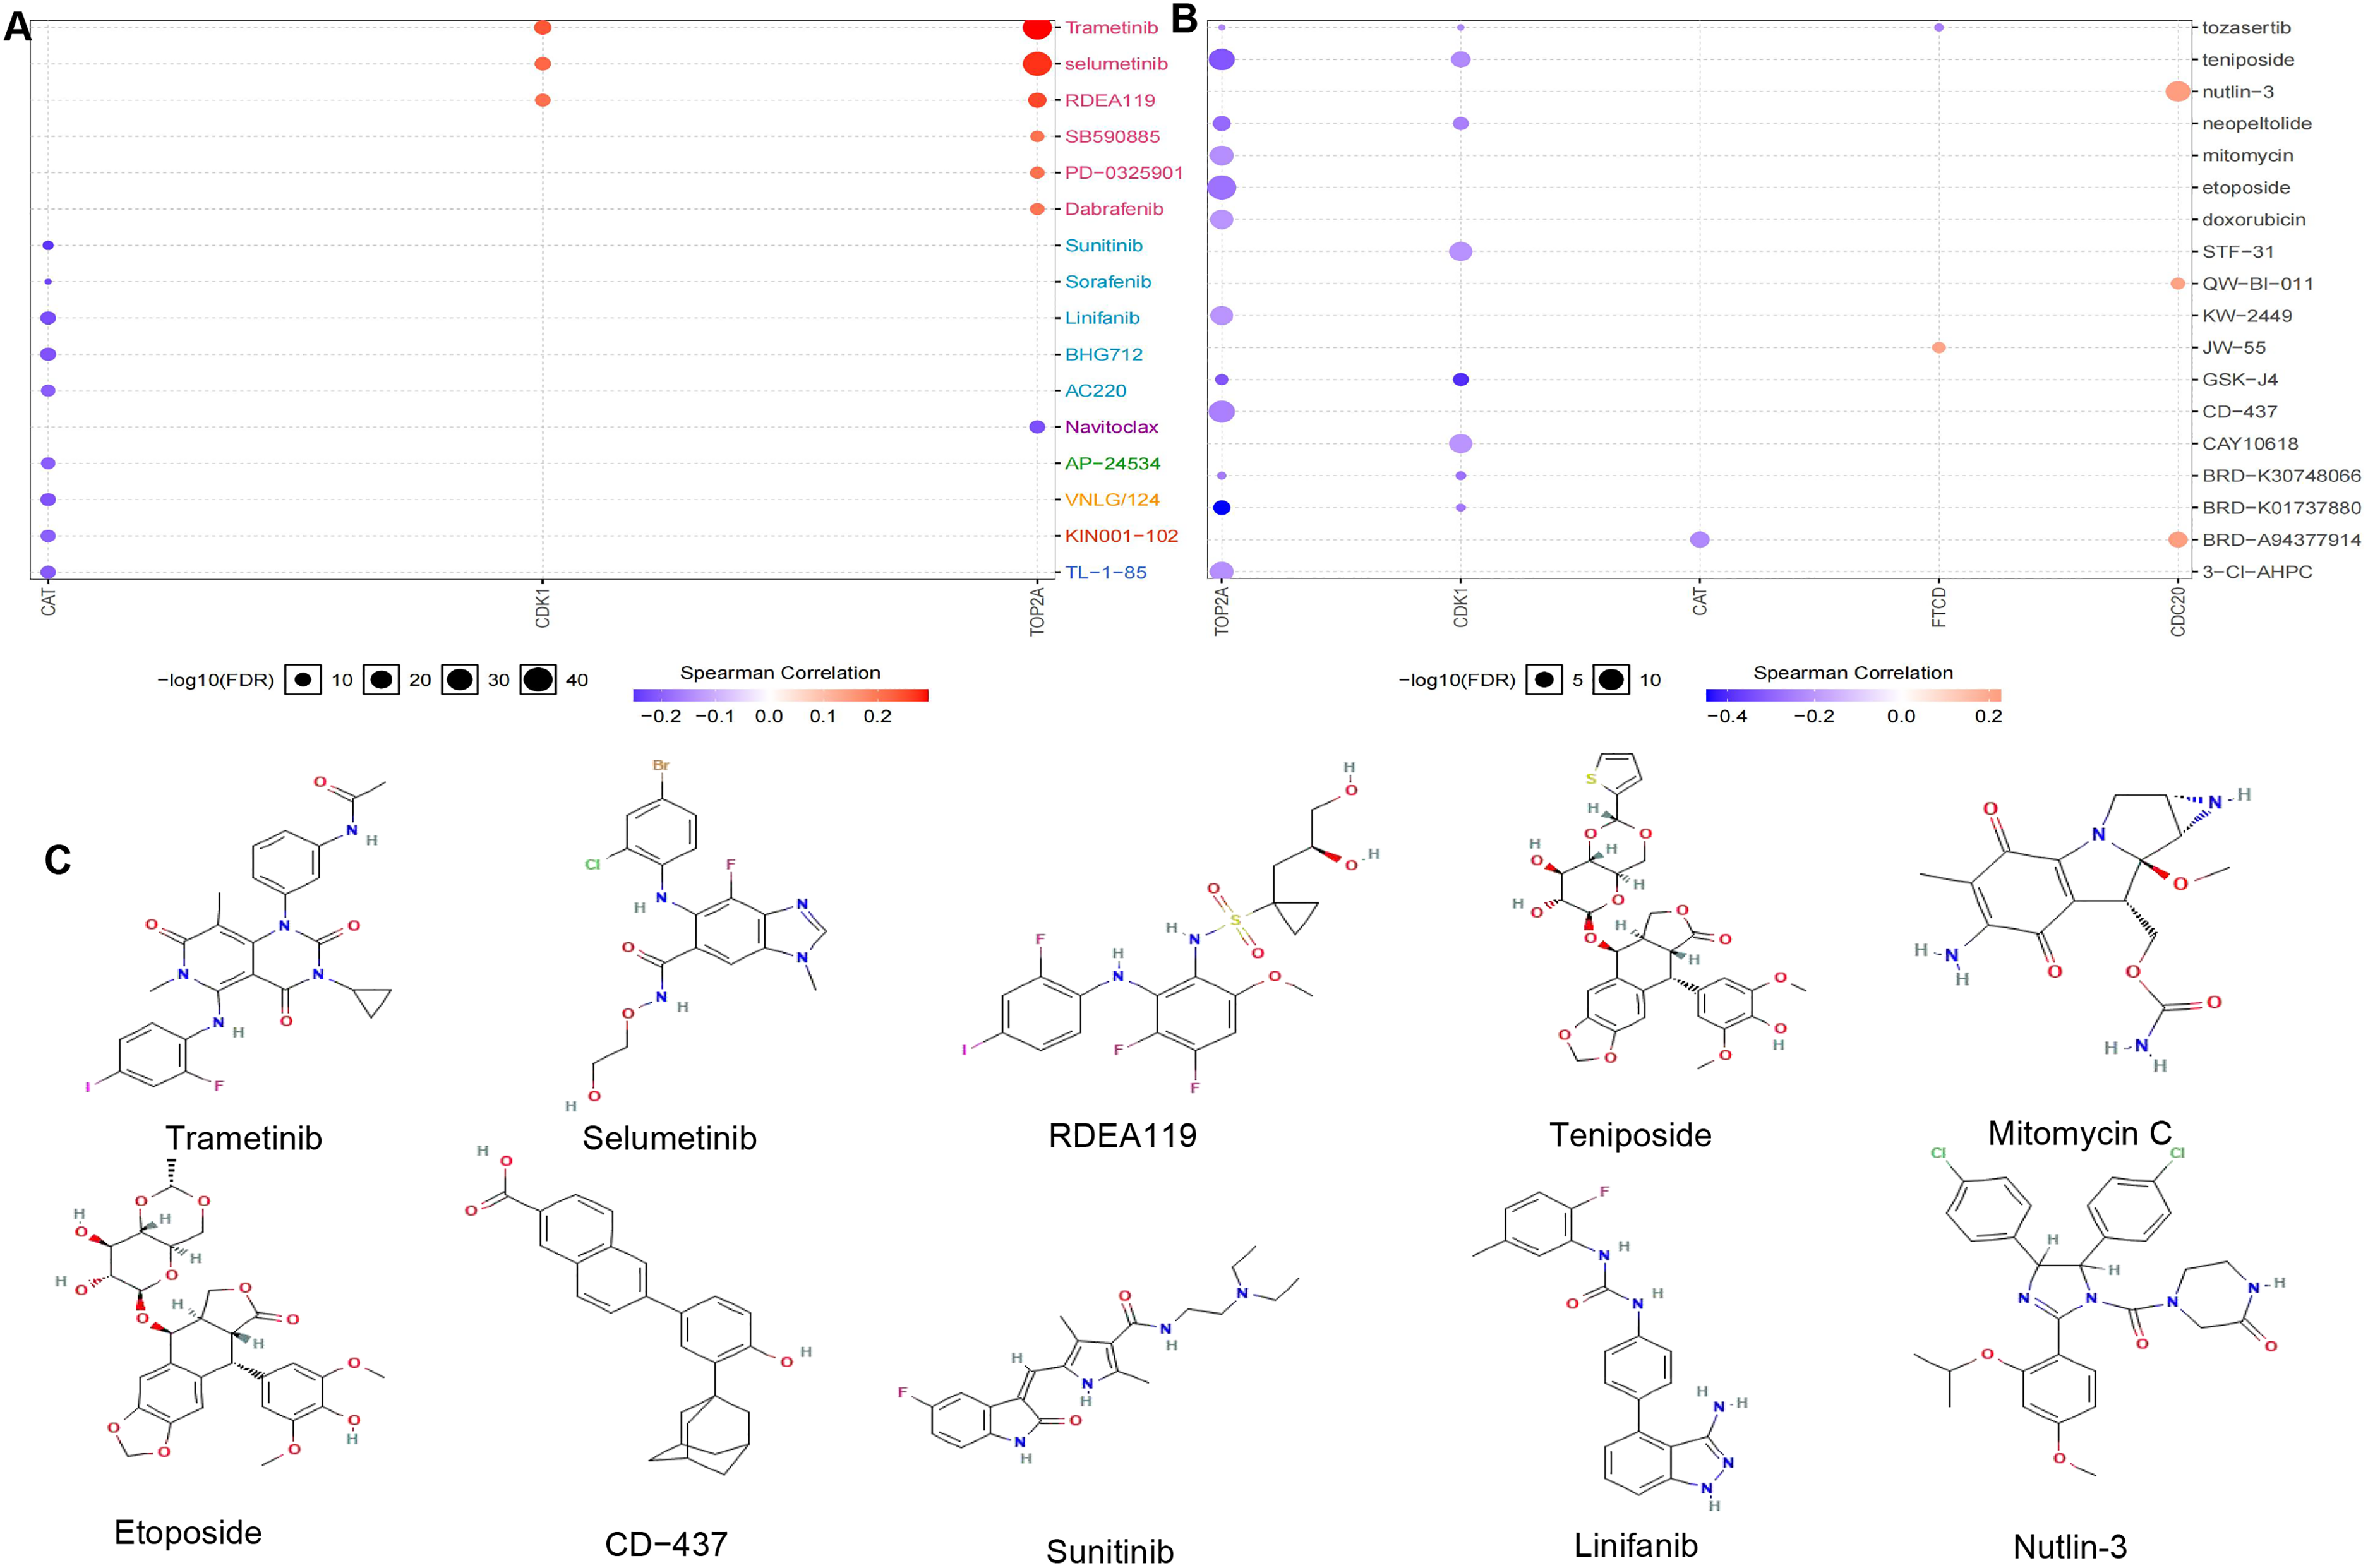
Therapeutic drug prediction (A: GDSC databases to calculate the relationship between gene expression and drug sensitivity; B: CTRP databases to calculate the relationship between gene expression and drug sensitivity; C: The chemical structures of drugs).
Conclusion
The identification of hub genes CDC20, TOP2A, CDK1, CAT, TAT, and FTCD through comprehensive bioinformatics analysis holds immense significance in understanding the molecular mechanisms underlying LIHC. These genes have been implicated in key biological processes and signaling pathways associated with LIHC progression, offering potential targets for therapeutic interventions and prognostic assessments. The differential expression patterns of these hub genes, along with their impact on immune infiltration, methylation levels, gene mutation, miRNA regulation, and single-cell sequencing, highlight their intricate involvement in the development and prognosis of LIHC. Furthermore, the prediction of potential therapeutic drugs based on the hub genes provides valuable information for personalized treatment strategies in LIHC patients.
LIHC is a difficult-to-treat and lethal malignancy accompanied by high mortality, metastasis, and recurrence rates. 31 Chemotherapy did not prolong overall survival in LIHC, and there is an unmet need to develop novel therapeutics for this illness. The emergence of genomic- and immune-based therapies is transforming the treatment of many cancers and is beginning to be applied to LIHC. The development of liver cancer is a multi-step process. During the development of liver cancer, cancer cells acquire and accumulate a variety of genetic changes, including mutations and modifications of oncogenes and tumor suppressor genes involved in different signaling pathways. Previous research has proposed two main distinct stages of liver cancer development: initiation and promotion. Priming occurs when cells containing DNA mutations are generated in one or several components of the dominant proto-oncogene or tumor suppressor gene such as p53, RAS, and Wnt signaling pathways. During cancer promotion, initiating cells is clonal and expanded by increasing cell proliferation and/or inhibiting apoptosis. In addition, reactive oxygen species and other cell mutagens produced during cancer promotion will further promote the accumulation of other genetic mutations or genomic instability, thereby increasing the number of starting cells. The specific mechanism of liver cancer development has not been fully elucidated.
In this study, we analyzed the gene prognosis of LIHC patients, including 36 up-regulated genes and 46 down-regulated genes, mainly affecting biological processes including nuclear division, organelle fission, mitotic nuclear division, chromosome segregation, sister chromatid segregation, nuclear chromosome segregation, mitotic sister chromatid segregation, fatty acid metabolic process, etc., and activated apoptosis, cell cycle, DNA damage response, and EMT signaling pathways, thereby affecting the occurrence and progression of cancer. The hub genes screened for prognostic genes, including CDC20, TOP2A, CDK1, CAT, TAT, and FTCD. Genes with large differences in P values of prognostic genes were selected for survival analysis, immune infiltration analysis was performed, and the up-regulated of CDC20, TOP2A, and CDK1, and low expression has a longer survival time in LIHC patients, which was positively correlated with immunity. Down-regulation of CAT, TAT, and FTCD, high expression in LIHC patients has a longer survival time, and was negatively correlated with immunity.
CDC20 regulated cell cycle progression by targeting key substrates for destruction. 32 The expression of CDC20 was significantly related to differentiation, tumor node metastasis stage, and lymphatic metastasis. 33 Moreover, our studies showed that LIHC patients with high CDC20 expression had dismal overall survival rates compared with low CDC20 expression. TOP2A was up-regulated in LIHC and its expression was positively correlated with poor prognosis. TOP2A possibly enhanced the metastasis of LIHC by promoting EMT through the mediation of the p-ERK1/2/p-SMAD2/Snail pathway. 34 Cai et al suggested that The expression of TOP2A mRNA and protein in LIHC tumor tissues was significantly higher than that in the adjacent tissues, the high TOP2A expression was associated with poor tumor differentiation, significant cirrhosis, and larger tumor diameter. 35 CDK1 was essential for G1/S and G2/M phase transitions of the eukaryotic cell cycle. Hepatitis B virus (HBV) produces circular RNA (circRNA), which is highly expressed in LIHC tissues, and studies have shown that HBV-circ-1 interacts with CDK1 to regulate cell proliferation and promote the progression of LIHC. 36 Catalase (CAT) is an important antioxidant enzyme in the body, which plays an important role in scavenging ROS and maintaining the balance of the REDOX state. 37 The decrease of CAT expression or activity can lead to the increase of intracellular ROS concentration, form oxidative stress, cause oxidative damage of DNA, proteins, lipids, and other macromolecular substances and increase genomic instability, directly or indirectly induce cell malignant transformation and promote tumorigenesis. In addition, hypermethylation of CpG island II in the promoter of the CAT gene in LIHC cells interferes with the binding of transcription factors to the promoter, 38 thereby reducing the transcription level of CAT, which is also one of the important mechanisms of tumorigenesis. Functional analyses showed that TAT harbored a proapoptotic effect and that TAT suppression could promote liver tumorigenesis. 39 Moreover, the tumor inhibition mechanism of TAT was related to its mitochondrion-dependent effect on apoptosis by promoting the release of cytochrome C and activating caspase-9 and poly(ADP-ribose) polymerase (PARP). FTCD suppresses LIHC by modulating cell apoptosis, DNA damage, and phosphatidylinositol 3-kinases (PI3 K)/AKT signaling pathway, FTCD could induce apoptosis by activating the mitochondria-mediated apoptosis signaling pathway, and finally significantly suppresses the proliferation of LIHC both in vitro and in vivo, which provides an effective strategy for the treatment of LIHC. 40 A large number of studies have confirmed that CDC20, TOP2A, CDK1, CAT, TAT, and FTCD play a role in tumor therapy, suggesting that they may serve as new and effective targets for selective anti-tumor therapy. Therefore, it is of great significance to further clarify the mechanism of its action in the process of tumorigenesis and development for the prevention and treatment of tumors.
At present, the approved targeted drug for LIHC is Sorafenib, and several other targeted drugs Sunitinib, Brivanib, Tivantinib, etc. are undergoing phase III clinical trials.41–44 We found trametinib, selumetinib, RDEA119, teniposide for TOP2A and CDK1, and mitomycin, etoposide, CD−437 for TOP2A. The therapeutic drugs for CAT targets include Sunitinib and Linifanib. The therapeutic drugs for CDC20 targets include Nutlin-3. The RAF protein kinase (RAF) /mitogen-activated protein kinase kinase (MEK)/extracellular signal-related kinase (ERK) pathway is activated in approximately 50% to 60% of LIHCs and represents a potential target for therapy. Trametinib and selumetinib are MEK 1/2 reversible inhibitor that treats LIHC primarily by influencing the MAPK pathway and inhibiting cell proliferation by acting on MEK proteins, 45 and the treatment of LIHC with selumetinib alone or in combination has been in phase Ib, phase II clinical trials.46,47 Mitomycin C, an antibiotic that has shown antitumor activity in preclinical and clinical studies, inhibits DNA synthesis and is widely used in the treatment of various cancers. 48 Nutlin-3 facilitated tumor necrosis factor-associated apoptosis-inducing ligand (TRAIL)-induced apoptosis of LIHC cells by activating the p53-survivin/bcl-2 pathway, 49 which provided novel insights into the mechanism of Nutlin-3 and TRAIL confirmed the potential of the combination of Nutlin-3 and as an adjuvant in LIHC therapy. Although these drugs have shown good efficacy in the treatment of LIHC, and the combination may play a role in enhancing the effect, we must consider factors such as drug resistance and tolerance by the body.
This study utilized bioinformatics analysis to identify key genes involved in the pathogenesis of LIHC, however, only three datasets from the GEO database and Western blotting were used to validate the key genes. The study analyzed 3865 samples from the HCCDB database, which may not fully represent the heterogeneity of LIHC. The verification found that it relies on single-cell protein expression detection. Although this method has validated the results, its limitations are obvious. Cell line models are difficult to simulate the tumor microenvironment in vivo and may not fully reflect the pathological characteristics of LIHC. Differences in genetic backgrounds among different cell lines may lead to biased experimental results. Although the study identified potential therapeutic drugs for treating LIHC, further clinical studies are needed to validate the efficacy and safety of these drugs in the real world. Addressing these limitations can further deepen our understanding of the role of key genes in the pathogenesis of LIHC and enhance their clinical utility as prognostic biomarkers. Building upon the current findings, future research directions could focus on elucidating the mechanistic roles of CDC20, TOP2A, CDK1, CAT, TAT, and FTCD in LIHC through in vitro and in vivo studies. In addition, advanced technologies such as high-throughput sequencing and single-cell sequencing can be utilized to further explore the molecular characteristics of LIHC, providing stronger support for precision medicine. Investigating the crosstalk between these hub genes and immune cells within the tumor microenvironment could provide insights into potential immunotherapeutic strategies for LIHC. Moreover, exploring the synergistic effects of the identified hub genes with existing treatment modalities or novel targeted therapies may pave the way for personalized medicine approaches in LIHC management. Longitudinal studies assessing the clinical utility of the hub genes as prognostic biomarkers or therapeutic targets in LIHC patients would further validate their significance in clinical practice.
In conclusion, the comprehensive bioinformatics analysis conducted in this study reveals the pivotal roles of CDC20, TOP2A, CDK1, CAT, TAT, and FTCD in LIHC pathogenesis, offering new avenues for further research and clinical applications. These hub genes have the potential to serve as prognostic biomarkers and therapeutic targets in LIHC, providing a foundation for advancing precision medicine in liver cancer management.
Supplemental Material
sj-docx-1-cbm-10.1177_18758592241304994 - Supplemental material for Bioinformatics screened of biomarkers for the prognosis of hepatocellular carcinoma
Supplemental material, sj-docx-1-cbm-10.1177_18758592241304994 for Bioinformatics screened of biomarkers for the prognosis of hepatocellular carcinoma by Chunxu Bao, Tingting Liu, Guiling Hu, Wentao Gao, Lin Sun, Xiaoping Ma and Jianshe Wei in Cancer Biomarkers
Supplemental Material
sj-xls-2-cbm-10.1177_18758592241304994 - Supplemental material for Bioinformatics screened of biomarkers for the prognosis of hepatocellular carcinoma
Supplemental material, sj-xls-2-cbm-10.1177_18758592241304994 for Bioinformatics screened of biomarkers for the prognosis of hepatocellular carcinoma by Chunxu Bao, Tingting Liu, Guiling Hu, Wentao Gao, Lin Sun, Xiaoping Ma and Jianshe Wei in Cancer Biomarkers
Supplemental Material
sj-xlsx-3-cbm-10.1177_18758592241304994 - Supplemental material for Bioinformatics screened of biomarkers for the prognosis of hepatocellular carcinoma
Supplemental material, sj-xlsx-3-cbm-10.1177_18758592241304994 for Bioinformatics screened of biomarkers for the prognosis of hepatocellular carcinoma by Chunxu Bao, Tingting Liu, Guiling Hu, Wentao Gao, Lin Sun, Xiaoping Ma and Jianshe Wei in Cancer Biomarkers
Footnotes
Ethics approval
The full text or part of the paper has not been submitted or published elsewhere. The paper will not be submitted elsewhere until the procedures of the journal editorial department are completed. All authors agree to participate.
Consent for publication
Not applicable.
Author contributions
Conception: Chunxu Bao, Tingting Liu, Guiling Hu, and Xiaoping Ma; Interpretation Or Analysis Of Data: Chunxu Bao and Tingting Liu; Preparation Of The Manuscript: Chunxu Bao, Tingting Liu, Wentao Gao, Lin Sun, and Jianshe Wei; Revision For Important Intellectual Content: Chunxu Bao, Tingting Liu, Xiaoping Ma, and Jianshe Wei; Supervision: Chunxu Bao, Tingting Liu, Xiaoping Ma, and Jianshe Wei.
Funding
This work was supported by grants from the Yinchuan Science and Technology Innovation Team Program (2023CXTD29), the National Natural Science Foundation of China (32161143021, 81271410), the Henan University graduate «Talent Program» of Henan Province (SYLYC2023092), and the Natural Science Foundation of Henan (182300410313).
Declaration of conflicting interests
The author(s) declared no potential conflicts of interest with respect to the research, authorship, and/or publication of this article.
Data availability statement
All data and material generated or analyzed during this study are included in this published article [and its supplementary information files].
Supplemental material
Supplemental material for this article is available online.
References
Supplementary Material
Please find the following supplemental material available below.
For Open Access articles published under a Creative Commons License, all supplemental material carries the same license as the article it is associated with.
For non-Open Access articles published, all supplemental material carries a non-exclusive license, and permission requests for re-use of supplemental material or any part of supplemental material shall be sent directly to the copyright owner as specified in the copyright notice associated with the article.