
Abstract
Objective
This study aimed to develop and validate a radiomics nomogram based on 40 KeV images and iodine density maps derived from dual-layer spectral detector CT (DLSDCT) for predicting cervical lymph node (LN) metastasis in patients with papillary thyroid carcinoma (PTC).
Methods
A total of 214 LNs from 143 patients with histopathologically confirmed PTC in our hospital were included in the study. The LNs were randomly divided into a training group (n = 150) and a validation group (n = 64) in a 7:3 ratio. Radiomics features were extracted from non-enhanced, arterial phase, and venous phase 40 KeV images, as well as arterial phase and venous phase iodine density maps. Recursive feature elimination (RFE) and logistic regression (LR) were used for feature selection and radiomics score construction. A multivariate logistic regression model was established, incorporating the radiomics score and CT image features. The receiver operating characteristic (ROC) curve was used to evaluate the model's performance. The Hosmer-Lemeshow test and calibration curve were used to assess the model's goodness of fit, while decision curve analysis (DCA) evaluated its clinical applicability.
Results
The radiomics features consisted of 11 LN-related features that exhibited a good predictive effect. The radiomics nomogram, which included radiomics features, lymphatic hilum status, and significant enhancement in the arterial phase, demonstrated excellent calibration and discrimination in both the training set (AUC = 0.955; 95% confidence interval [CI]: 0.924–0.985) and the validation set (AUC = 0.928; 95% CI: 0.861–0.994). The decision curve analysis confirmed the clinical validity of our nomogram. The DeLong test comparing the radiomics-clinical nomogram with the clinical model yielded a p-value of <0.001.
Conclusions
The radiomics nomogram, incorporating radiomics features and CT image features, serves as a non-invasive preoperative prediction tool with high accuracy in predicting cervical lymph node metastasis in patients with PTC.
Keywords
Introduction
Thyroid cancer is a prevalent malignancy of the endocrine system, with papillary thyroid carcinoma (PTC) accounting for 80% to 90% of all thyroid carcinomas.1,2 Despite its indolent nature, PTC often exhibits cervical lymph node metastasis (LNM), which serves as a significant indicator for prognosis, surgical considerations, and the risk of recurrence and low survival rates.3–5 Therefore, accurately assessing cervical LNM in PTC patients before surgery is crucial.
Traditionally, ultrasonography (US) has been used to evaluate cervical LN status in PTC patients. 6 However, US is operator-dependent and limited in assessing deep anatomical structures.6–8 CT examination offers superior spatial and density resolution, providing more precise anatomical information. 9 Spectral CT scanning, utilizing a dual-layer detector, enables the simultaneous acquisition of conventional CT images, virtual single-energy images, iodine density maps, and effective atomic number maps. This technology creates material-specific image datasets, making it a powerful tool for tumor diagnosis and characterization. 10 Previous studies have demonstrated the potential of quantitative parameters derived from dual-layer spectral detector CT (DLSCT) in differentiating metastatic and non-metastatic cervical lymph nodes. 11 However, these studies focused solely on average lymph node density values and average iodine uptake, neglecting the significant heterogeneity observed in metastatic lymph nodes.
Radiomics, which involves extracting a comprehensive set of quantitative features from medical images, offers a non-invasive and reproducible approach to create models that capture intrinsic heterogeneity, thereby supporting clinical decision-making. 12 Currently, radiomics methods have been successfully applied to evaluate and predict the lymph node status in various primary tumors, including breast cancer, colorectal cancer, and laryngeal squamous cell carcinoma.13–15 Several studies have demonstrated the feasibility of radiomics analysis in predicting cervical LNM in PTC patients and have combined radiomics signatures with clinical data to construct robust predictive models for LNM prediction. However, these studies primarily utilize ultrasound and conventional CT images.16–18 Limited research has applied spectral detector CT parameters to predict LNM in PTC, and the potential enhancement of integrating DLSCT-based radiomics with clinical risk factors for predicting LNM remains unclear.
Therefore, our study aimed to develop and validate radiomics nomograms based on spectral CT multi-parameters, including 40 KeV images, iodine density maps, and effective atomic number maps, combined with other clinical risk factors to predict LNM in PTC patients.
Materials and method
Patients
This retrospective study received approval from the institutional review board of First Hospital of Shanxi Medical University (approve number: KYYJ-2023-085; approve date:2023-3-2), and the requirement for written informed consent was waived. We identified a total of 368 patients with suspicious papillary thyroid carcinoma (PTC) who underwent dual-layer spectral detector CT (DLSCT) scans for preoperative assessment in our hospital database from January 2019 to December 2022. The inclusion criteria were as follows: (a) no history of other cancers, (b) no history of head and neck radiotherapy, (c) confirmation of PTC through postoperative pathology, (d) performance of cervical lymph node dissection, and (e) sufficient DLSCT image quality for analysis. Ultimately, we enrolled 143 patients (54 males and 89 females) with definitive lymph node pathology and high-quality DLSCT scan images (mean age: 45.12 ± 12.34 years; range: 18–77 years). The study collected pathological and clinical imaging data of the lymph nodes.
CT image acquisition
All patients underwent contrast-enhanced CT scans before surgery using the IQon DLSCT system (Philips Healthcare, Best, The Netherlands). Neck scanning was performed with the patients in a supine position, and they were instructed to avoid swallowing during the procedure. The scanning parameters were set as follows: 120 kVp; 50–350 mA s; automatic control technology for adjustment; pitch of 0.969; rotation speed of 0.5 s; detector collimation of 64 × 0.625 mm; layer thickness of 2 mm; and reconstruction layer thickness of 0.75 mm. After routine unenhanced CT, contrast-enhanced CT scans were conducted with a delay of 25 s (arterial phase) and 50 s (venous phase) following the intravenous administration of 60 mL of iodixanol (Hengrui Medicine, China) bolus injected via a cubital vein using a power injector. The contrast medium concentration was 320 mg/ml, and the injection rate was 3 mL/s with a high-pressure syringe. All CT images were retrieved from the picture archiving and communication system (eWorld, China).
LN histopathologic assignment and grouping
The assignment and grouping of lymph nodes (LN) were based on the American Joint Committee on Cancer cervical regional lymph node level system, 19 taking into account the radiological, surgical, and pathological information. The final histopathologic reports of surgical neck dissection specimens served as the reference standard. The specific process for assigning and grouping cervical LNs was as follows: If all the harvested LNs within surgery were histopathologically confirmed as metastatic in a particular cervical level, then all the identified LNs on DLSCT images in that level were considered metastatic. Conversely, if all the harvested LNs within surgery were histopathologically confirmed as non-metastatic in a specific cervical level, then all the identified LNs on DLSCT images in that level were classified as non-metastatic. In cases where the harvested LNs included both metastatic and non-metastatic LNs in a given cervical level, all the LNs in that level were excluded from further analysis. 20
To avoid the partial volume effect, we included LNs with a maximal short axial diameter greater than 5 mm in our study. Ultimately, a total of 214 cervical LNs (106 metastatic and 108 non-metastatic) were enrolled and randomly divided into a training set (74 metastatic and 76 non-metastatic) and a validation set (32 metastatic and 32 non-metastatic) at a ratio of 7:3. The flowchart of LN collection and the analysis scheme are presented in Figure 1.
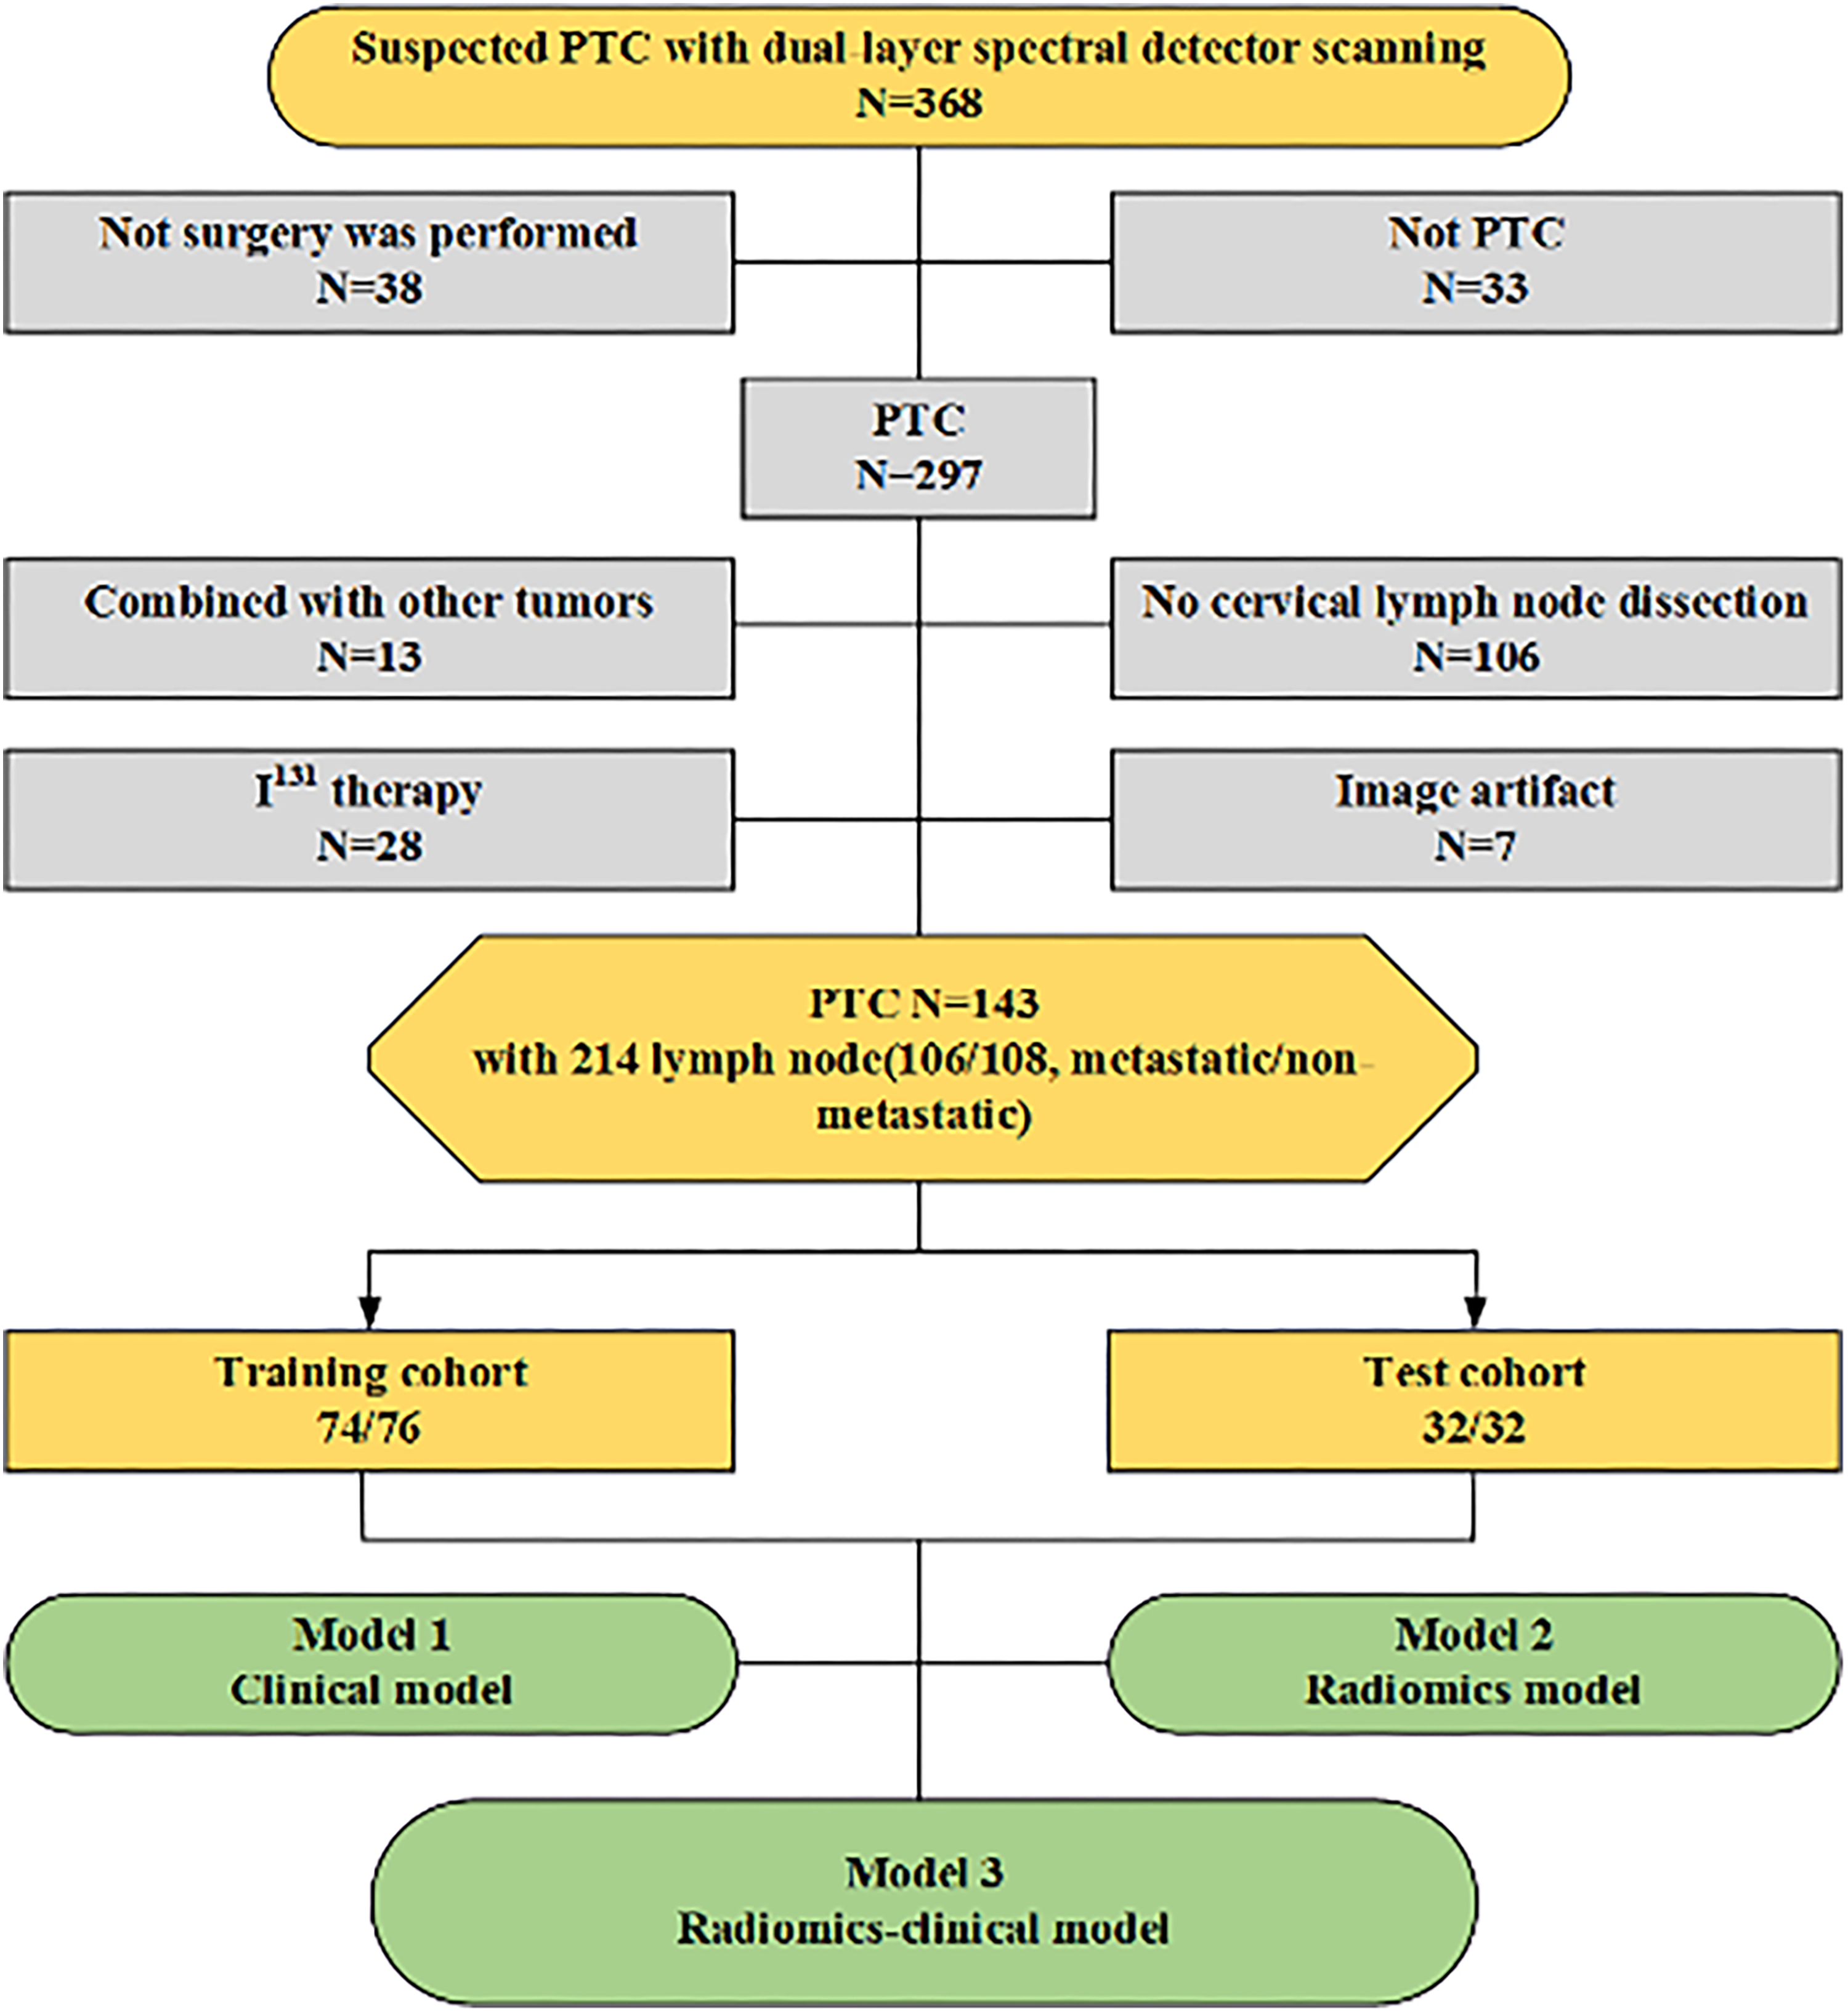
Flowchart of patients and LNs enrollment.
Qualitative and quantitative imaging analysis
We analyzed the following morphological CT features: long-axis diameter, short-axist diameter, lymphatic hilum (absence or presence), extranodal invasion (absence or presence), degree of enhancement (mild/moderate, significant), cystic change (absence or presence), calcification (absence or presence), non-enhancement, arterial phase and venous phase CT values, non-enhancement, arterial phase and venous phase slope (λHU), non-enhancement, arterial phase and venous phase normalized effective atomic number value (Zeff−N), and non-enhancement, arterial phase and venous phase normalized iodine concentration (NIC) (Figure 2).
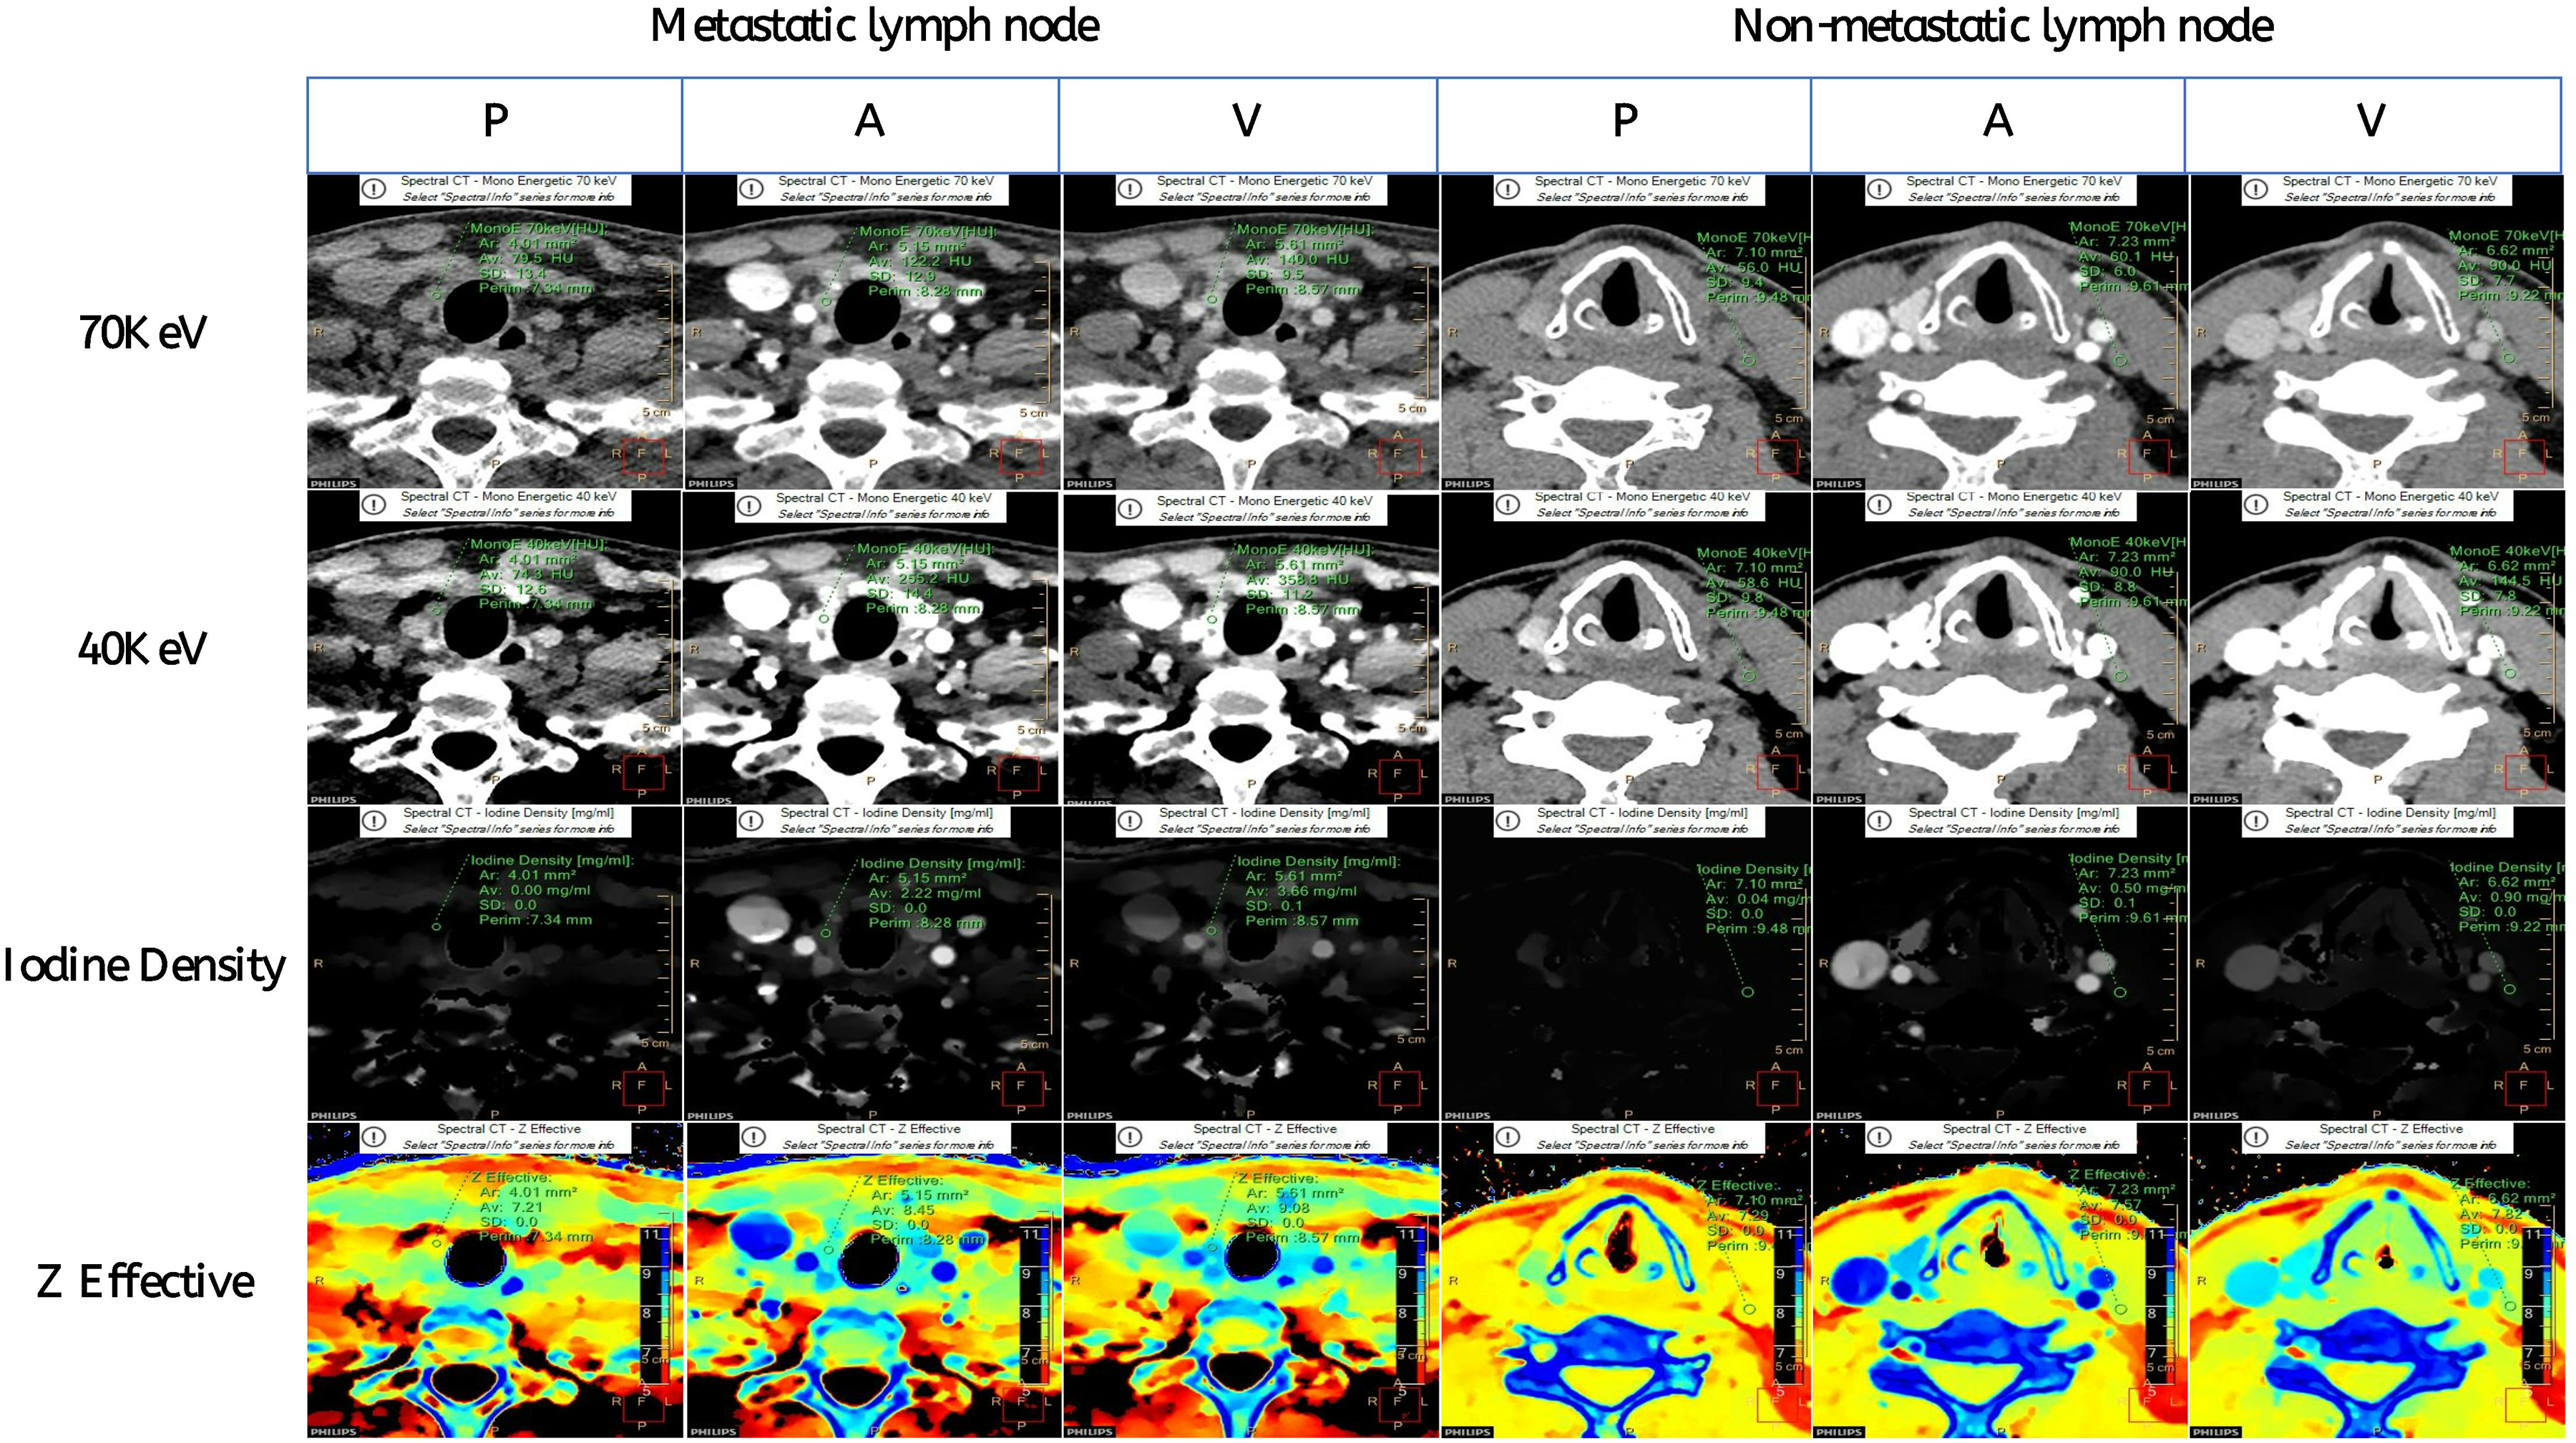
Quantitative analysis of the metastatic and non-metastatic lymph nodes.
Mild/moderate enhancement was defined as a difference between arterial phase and non-enhancement CT values of less than 40 (Hounsfield unit, Hu), while obvious enhancement was defined as a difference of more than 40 Hu. Extranodal extension was indicated by an obscure boundary or invasion into contiguous structures. The CT image analysis was conducted by two readers (reader 1 and reader 2) with 6 and 5 years of head and neck oncologic imaging experience, respectively. In case of disagreement, qualitative parameters were agreed upon through consultation, while quantitative parameters were calculated as the average value of the two measurements. All observers were blinded to the clinicopathological results and study design.
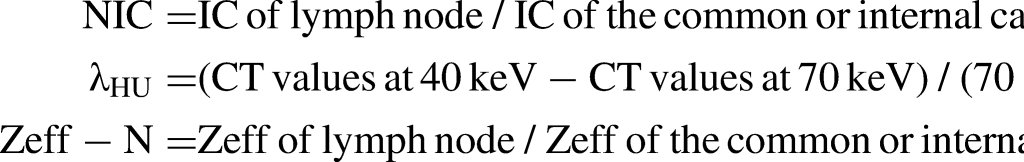
The formula was calculated as follows:
VOI delineate and radiomics feature extraction
Two observers manually delineated the lymph nodes on five sequences using ITK-SNAP 3.8.0 (http://www.itk-snap.org/) to obtain the volume of interest (VOI) for the corresponding area. High-throughput radiomics features were then extracted from the VOI of each lymph node using the pyradiomics package in Python 3.6.0. The extracted features consisted of 7 aspects: 18 first-order features, 24 gray degree co-occurrence matrix (GLCM) features, 14 gray degree dependence matrix (GLDM) features, 16 gray degree running length matrix (GLRLM) features, 16 gray degree size region matrix (GLSZM) features, 5 adjacent gray tone difference matrix (NGTDM) features, 16 gray degree and area matrix (GLSZM) features, and 14 shape features extracted solely from the original image. In total, 6650 radiomics features were extracted from the five image sequences of thyroid neck lymph nodes, including plain scans and DLSCT-derived 40 KeV images and iodine maps. Finally, 11 to 12 radiomics features were selected from the pool of 6650 features, which were deemed most relevant for predicting benign and malignant head and neck lymph nodes.
Radiomics feature selection and radiomics model construction
To assess the robustness and stability of the radiomics features, the radiologist (reader 1 with 6 years of experience) randomly selected 15 lymph nodes without metastasis and 15 lymph nodes with metastasis for testing after a 30-day interval. The reliability of the features was evaluated using the intra-class and inter-class correlation coefficients (ICC). Features with an ICC below 0.75 were excluded from further analysis. All features were grouped and screened based on the arterial phase 40 Kev images(AK), arterial phase iodine density maps(AI), plain scan 40 Kev images(PK), venous phase iodine density maps(VI), and venous phase 40 Kev images(VK). To ensure consistency in the training and validation groups, the same set of conditions was applied as follows: To address the imbalance in the training dataset, we employed the synthetic minority oversampling technique (SMOTE) to achieve a balance between positive and negative samples. The feature matrix was normalized using the Z-score normalization method, resulting in zero mean and unit standard deviation for each vector.
Given the high dimensionality of the feature space, we calculated the Pearson correlation coefficient (PCC) between feature pairs to assess their similarity. If the PCC coefficient exceeded 0.99, one of the features was randomly excluded. The recursive feature elimination (RFE) method was then used to filter the remaining features. RFE selects features recursively based on a classifier while considering a smaller set of features at each iteration. Logistic regression (LR) was employed as the classifier, combined with a 10-fold cross-validation method to obtain the optimal feature subset for each sequence. Finally, the optimal subsets of the AK, AI, PK, VI, and VK image sequences were combined and screened using the same modeling approach to determine the best feature set for the radiomics scoring model, which was subsequently established.
Once the Youden index reached its highest point in the training set, the radiomics score threshold was used to determine whether the lymph nodes were metastatic or not. The trained model was then applied to the validation set, and the optimal model was constructed and evaluated based on the area under the receiver operating curve (ROC) of the validation set.
Construction of the clinical model
In the training set, the collected data on clinical imaging features underwent univariate analysis. If the results revealed a significant difference (p < 0.05) between lymph nodes without metastasis and those with metastasis, multivariate logistic regression analysis was performed. A clinical model was developed using the variable with p < 0.05 in the multivariate analysis as an independent risk factor in the clinical context.
Radiomics-Clinical nomogram construction
A logistic regression analysis was conducted to combine clinical independent risk factors and radiomics scores, resulting in the development of a radiomics clinical nomogram. The nomogram was then calibrated using a calibration curve and assessed using the Hosmer-Lemeshow test. To assess the clinical validity of the radiomics-clinical nomogram, ROC analysis was performed to compare its discriminative power with that of the radiomics score alone or the clinical model alone in diagnosing the metastatic status. Additionally, decision curve analysis and plotting were employed to determine the clinical validity of the nomogram. The specific process of ROI mapping is illustrated in Figure 3.
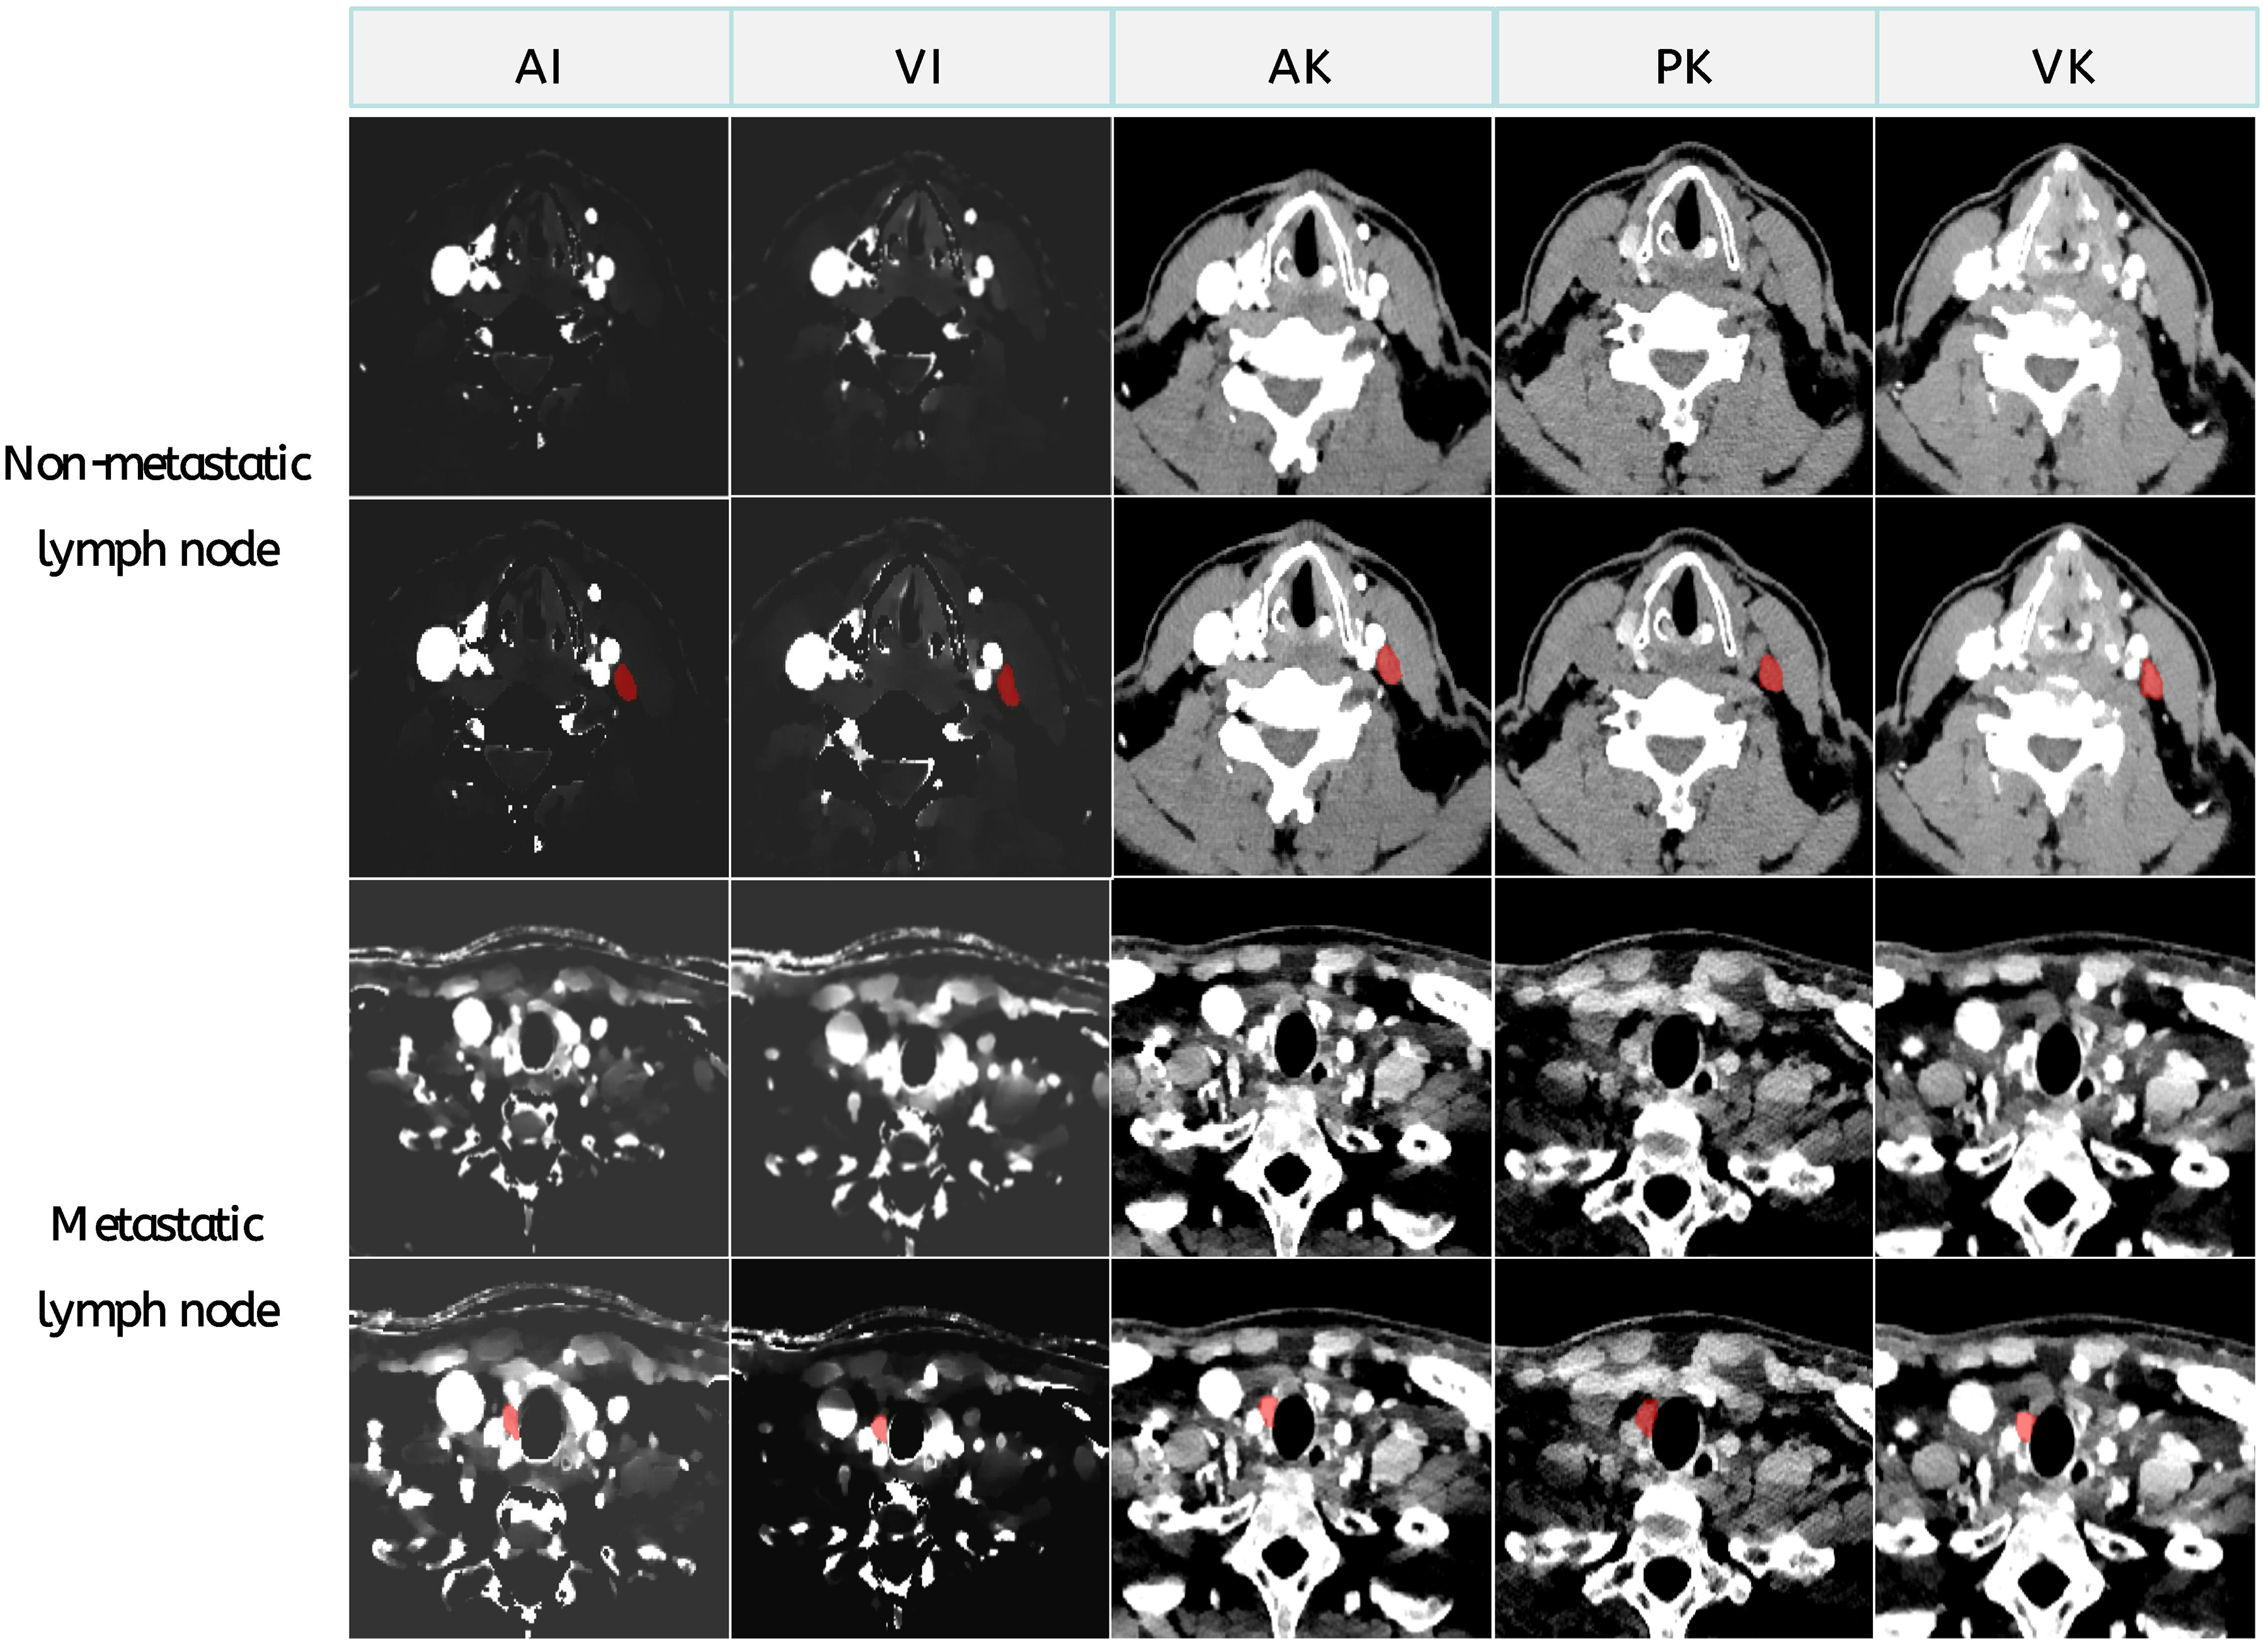
Arterial phase, venous phase of idione maps and arterial phase, venous phase, and plain scan of original and ROI data from a metastatic lymph node of 49-year-old man with thyroid cancer and a non-metastatic lymph node of 39-year-old man with thyroid cancer.
Statistical analysis
Statistical analyses were conducted using R version 4.2.0 (https://www.r-project.org/) or SPSS 26.0. The normality of measurement data was assessed, and data following a normal distribution were presented as mean ± standard deviation. The independent sample t-test was employed for group comparisons of normally distributed measurement data. For measurement data that did not conform to a normal distribution, the Mann-Whitney U test was used for group comparisons. Enumeration data were presented as case numbers, and the chi-square test was used for group comparisons. A two-sided p-value below 0.05 was considered statistically significant.
Results
In our study, a total of 214 LNs were divided into a training group and a validation group in a 7:3 ratio. We randomly selected 150 LNs as the training dataset (74 positive, 76 negative) and another 64 LNs as an independent validation dataset (32 positive, 32 negative). There were no significant differences in all CT imaging features between the training and validation groups (Table 1, all p > 0.05). The clinical imaging features of LNs in both groups are presented in Table 1.
Comparison of CT image features between training set and validation set.
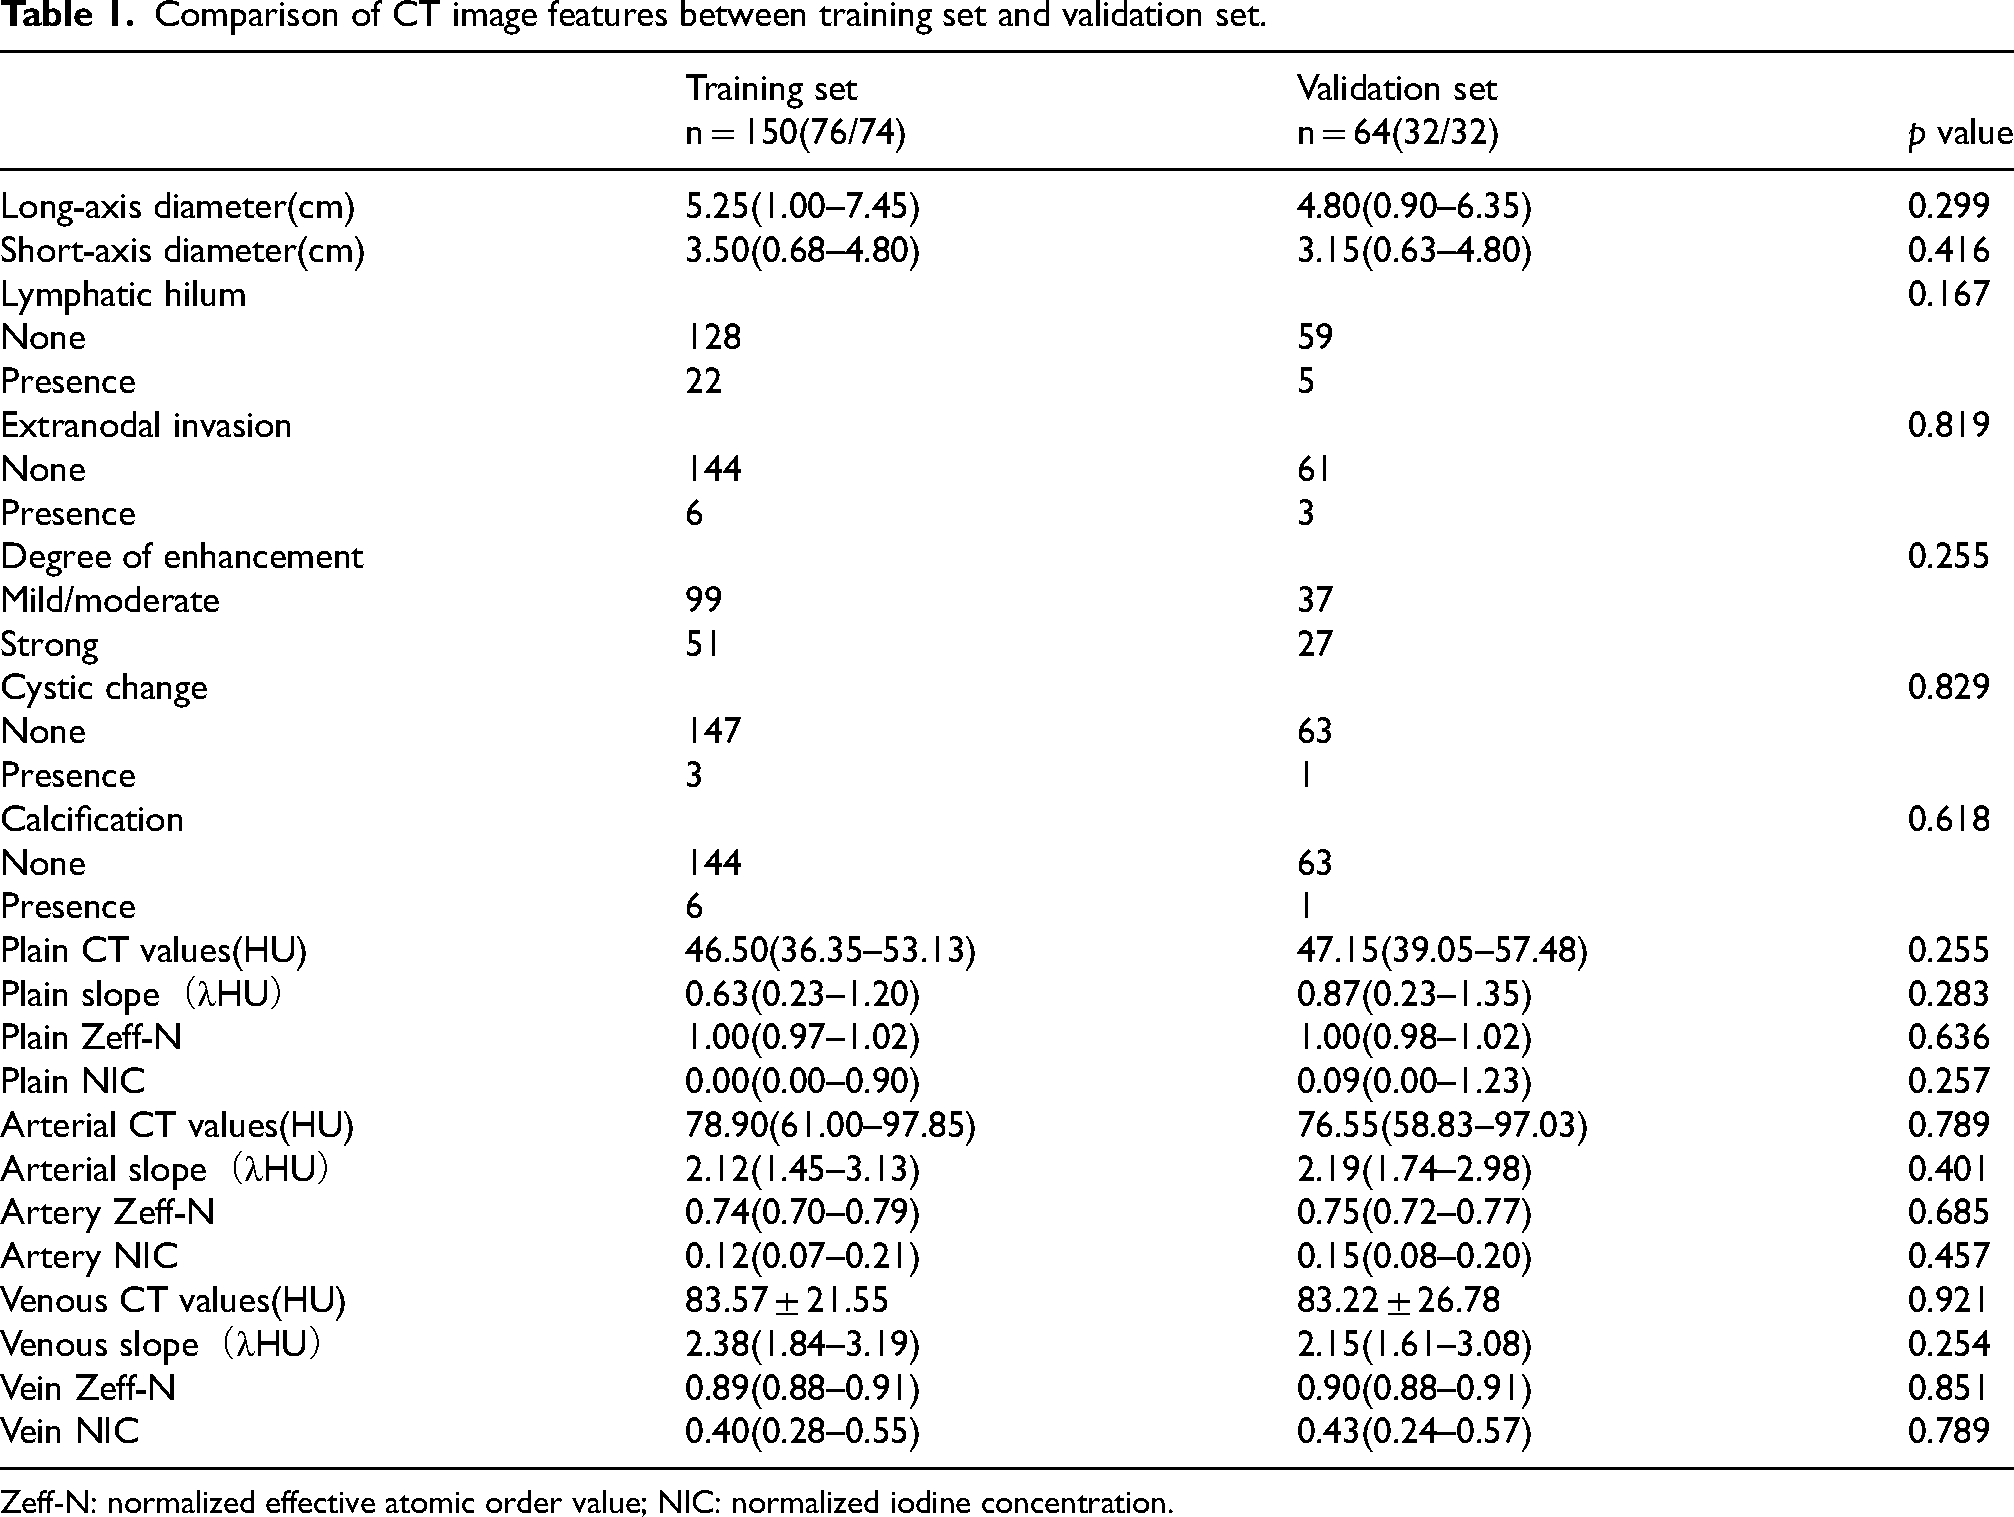
Zeff-N: normalized effective atomic order value; NIC: normalized iodine concentration.
Construction and evaluation of radiomics model
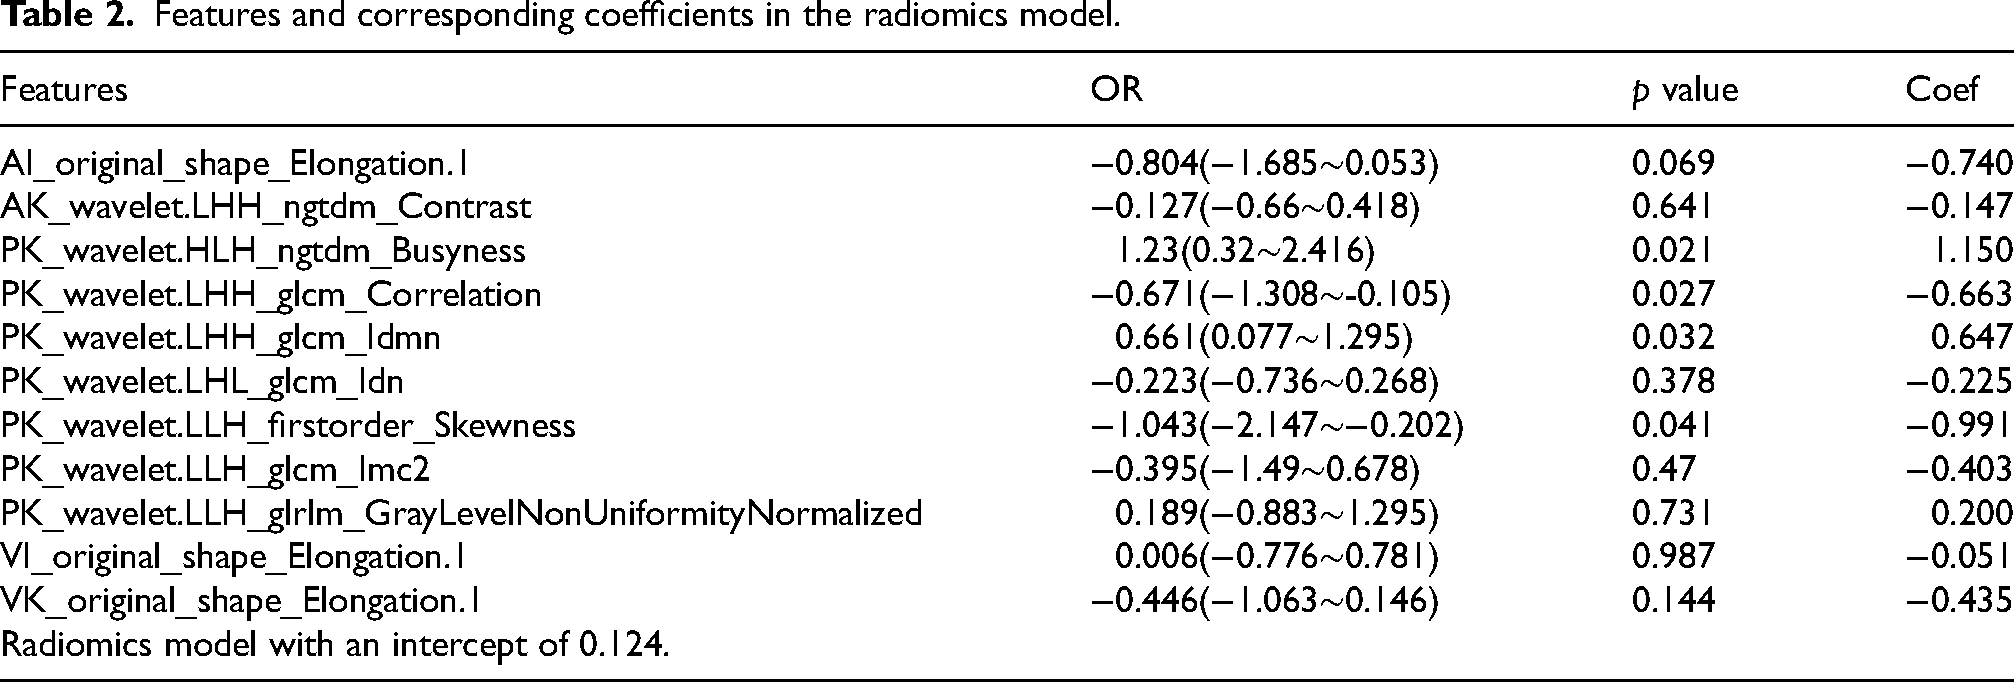
A total of 6650 radiomics features were extracted from the delineated region of cervical lymph nodes in each CT unenhanced phase, arterial phase, and venous phase. From these, 5439 radiomics features were selected based on intra-class and inter-class ICC ≥ 0.75. Subsequently, the recursive feature elimination (RFE) and logistic regression (LR) model identified 2 arterial, 2 venous, and 7 unenhanced features, including three shape features and eight first-order features. These eleven key radiomics features were incorporated into the radiomics signature (Table 2). The contribution of the selected features to the construction of the radiomics model is depicted in Figure 4. The model based on these 11 features achieved the highest area under the curve (AUC) on the validation set. The AUC of the training set and validation set for the radiomics score model were 0.925 [95% CI: 0.881–0.962] and 0.896 [95% CI: 0.802–0.973], respectively (Figure 4(a)-(b)). The maximum Youden index value was 0.708, and the critical value of the radiomics score was determined as 0.349. The sensitivity and specificity of the radiomics score model were 79.7% and 82.9%, respectively.
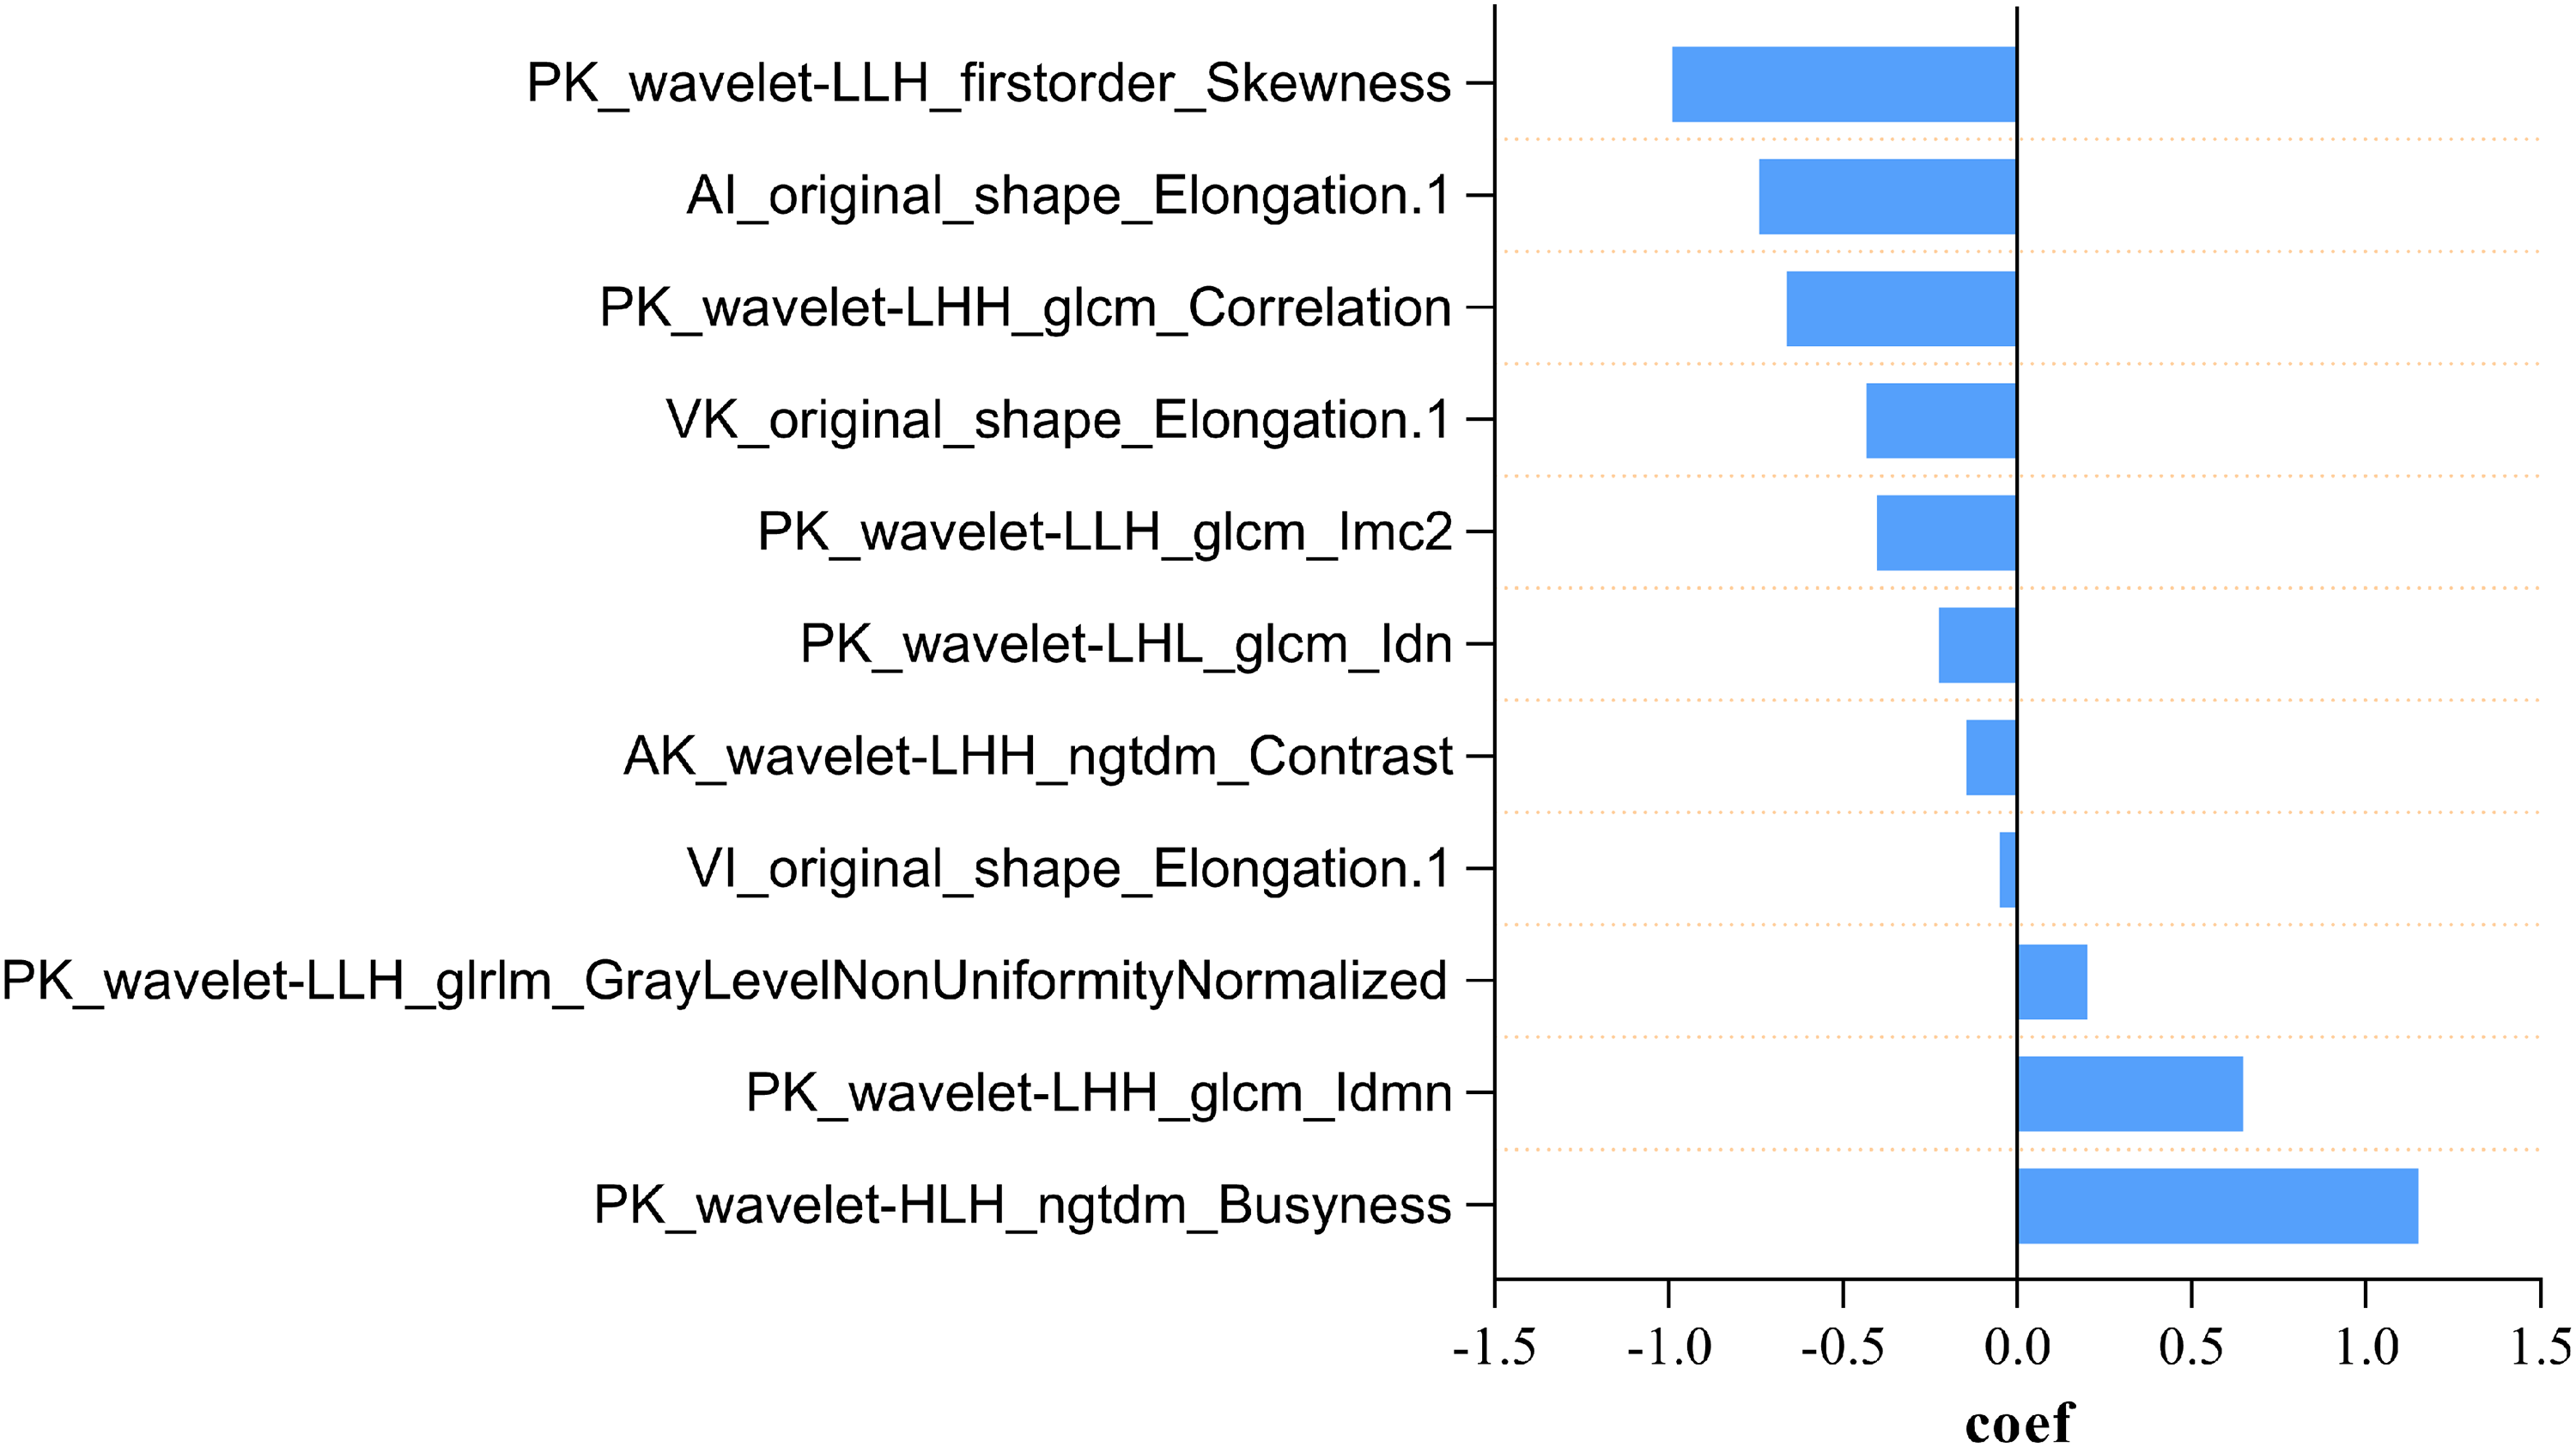
The contribution of the selected 11 features of radiomics model.
Features and corresponding coefficients in the radiomics model.
Construction and evaluation of clinical model
Table 3 summarizes the comparison of clinical imaging features between nonmetastatic and metastatic cervical thyroid lymph nodes in the training set. Through univariate analysis, significant differences were observed in all six imaging features between the two groups (p < 0.05). Finally, three independent clinical imaging features, namely lymphatic hilum, arterial phase enhancement pattern, and arterial phase slope, were obtained through multivariate logistic regression to construct the clinical model. The clinical model formula was calculated as follows: Clinical model = −1.004 - 3.058 × lymphatic hilum + 1.365 × degree of enhancement + 0.330 × arterial slope. The AUC values of the clinical model for the training set and the validation set were 0.798 [95% CI: 0.729–0.868] and 0.747 [95% CI: 0.626–0.868], respectively. At a maximum Youden index value of 0.478, the critical value for the clinical model was determined as 0.498. The clinical model exhibited a sensitivity of 66.2% and specificity of 80.3%.
Results of univariable (left Side of the table) and multivariable analysis (right Side of the table) of clinical characteristics.
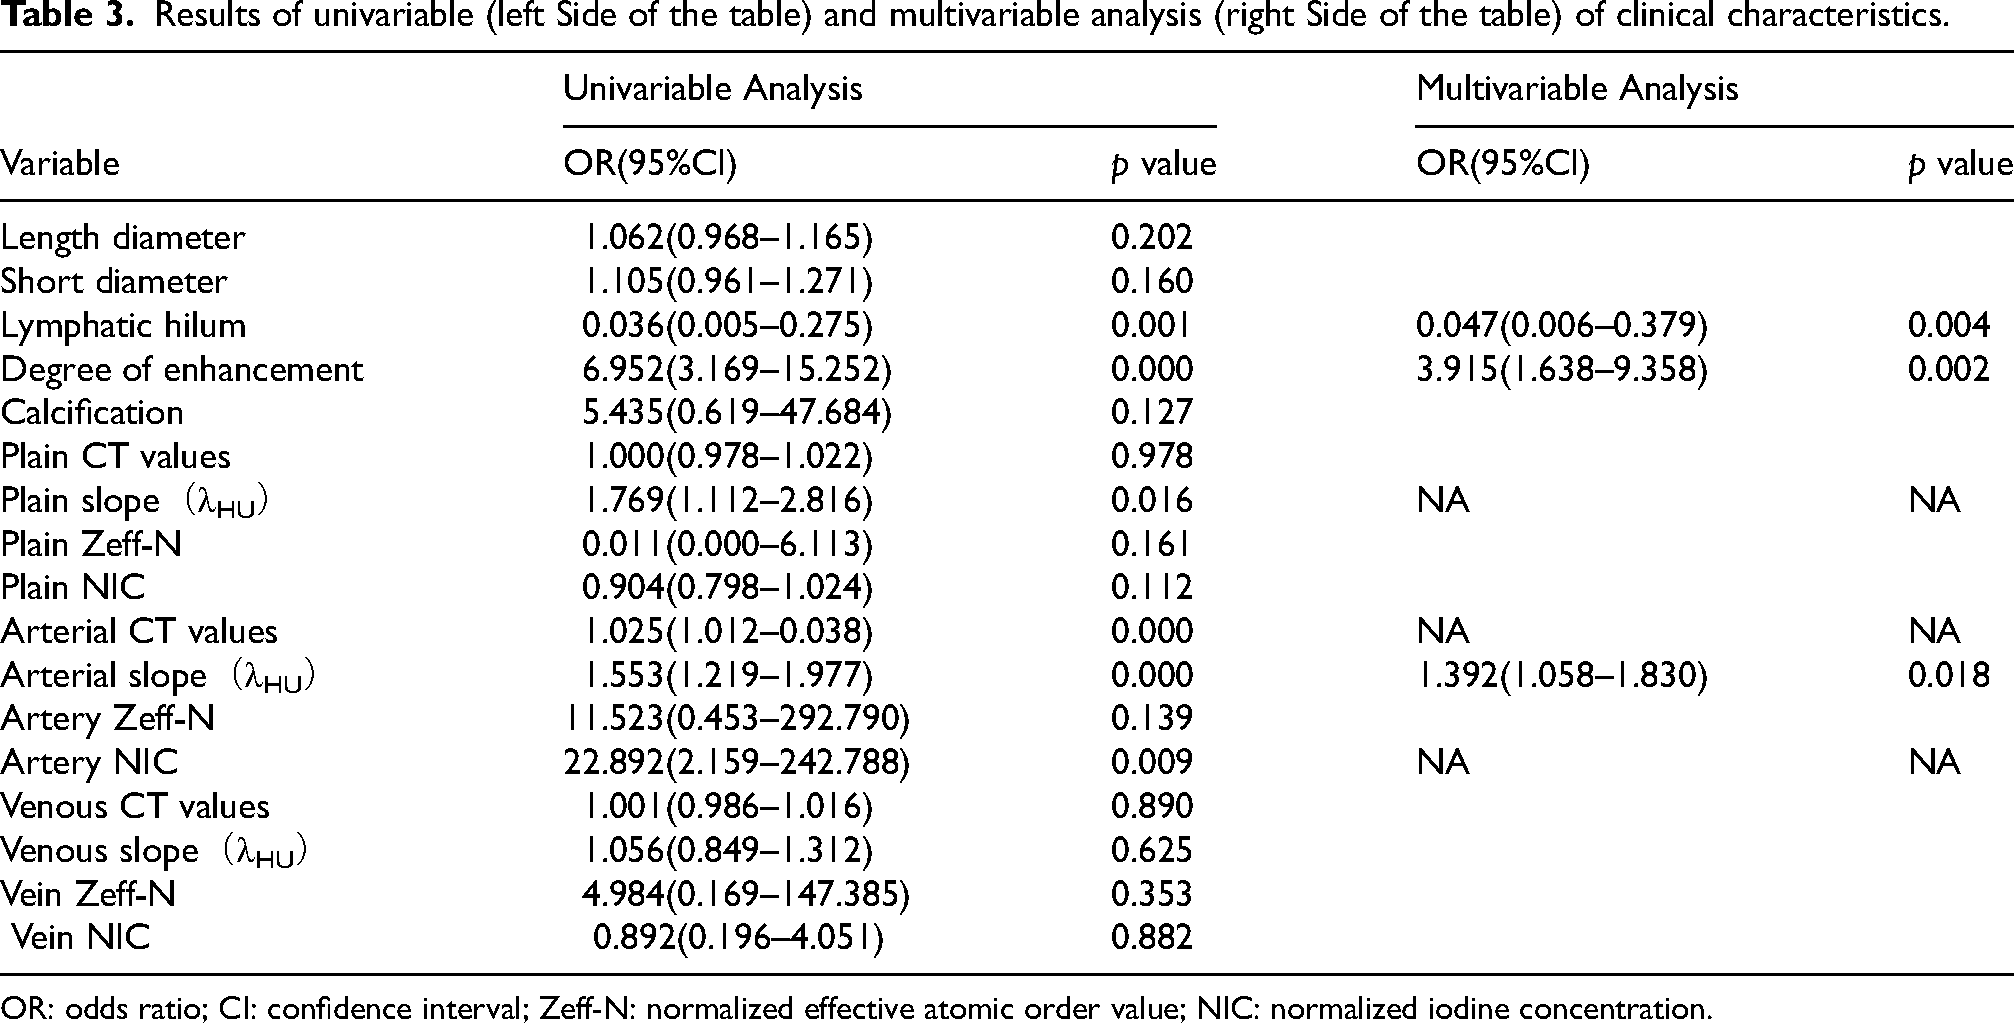
OR: odds ratio; CI: confidence interval; Zeff-N: normalized effective atomic order value; NIC: normalized iodine concentration.
Construction and evaluation of radiomics-clinical model
Logistic regression was performed on the three independent clinical imaging features and radiomics scores, resulting in a minimum AIC value of 90.087. The constructed model incorporated two clinically independent risk factors (lymphatic hilum and degree of enhancement pattern) along with radiomics scores to form a radiomics-clinical nomogram, as shown in Figure 5(a). The AUC values of the radiomics-clinical nomogram for the training and validation cohorts were 0.955 [95% CI: 0.924–0.985] and 0.928 [95% CI: 0.861–0.994], respectively. At a maximum Youden index value of 0.785, the critical value for the nomogram model was determined as 0.688. At this threshold, the radiomics clinical nomogram exhibited a sensitivity of 87.8% and specificity of 85.5%.
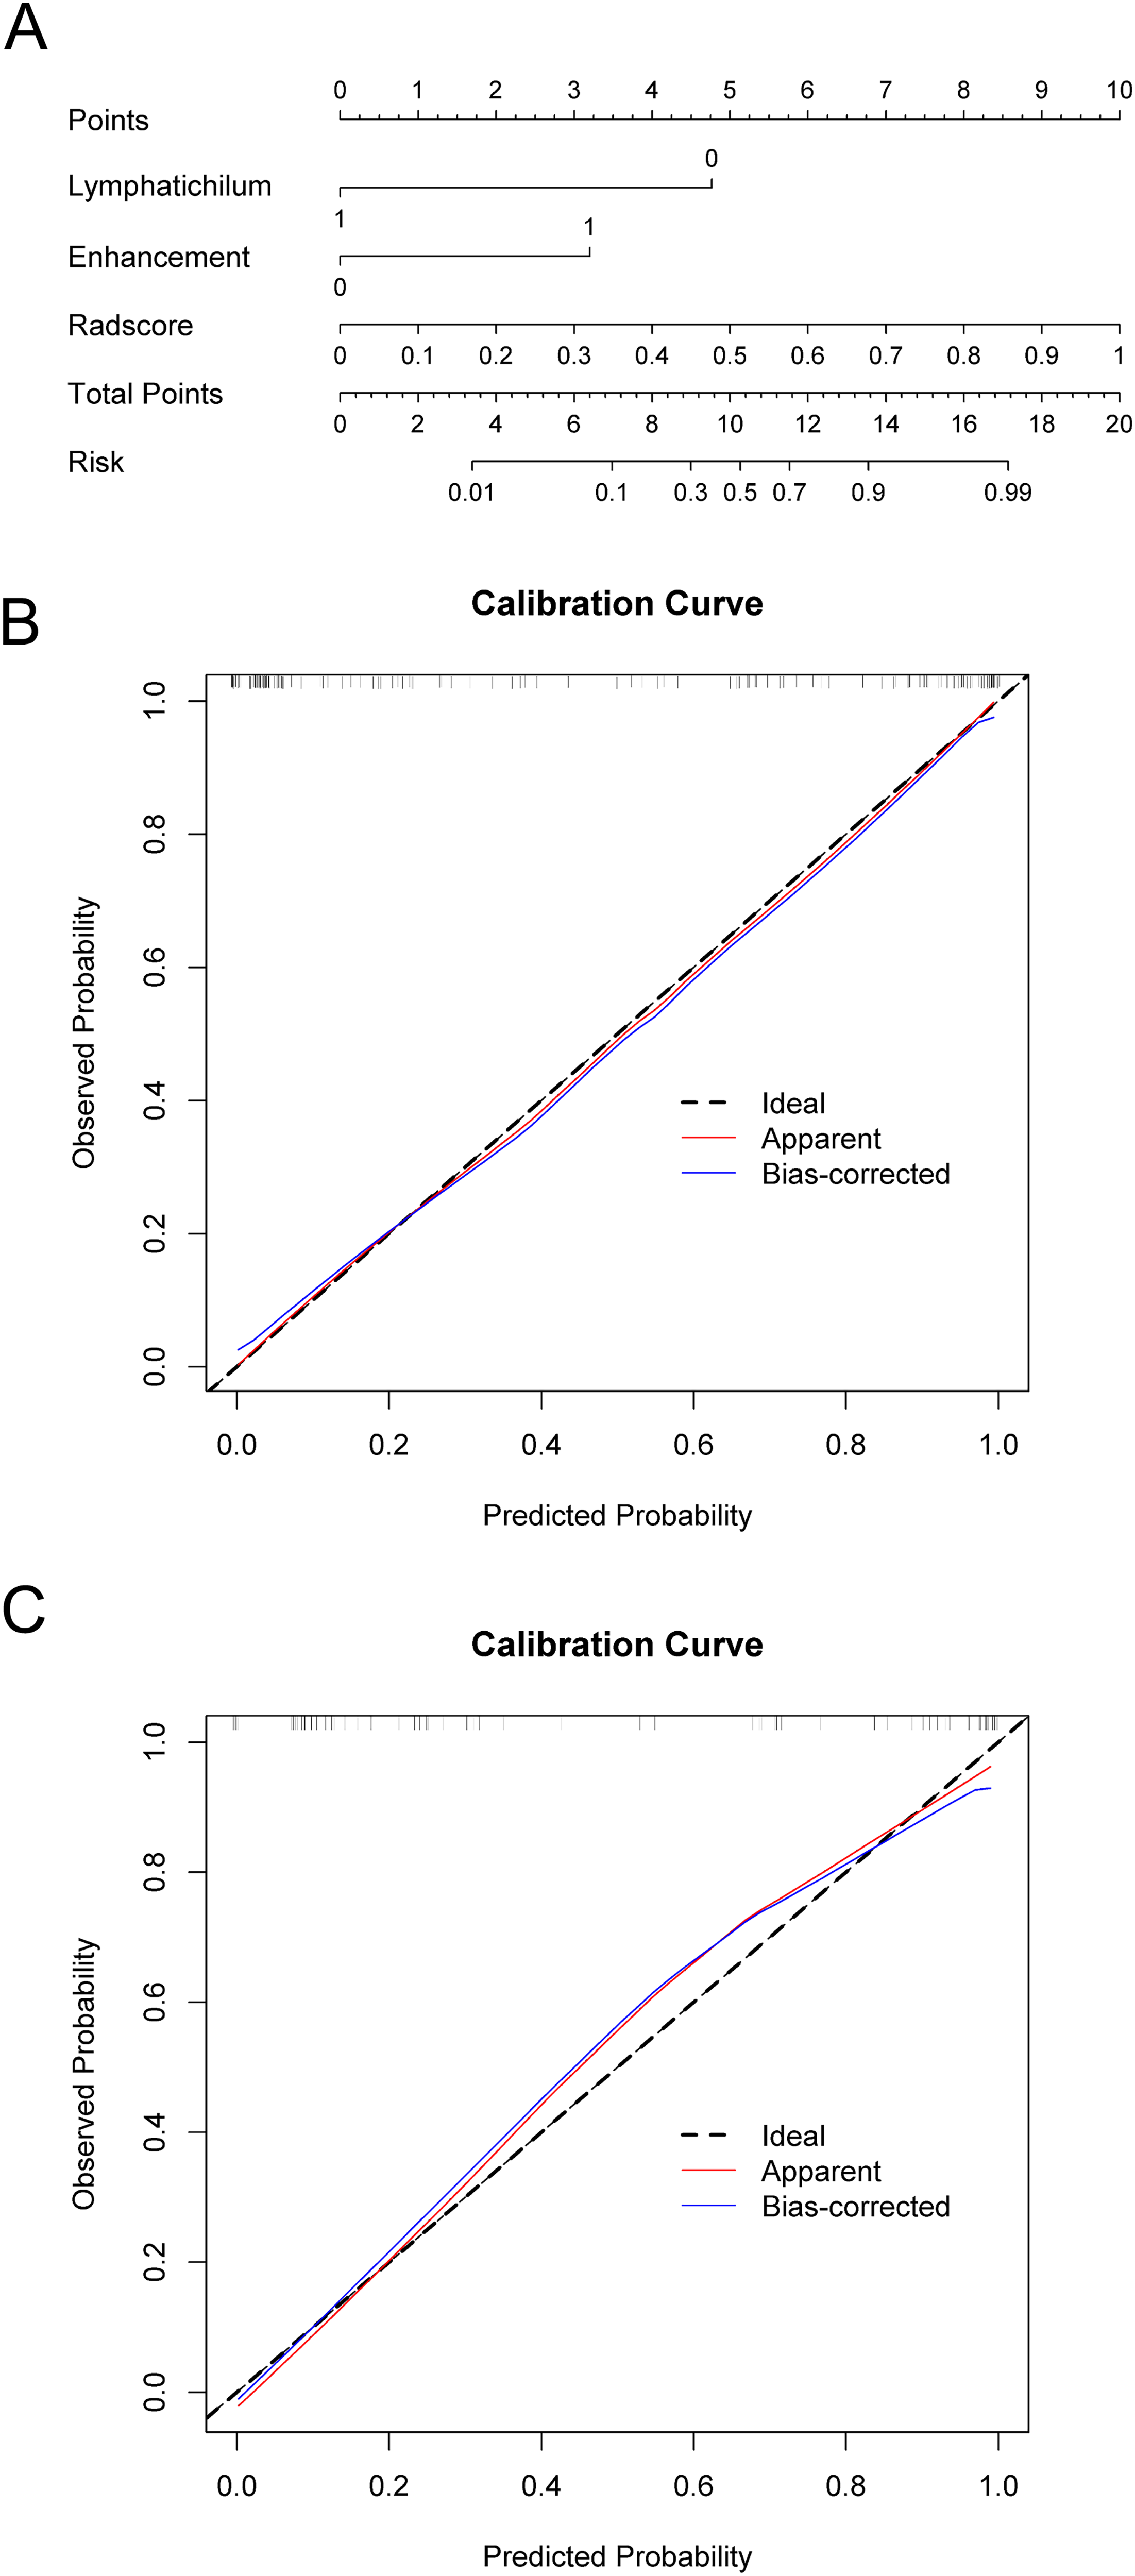
(a) Radiomics-clinical nomogram. (b) Radiomics-clinical nomogram training set calibration curve. (c) Radiomics-clinical nomogram validation set calibration curve.
Validation of three models
According to the optimal cut-off values (clinical model: 0.498, Radiomics model: 0.349, Nomogram model: 0.688), the validation set was classified into two groups based on the maximum Youden index point determined from the training set. The clinical model exhibited a sensitivity of 66.2% and specificity of 80.3%. The radiomics model demonstrated a sensitivity of 79.7% and specificity of 82.9%. Moreover, the joint model showed a sensitivity of 87.8% and specificity of 85.5% (Table 4). The AUC value of the clinical model was 0.747 (95% CI: 0.626–0.868), the AUC value of the radiomics model was 0.896 (95% CI: 0.802–0.973), and the AUC value of the joint model was 0.928 (95% CI: 0.861–0.994).
Comparison of diagnostic efficacy of different prediction models for lymph node metastasis.
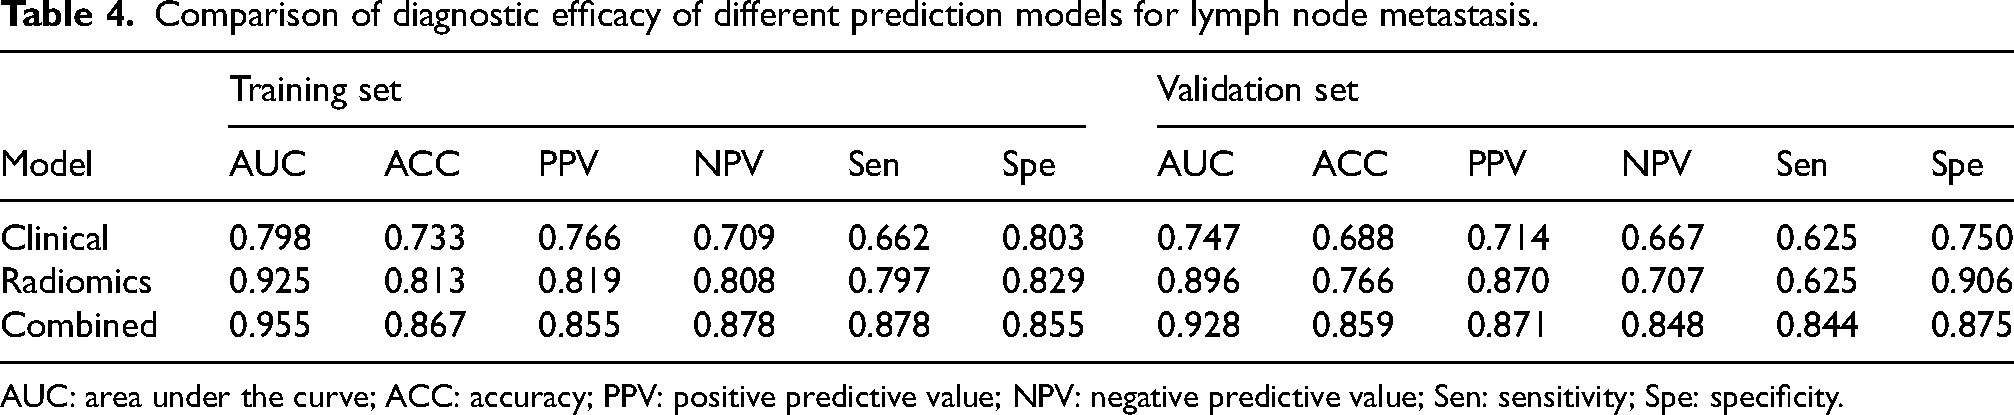
AUC: area under the curve; ACC: accuracy; PPV: positive predictive value; NPV: negative predictive value; Sen: sensitivity; Spe: specificity.
Diagnostic performance comparison of three models
The diagnostic capabilities of the three different models were compared for both the training and validation sets, as depicted in Figure 6(a) and (b). The radiomics-clinical nomogram exhibited the highest diagnostic performance in both the training set (AUC = 0.955) and the validation set (AUC = 0.928), followed by the radiomics model (training set, AUC = 0.925; validation set, AUC = 0.896). Notably, both of these models outperformed the clinical model in terms of diagnostic accuracy in both the training set (AUC = 0.798, p < 0.05) and the validation set (AUC = 0.747, p < 0.05).
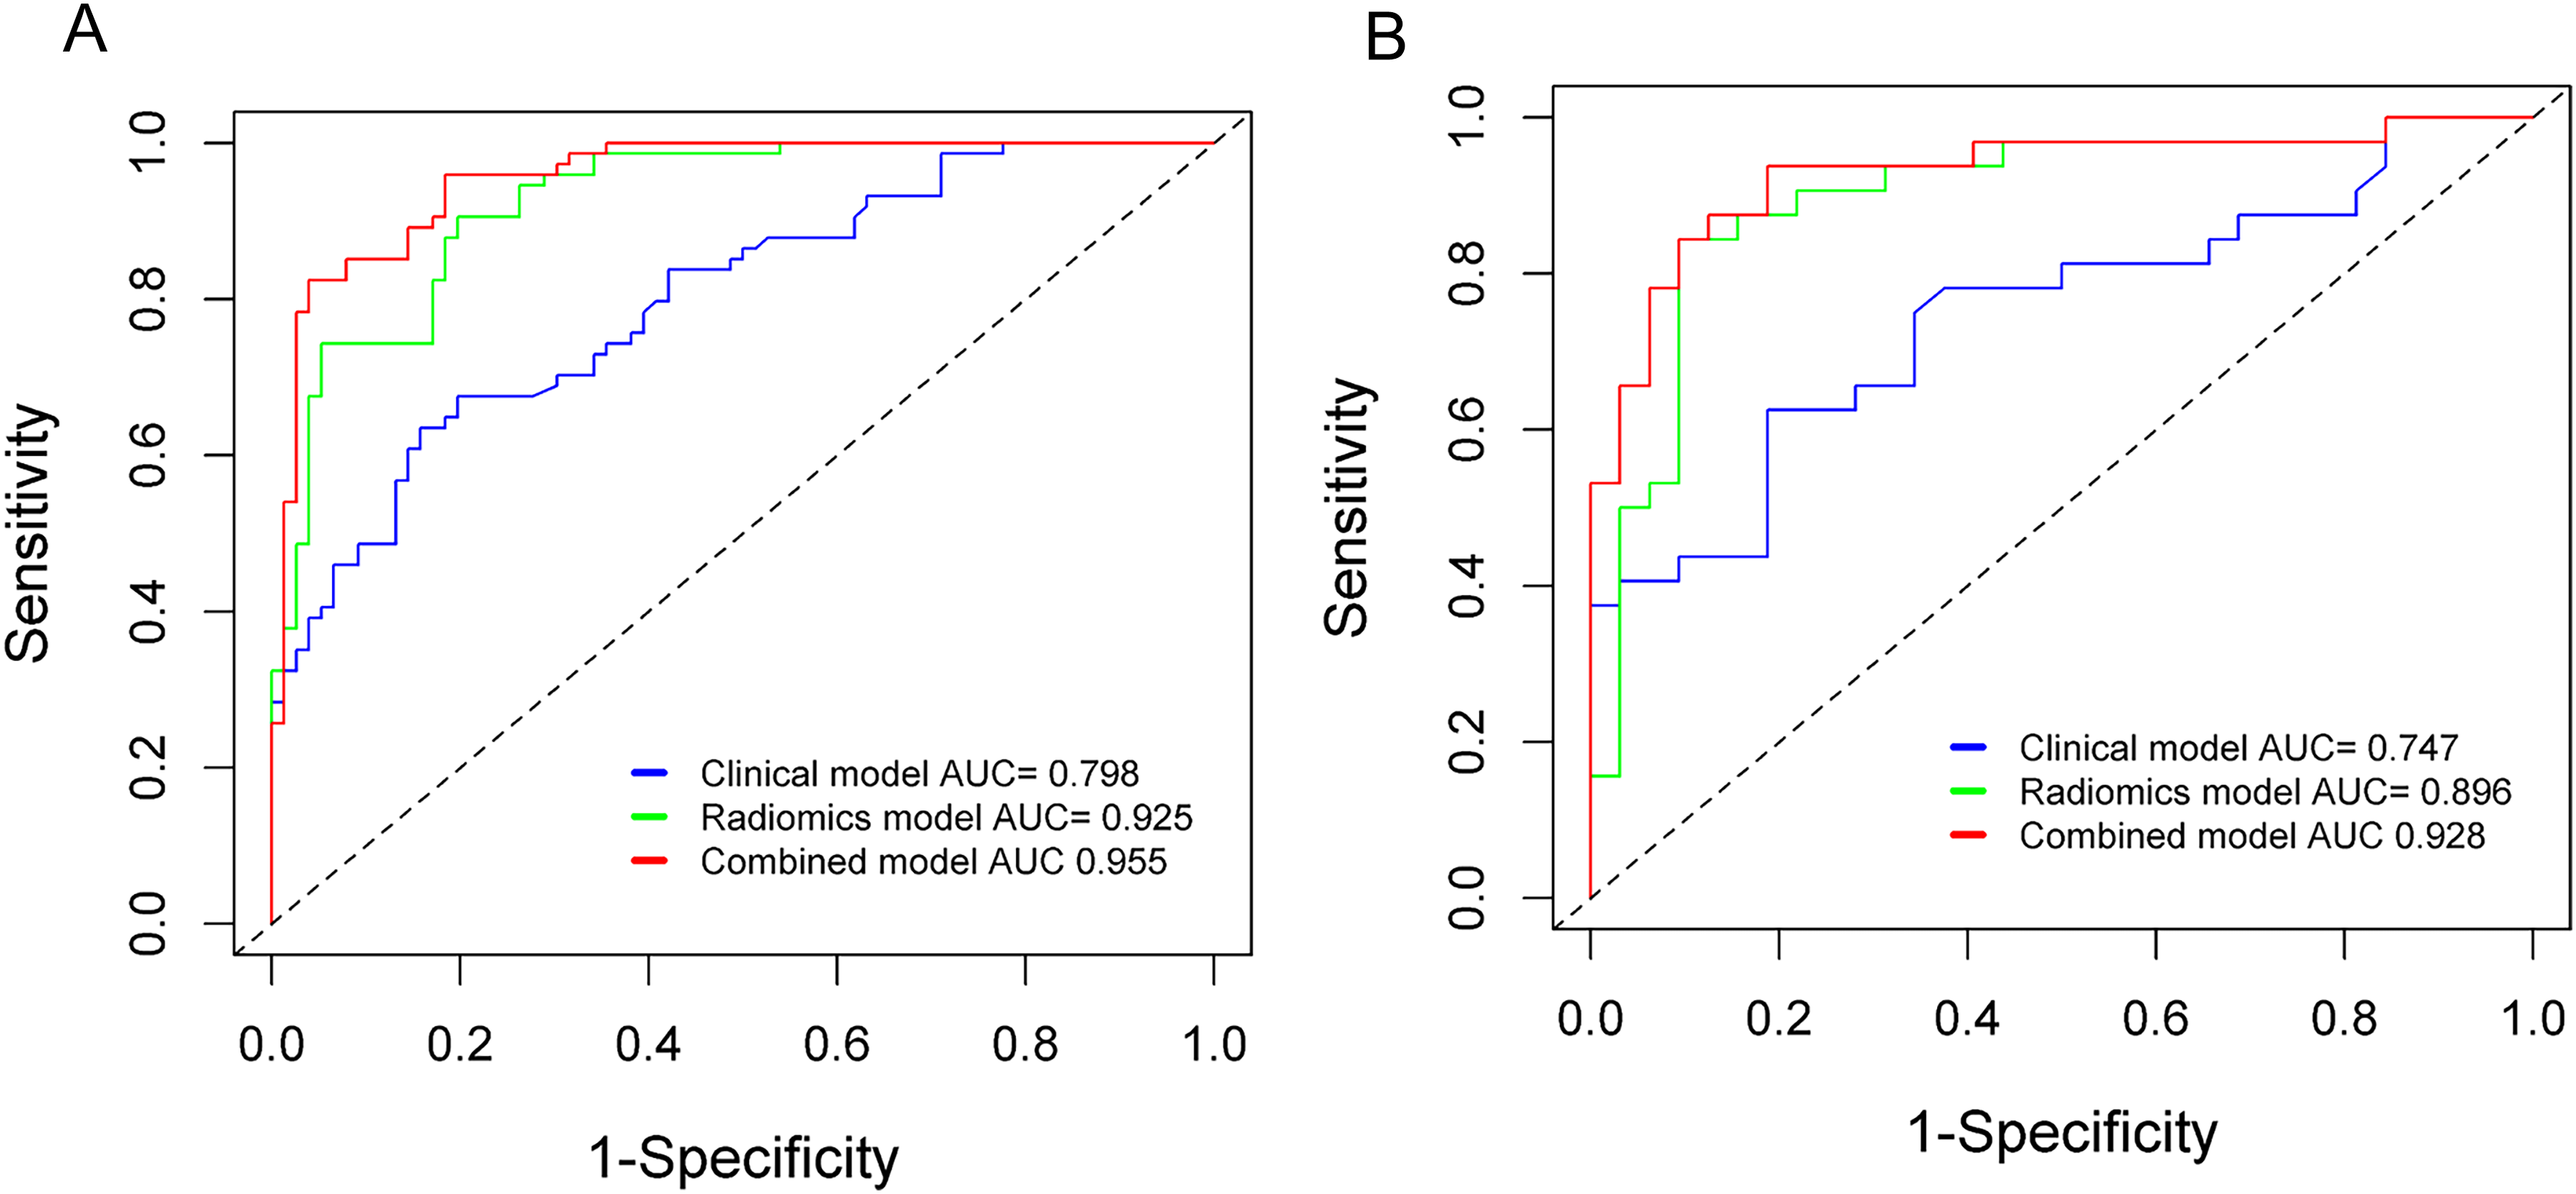
(a) In the training set, the clinical model achieved an AUC value of 0.798, while the radiomics scoring model and radiomics-clinical nomogram achieved AUC values of 0.925 and 0.955, respectively. (b) In the validation set, the clinical model achieved an AUC value of 0.747, while the radiomics scoring model and radiomics-clinical nomogram achieved AUC values of 0.896 and 0.928, respectively.
Clinical utility
The radiomics-clinical nomogram was transformed and depicted as a nomogram in Figure 5(a). Excellent calibration of the nomogram was observed in both the training (Figure 5(b)) and validation sets (Figure 5(c)), with p-values of 0.198 and 0.614, respectively, indicating good agreement between the predicted and observed probabilities.
Upon calculation of the Integrated Discrimination Improvement (IDI) value, the performance of the radiomics-clinical nomogram was significantly superior to that of the clinical model, with an IDI value of 0.3726 (p < 0.001). This suggests that the radiomics-clinical nomogram is effective in predicting lymph node metastasis, exhibiting a 17.98% improvement in diagnostic efficiency compared to the clinical model. Similarly, the radiomics score model performed slightly better than the clinical model, with an IDI value of 0.2579 (p < 0.001), corresponding to a 10.76% improvement in diagnostic accuracy. The decision curve analysis for the three models in the training set is presented in Figure 7. Notably, the radiomics model and the radiomics-clinical nomogram demonstrated a greater net benefit in diagnosing metastatic lymph nodes across various threshold probabilities compared to the clinical model, surpassing the “treat all” or “treat none” strategies.
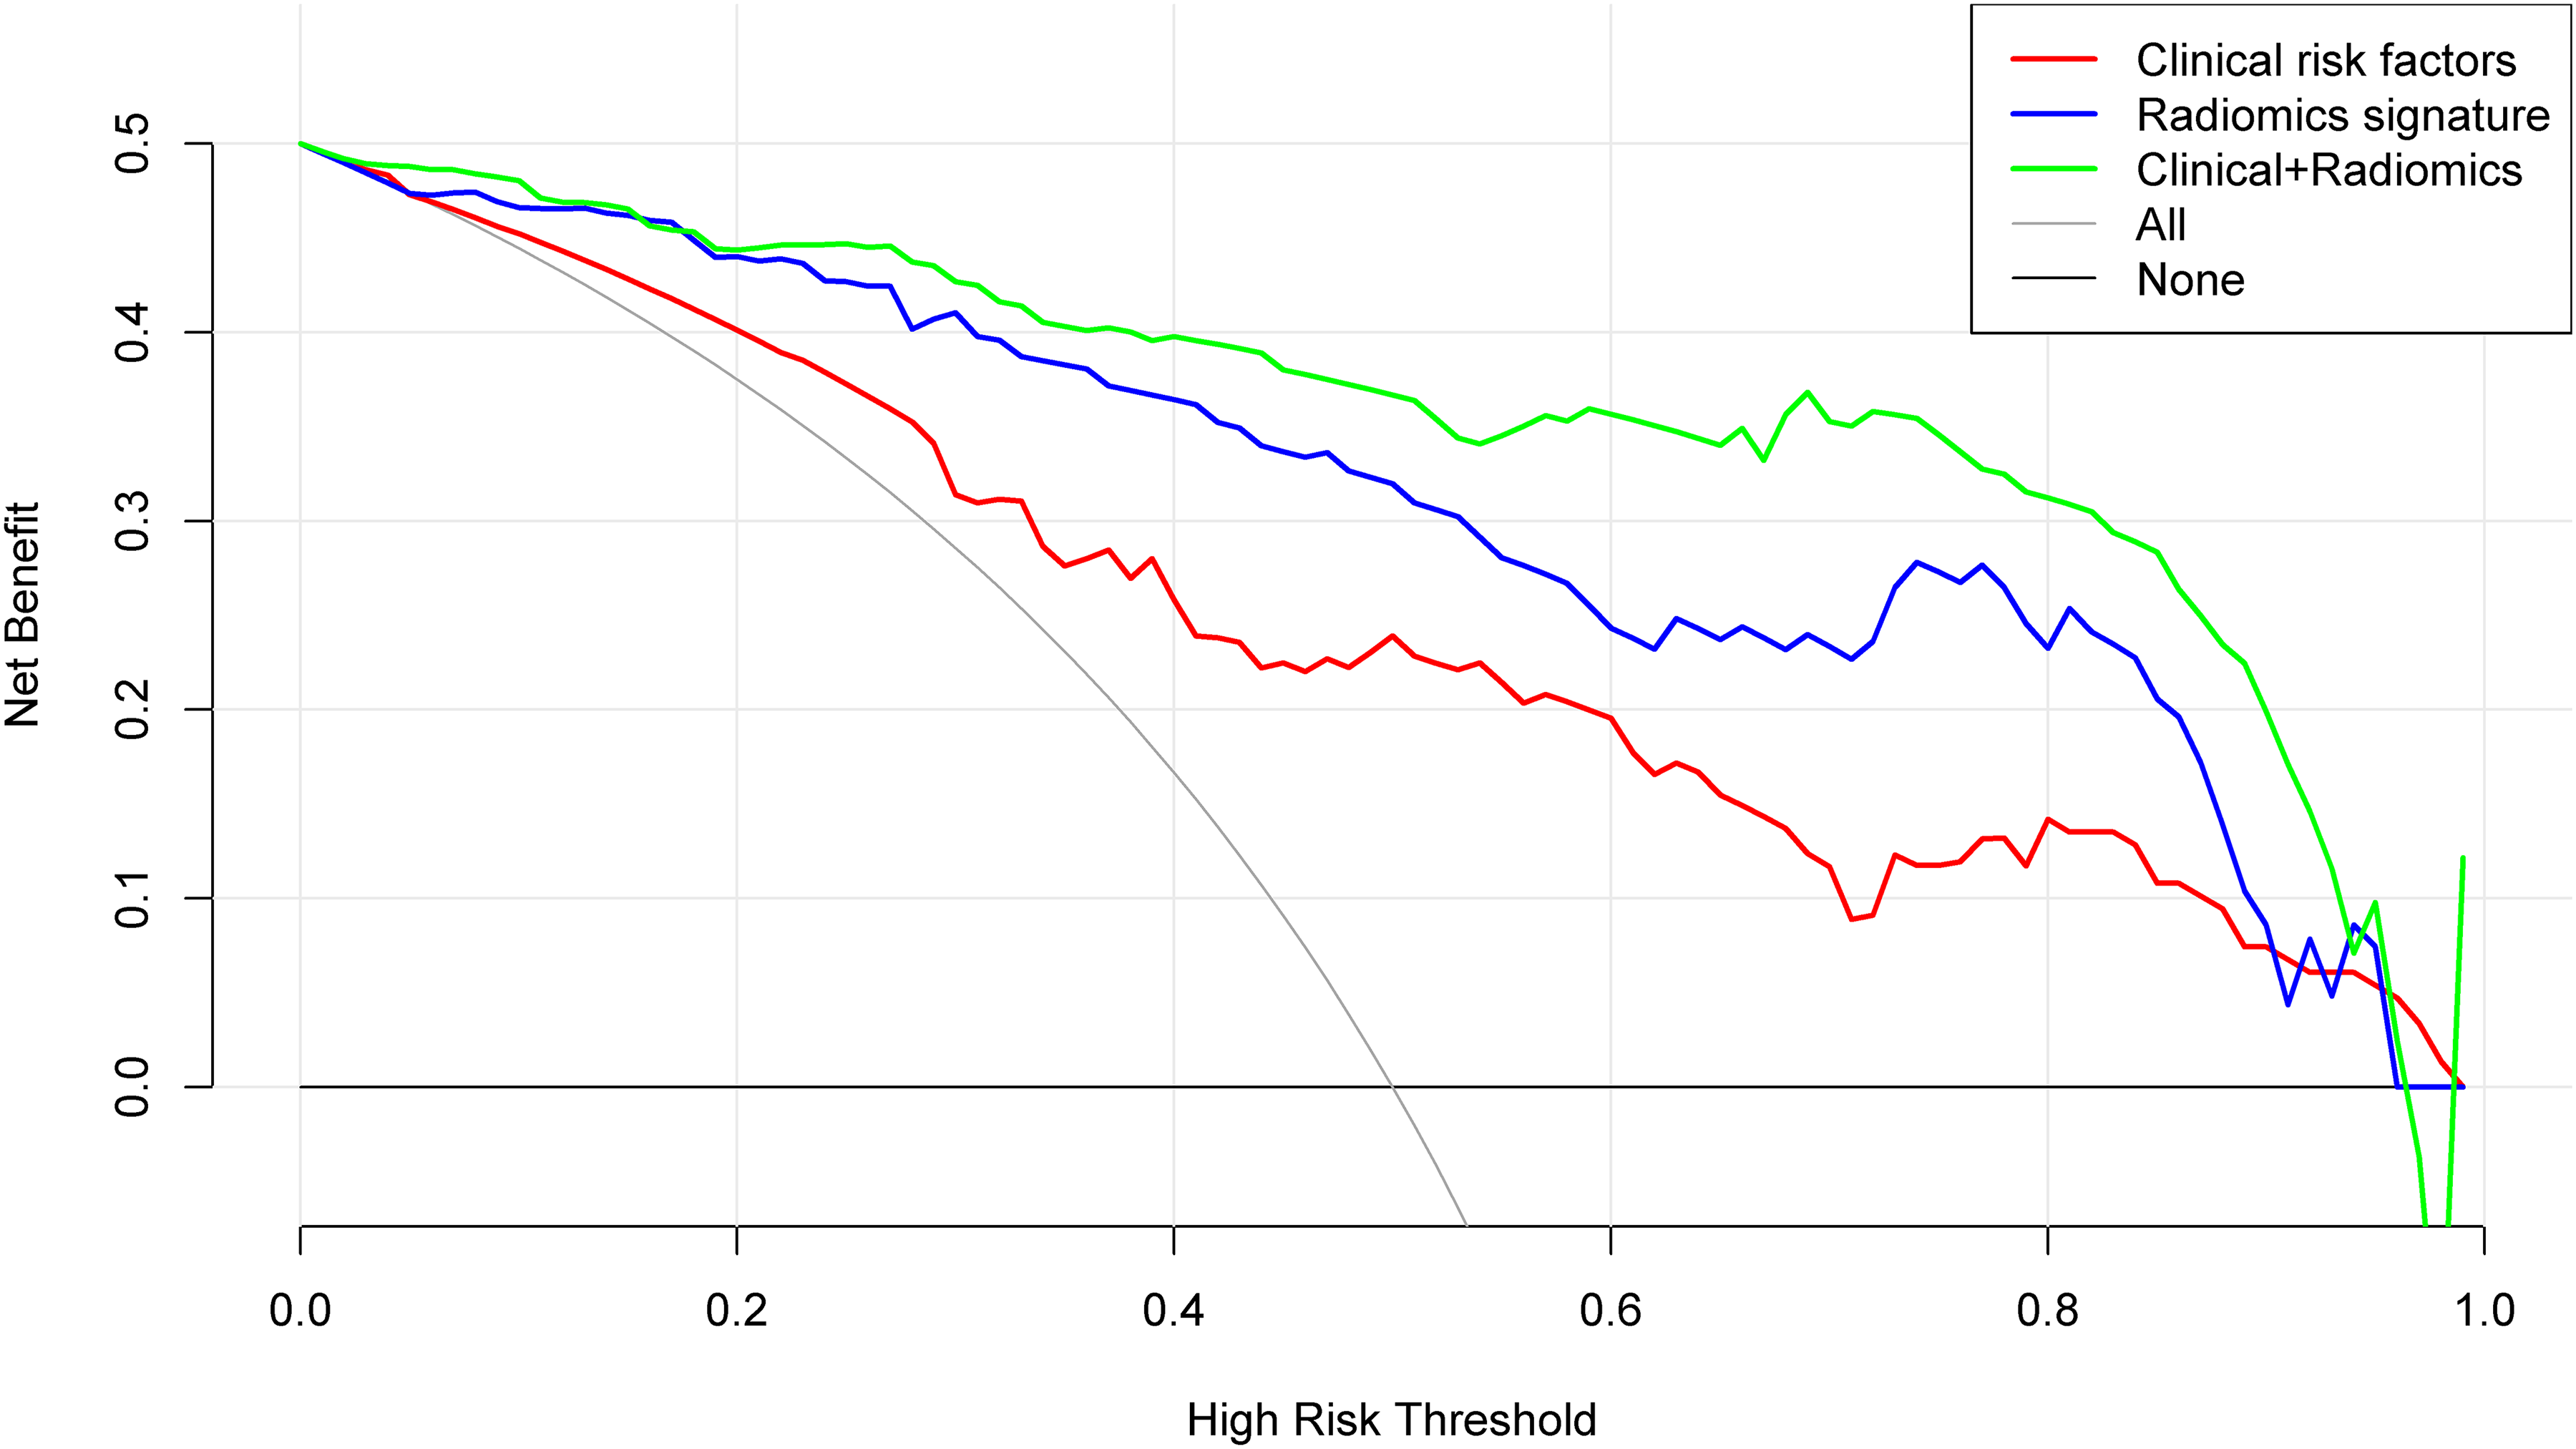
The decision curve analysis was performed to assess the clinical model, radiomics model, and radiomics-clinical nomogram for predicting lymph node metastasis. In the analysis, the radiomics scoring model is represented by the blue line, the clinical model by the red line, and the radiomics-clinical nomogram by the green line. The results clearly demonstrate that both the radiomics-clinical nomogram and the radiomics scoring model exhibited superior performance compared to the clinical model.
Discussion
The presence of cervical lymph node metastasis in papillary thyroid carcinoma (PTC) can increase the risk of regional recurrence and negatively impact patient survival. 21 However, prophylactic cervical lymph node dissection carries the risk of postoperative complications, such as recurrent laryngeal nerve paralysis, cervical hematoma, and hypoparathyroidism. 22 Therefore, there is a significant need for preoperative prognostic markers that can accurately assess the risk of cervical lymph node metastasis in PTC, allowing for effective avoidance of overdiagnosis and improvement of patient prognosis.
Previous studies on lymph node (LN) status assessed by computed tomography (CT) have primarily focused on morphological signs, including maximum long and short diameters, shape, margin, calcification, cystic changes, and heterogeneous enhancement. However, the morphological signs of metastatic lymph nodes are often atypical. Dual-layer spectral CT (DLSCT) can generate single-energy images at various tube voltages (40–200 keV). The energy spectrum curve, based on CT values, enables the comprehensive display of internal differences in lesion CT values and facilitates tissue composition analysis, 23 thereby revealing the essential characteristics of the lesion. 24 The slope of the spectral curve increases with a higher blood supply and greater contrast absorption. Quantitative studies on energy spectrum parameters have the potential to improve the accuracy of detecting metastatic lymph nodes. Zhang Xia et al. 25 demonstrated that the slope of the energy spectrum curve differed between normal and metastatic lymph nodes during the arterial and venous phases. Ying Zou et al. 26 identified the optimal parameter for diagnosing lymph node metastasis as IC in the arterial phase, with an area under the curve (AUC), sensitivity, and specificity of 0.775, 71.9%, and 73.6%, respectively. In the present study, the lymphatic hilum, arterial phase enhancement pattern as morphological parameters, and the slope of the energy spectrum curve in the arterial phase were identified as independent risk factors for constructing the clinical model. The sensitivity and specificity were 66.2% and 80.3%, respectively. The AUC values of the training set and validation set in the clinical model were 0.798 [95%CI: 0.729–0.868] and 0.747 [95%CI: 0.626–0.868], respectively. Although quantitative indicators of energy spectrum parameters may have improved the diagnostic value, the sensitivity of the diagnosis remains relatively low. Additionally, the independent risk factors varied among different studies. In our opinion, this difference may be attributed to variations in study datasets but is more closely related to the subjectivity and instability of morphological assessment.
Radiomics, a precise, objective, and efficient method, has the potential to enhance conventional imaging diagnosis. It involves extracting hundreds of quantitative features from images and utilizing self-training and learning based on pathological results to assist in clinical diagnosis. Radiomics analysis enables the extraction of high-throughput quantitative features, which effectively assess the spatial distribution of voxels and their correlation with tissue heterogeneity.27,28 Radiomics techniques have rapidly evolved and been applied to differential tumor diagnosis and the assessment of tumor aggressiveness in various cancers, including malignant parotid gland lesions, 29 breast cancer,30,31 and renal cell carcinoma. 32 In the context of PTC, Enock Adjei Agyekum et al. 33 reported promising results in assessing cervical lymph node metastasis in PTC patients using a radiomics model based on preoperative ultrasound images.
First-order features provide a quantitative reflection of the overall voxel intensity distribution within the region of interest (ROI), enabling the evaluation of lymph node information on a global scale.
Texture features describe the spatial distribution of pixel intensity in images and exhibit high sensitivity in capturing histological and pathological characteristics of lesions. 34 The combination of these features allows for a comprehensive assessment of lymph node heterogeneity from different perspectives. Malignant lymph nodes, compared to nonmalignant ones, exhibit abnormal neovascularization, increased cell permeability, and internal necrosis, leading to changes in the roughness of lymph nodes and increased heterogeneity. These changes, imperceptible to the naked eye, can be captured by texture features, which remain unaffected by subjective factors. 35 These invisible radiomics features provide additional information about the vascular microenvironment of papillary thyroid carcinoma (PTC) that correlates with aggressive biological behavior. 36 The radiomics score model demonstrated excellent representation of cervical lymph node (LN) metastasis, with AUC values of 0.925 [95%CI: 0.881–0.962] in the training set and 0.896 [95%CI: 0.802–0.973] in the validation set. The sensitivity and specificity of the model were 79.7% and 82.9%, respectively, indicating its superior performance over the clinical-imaging model in predicting LN metastasis in PTC patients.
Lu et al. 18 proposed a radiomics nomogram that incorporated radiomics features, CT-reported LN status, sex, and age for preoperative prediction of cervical LN metastasis in PTC patients. The nomogram improved the prediction AUC from 0.807 to 0.867 in the training cohort and from 0.795 to 0.822 in the validation cohort. Zhou et al. 20 introduced a radiomics nomogram that combined conventional CT images with radiomics features derived from dual-energy CT iodine maps to diagnose cervical LN metastasis in PTC patients. The study demonstrated optimal diagnostic performance in both the training set (AUC = 0.933) and the validation set (AUC = 0.895). These successful studies highlight the feasibility of utilizing CT-based radiomics for LN status prediction in PTC. In our study, binary logistic regression analysis identified the lymphatic hilum, degree of enhancement pattern, radiomic signature from DLSCT-derived 40 KeV images, and iodine density map as independent variables for constructing a clinical-radiomics nomogram. This nomogram exhibited superior diagnostic efficacy in predicting LN metastasis compared to the clinical and radiomics score models, with AUCs of 0.955 and 0.928 in the training set and validation set, respectively. The sensitivity of the radiomics-clinical nomogram was 87.8%, and the specificity was 85.5%. Our findings suggest that the clinical-radiomics nomogram can be utilized as a non-invasive preoperative tool to assess the risk of LN metastasis in PTC patients and guide individualized treatment planning.
Our study has several limitations. Firstly, it is important to note that this study is retrospective in nature, and therefore, the findings should be validated through prospective studies. Secondly, the data used in this study were obtained from a single center, resulting in a relatively small sample size. Thus, it is necessary to externally validate the efficacy of the model using a larger dataset. Lastly, it is important to acknowledge that there is not a one-to-one correspondence between the lymph nodes observed in the images and the pathological findings. Instead, the assessment is based solely on the cervical level.
Conclusions
In conclusion, we have successfully developed a radiomics model using DLSCT-derived 40 KeV images and iodine density map to preoperatively diagnose metastatic lymph nodes (LNs) in patients with papillary thyroid carcinoma (PTC). The newly proposed radiomics model demonstrates superior diagnostic performance compared to relying solely on conventional CT imaging features. These findings highlight the potential of radiomics signatures, particularly when integrated with clinical features, as a valuable tool to assist radiologists in accurately assessing LN status and guiding treatment decisions.
Footnotes
Ethics approval
This retrospective study received approval from the institutional review board of First Hospital of Shanxi Medical University (approve number: KYYJ-2023-085; approve date:2023-3-2), and the requirement for written informed consent was waived.
Consent to participate
requirement for written informed consent was waived because of the retrospective study.
Author contributions
All authors contributed to the study conception and design. Material preparation, data collection and analysis were performed by[BTL], [MY] and [CXF]. The first draft of the manuscript was written by [FYZ], [JJB], [GQY] and [YQ], all authors commented on previous versions of the manuscript. All authors read and approved the final manuscript.
Funding
The authors received no financial support for the research, authorship, and/or publication of this article.
Declaration of conflicting interests
The authors declared no potential conflicts of interest with respect to the research, authorship, and/or publication of this article.
Data availability
The datasets generated during and/or analysed during the current study are available from the corresponding author on reasonable request.