
Abstract
Background
Pathologically, clear cell renal cell carcinoma (ccRCC) is the most common type of renal carcinoma, with high heterogeneity and poor prognosis. There is increasing evidence that alternative splicing (AS) is involved in tumor evolution and tumor immune microenvironment (TIME). However, studies on the exploration of AS events and TIME in ccRCC are still few but needed.
Methods
The transcriptional data and clinicopathological information of patients with ccRCC in The Cancer Genome Atlas (TCGA) database were extracted completely. Patients were grouped according to the ESTIMATE algorithm and differentially expressed AS events (DEASs) were identified. The relationship between AS events and features of TIME were investigated by functional enrichment analysis and unsupervised consensus analysis. Finally, hub splicing factors (SFs) was identified by the regulatory network of survival-related AS events and intersection SFs, and its biological function was further verified in vitro.
Results
In total, the data of 515 patients with ccRCC were extracted and analyzed. Patients with low immune-score presented longer overall survival (OS) than high immune-score. 861 AS events were identified as DEASs, and they were enriched in immune-related pathways. 3 AS-based clusters were identified and found to have different prognoses and unique immune features. Finally, MBNL1 was identified as a hub SF, and it was shown to inhibit proliferation and metastasis, promote apoptosis, and block cells in G2/M phase in 786O and A498 cells. Mechanistically, MBNL1 regulates QKI expression through AS.
Conclusion
The prognostic risk model constructed base on immune-related AS events has good predictive ability for ccRCC. The hub SF MBNL1 identied in the present study could inhibit the progression of ccRCC. This effect is likely due to the regulation of QKI expression through AS.
Keywords
Introduction
Renal cell carcinoma (RCC) is one of the most common urological neoplasms, whose annual morbidity and mortality are increasing worldwide. 1 It is estimated that more than 403,000 new cases of RCC and 175,000 deaths worldwide per year. 2 Pathologically, clear cell renal cell carcinoma (ccRCC) accounts for the highest proportion of RCC, about 75%, and is the most common cause of cancer-related deaths.3,4 Due to the occult onset of RCC, many patients have been diagnosed in advanced stage, missed the opportunity of operation. 4 With the exception of the widely approved drug - sunitinib, limited treatment options for advanced RCC results in a poor prognosis with a 5-year survival rate of less than 10% and a median survival of about one year.4–7 New research showed that the emergence of immunotherapy held great promise for the treatment of kidney cancer, changing the traditional treatment pattern.8,9 However, sustained responses were found difficult to achieve,8,10,11 leading us to wonder whether there may be some inhibitory mechanism between tumor microenvironments that reverses the effects of immunotherapy and helps tumors evade immune surveillance.
Tumor immune microenvironment (TIME) is a complex environment composed of tumor cells, immune cells, stromal cells and other components, as a hotbed for tumorigenesis, which also play an important role in tumor growth and evolution. 12 Previous studies had shown that cytotoxic CD8+ T cells and CD4+ helper T cells can act on antigenic tumor cells to exert anti-tumor effects and prolong the outcome of many tumors, including RCC.13–15 On the contrary, some studies reported that the prognosis of RCC is negatively correlated with the number of intracellular CD8+ T cells. 16 Consistent with this, the recruitment of CD4+ T cells in TIME was found also exhibit cancer-promoting effects via TGFβ1/YBX1/-HIF2α signals. 17 Besides, Li et al. commented that TME can exert metabolic stress on immune cell infiltration, resulting in local immunosuppression and limited anti-tumor immune recovery. 18 Considering the inherent heterogeneity and high antigenicity of the tumor microenvironment of ccRCC, we believe that further exploring the interaction between genes and cells of TME is very necessary to help break through the bottleneck of immunotherapy of renal cell carcinoma.
The alternative splicing that occurs during RNA splicing procedure, regulated by splicing factors (SFs), takes many different patterns, such as Exon Skip (ES), Mutually Exclusive Exons (ME), Retained Intron (RI), Alternate Promoter (AP), Alternate Terminator (AT), Alternate Donor site (AD), and Alternate Acceptor site (AA), leading to biodiversity at both the RNA and protein levels.19–21 Remarkably, alternative splicing is involved in 95% of gene transcription process in human, and uncontrolled splicing, such as abnormal expression and / or mutation of SFs, often leads to a series of diseases and even cancer.22–25 Previous studies had shown that AS events were associated with tumorgenesis, progression, and prognosis of ccRCC, and its splicing regulatory network had hidden the potential genetic mechanism of ccRCC, which proved the references of AS-related targets for RCC.26–29 In addition, some research had proved that tumor-specific splice may produce a new class of tumor-specific neoantigens with strong immunogenicity and induce the production of anti-tumor immunity. 30 while, it may also cause changes in the biological phenotype of tumor cells due to functional dysfunction to evade the immune surveillance of the host. 31 However, studies on the exploration of AS events and TIME in ccRCC are still few but needed.
In the present study, the transcriptional data and clinicopathological information of patients with ccRCC in The Cancer Genome Atlas (TCGA) database were extracted and integrated. ESTIMATE algorithm was applied to calculate the immune and stromal score of patients and the differentially expressed AS events and differentially expressed SFs were identified. Then the relationship between AS events and survival status, TIME features, biological process, clinicopathological variables and SFs were further investigated. Collectively, our study enriched the research content of the relationship between AS events and TIME of ccRCC, which provided a theoretical basis for the further exploration of immunotherapy and clinical prediction and treatment of ccRCC.
Methods
Data collection
The transcriptional data of 515 ccRCC patients were obtained from TCGA data portal (https://tcga-data.nci.nih.gov/tcga/). Meanwhile, the data of AS events were downloaded from the TCGA SpliceSeq database. A Percent Spliced In (PSI) result of 0–1 is considered as a quantify event. 32 Then a threshold value of screening (sample percentage with PSI value of 75 and average PSI value of 0.05) was set to screen out suitable AS events included in consequent analyses. Besides, 52 human SFs were obtained from the SpliceAid 2 database. 33 What's more, the relevant clinicopathological information were also collected from TCGA database, in which the OS of all patients were greater than 30 days.
Calculation and survival difference of immune and stromal scores
ESTIMATE algorithm was utilized to calculate immune and stromal scores based on the mRNA expression data. 34 According to the above results, 515 patients with ccRCC were divided into high/low immune-score/stromal-score groups by using the median as the cutoff value. Then, Kaplan-Meier curves were plotted to show the survival difference between each group.
Identification of differentially expressed as events (DEASs) and functional enrichment analysis
To screen out the critical AS events that affect survival, we performed differential analysis with a pre-set conditions of /logFC/>0 and FDR < 0.01. Heatmaps and volcano plots were constructed using the pheatmap and ggplot2 package, respectively. Consequently, Venn plot were used to present DEASs, which were the intersection AS events that simultaneously upregulated or downregulated in high/low immune-score/stromal-score groups. Furthermore, functional enrichment analysis of DEASs was employed to evaluate the potential function and biological process from the Kyoto Encyclopedia of Genes and Genomes (KEGG) pathways and the Gene Ontology (GO) terms including the cellular component (CC), biological process (BP), and molecular function (MF) categories.
Construction of prognostic signatures models
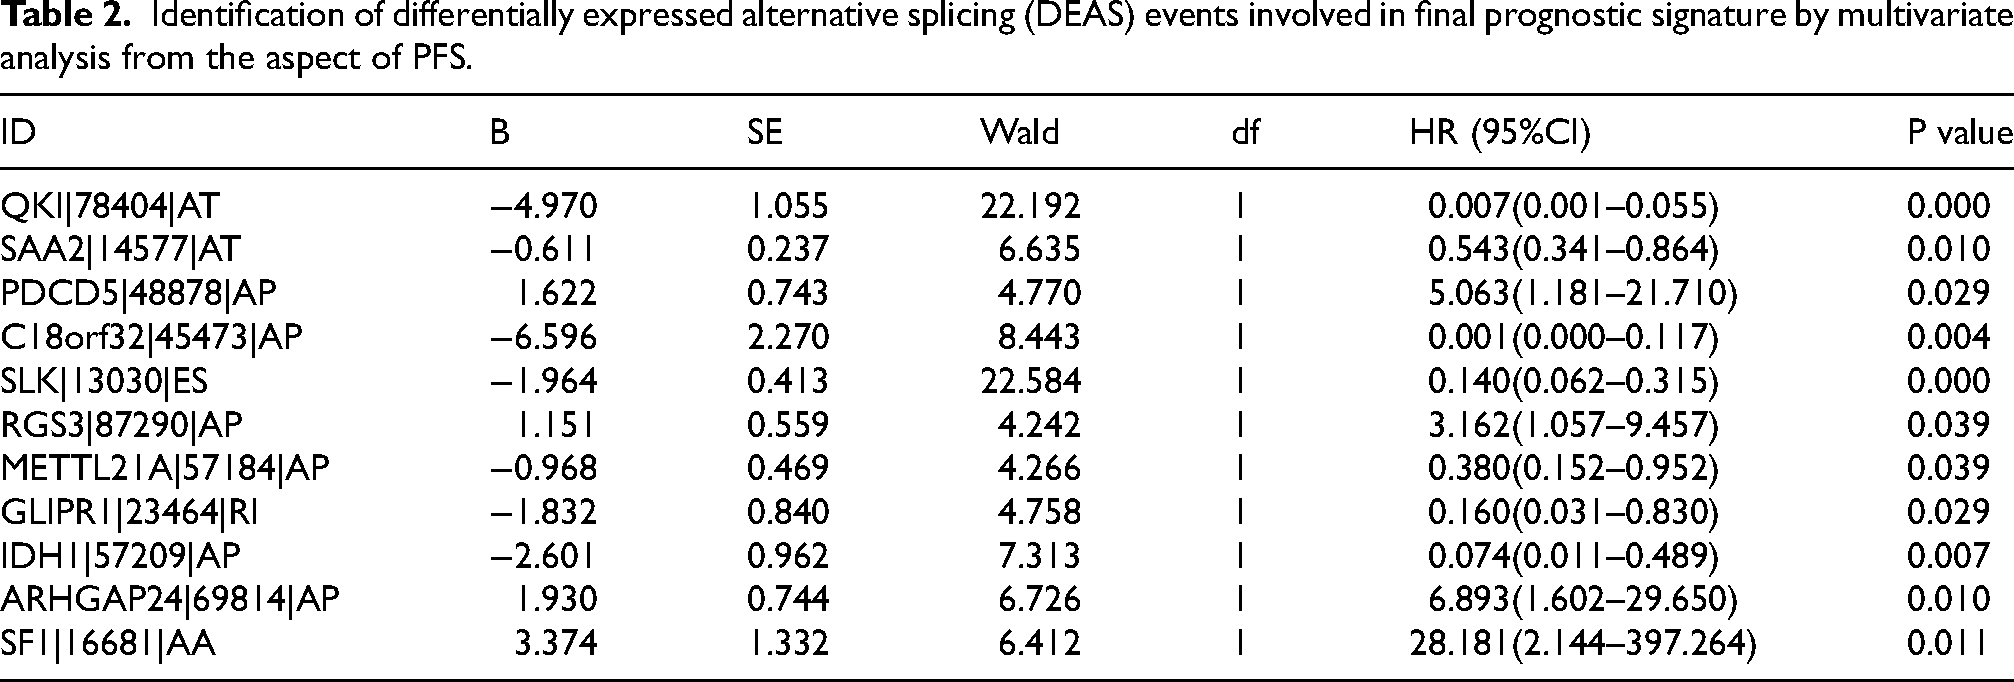
In order to investigate the prognostic role of the DEASs in ccRCC outcome, the univariate Cox regression analysis was employed to preliminarily identify the overall survival (OS)-related and progression-free survival (PFS)-related DEASs. The least absolute shrinkage and selection operator (LASSO) regression was then applied to reduce variables with non-zero coefficients to make the final models simplest statistically.
35
LASSO regression analysis was used to screen the variables based on a 10-fold cross-validation. Additionally, the multivariate Cox regression analysis was utilized to confirm the DEASs involved in final prognostic signatures, namely OS-related signature and PFS-related signature. The risk score formula was established by the results of the multivariate Cox regression analysis, then risk scores of ccRCC patients were generated. The risk score formula was as follow:
Validation of the independence of prognostic signatures models
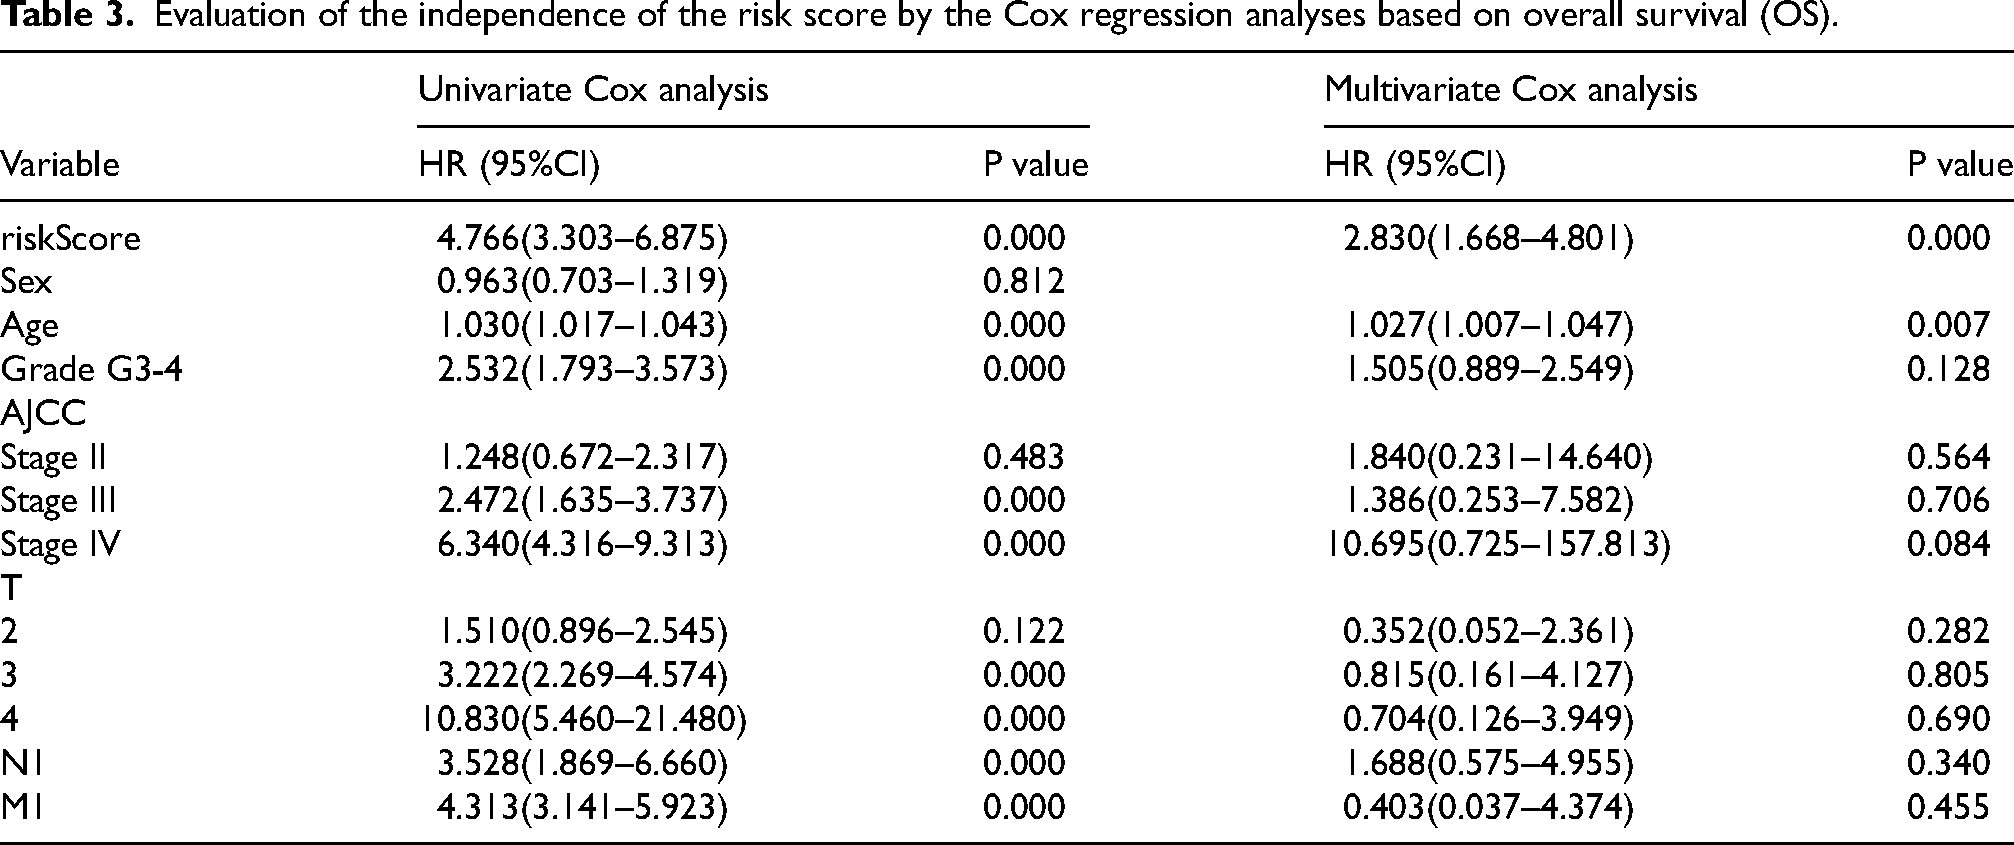
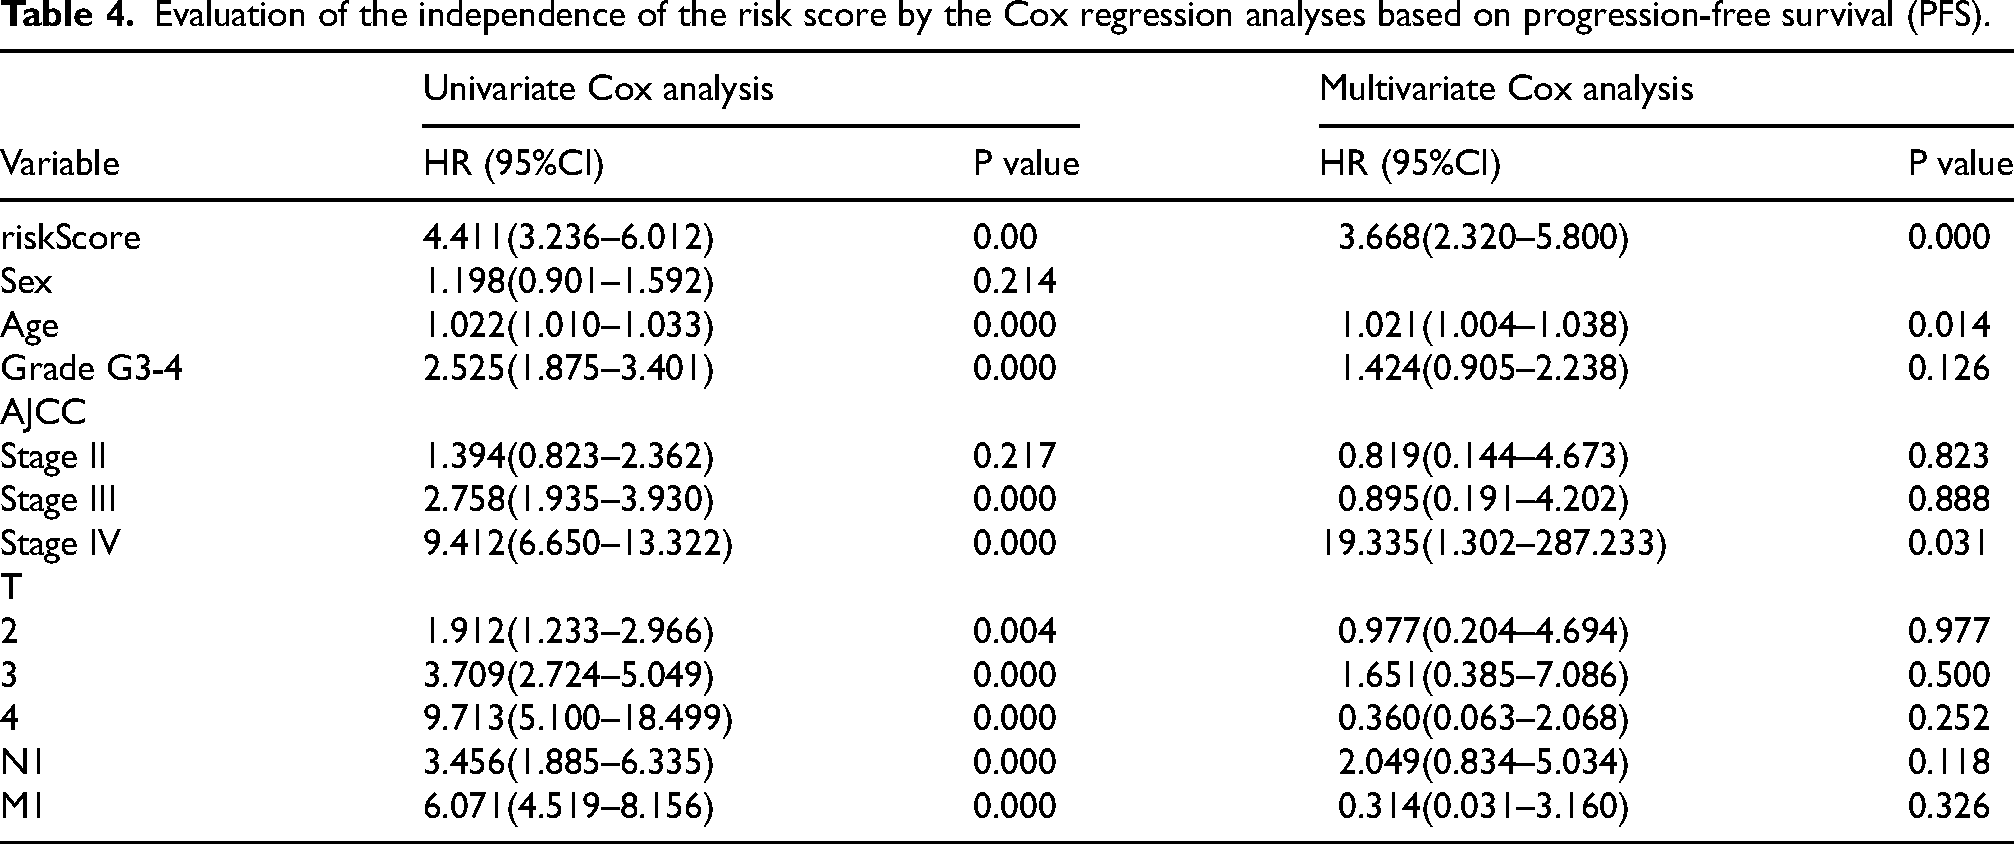
We integrated corresponding clinical information included Sex, Age, Grade, AJCC Stage, T Stage, N Stage, M Stage and risk score to explore the independent factors by univariate and multivariate Cox regression analyses. The analyses were only based on OS and PFS.
Exhibition of microscopic profile of immune infiltration
To explore the influence of DEASs on the formation and layout of TIME of ccRCC patients, we further performed the hierarchical consensus clustering to classify the ccRCC cohort in an unbiased and unsupervised manner with the support of ConsensusClusterPlus package. 36 In the present study, the clustering settings were as follows: maxK = 3; reps = 50; pItem = 0.8; pFeature = 1; title = workDir; clusterAlg = "km”; distance = "euclidean”; seed = 888. The optimal number of clusters was selected according to the Elbow method and the Gap statistic. The association between clusters and clinical survival was analyzed. Additionally, Gene Set Variation Analysis (GSVA) enrichment analysis were applied to shed light on the difference in biological process between clusters by using “GSVA” packages. 37 Furthermore, single-sample Gene-Set Enrichment Analysis (ssGSEA) algorithm was used to calculate the cell infiltration in the TIME of ccRCC, with the aim of exploring the immunological explanation of the survival difference.
Identification of differentially expressed SFs (DESFs) and intersection SFs
It has gradually become a consensus that the dysregulation of AS events were conducted by some SFs, whose influence on tumorigenesis cannot be ignored.38,39 Differential analysis with a condition of /logFC/>0 and FDR < 0.01 was performed to pick out differentially expressed SFs (DESFs) for subsequent research. Heatmaps and volcano plots were constructed using the pheatmap and ggplot2 package, respectively. Collectively, intersection SFs that were simultaneously upregulated or downregulated in high/low immune-score/stromal-score groups were screened out, which were exhibited using Venn plot.
Correlation analysis between survival-related as events and intersection SFs
Based on the result of multivariate Cox regression analysis of OS and PFS, we gained the relationship between AS events and survival. Next, Spearman correlation analysis between survival-related AS events and intersection SFs was carried out. What's more, the SF-AS regulatory network was constructed among the significant correlation pairs by Cytoscape (version 3.6.1).
Cell line and transfection
Renal clear cell cancer cell lines 786O and A498 were purchased from ATCC. The ORF of MBNL1 was inserted into the pcDNA3.1 (+) vector after PCR amplification, while an untreated pcDNA3.1 (+) vector was used as a control. Lipofectamine 2000 (Invitrogen) was used for plasmid transfection. Stable transfected cell lines were established by G418 screening. The ectopic expression of MBNL1 in transfected cells of the treatment group was verified by RT-qPCR and Western blot.
qRT-PCR and Western blot
The concentration and purity of RNA and protein were determined after extraction. Reverse Transcription of RNA into cDNA was performed by using Reverse Transcription System (Promega). The diluted cDNA was detected by using the primers of target genes (Supplementary Table 1). Western blot of the protein was performed as follows: after electrophoresis, membrane transfer and sealing, the protein bands were incubated overnight with primary antibodies at 4°C. The primary antibodies used were MBNL1 (66837-1-ig, Proteintech), GAPDH (SC-47724, Santa). The membrane was washed with washing buffer solution (TBST) for 3 times. After washing, a secondary antibody (BL001A, Biosharp) was added and incubated for 1 h. Then the membrane was washed by TBST for 3 times, and the electrochemical luminescence was used for detection. Finally, the membrane was scanned and analyzed on the Gel Imager System.
Cell proliferation, Transwell migration and invasion assay, cell cycle and apoptosis
Stably transfected Cell lines of 786O and A498 were cultured in 96-well plates, about 2000 cells were transferred to each well. Cell Counting Kit-8 (CCK-8, Beyotime) was utilized for dectection. The absorbance of each well at 450 nm was measured to assess the cell proliferation capability. Transwell chambers (3422, Corning) were placed in the wells of 24-well plate which were filled with culture medium containing serum. The lower chamber was immersed in the culture medium, and cell suspension with the serum-free medium was transferred to the upper chamber. After 48 h, 4% paraformaldehyde (Biosharp) was used to fix the cells on the lower chamber, stained with crystal violet, and counted by a microscope. Flow cytometry (FACSCalibur Instrument and CELLQUEST Software, Becton Dickinson) was used for analysis of cell cycle and apoptosis. In cell cycle experiment, cells were fixed with 70% ice ethanol, treated with RNase A (Sigma), and stained with Propidium iodide (PI, BD Pharmingen). In cell apoptosis experiment, annexin V-fluorescein isothiocyanate (BD Pharmingen) and PI were used for cells staining. The proportions of cells distributed in each cell cycle and the apoptotic cells were calculated.
RNA immunoprecipitation (RIP)
According to the manufacturer's protocol, the RIP assay was conducted using the RIP Kit and Protein A/G Magnetic Beads (FI8709-12 T, FitGene). Cells were lysed and the lysate was incubated for 30 min. The lysate was then divided into three fractions: Input, IgG control, and immunoprecipitation (IP) groups. A total of 5μg IgG and MBNL1 antibodies (ab309348, Abcam) were added to the IgG and IP groups, respectively, and the mixtures were incubated at 4°C overnight. The following day, 40 µL of Protein A/G Magnetic Beads were added to both the IgG and IP groups and incubated at 4°C for an additional 2 h. The beads were collected and washed twice. Subsequently, the RNA-protein complexes bound to the magnetic beads were eluted, and RNA was extracted and purified using Trizol, chloroform, and isoamyl alcohol. The expression levels of the target genes were quantified by qRT-PCR.
Statistical analysis
R software 3.6.1 was used to implement statistical analysis of the whole study. The UpSet plot was generated by UpSetR (version 1.3.3) to visualize the intersections between the seven types of AS events. 40 In the statistical process, p value < 0.05 (Two side) was seen as statistically significant.
Result
Relationship between immune/stromal scores and the prognosis of ccRCC, identification and functional enrichment analysis of DEASs
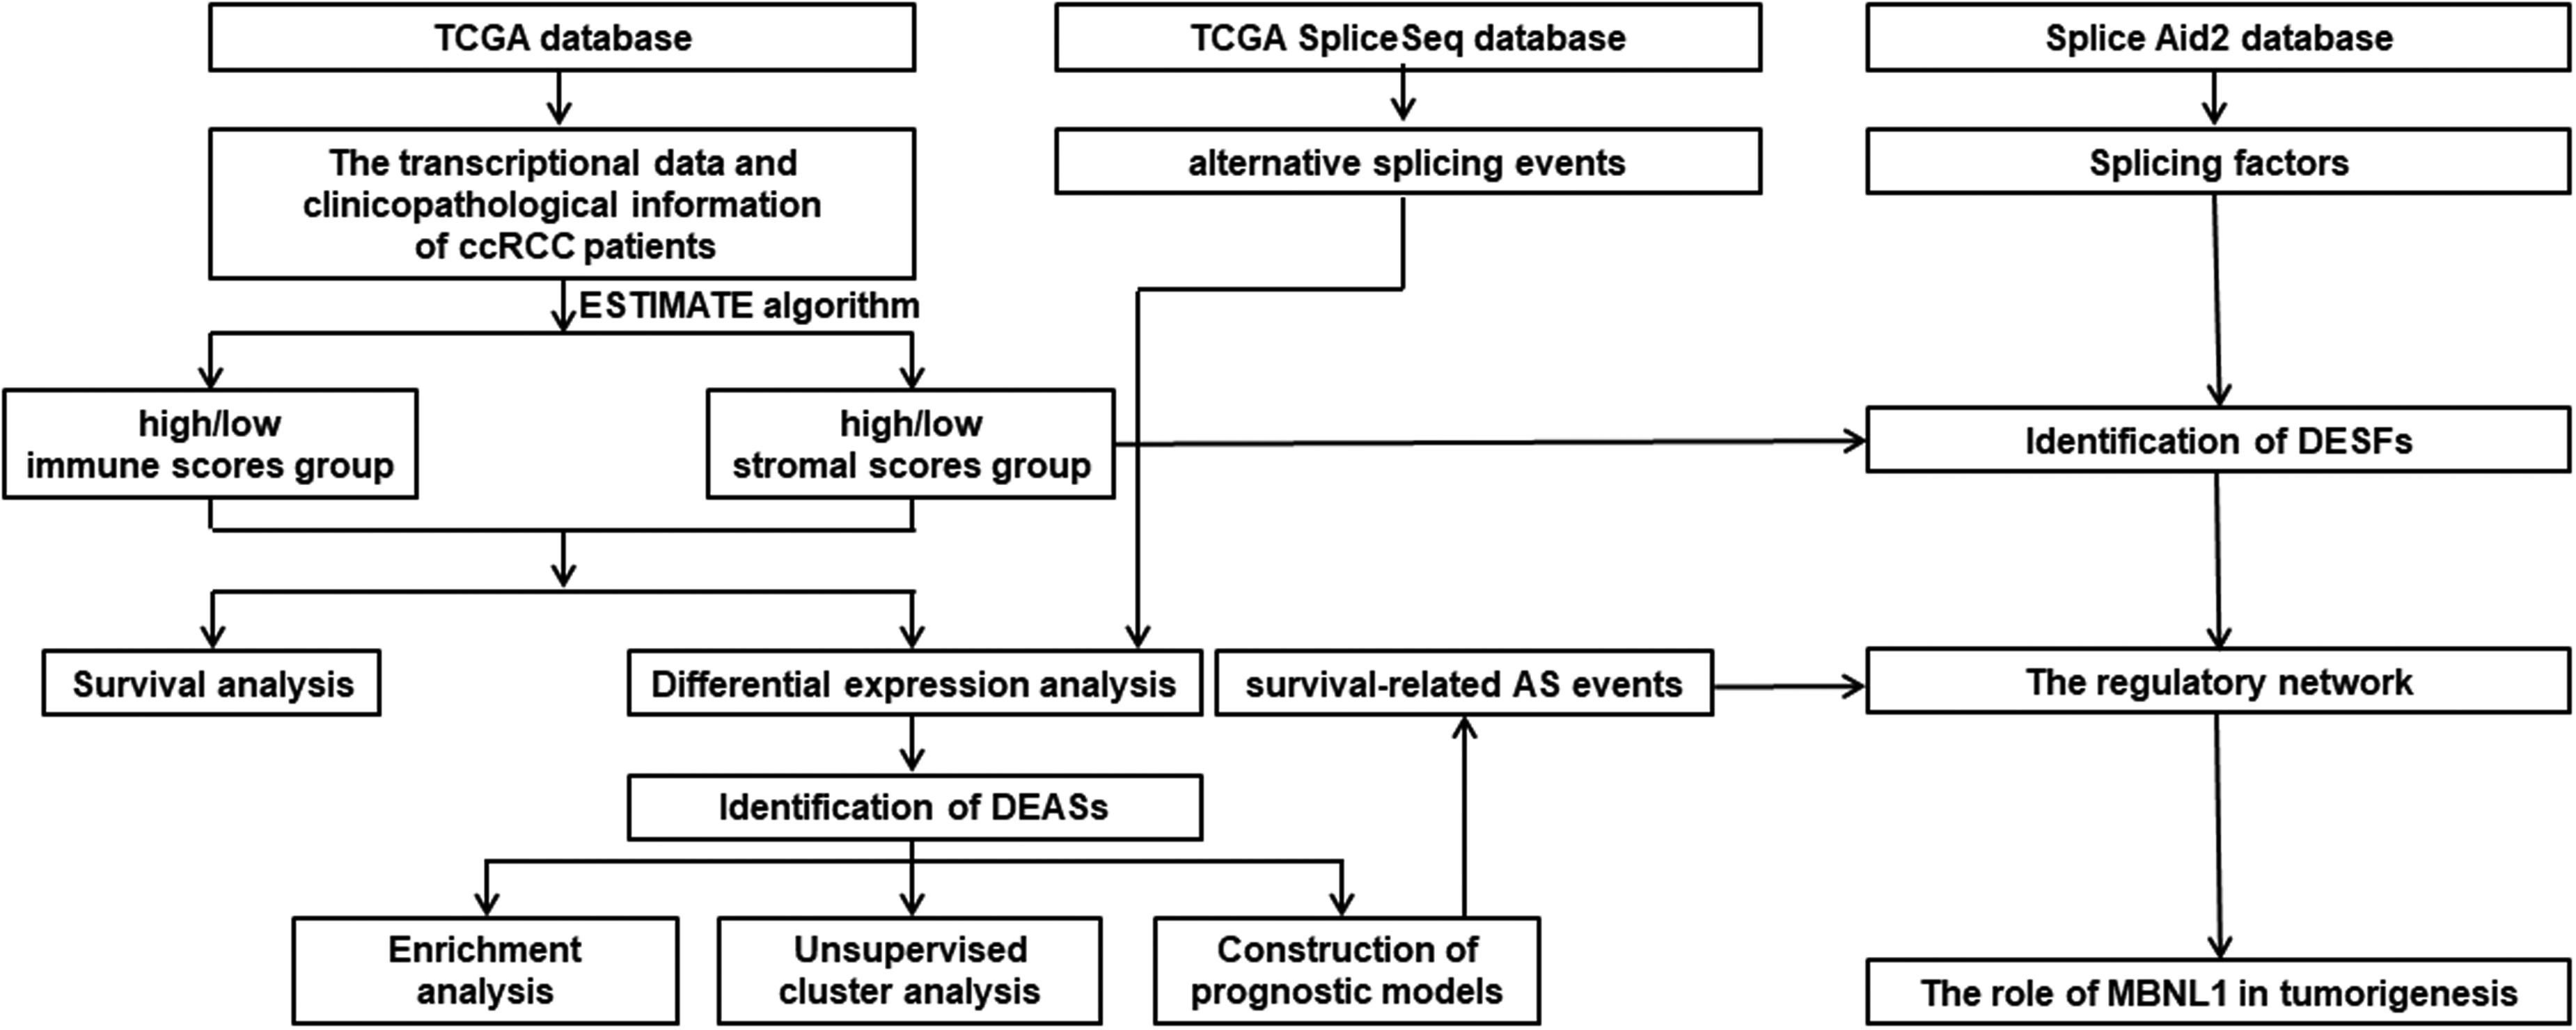
Details of the present study design were illustrated in Figure 1 as a flowchart. A total of 515 patients with ccRCC from TCGA database were included in the present study. By the calculation of ESTIMATE algorithm, immune scores and stromal scores of patients ranged from −687.33 to 3339.36, and −1428.66 to 1976.04, respectively. The patients with ccRCC were divided into high and low score group by immune-score and stromal-score system. Kaplan-Meier curves displayed patients with low immune-score presented longer OS than high immune-score (Figure 2A). Meanwhile, it was worth mentioning that the low immune-score group also seemed to have a tendency to survive longer in PFS than the immune-high score group. Both OS and PFS of the low stromal-score group seemed to be longer than those of the high stromal-score group, although there was no statistical significance (Figure 2B to D). These results proved to some extent that immune/stromal score were related to the survival of ccRCC, which was worthy of further data mining.
The workflow of the study.
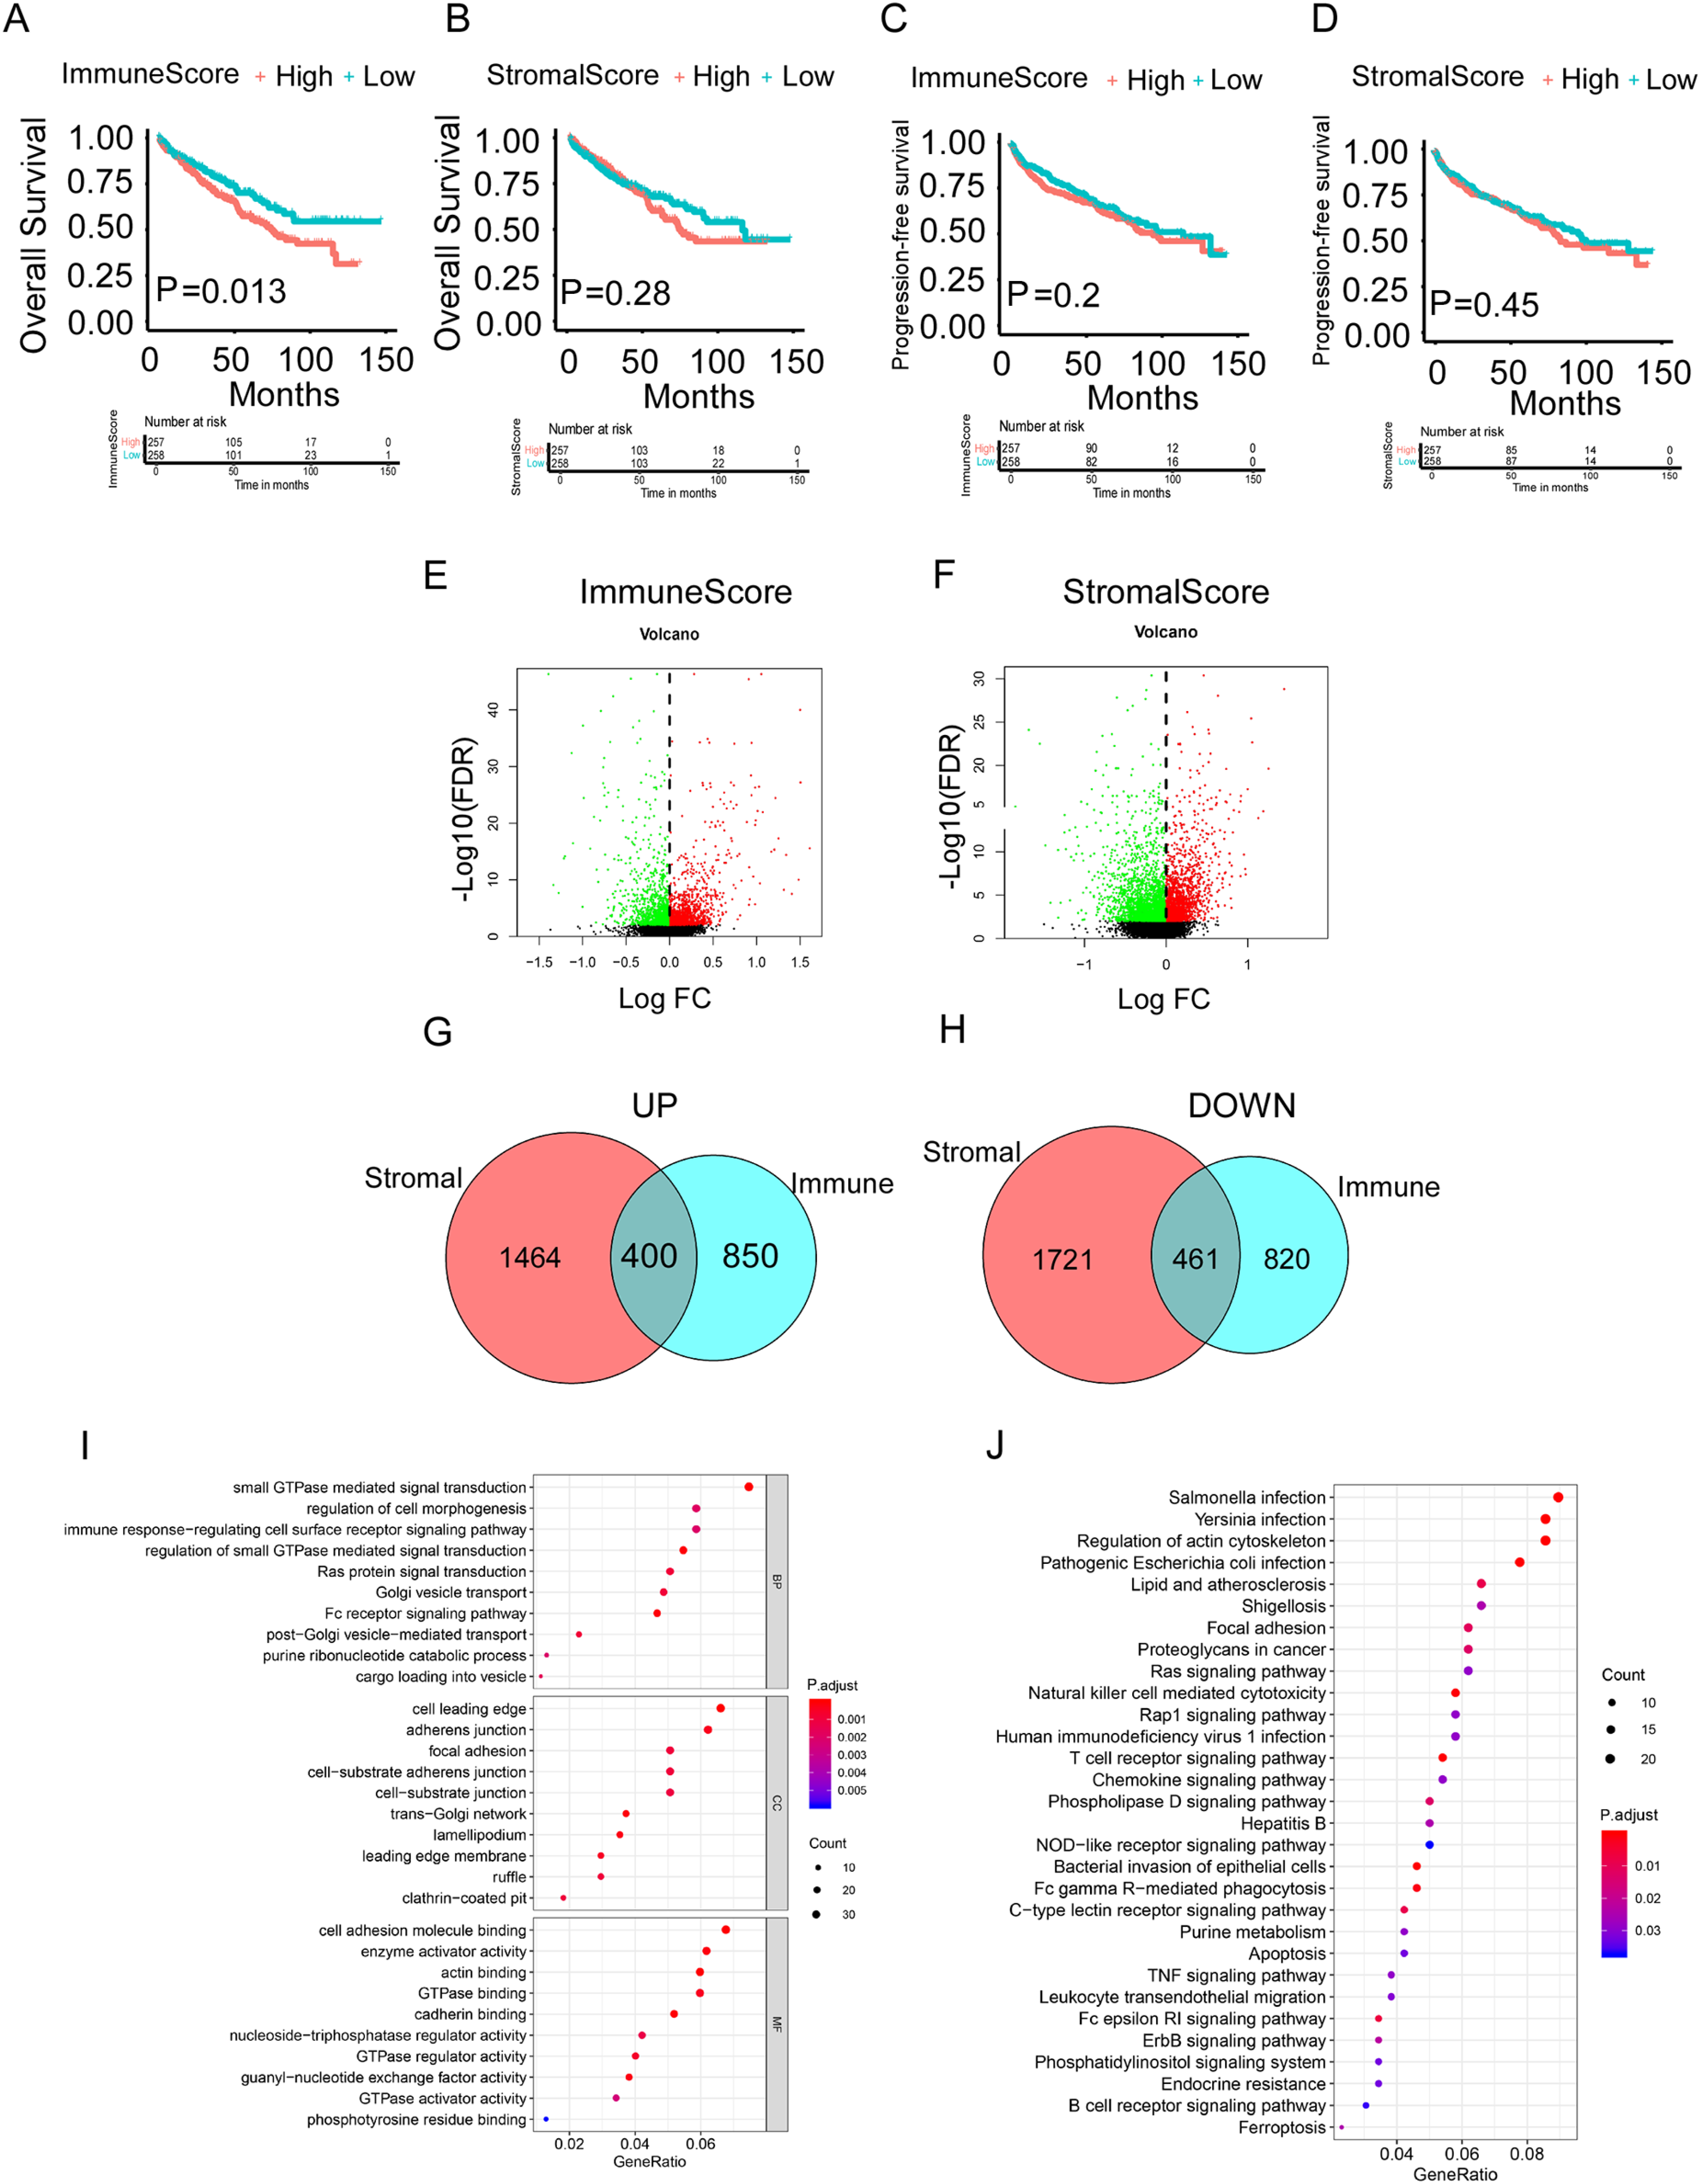
Survival analysis of immune/stromal score groups and identification of differentially expressed AS events (DEASs) in ccRCC. (A) The Kaplan–Meier curve of Immune Score for OS. (B) The Kaplan–Meier curve of Immune Score for PFS. (C) The Kaplan–Meier curve of Stromal Score for OS. (D) The Kaplan–Meier curve of Stromal Score for PFS. (E) The volcano plot of AS events expression between the high immune scores group and low immune scores group. (F) The volcano plot of AS events expression between the high stromal scores group and low stromal scores group. (G) The Venn plot of AS events that were up-regulated in both immune and stromal groups. (H) The Venn plot of AS events that were down-regulated in both immune and stromal groups. (I) The GO analysis in the functional enrichment analysis of DEASs. (J) The KEGG analysis in the functional enrichment analysis of DEASs.
Considering that a gene may have multiple types of AS events, UpSet plot was used to show the intersection of each AS type, which was illustrated in Supplementary Figure 1. Subsequently, differential analysis of AS events expression was performed in the high and low score groups based on immune/stromal scores with the purpose of finding other explanations for survival difference. Specifically, the up-regulated and down-regulated AS events were generated when comparison of the differential immune-score/stromal-score group (Figure 2E and F). After process of identification, 400 up-regulated AS events and 461 down-regulated AS events were framed, as shown in Venn diagram, and selected as DEASs for subsequent study (Figure 2G and H).
In order to assess the potential function and biological process of DEAS events, GO and KEGG pathway analysis were carried out. We exhibited the top 30 results of KEGG pathway analysis incorporated with the top 10 results in BP, the top 10 results in CC and the top 10 results in MF (Figure 2I). Interestingly, we found that in addition to the enrichment of immune-related response, there were many metabolism-related pathways, particularly GTPase-related, such as “GTPase binding”, “GTPase regulator activity” and “GTPase activator activity”. The KEGG pathways demonstrated that these DEASs were associated with immune-related pathways, like “Natural killer cell mediated cytotoxicity”, “T cell receptor signaling pathway”, “Chemokine signaling pathway”, “NOD−like receptor signaling pathway”, “Fc gamma R−mediated phagocytosis”, “TNF signaling pathway”. Besides, some famous cancer-related pathways, such as “Ras signaling pathway”, “Apoptosis”, “ErbB signaling pathway” and “Ferroptosis”, were enriched (Figure 2J).
Establishment of two prognosis-related signatures
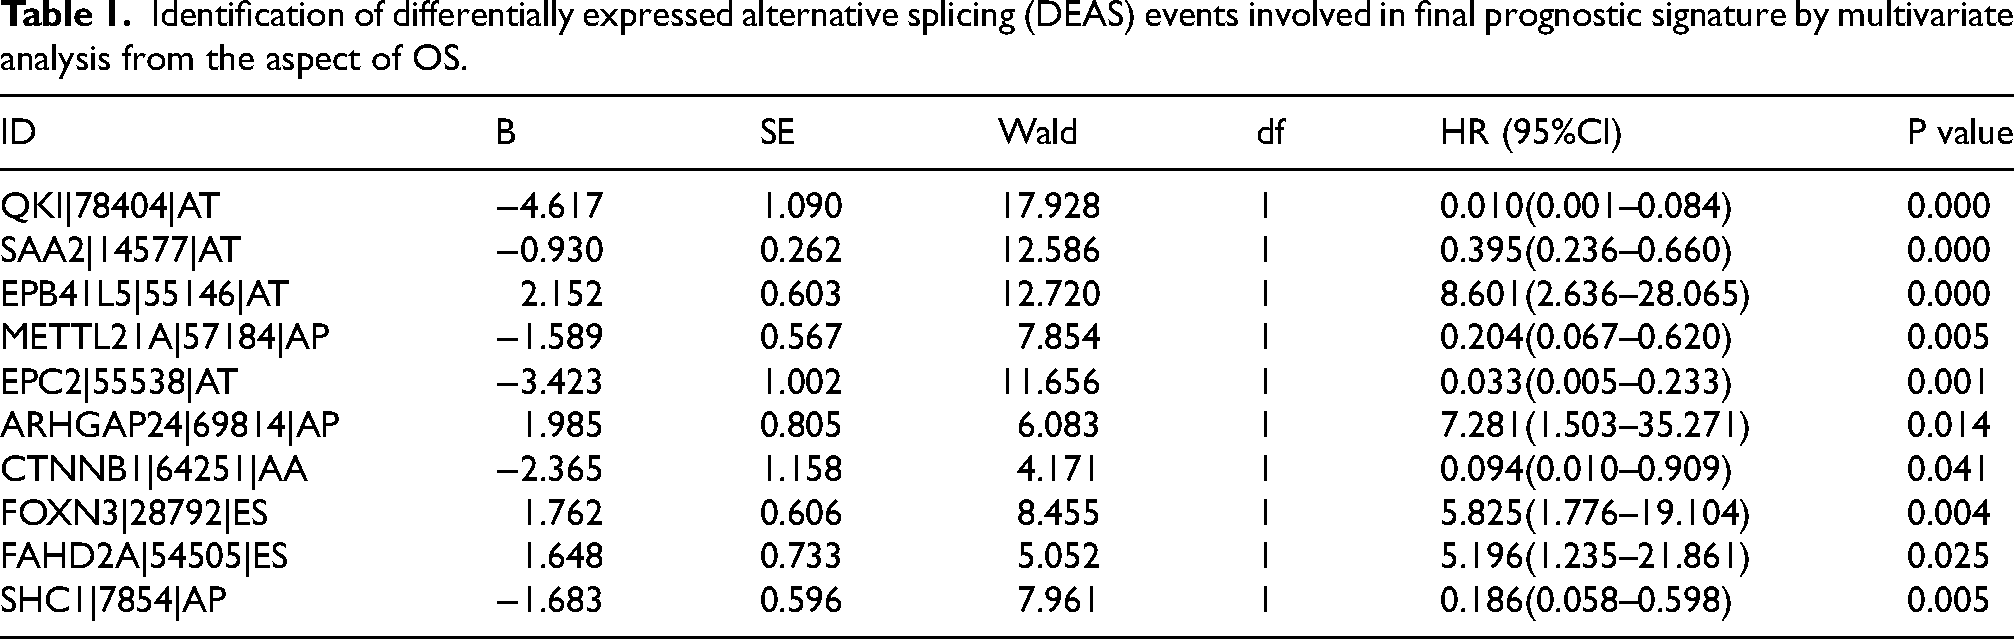
In order to identified survival-related DEASs, we next conducted the univariate Cox regression analysis to obtain target AS events in the perspective of OS and PFS. In total, 455 OS-related AS events and 464 PFS-related AS events were put into LASSO analysis to obtain the the most prognostic DEASs, respectively (Figure 3A to D). Subsequently, two prognosis-related signatures related to final models were constructed by multivariate Cox regression, namely OS-related signature and PFS-related signature (Tables 1 and 2). After the regression coefficients were determined, the formula of OS-related signature was listed as follow: risk score = QKI*-4.617+ SAA2*-0.930+ EPB41L5*2.152+ METTL21A*-1.589+ EPC2*-3.423+ ARHGAP24*1.985+ CTNNB1*-2.365+ FOXN3*1.762+ FAHD2A*1.648+ SHC1*-1.683. Similarly, PFS-related signature was as follow: risk score = QKI*-4.970+ SAA2*-0.611+ PDCD5*1.622+ C18orf32*-6.596+SLK*-1.964+ RGS3*1.151+ METTL21A*-0.968+ GLIPR1*-1.832+ IDH1*-2.601+ ARHGAP24*1.930+ SF1*3.374. The risk scores of 507 ccRCC patients with completed OS information and 505 ccRCC patients with completed PFS information were calculated. Bounded by the medium value, patients were split into high-risk and low-risk group. Kaplan-Meier curves reflected the fact that high-risk group had a shorter OS than the low-risk group, which was the same in the analysis of PFS (Figure 3E and F). Additionally, ROC curves were then drawn with the aim of validating the predictive capacity of these formulas. The AUC value of OS-related signature for 1-, 3-, and 5-year OS prediction ranged 0.787 from 0.812, and the AUC value of PFS-related signature for 1-, 3-, and 5-year PFS prediction were all above the level of 0.775, which presented satisfactory performances (Figure 3G and H).
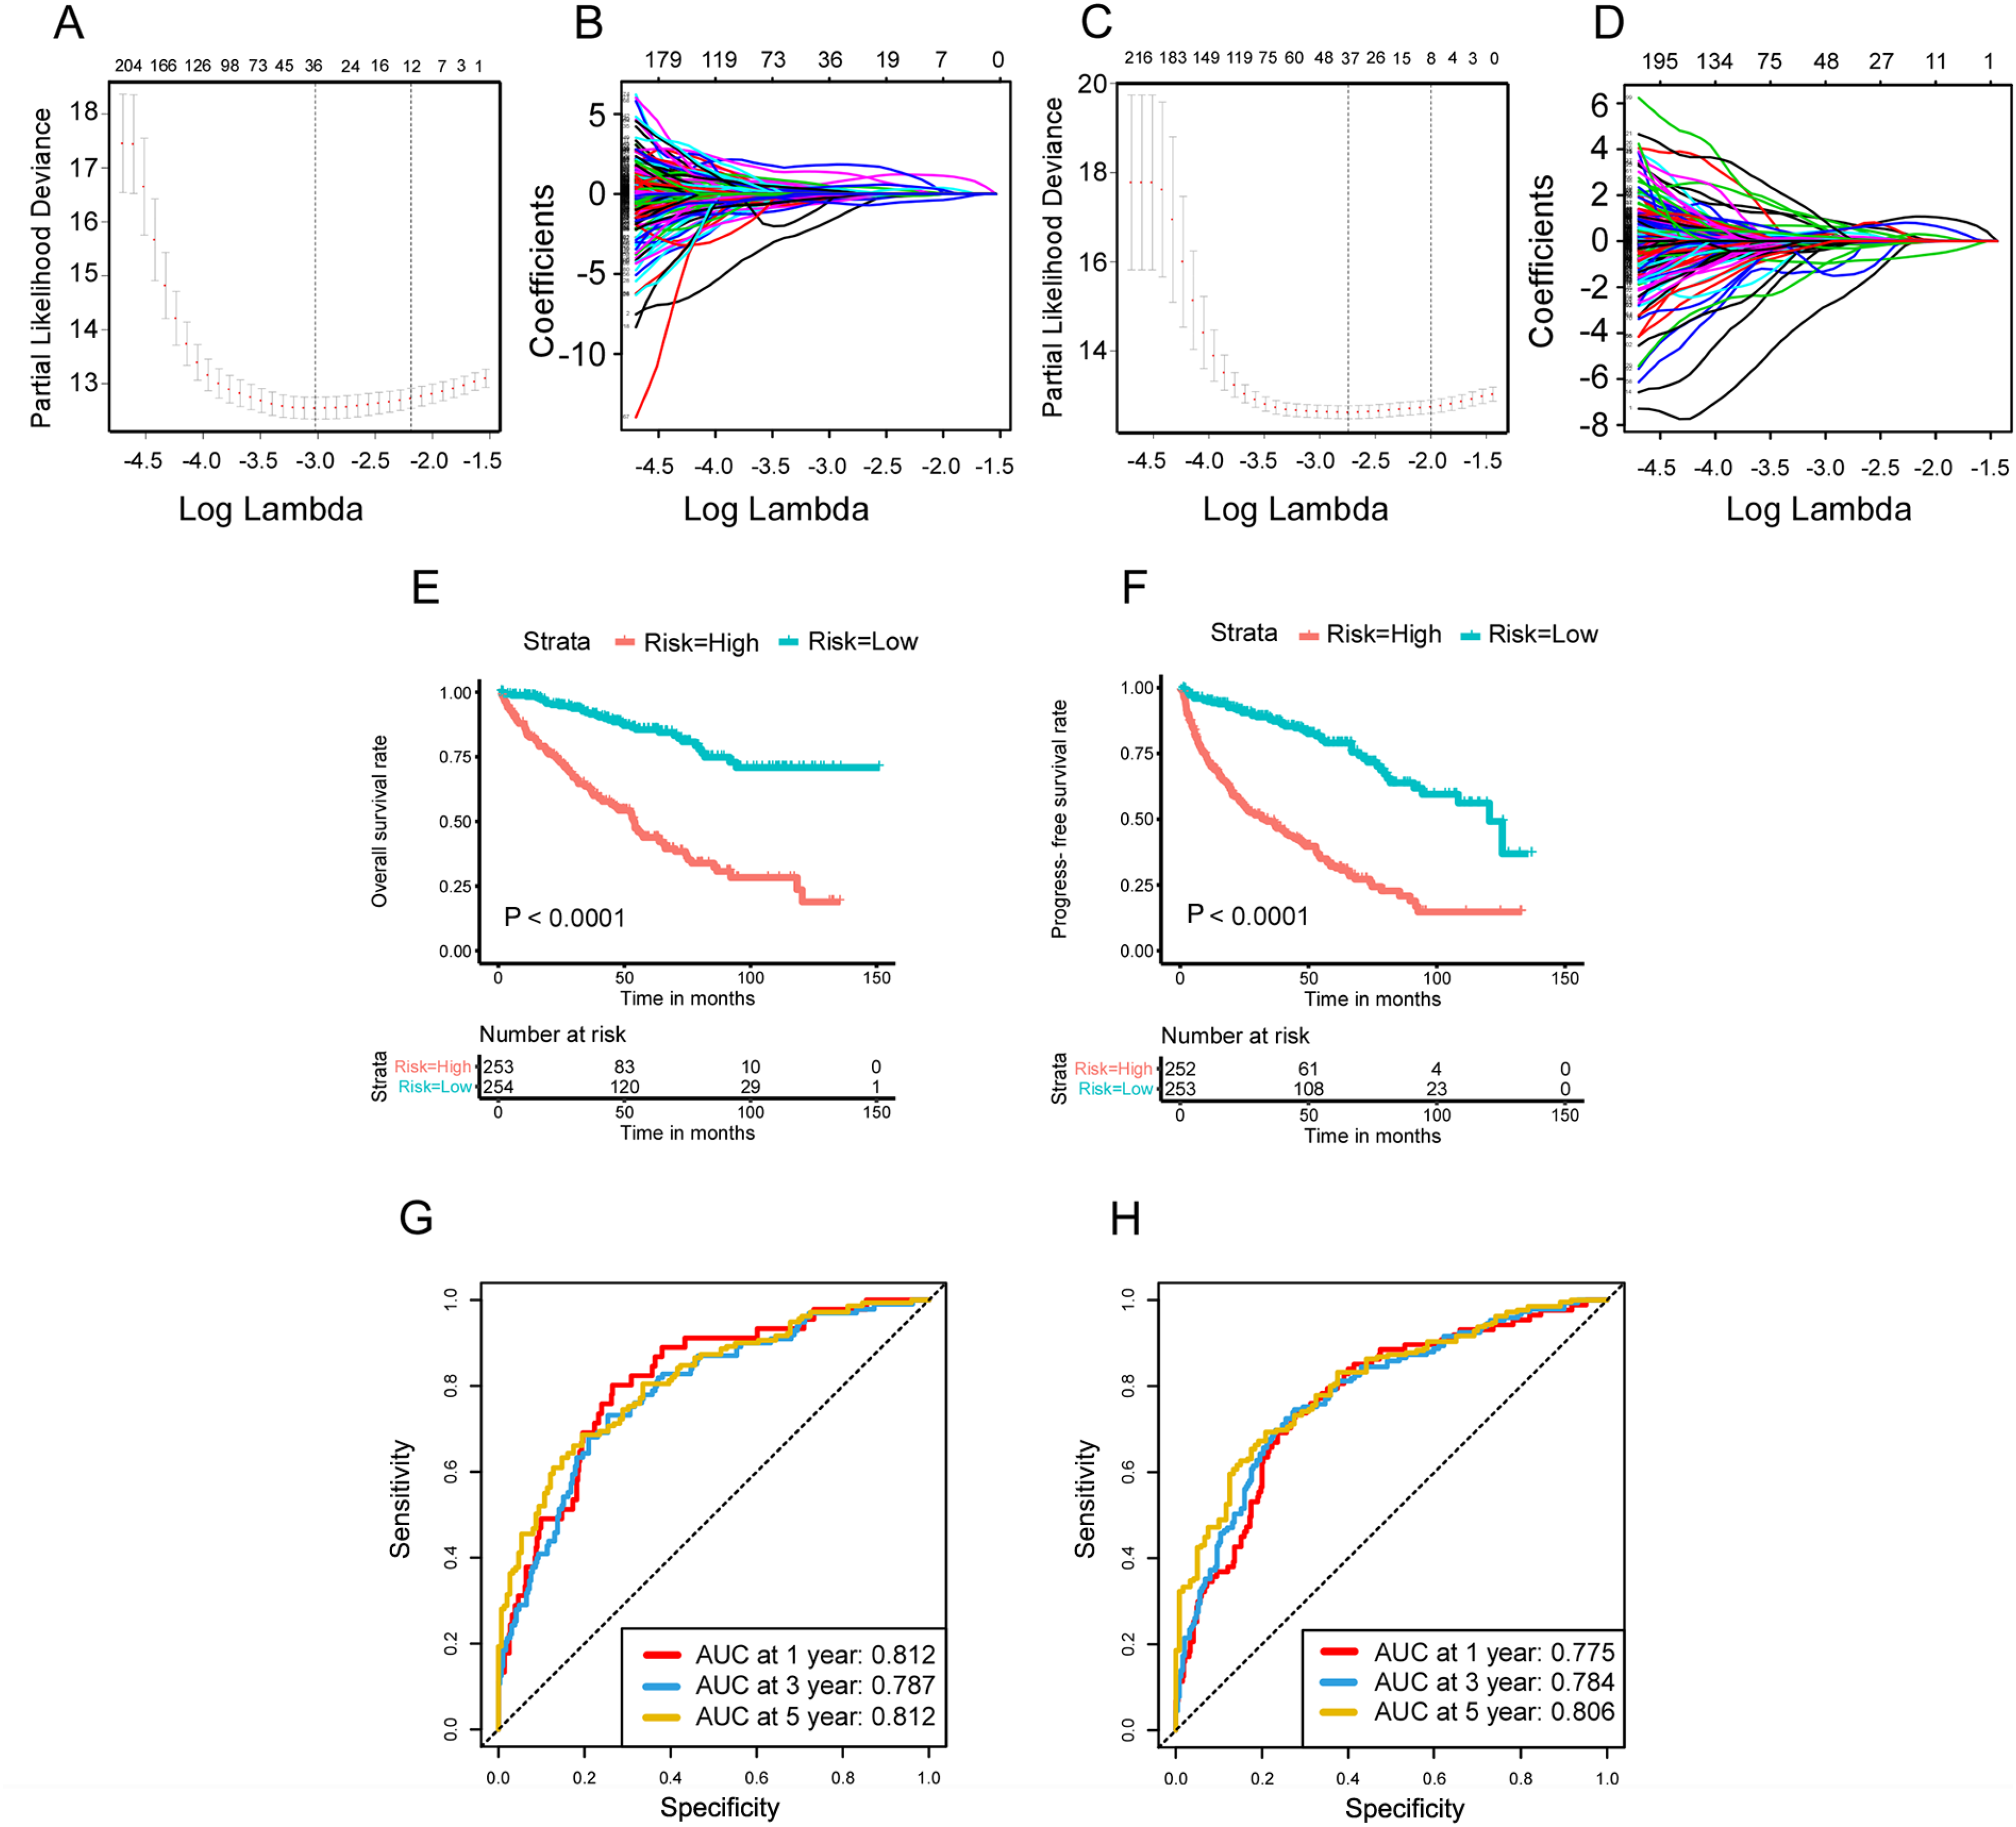
Prognostic analysis of risk prediction models from the aspects of OS and PFS. (A, B) LASSO coefficient profiles of the survival-related AS events with nonzero coefficients determined by the optimal lambda in basis of the results of OS. (C, D) Selection of optimal parameter (lambda) in the LASSO model, dotted vertical lines were drawn at the optimal values in basis of the results of PFS. (E) The Kaplan-Meier curve of OS in high-risk group and low-risk group. (F) The Kaplan-Meier curve of PFS in high-risk group and low-risk group. (G) The ROC curve for OS at 1, 3, and 5 years in the high- and low-risk group. (H) The ROC curve for PFS at 1, 3, and 5 years in the high- and low-risk group.
Identification of differentially expressed alternative splicing (DEAS) events involved in final prognostic signature by multivariate analysis from the aspect of OS.
Identification of differentially expressed alternative splicing (DEAS) events involved in final prognostic signature by multivariate analysis from the aspect of PFS.
Inspired by the strong predictive power of the prediction models, we wanted to know whether the risk score had the ability to predict independently. The univariate and multivariate Cox regression analysis were performed to explore the independent prognostic factors by combining relevant clinical information, such as Sex, Age, Grade, AJCC stage, T stage, N stage, M stage, with risk scores (Tables 3 and Table 4). Surprisingly, risk score was validated as an independent prognostic factor in both OS and PFS, independent of other clinical factors, which was consistent with the results of age.
Evaluation of the independence of the risk score by the Cox regression analyses based on overall survival (OS).
Evaluation of the independence of the risk score by the Cox regression analyses based on progression-free survival (PFS).
AS-based clusters significantly corelated with prognosis and immune features
Driven by the outcomes of enrichment analysis, the unsupervised consensus algorithm was performed to assess the impacts of AS events on TIME of ccRCC. We then classified the TCGA ccRCC patients into three clusters in the help of the consensus matrix heatmap, specifically, cluster A (n = 146, 27.8%), cluster B (n = 182, 35.9%) and cluster C (n = 179, 35.3%) (Figure 4A). What's more, Survival analysis revealed that different clusters kept different survival patterns. Obviously, cluster A was associated with the best prognosis, while cluster C tended to carry the poorest prognosis, either from the perspective of OS or PFS (Figure 4B and C). Through GSVA analysis between clusters, in contrast to cluster A, cluster B and cluster C were enriched more significantly in immune-related pathways, such as “T cell receptor signaling pathway”, “Chemokine signaling pathway”, et al. (Figure 4D and E). Additionally, cluster C were even enriched more significantly in immune-related pathways than cluster B, such as “Natural killer cell mediated cytotoxicity”, et al. (Figure 4F). Furthermore, the subsequent microscopic display of immune cell infiltration also showed that the immune infiltration level of cluster C was the highest, but that of cluster A was the lowest, whether it was immune activated cells or immunosuppressive cells, which was consistent with the previous conclusion (Figure 4G).
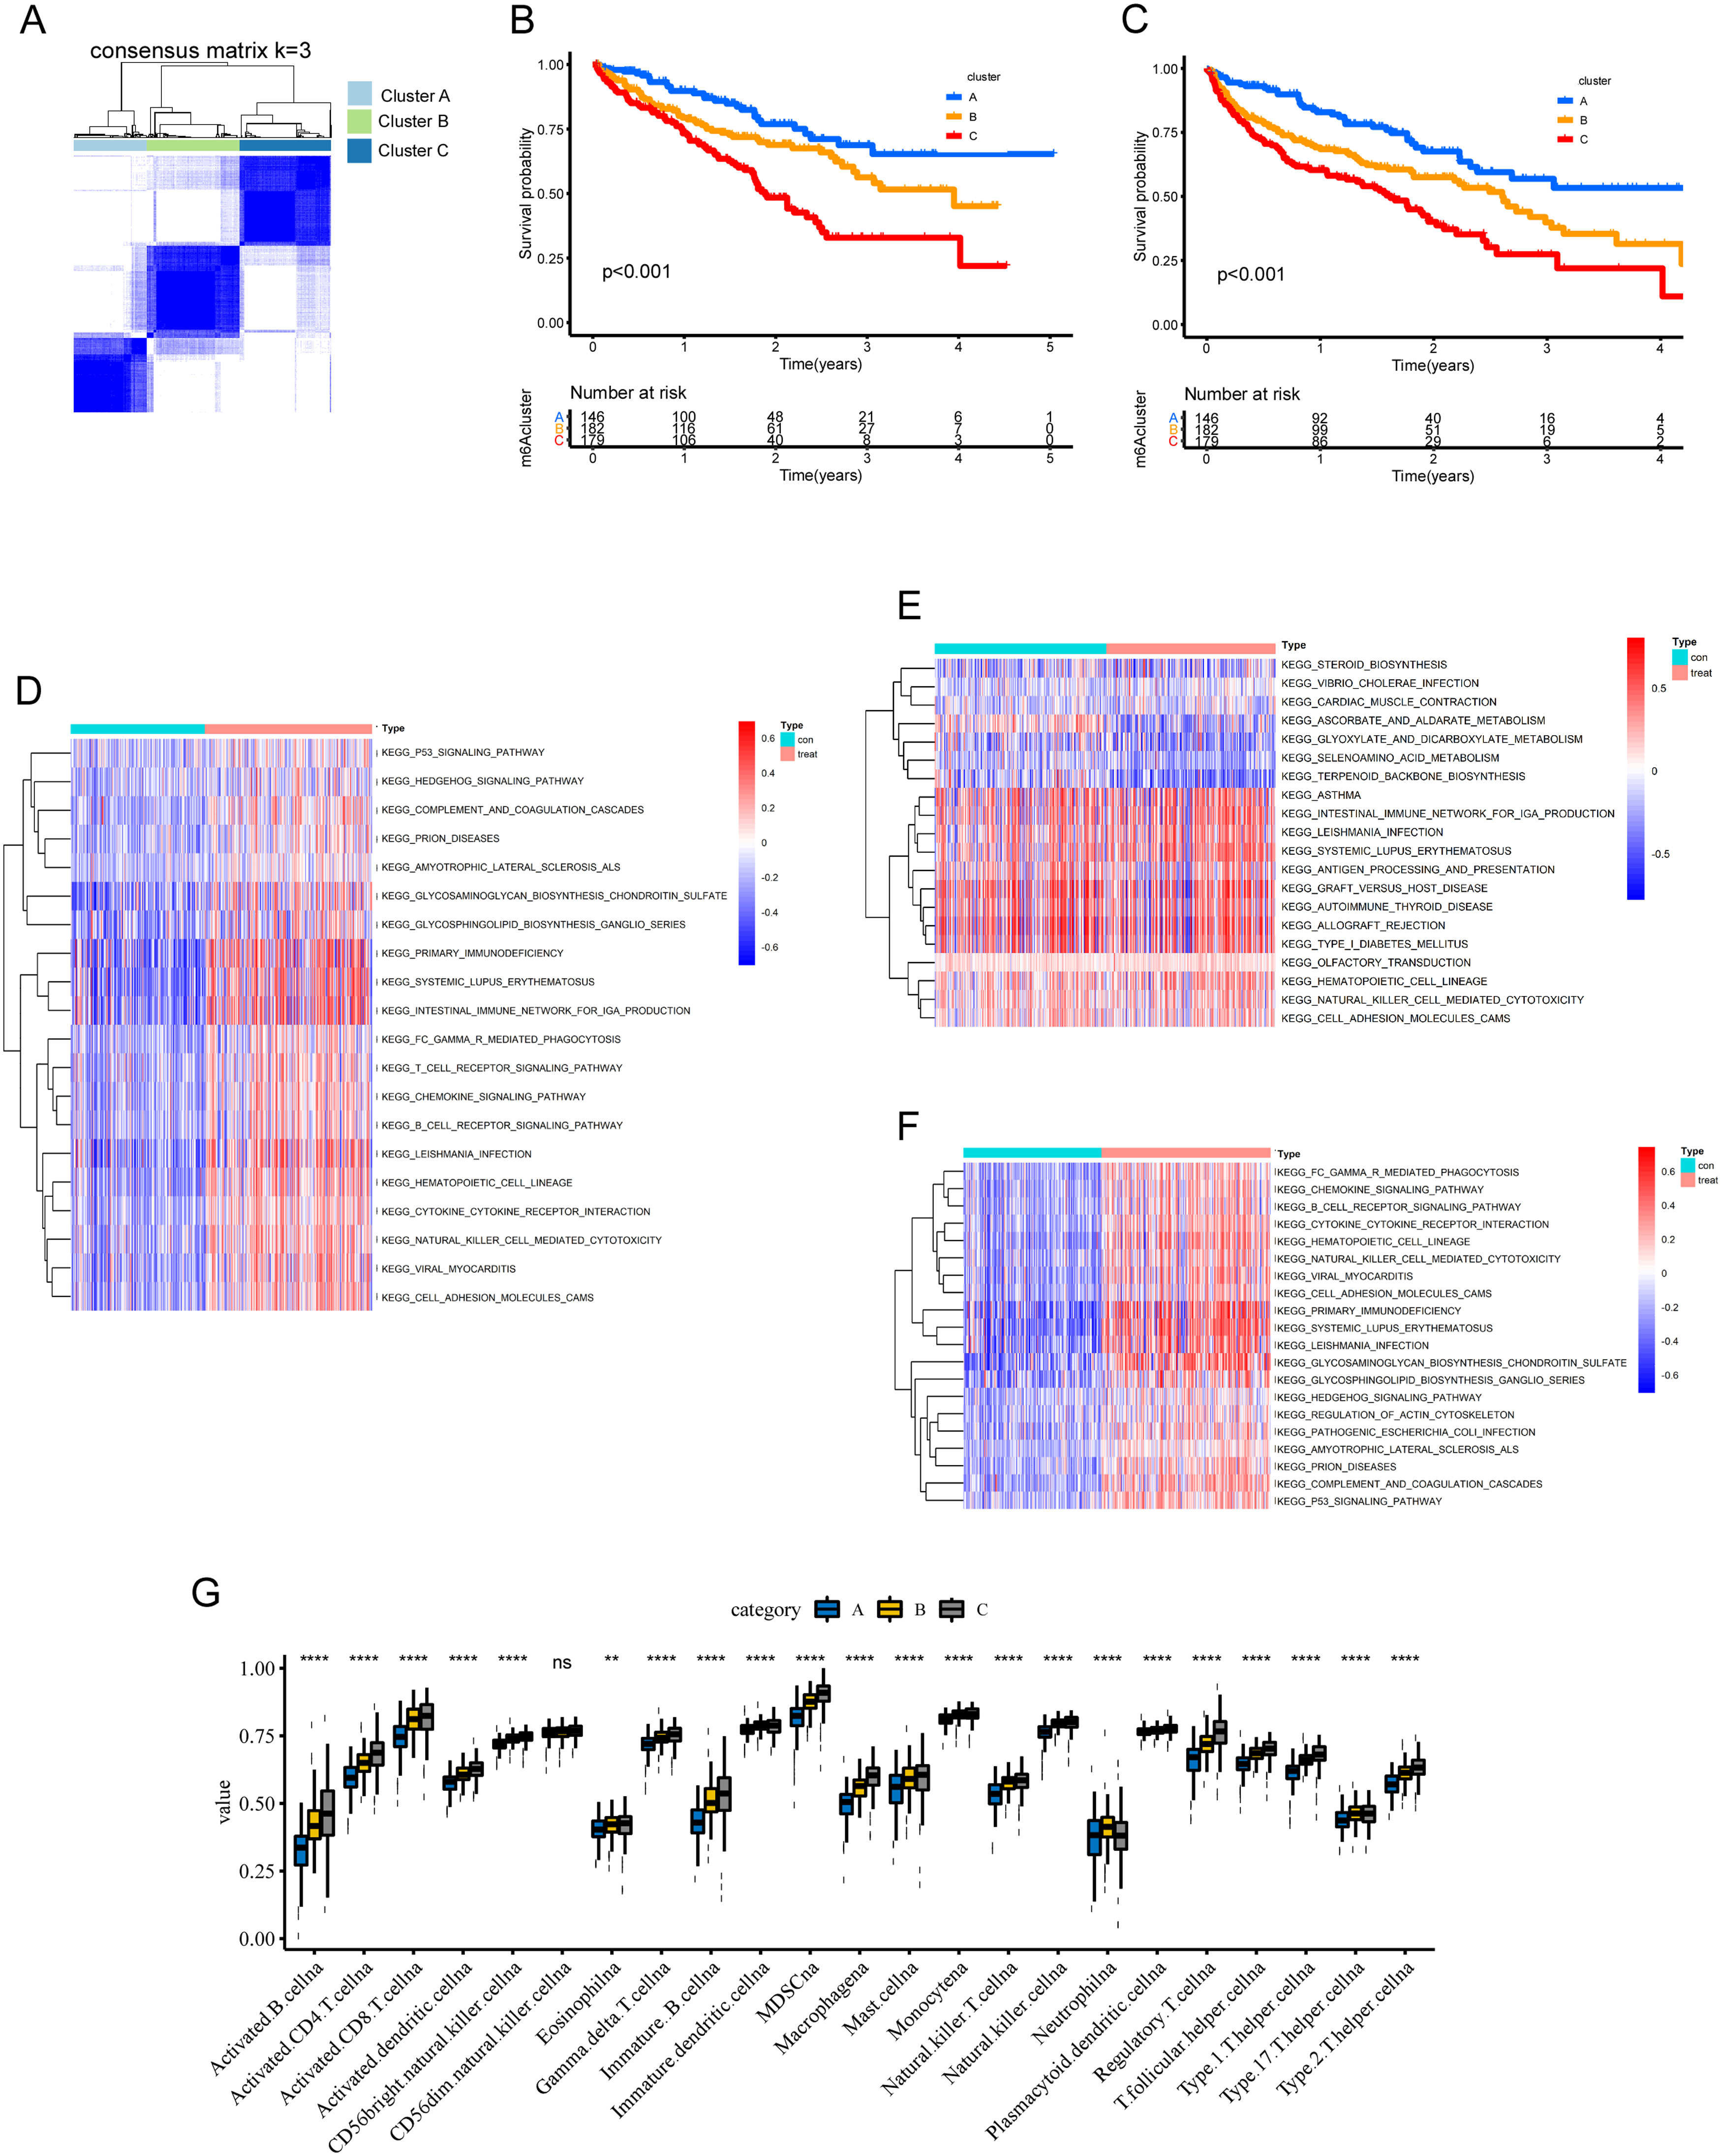
AS-based clusters significantly corelated with prognosis and immune features of ccRCC. (A) Consensus clustering analysis identification of three clusters (samples, n = 597). (B) Overall survival analysis for the three clusters, including cluster A (n = 146, 27.8%), cluster B (n = 182, 35.9%) and cluster C (n = 179, 35.3%). (C) Progression-free survival analysis for the three clusters, including cluster A (n = 146, 27.8%), cluster B (n = 182, 35.9%) and cluster C (n = 179, 35.3%). (D–F) GSVA enrichment analyses showing difference in biological process between clusters. These heatmaps were performed to visualize these biological processes, which red represented activated pathways and blue represented inhibited pathways. (D) cluster A vs cluster B; (E) cluster A vs cluster C; (F) cluster B vs cluster C; (G The comparison of 23 types of immune cells between clusters by ssGSEA algorithm.
Identification of intersection SFs and the regulatory network of survival-related as events and intersection SFs
A total of 52 SFs were investigated in the present study. Differential analysis of SFs in the high score and low score groups based on immune and stromal score system were performed to identify SFs related to TIME of ccRCC, whose analysis method was the same as the differential analysis of AS events (Figure 5A and B). Specifically, the up-regulated and down-regulated SF calculated by immune-score and stromal-score system were showed in volcano plots (Figure 5C and D). Taking intersection SFs as the core of research direction, 3 SFs that were presented up-regulated and 1 SFs that was presented down-regulated in both immune- and stromal-score systems were chose for subsequent study, as shown in Venn diagram (Figure 5E and F). Furthermore, we found the 4 intersection SFs, including YBX1, MBNL1, ELAVL4 and PCBP2, were positively correlated with immune cell infiltration, including the CD8+ T cell, CD4+ T cell, B cell, neutrophil, macrophage, and dendritic cell (Supplementary Figure 2).
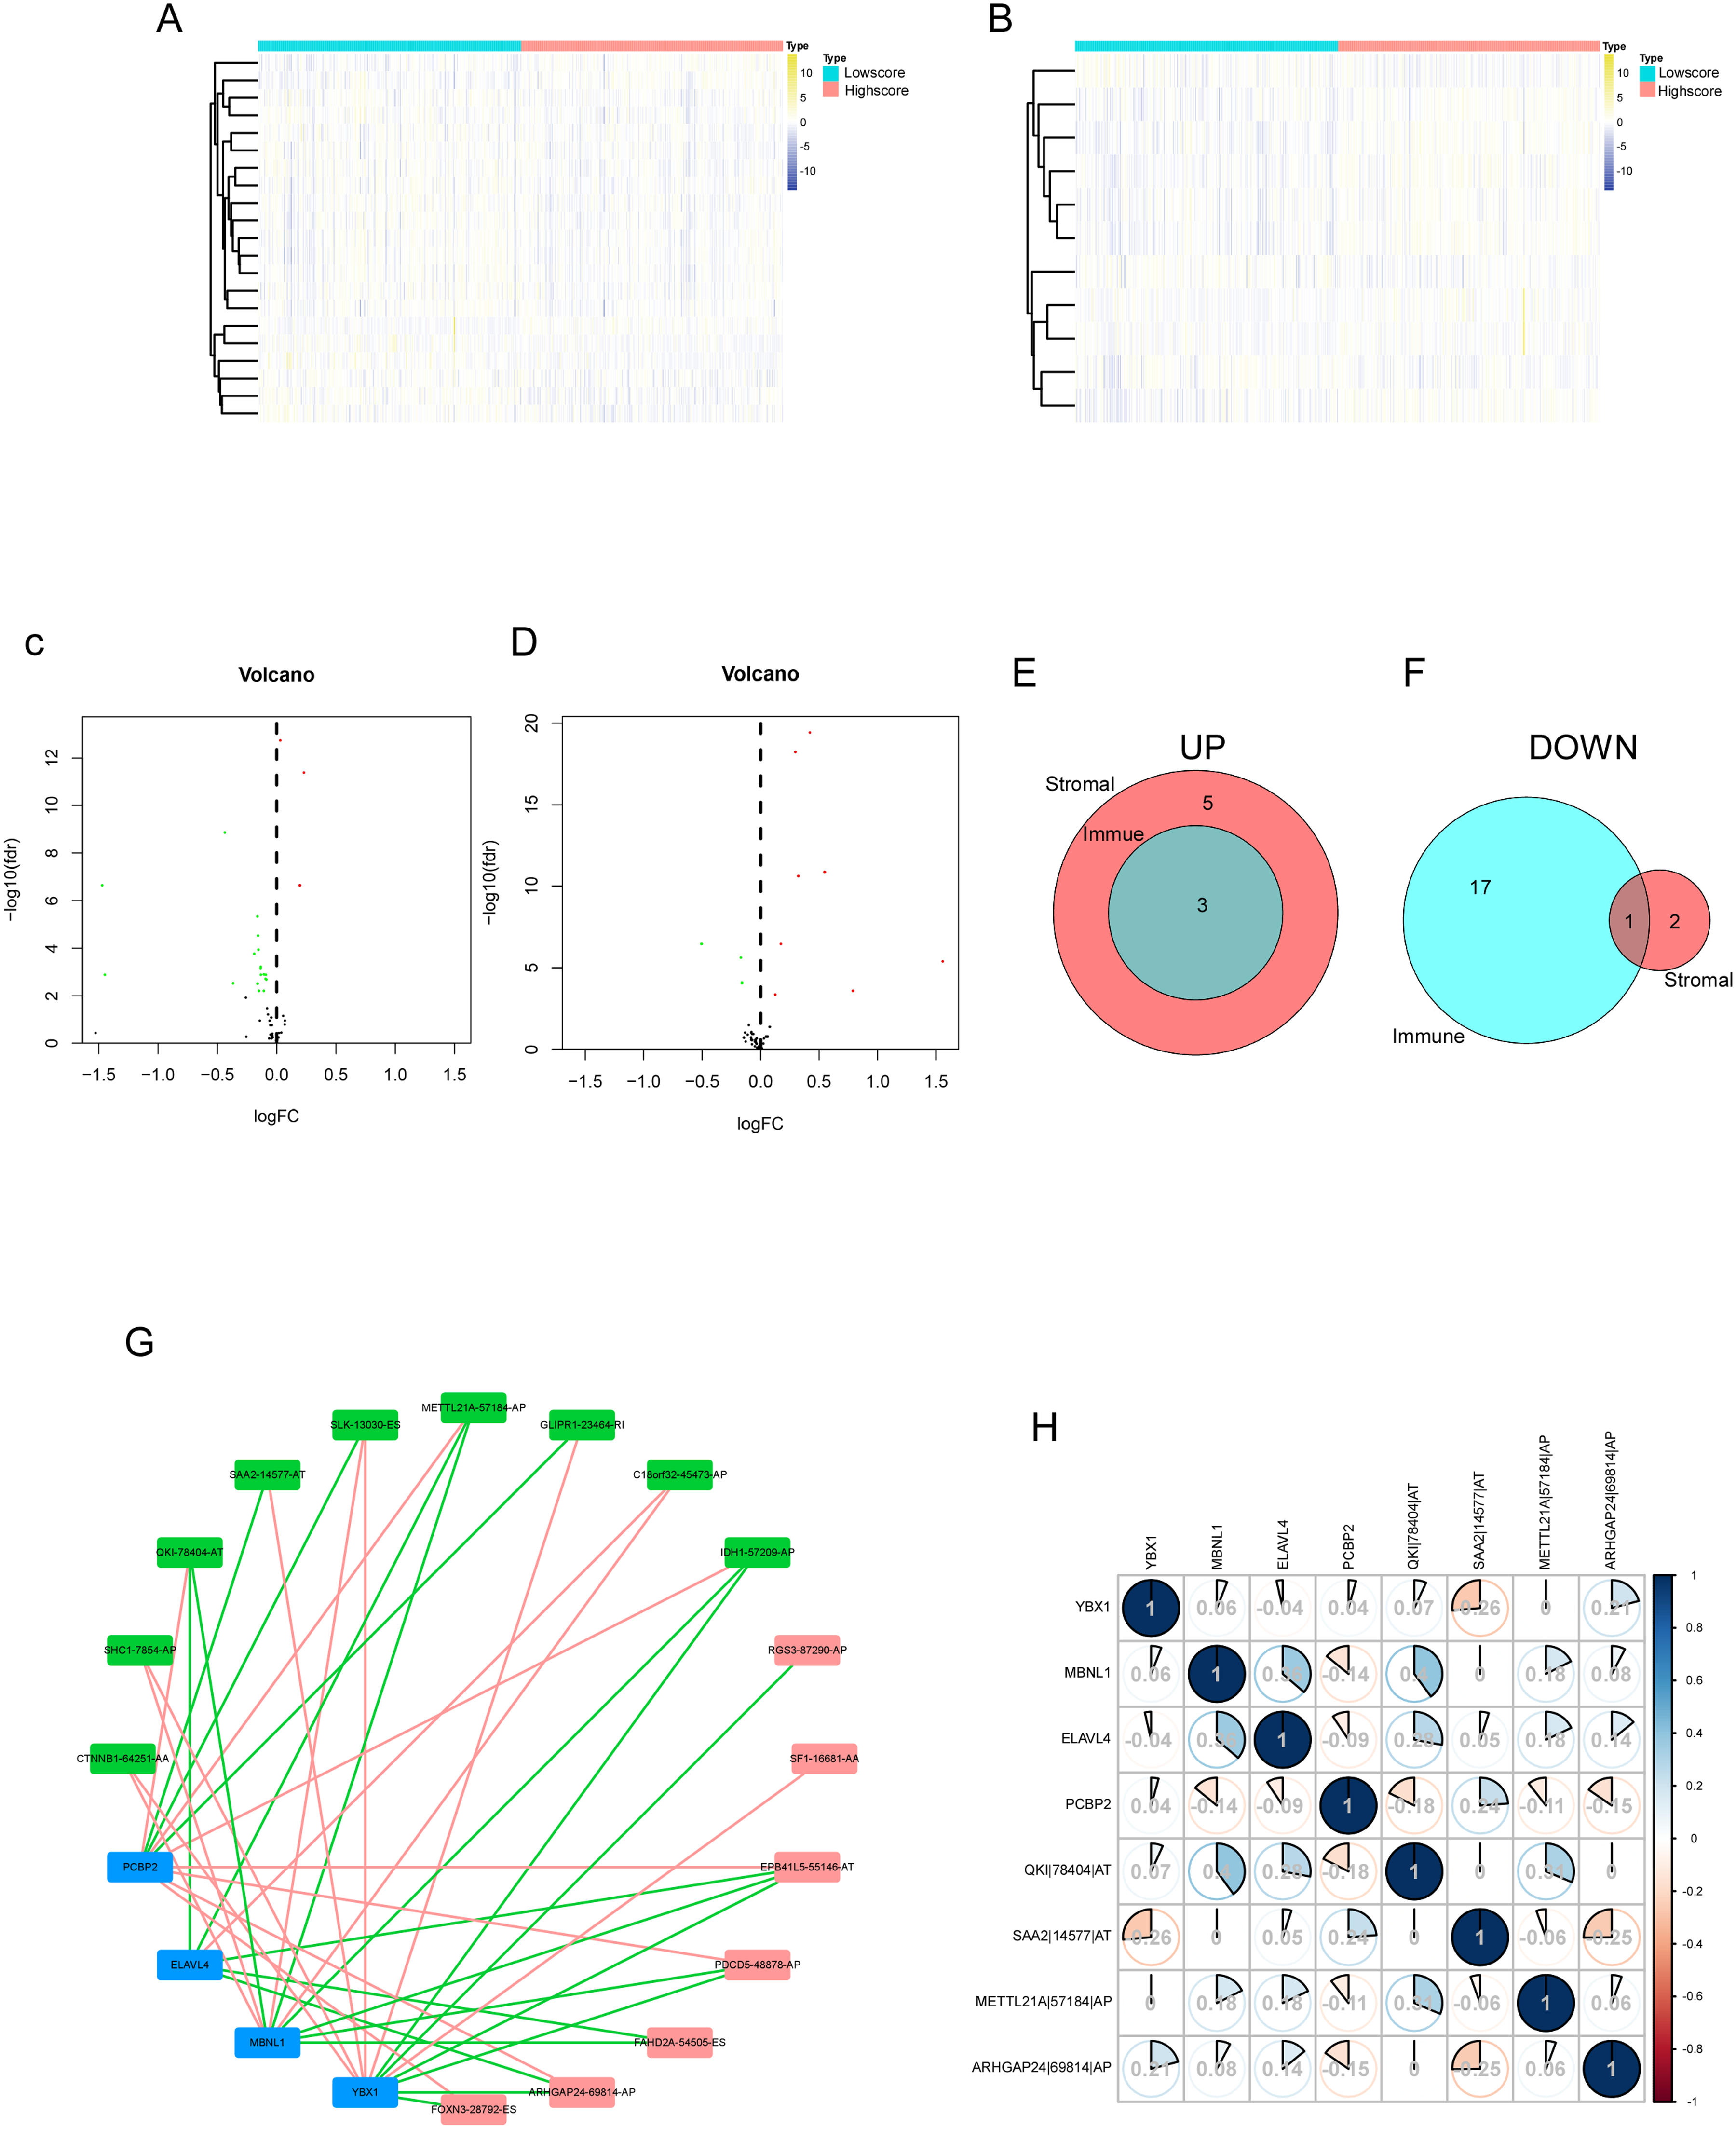
Identification of differentially expressed SFs, the regulatory network and the correlation of survival-related AS events and intersection SFs in ccRCC. (A) The heatmap of SF expression between the high immune scores group and low immune scores group. (B) The heatmap of SF expression between the high stromal scores group and low stromal scores group. (C) The volcano plot of SF expression between the high immune scores group and low immune scores group. (D) The volcano plot of SF expression between the high stromal scores group and low stromal scores group. (E) The Venn plot of SFs that were up-regulated in both immune and stromal groups. (F) The Venn plot of SFs that were down-regulated in both immune and stromal groups. (G) The regulatory network of survival-related AS events and intersection SFs. A total of 16 survival-related AS events including 9 AS events with low risk (favorable prognosis, green dots) and 7 AS events with high risk (inferior prognosis, red dots) were significantly correlated with expression levels of 4 SFs (bule dots). The red line represented the negative correlation, the green line represented the positive correlation. (H) Correlation analysis between intersection AS events and intersection SFs.
SFs are RNA-binding proteins that influence exon selection and splicing site selection by recognizing cis-regulatory elements in precursor mRNAs, suggesting that the upstream SFs of the survival-related AS events need to be further explored. 41 We collected 17 survival-related AS events according to the above analysis of OS and PFS. Subsequent correlation analysis between related-AS events and intersection SFs were conducted (Figure 5G). In construction of the regulatory network of AS events and SFs, A total of 16 AS events (1 had no matched SF) including 9 AS events with low risk (green dots) and 7 AS events with high risk (red dots) had significant relationships with the expression of these 4 SFs (bule dots). The negative correlation between AS with good prognosis and SF was the majority (red line), and the positive correlation between AS with poor prognosis and SF was the majority (green line). Motivated by the regulatory network, correlation matrix was further constructed to figure out the relation between intersection AS events and intersection SFs (Figure 5H). Based on the above regulatory network, correlation analysis and literature review, we selected MBNL1 from 4 hub SFs for subsequent validation in vitro.
Tumor suppressor phenotype of MBNL1 and its effect on QKI expression via AS
Stable expression cell lines 786O and A498 were established, and the expression of MBNL1 were verified through western blot and RT-qPCR (Figure 6A). CCK8 assay showed that the proliferation capability of MBNL1 overexpressed cells was declined (Figure 6B). Meanwhile, the migration and invasion of MBNL1 overexpressed cells were found to be reduced in Transwell assay (Figure 6C). For the cell cycle and apoptosis detection, it was found that the overexpressed MBNL1 cells were arrested in the G2/M phase, and the proportion of apoptosis was increased in the cells of transient transfection with MBNL1 expression (Figure 6D and E). According to the regulatory network of AS events and SFs, candidate downstream molecules were identified, and the impact of MBNL1 on the expression of QKI isoforms was ultimately determined. A significant positive correlation was observed between the expression levels of MBNL1 and QKI in tumor tissue samples from patients with ccRCC (Figure 7A). We detected significantly higher QKI expression in MBNL1-overexpressing 786O and A498 cell lines compared to the control group (Figure 7B). Based on the analysis of differential AS events using the Ensembl online tool (https://asia.ensembl.org/index.html), the expression of QKI-203 and QKI-202 isoforms was speculated to have the most significant differences (Figure 7C). In addition, the TSVdb database (http://www.tsvdb.com/plot.html) was used to analyze the expression of known QKI transcripts in both normal and tumor tissues (Figure 7D). In vitro, QKI-related AS events was increase in MBNL1-overexpressing cells, and QKI-202 expression was significantly higher than QKI-203 expression (Figure 7E). To investigate whether MBNL1 affects the expression of the two transcripts through AS regulation, RIP experiments confirmed that MBNL1 exerts a AS regulatory role by binding to QKI RNA in A498 cells (Figure 7F).
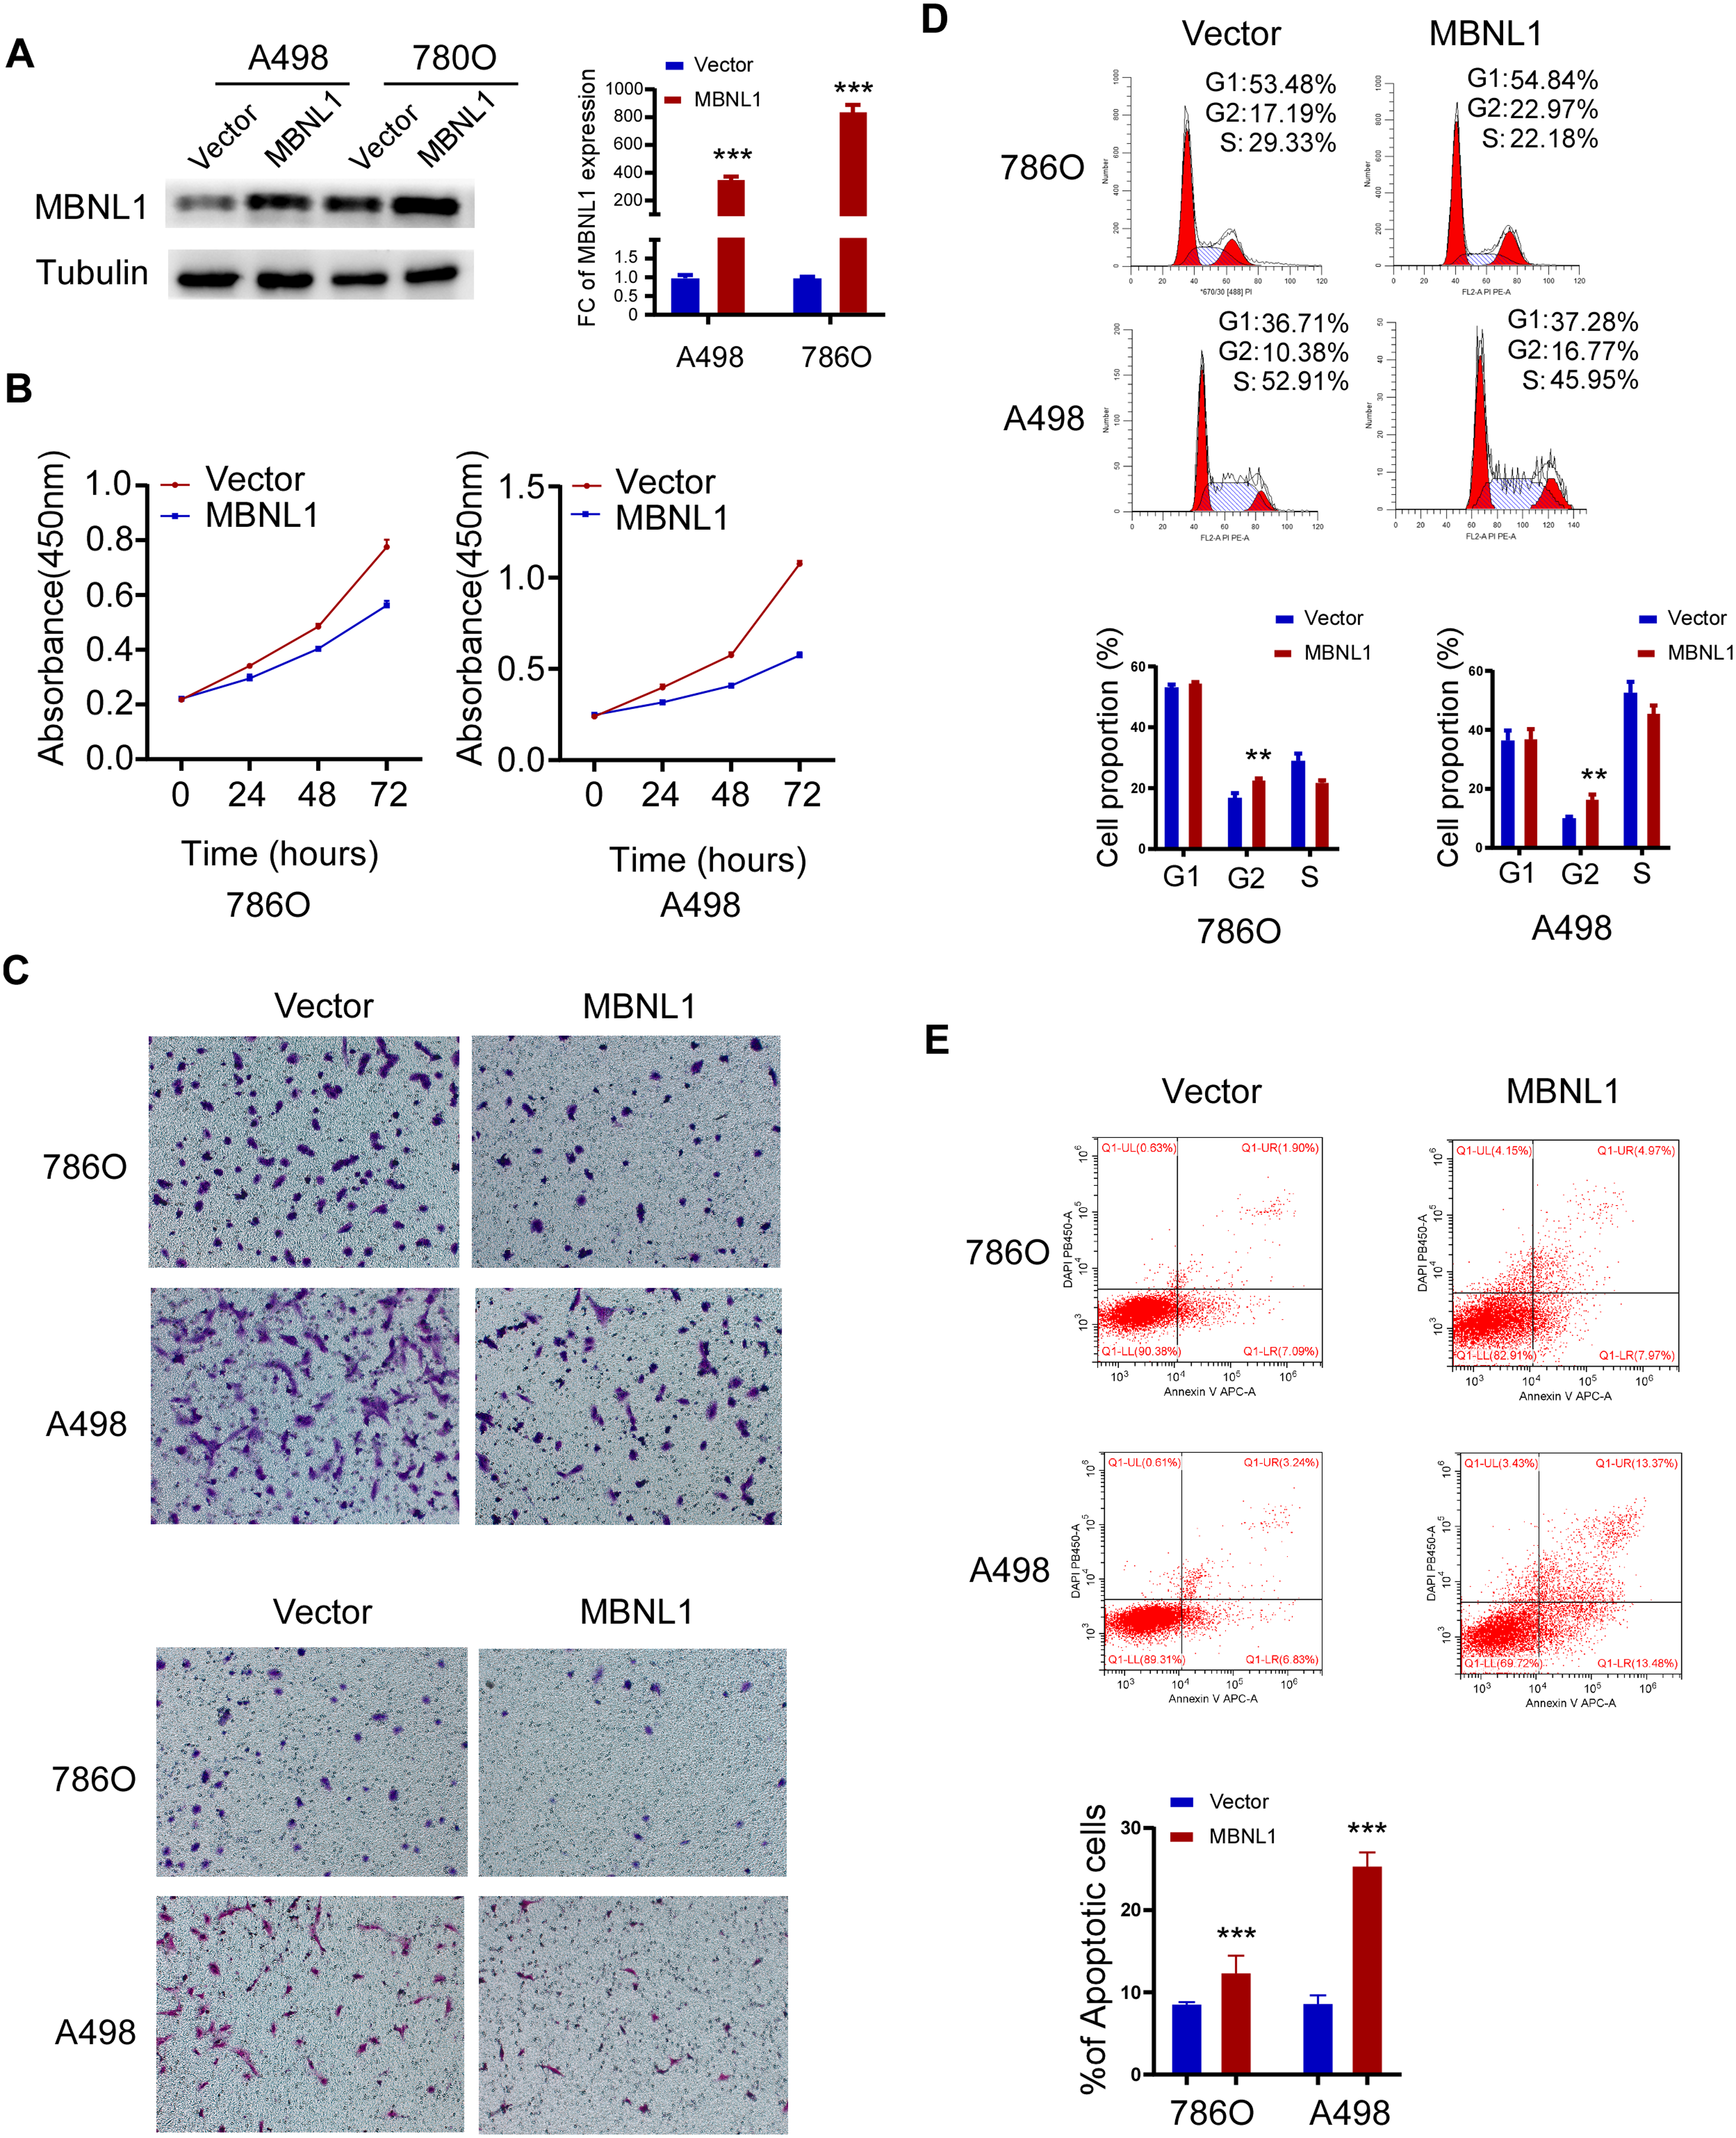
Tumor suppressor phenotype of MBNL1 in 786O and A498 cells. (A) Western blot and RT-QPCR results of stably transfected 786O and A498 cells. (B) Comparison of CCK8 results between control group and MBNL1 overexpression group cells. (C) Comparison of migration and invasion between control group and MBNL1 overexpression group cells. (D) Cell cycle distribution of control group and MBNL1 overexpression group cells. (E) Proportion of apoptosis in control group and MBNL1 overexpression group cells.
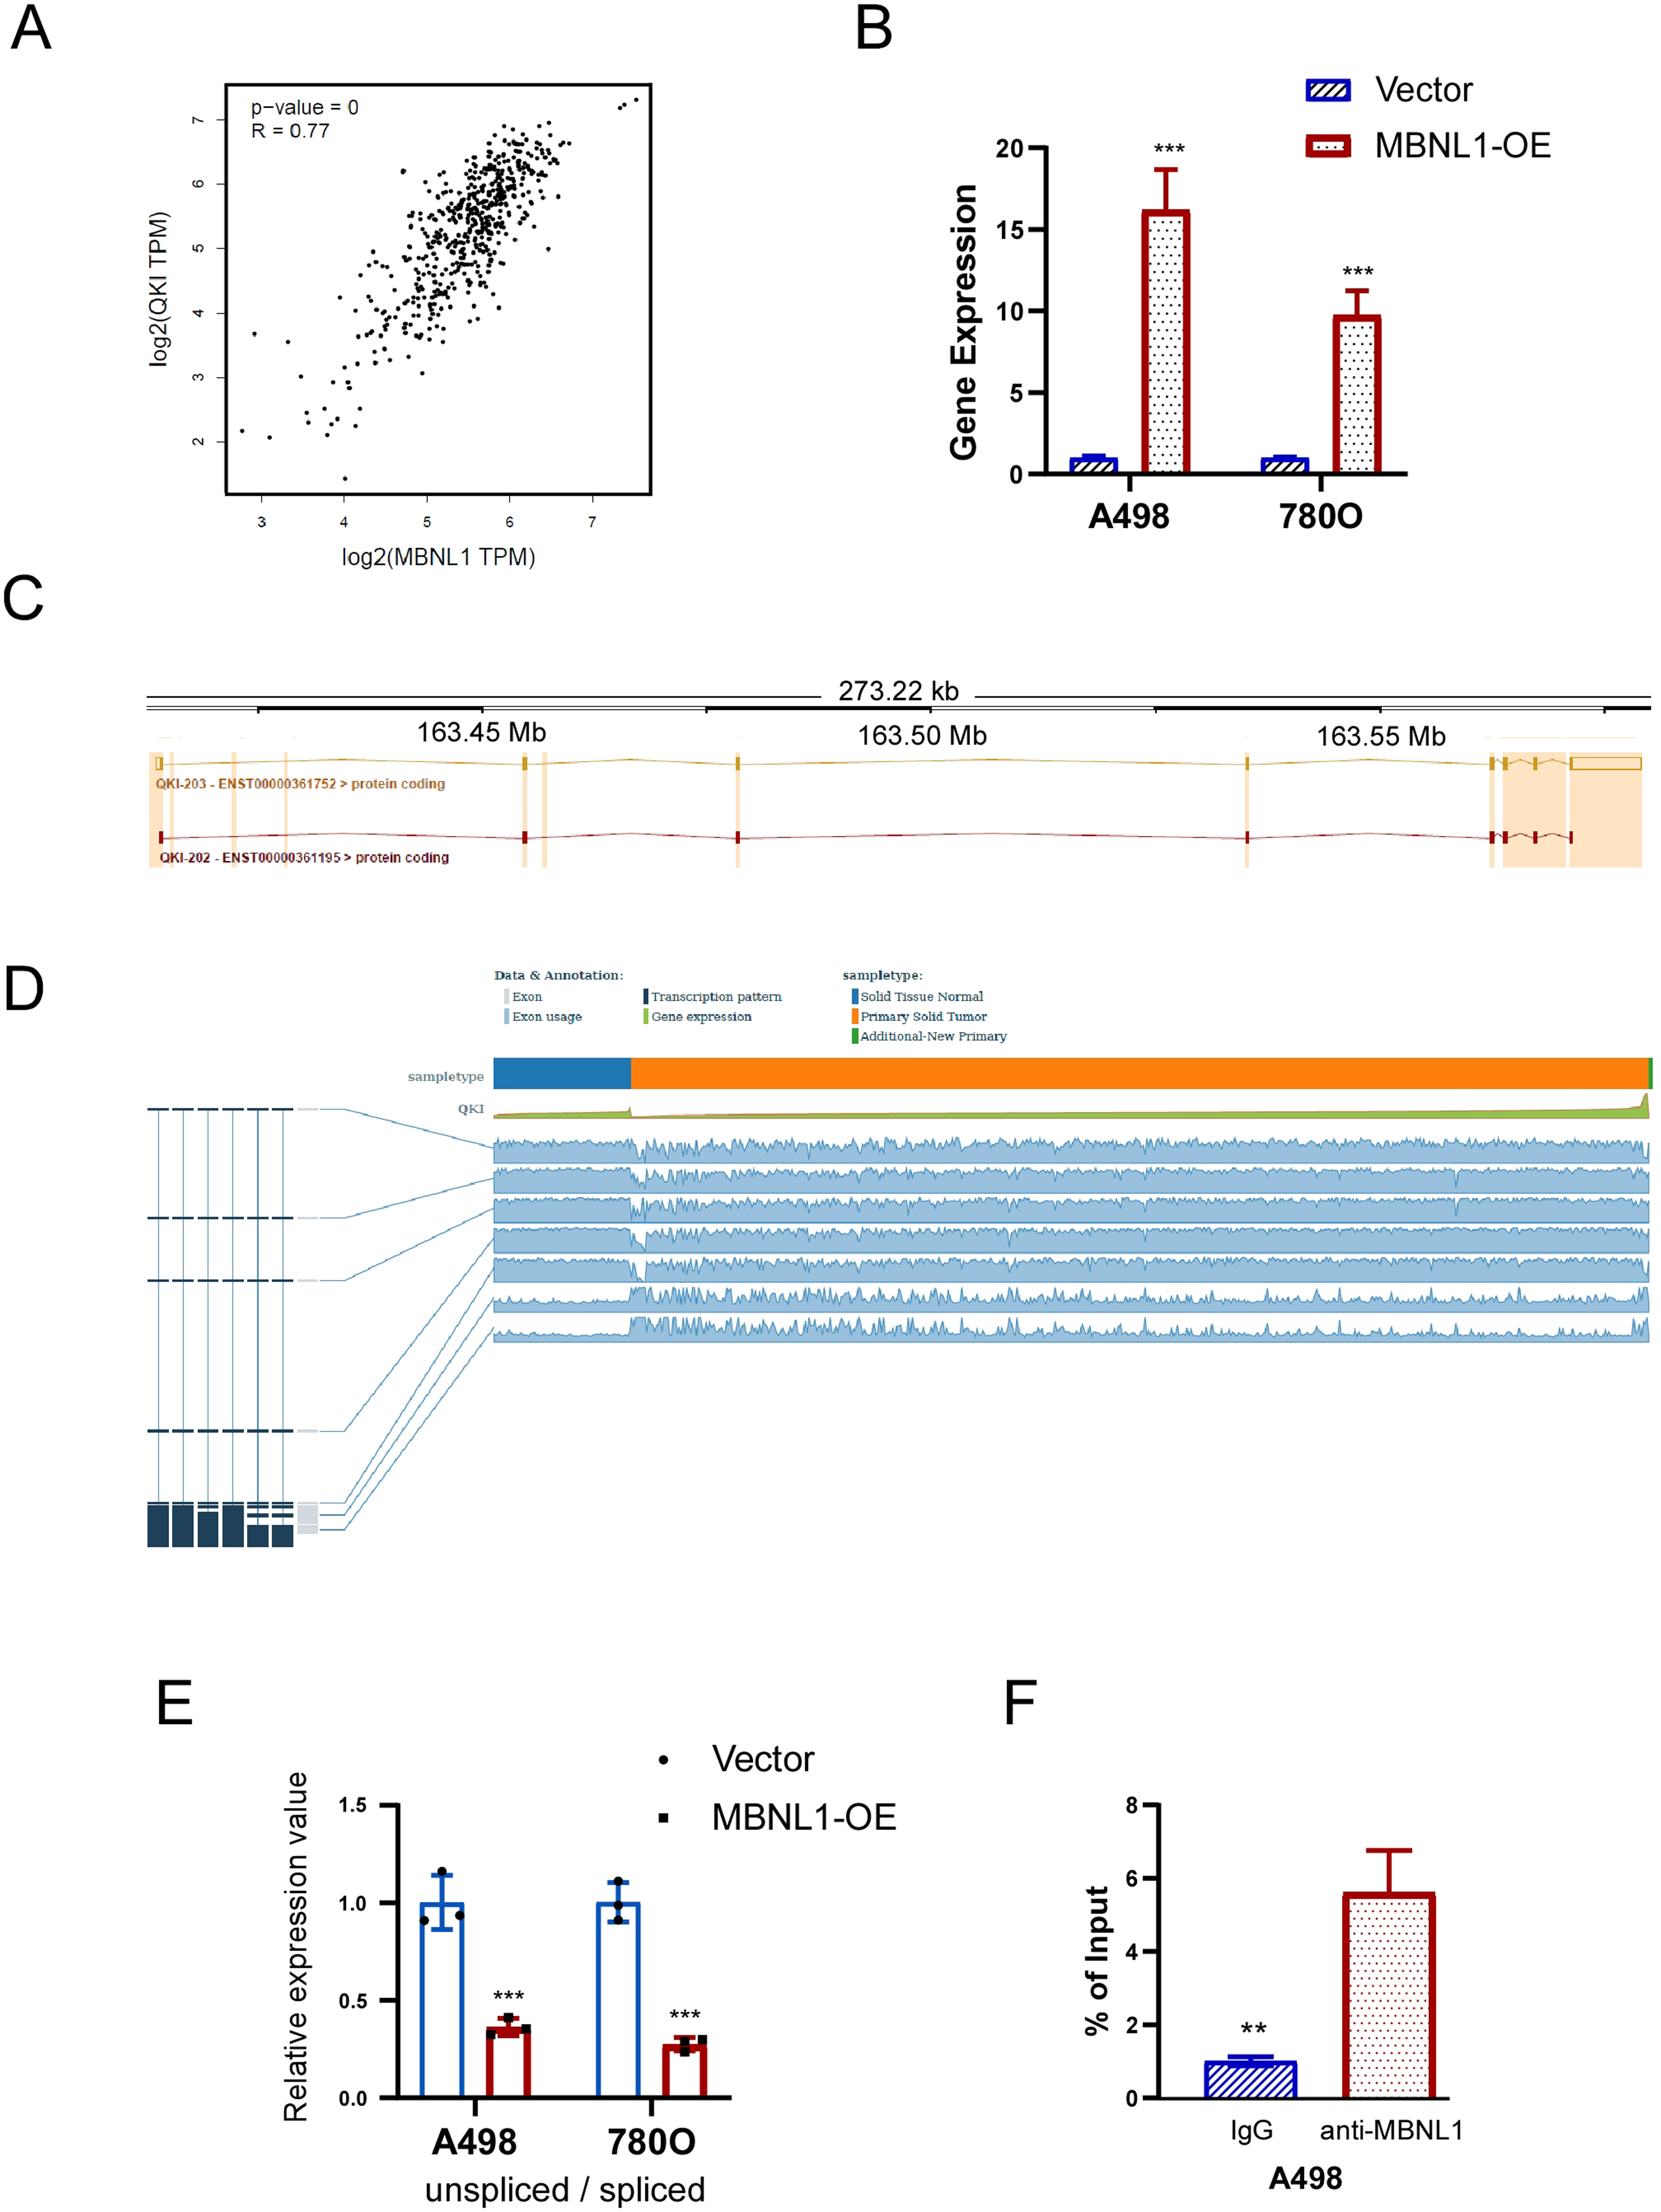
MBNL1 regulates the expression of downstream gene QKI via AS in 786O and A498 cells. (A) Correlation between the expression of MBNL1 and QKI in tumor tissues from patients with ccRCC in TCGA. (B) Comparison of QKI expression levels between control group and MBNL1 overexpression group cells. (C) QKI transcripts with significant differences in expression were found based on differentially AS events anlysis. (D) Based on TSVdb database (http://www.tsvdb.com/plot.html), QKI known transcripts expressions in normal tissue and tumor tissue in ccRCC. (E) Relative mRNA expression of QKI transcripts in control cells and MBNL1 overexpression cells. (F) The interaction between MBNL1 and QKI mRNA was validated by RIP-PCR in A498 cells (n = 3 biologically independent samples).
Discussion
Nowadays high throughput detection technology has been gradually mature and widely used. It is possible to screen the differences and changes at the micro level through big data analysis to dissect tumor development.42,43 In recent years, the effects of AS events on various malignant tumors have been demonstrated from different biological perspectives, such as immunology.44,45 However, the interpretation of the immune perspective of AS events in ccRCC is not detailed and sufficient. In the present study, we used public data and methods of bioinformatics, calculated the immune/stromal score of patients based on the ESTIMATE algorithm. We then identified the DEASs according to the immune/stromal group and further investigated the immunobiological response through enrichment analysis and unsupervised cluster analysis, which was likely to provide references for clinical immunotherapy applications of ccRCC. Furthermore, Construction of prognostic risk models were performed to generate two prognosis-related signatures according to DEASs, namely OS-related signature and PFS-related signature. In the assessment of modeling, the two signatures showed good prediction ability, whose AUC were both greater than 0.75. Additionally, we also focused on the relationship between SFs and AS events and screened out the hub SFs, including YBX1, MBNL1, ELAVL4 and PCBP2. MBNL1 was selected for cell phenotypic validation and was found to have a significant tumor suppressor phenotype.
Intriguingly, we found that there were four overlapped AS events in the analysis of OS and PFS, which were ARHGAP24, METTL21A, QKI and SAA2, respectively. ARHGAP24 has wide expression in most tissues, especially in kidney tissue, with the highest level of expression. 46 It belongs to the Rho GTPase activating protein family, and is involved in cancer cell migration and invasion.46,47 Previous study had proved that overexpression of ARHGAP24 could inhibit cell proliferation, promote tumor apoptosis and inhibit metastasis of renal cell carcinoma,48,49 which is inconsistent with our conclusion. It may be related to different cell types, and further research is needed. For QKI (quaking), a member of the signal transduction and activation of RNA (STAR) protein family, is related to cancer regulatory mechanism. 50 Consistent with our result, the overexpression of QKI can inhibit tumor progression and prolong survival, which is considered to be a tumor suppressor51–54 and has a promising application in the development of new targets for tumor targeted therapy. Regarding SAA2, Serum Amyloid A 2, is a well-known molecule that plays an important role in the acute phase response (APR). 55 Jae W. Lee et al. had shown that SAA2 levels rised in the circulatory system of patients with liver metastasis, and the high level of circulating SAA2 always had a poor OS, which could promote the formation of metastatic niche. 56 As for METTL21A, no direct studies have been conducted on its relationship with tumor prognosis.
Noteworthily, we found that enrichment analysis results of DEASs were significantly enriched in immune-related pathways, such as “Natural killer cell mediated cytotoxicity”, “T cell receptor signaling pathway”, “Chemokine signaling pathway”, “NOD−like receptor signaling pathway”, “Fc gamma R−mediated phagocytosis”, “TNF signaling pathway”, “Fc epsilon RI signaling pathway”, “B cell receptor signaling pathway”, which indicated that AS events had a nonnegligible position in shaping the TIME of ccRCC. In addition, we also realized that several metabolism-related pathways are also involved, like “Rap1 signaling pathway”. Jae-Jun Kim et al. speculated that cAMP/EPAC/Rap1 pathway might be associated with ETV2-related pathological angiogenesis, which provides convenient metastasis channels and metabolic supply for tumor metastasis.57,58 Encouraged by the results of enrichment analysis, the unsupervised consensus analysis was next adopted to elucidate the shaping effect of AS events on the TIME among clusters of ccRCC. According to the findings of the unsupervised consensus analysis, there was an interesting phenomenon that the higher the level of immune cell infiltration in TIME of ccRCC, the more immune-related pathways were enriched, but the worse the survival. Specifically, cluster A had the best prognosis but the most impoverished immune microenvironment, which seems to contradict the conventional thinking. Nakano et al. reported that due to the high heterogeneity of RCC, so with tumor grade was higher and higher, the lymphocyte infiltration was more and more, but tumor infiltrating lymphocytes itself in tumor tissue didn't mean the antitumor immune effect, did not represent that they were mature lymphocytes,59,60 and their function may be swallowed by more and more aggressive tumors, resulting in poor prognosis. 16 In other words, the proper performance of anti-tumor immunity did not depend on the number of anti-tumor cells, the key lay in the cell quality, and was significantly related to the tumor proliferation activity, which may explain why the more advanced tumor, the worse the effect of immunotherapy. On the other hand, immune checkpoint inhibitors provide sustained benefits to only a small proportion of patients with ccRCC. 61 This observation supports the hypothesis that immune cells infiltrating the microenvironment of ccRCC may not effectively inhibit tumor growth, or alternatively, that the immunosuppressive network within ccRCC may induce immune infiltration without predicting a favorable prognosis. Furthermore, there are some prognostic prediction models of ccRCC constructed based on immune-related genes recently, and several studies have showed that high-risk patients with poor prognosis often exhibit more pronounced immune cell infiltration, particularly involving immunosuppressive cells.62,63 Collectively, the unusual complexity of the immune microenvironment of ccRCC mixed and interwoven by multiple forces provided some thinking for the rational application of clinical immunotherapy.
There is no doubt about the role of SFs in regulating the splicing process.39,64,65 In the correlation analysis and the construction of regulatory network, the underlying correlation between AS events and SFs in ccRCC patients was elucidated. Four hub SFs were identified in regulatory network, among which MBNL1 has the function of inhibiting the capability of proliferation and metastasis in 786O and A498 cells. In addition, the regulation of QKI by MBNL1 through alternative splicing was also confirmed in this study. QKI has been shown to inhibit renal clear cell carcinoma by suppressing HIF-1α, microRNA-200c, and by regulating the post-transcriptional stabilization of RASA1 mRNA.66–68 The regulation of QKI by MBNL1 is hypothesized to be the mechanism by which MBNL1 exerts its anticancer phenotype. These foundingssuggest that the hub SFs explored in this study may contribute a critical role in the development of ccRCC.
Although the results of the present study enriched some knowledge of the relationship between AS events and the TIME of ccRCC, some limitations still exist. Firstly, the contents of the present study were only derived from the public data, and the prognostic model lacked external validation. Secondly, the analysis of TIME stopped at the cellular level, lacking further protein level analysis of immune targets or metabolic levels, which would be continue to implement in our future work. Thirdly, the verification process did not encompass all the SFs and AS events identified in this study, which was constrained by the current personnel and experimental conditions. Future research will aim to broaden the scope of validation based on the findings of this study and further investigate the underlying mechanisms.
Conclusion
The prognostic risk model constructed base on immune-related AS events has good predictive ability for ccRCC, and the 3-clusters model based on immune-related AS events has potential for further clinical exploration. The hub SF found in the present study, such as MBNL1, could affect the progression of ccRCC. These findings would provide new insights for the application of clinical immunotherapy and the development of new targets for ccRCC.
Supplemental Material
sj-docx-1-cbm-10.1177_18758592251317402 - Supplemental material for Systematic exploration of prognostic alternative splicing events related to tumor immune microenvironment of Clear Cell Renal Cell Carcinoma
Supplemental material, sj-docx-1-cbm-10.1177_18758592251317402 for Systematic exploration of prognostic alternative splicing events related to tumor immune microenvironment of Clear Cell Renal Cell Carcinoma by Hongwei Wu, Yuchuan Zhou, Xi Wang, Chunhan Tang, Fang Yang, Ke Xu and Tao Ren in Cancer Biomarkers
Supplemental Material
sj-docx-2-cbm-10.1177_18758592251317402 - Supplemental material for Systematic exploration of prognostic alternative splicing events related to tumor immune microenvironment of Clear Cell Renal Cell Carcinoma
Supplemental material, sj-docx-2-cbm-10.1177_18758592251317402 for Systematic exploration of prognostic alternative splicing events related to tumor immune microenvironment of Clear Cell Renal Cell Carcinoma by Hongwei Wu, Yuchuan Zhou, Xi Wang, Chunhan Tang, Fang Yang, Ke Xu and Tao Ren in Cancer Biomarkers
Footnotes
Acknowledgements
None.
Ethics statement and consent to participate
This study is based on public data and do not refer to the ethical approval and the informed consent.
Authors’ contributions
Conception and design: Tao Ren, Yuchuan Zhou; Administrative support: Yuchuan Zhou, Ke Xu, Tao Ren; Provision of study materials or patients: Hongwei Wu, Xi Wang; Collection and assembly of data: Ke Xu, Fang Yang; Data analysis and interpretation: Ke Xu, Chunhan Tang; Manuscript writing: Hongwei Wu, Ke Xu, Xi Wang, and Tao Ren; Final approval of manuscript: Hongwei Wu, Yuchuan Zhou, Xi Wang, Chunhan Tang, Fang Yang, Ke Xu, and Tao Ren.
Funding
The project was funded by Sichuan Medical Association Research Project (Grant No. Q22019), Sichuan Province Science and Technology Innovation Seedling Project (Grant No. MZGC20230026), Key Clinical Specialty of Sichuan Province (Grant No. YS00109), Sichuan Provincial Health Commission Clinical Research Project (Grant No. 23LCYJ049) and Wu Jieping Foundation Special Fund for Clinical Research (Grant No. 320.6750.2022-19-100). The funder had no role in study design, data collection and analysis, decision to publish, or preparation of the manuscript.
Declaration of conflicting interests
The authors declared no potential conflicts of interest with respect to the research, authorship, and/or publication of this article.
Data availability
The transcriptional data were obtained from TCGA data portal (https://tcga-data.nci.nih.gov/tcga/). The data of AS events were downloaded from the TCGA SpliceSeq database (![]() ). The accession number was TCGA-KIRC.
). The accession number was TCGA-KIRC.
Supplemental material
Supplemental material for this article is available online.
References
Supplementary Material
Please find the following supplemental material available below.
For Open Access articles published under a Creative Commons License, all supplemental material carries the same license as the article it is associated with.
For non-Open Access articles published, all supplemental material carries a non-exclusive license, and permission requests for re-use of supplemental material or any part of supplemental material shall be sent directly to the copyright owner as specified in the copyright notice associated with the article.