
Abstract
Objectives
Accurate survival predictions and early interventional therapy are crucial for people with clear cell renal cell carcinoma (ccRCC).
Methods
In this retrospective study, we identified differentially expressed immune-related (DE-IRGs) and oncogenic (DE-OGs) genes from The Cancer Genome Atlas (TCGA) dataset to construct a prognostic risk model using univariate Cox regression and least absolute shrinkage and selection operator (LASSO) analysis. We compared the immunogenomic characterization between the high- and low-risk patients in the TCGA and the PUCH cohort, including the immune cell infiltration level, immune score, immune checkpoint, and T-effector cell- and interferon (IFN)-γ-related gene expression.
Results
A prognostic risk model was constructed based on 9 DE-IRGs and 3 DE-OGs and validated in the training and testing TCGA datasets. The high-risk group exhibited significantly poor overall survival compared with the low-risk group in the training (P < 0.0001), testing (P = 0.016), and total (P < 0.0001) datasets. The prognostic risk model provided accurate predictive value for ccRCC prognosis in all datasets. Decision curve analysis revealed that the nomogram showed the best net benefit for the 1-, 3-, and 5-year risk predictions. Immunogenomic analyses of the TCGA and PUCH cohorts showed higher immune cell infiltration levels, immune scores, immune checkpoint, and T-effector cell- and IFN-γ-related cytotoxic gene expression in the high-risk group than in the low-risk group.
Conclusion
The 12-gene prognostic risk model can reliably predict overall survival outcomes and is strongly associated with the tumor immune microenvironment of ccRCC.
Keywords
Introduction
Kidney cancer was the ninth most common cancer in men and the 14th in women worldwide in 2021. 1 Over the past 30 years, the incidence and mortality rates for kidney cancer have been increasing in China. 2 As of 2016, renal cell carcinoma (RCC) accounted for 2% of mortality from all cancers. 3 RCC originates from renal tubular epithelial cells and constitutes approximately 90% of kidney cancers,4,5 with 75% of all RCC cases being clear cell RCC (ccRCC). 6 ccRCC can be radically cured by surgical excision; however, 30% of patients with ccRCC had distal metastasis at the time of diagnosis, and 20%-40% develop recurrence or metastasis postoperatively, which is the leading cause of death in patients with ccRCC. 7 Therefore, accurately predicting the survival prognosis of patients with ccRCC and advancing interventional treatment are critical.
The main prognostic model currently used in clinical applications for patients with ccRCC include the University of California, Los Angeles Integrated Staging System (UISS), which integrates (TNM) stage, Fuhrman grade, and Eastern Cooperative Oncology Group (ECOG) score; the Stage, Size, Grade, and Necrosis (SSIGN) score for patients with RCC undergoing radical nephrectomy; and the International mRCC Database Consortium (IMDC) and Memorial Sloan Kettering Cancer Center (MSKCC) prognostic models for patients with metastatic RCC.8-13 The discriminatory ability of these models is not optimal but can be improved when combined with additional information. For example, the integration of microvascular invasion and chromosome 3p/14q deletion into the UISS improves its ability to identify patients with a high-risk of recurrence. 14 Radiomics-based tumor heterogeneity can add incremental value to existing UISS and SSIGN prognostic models for patients with localized ccRCC. 15 These models are mostly focused on pathological findings or biochemical indicators that they fail to fully consider individual omics characteristics of patients. Furthermore, to obtain useful indicators, UISS and SSIGN models require postoperative pathological sections; thus, the prognostic assessment of patients cannot be completed preoperatively.16,17
Clinical and genomic studies have described ccRCC as a type of immune-infiltrated tumor.18,19 Immunological reactions are considered the cause of spontaneous regression, which occurs in up to 1% of patients with ccRCC. 20 Moreover, ccRCC is among the malignancies with the best response to immunotherapy. 21 However, the molecular mechanism underlying its high permeability, spontaneous remission, and immunotherapy response remains unclear. No prognostic or predictive biomarkers for response to immune checkpoint inhibitors in ccRCC have been established in clinical practice, although some biomarkers have been identified, such as programmed cell death 1 ligand 1 expression, tumor mutational burden, single gene mutations, and tumor microenvironment. 22
In this study, we developed and validated the predictive performance of a prognostic risk model for ccRCC. We analyzed the correlation between risk scores and clinical factors and assessed differences in the tumor immune microenvironment (TIME) between high- and low-risk groups in The Cancer Genome Atlas (TCGA) dataset and the PUCH cohort.
Materials and Methods
Data Sources and Processing
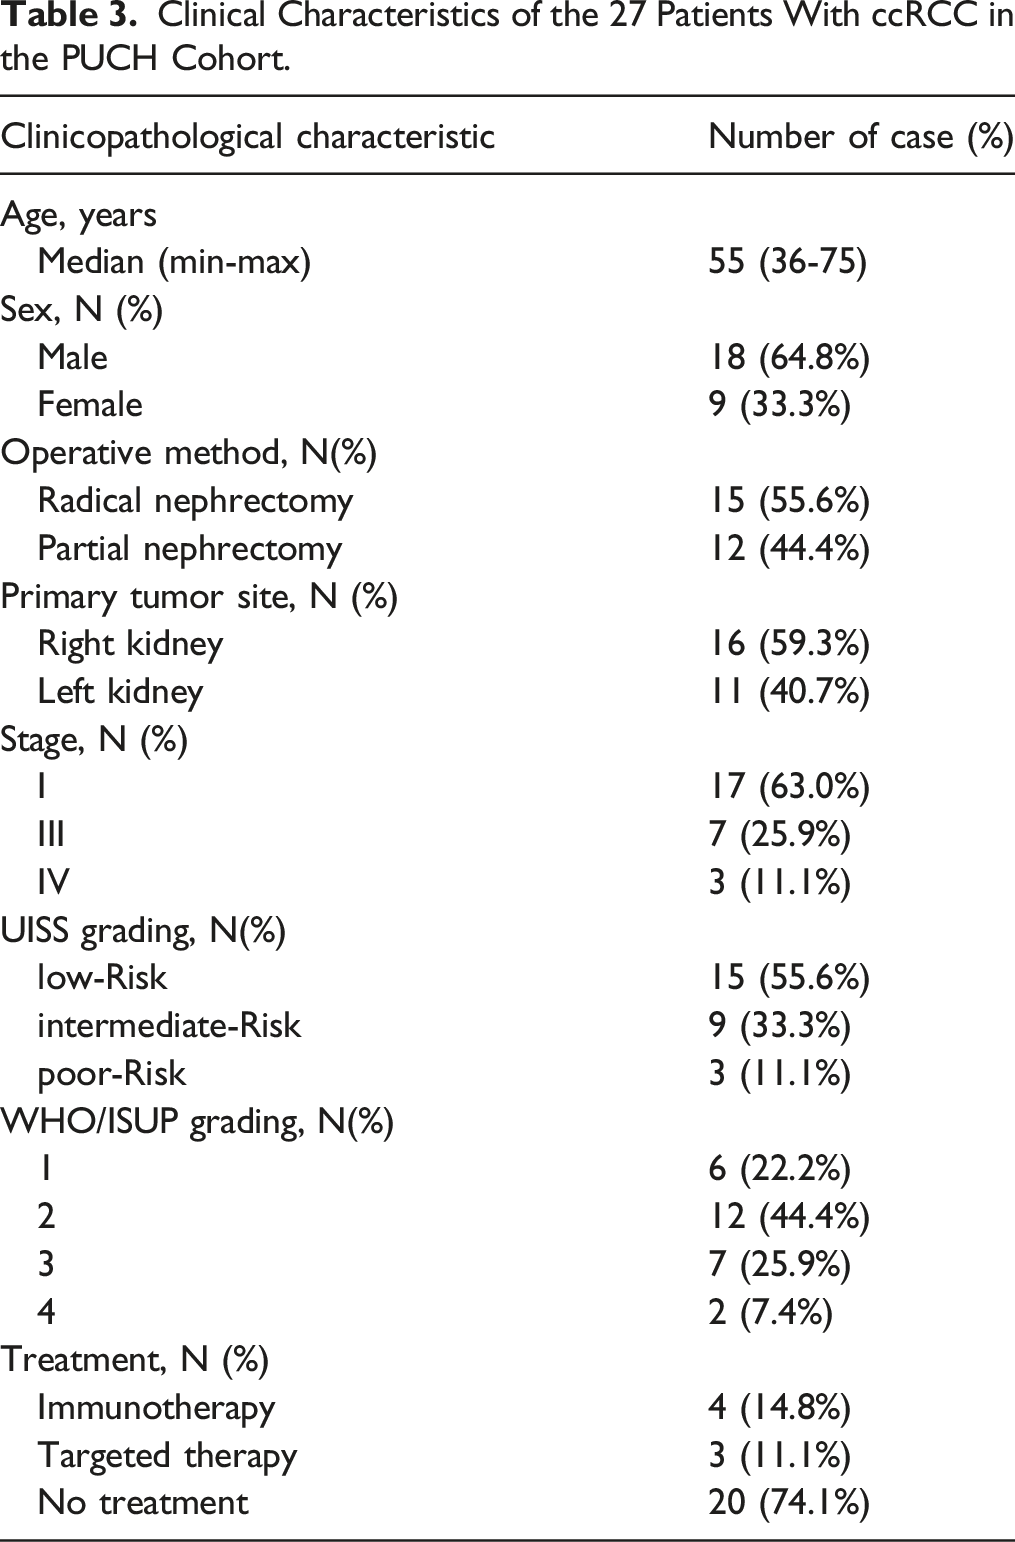
The reporting of this study conforms to the Transparent Reporting of a multivariable prediction model for Individual Prognosis Or Diagnosis statement (TRIPOD) guidelines .23,24 Transcriptome and clinical data of patients with ccRCC were retrieved from the TCGA portal (https://cancergenome.nih.gov/). Immune-related genes (IRGs) were obtained from the Immunology Database Analysis Portal (ImmPort) database. 25 Oncogenic genes (OGs) were obtained from the 10 classic pathways for tumors established previously. 26 We conducted a retrospective study of the PUCH cohort, which was collected from June 2021 to February 2022. Patients with previous anticancer therapy, history of other malignancies (biasing the outcome of prognosis), lack of follow‐up data, lack of pathologic specimens, and perioperative mortality (first month after surgery) were excluded from the analysis. Thus, the final evaluable dataset enrolled 27 ccRCC patients. Every histologic section was independently reviewed by three pathologists to ensure the quality of the specimens.
RNA from tumor and para-tumor tissues was isolated by use of an RNeasy FFPE Kit (Qiagen), and transcriptome-sequencing libraries were constructed with a TruSeq Stranded mRNA Library Prep kit (Illumina). Sequencing was performed using an Illumina Novaseq 6000 instrument. The STAR aligner (v2.7.9a_2021-06-25) (https://code.google.com/archive/p/rna-star/) with default parameters was used to map reads against the reference sequence. 27 Sorting and indexing of the alignment files were performed using Samtools (v.1.10) (https://www.htslib.org/). 28 This study was approved by the Medical Ethics Committee (Approval No. 2021KT35). All procedures in the present study that involved human participants were performed in accordance with the Declaration of Helsinki. All participants provided verbal consent to participate in this study.
Functional Enrichment Analyses and Identification of Differentially Expressed IRGs and OGs
Gene Ontology (GO) and Kyoto Encyclopedia of Genes and Genomes pathway (KEGG pathway) enrichment analyses were performed using the “clusterProfiler” R package. A false discovery rate ≤0.05 in the enrichment analyses was defined as statistically significant. Based on the transcriptome FPKM data of the TCGA kidney clear cell carcinoma dataset, the “DESeq2” 29 package of R was used to compare the tumors and corresponding normal tissues according to the filter criteria (log2|FC| > 2, Padjusted < 0.05). All differentially expressed (DE)-IRGs were identified by the intersection between DE genes (DEGs) and IRGs, while DE-OGs were identified by the intersection between DEGs and OGs. Subsequently, the union of the gene sets of the two intersections was selected to construct a prognostic risk score model.
Construction and Validation of the Prognostic Risk Model
All patients with ccRCC with overall survival (OS) data in the TCGA dataset (n = 530) were randomly divided into the training (n = 353) or testing (n = 177) set at a 2:1 ratio. The risk score model was constructed based on the training set, as follows: First, all DE-IRGs and DE-OGs were screened by univariate Cox proportional hazard regression using the “RTNsurvival” 30 package of R. Second, to further screen for prognostic-related genes, the “glmnet” 31 package of R was used to perform least absolute shrinkage and selection operator Cox (LASSO-Cox) regression analysis. Finally, the risk score was obtained by multiplying the LASSO-Cox regression-retrieved coefficients with the prognostic gene expression level. All patients were divided into two groups according to median risk score. To compare the survival rate between high- and low-risk groups, the Kaplan-Meier survival analysis and logarithmic grade testing were performed. The prediction performance of the model was evaluated in the training, testing, and total datasets using the time-dependent receiver operating characteristic (ROC) and corresponding areas under the curve (AUC).
Construction and Validation of the Nomogram
A nomogram was constructed by integrating clinical characteristics. 32 Its predictive accuracy was determined using the ROC, corresponding AUC, and concordance index (C-index). The clinical utility and net benefits of the nomogram were evaluated using decision curve analysis (DCA). 33
Analysis of Immune Cell Infiltration and Immune Score
To evaluate the infiltration levels of 22 types of immune cells, cell-type identification was performed by identifying relative subsets of RNA transcripts (CIBERSORT) . 34 The stromal score (SS), immune score (IS), and ESTIMATE (Estimation of STromal and Immune cells in MAlignant Tumor tissues using expression data) score (ESTIMATE scores (ES)) for patients with ccRCC were evaluated using the “estimate” 18 package of R. The expression levels of immune checkpoint-associated, T-effector cell- and interferon (IFN)-γ-related genes were compared between the high- and low-risk groups in the TCGA and PUCH cohorts.
Statistical Analysis
All statistical analyses were performed using the R software (version 4.2.2). Differences in clinical characteristics at baseline between the training and testing sets were evaluated using the Fisher’s and Wilcoxon tests for discontinuous and continuous variables, respectively. Differences in risk scores between clinical characteristic subtypes were evaluated using the Wilcoxon and Kruskal-Wallis tests. The Wilcoxon test was also performed to analyze different features between the high- and low-risk groups. The log-rank test was used in the Kaplan-Meier survival curve analysis. P < 0.05 was considered statistically significant.
Results
DE-IRG and DE-OG Identification
The transcriptome data and clinical information of 530 ccRCC and 72 normal tissues were retrieved from the TCGA dataset. We identified 1434 DEGs between the ccRCC and normal tissues, with a cutoff value |log2FC| > 2 and Padjusted < 0.05. GO and KEGG pathway enrichment analyses of these DEGs revealed that they were mainly enriched in immune-related pathways (Supplemental Figures 1A and 1B). Thus, we explored the role of IRGs in ccRCC prognosis. Moreover, OGs from the 10 classic tumor signaling pathways that control cell cycle progression, apoptosis, and cell growth potentially affected the prognosis of patients with tumors and were thus also further evaluated. In total, 2483 IRGs were derived from the ImmPort database, 25 and 335 OGs were obtained from a previous study. 26 The intersection of DEGs and IRGs included 192 genes, while the intersection of DEGs and OGs included 25 genes. Subsequently, a prognostic risk model was constructed by the union set of these two interactions, which included 214 genes (Supplemental Figures 1C and 1D).
Construction and Validation of the Prognostic Risk Score Model
Baseline Clinical Characteristics in the Training and Testing Sets.


Construction of the prognostic risk model using the training set. (A) The least absolute shrinkage and selection operator (LASSO) coefficient profiles for 12 differentially expressed immune-related genes (DE-IRGs) and oncogenic genes (DE-OGs). (B) Partial likelihood deviance with log(λ) changes plotted using the LASSO regression. (C) Distribution of risk scores of the training dataset. (D) Expression patterns of the 12 identified DE-IRGs and DE-OGs in the high- and low-risk groups. (E) Kaplan-Meier curves for overall survival (OS) outcomes in the training dataset grouped into the high- and low-risk groups. (F) Time-dependent receiver operating characteristic (ROC) curves for predicting 1-, 3-, and 5-year survival outcomes.
Risk score = (HMOX1 × −0.039) + (PGF × 0.029) + (ESRRG × −0.066) + (IL20RB × 0.021) + (LTB4R × 0.125) + (CTSE × −0.089) + (MXD3 × 0.196) + (WNT7B × 0.034) + (RNF43 × −0.034) + (PI3 × 0.012) + (HAMP × 0.099) + (RORB × 0.056).
The risk score of every patient in the training set was calculated using the formula (Figure 1C), and all patients were divided into the high- or low-risk group based on the median risk score (median = 2.126). The expressions of the 12 genes in the training dataset are presented in Figure 1D. The OS outcomes was significantly lower in the high-risk group than in the low-risk group (P < 0.0001) (Figure 1E). As shown in Figure 1F, the AUCs of the risk scores for 1-, 3-, and 5-year survival in the training dataset were 0.772, 0.781, and 0.808, respectively.
To delineate the versatility and robustness of the prognostic risk model, we validated it in the testing and total datasets. All patients with ccRCC in the testing or total datasets were divided into high- or low-risk groups based on the median risk score identified in the training dataset (Figure 2A and E). The distribution of gene expression in the testing and total datasets are presented in Figure 2B and F, respectively. Kaplan-Meier survival curves showed a worse survival rate for the high-risk group both in the testing (P = 0.016; Figure 2C) and total datasets (P < 0.0001; Figure 2G). The AUCs for 1-, 3-, and 5-year survival were 0.831, 0.610, and 0.675 in the testing set (Figure 2D) and 0.785, 0.728, and 0.764 in the total dataset (Figure 2H), respectively. Validation of the prognostic risk model in the testing and total datasets. (A, E) Distribution of risk scores of the testing (A) and total datasets (E). (B, F) Expression patterns of 12 immune-associated genes in the high- and low-risk groups in the testing (B) and total datasets (F). (C, G) Kaplan-Meier curves for overall survival outcomes in the testing (C) and total sets (G) divided into the high- and low-risk groups. (D, H) Time-dependent receiving operator characteristic curves for predicting 1-, 3-, and 5-year survival outcomes of the testing (D) and total datasets (H).
Construction and Validation of the Prognostic Risk Model
Univariate and Multivariate Cox Hazard Analysis of Potential Clinical Factors Associated With Overall Survival.


Integration of clinical characteristics to construct the nomogram and assess its predictive performance. (A) Nomogram constructed for predicting probabilities for the 1-, 3-, and 5-year overall survival (OS) outcomes in the training dataset. Risk scores and other independent prognostic clinical factors are incorporated into the nomogram. (B) Receiving operator characteristic curve analysis for predicting 1-, 3-, and 5-year OS in the training, testing, and total datasets using the nomogram. (C, D, E) Decision curve analysis for the 1-, 3-, and 5-year risk predictions of the nomogram and other clinical factors in the training (C), testing (D), and total (E) datasets.
DCA assessed the predictive ability of the nomogram and revealed that it had the best net benefit for predicting the 1-, 3-, and 5-year risk outcomes compared with age, stage, grade, and risk score. The risk score and stage had comparable net benefits, which were both better than age and grade (Figure 3C–E).
Associations Between the Prognostic Risk Model and Clinical Characteristics
Clinical Characteristics of the 27 Patients With ccRCC in the PUCH Cohort.
Stratification survival analyses were performed to assess the predictive performance of the risk model in multiple subgroups sorted by age (<55 and ≥55 years), sex (male and female), clinical stage (stages I-II and stages III-IV), and tumor grade (grades 1-2 and grades 3-4) in the TCGA dataset. The Kaplan-Meier survival curve analysis indicated that patients in the high-risk group presented worse OS outcomes than those in the low-risk group in all subgroups (P < 0.05; Supplemental Figure 2C). These results demonstrate that the prognostic risk model performed reliably in predicting ccRCC prognosis.
Differences in Immune Cell Infiltration and IS between the High- and Low-Risk Groups of Patients with ccRCC
The comparisons of the immune cell infiltration levels between the high- and low-risk groups in the TCGA and PUCH cohorts are presented in Figure 4A and C, respectively. The clustering of the immune cells that have a nonzero proportion in more than half of the samples is shown in Figure 4B and D. Analyses of immune cell infiltration levels in The Cancer Genome Atlas (TCGA) and PUCH cohorts between the high- and low-risk groups. (A, C) Boxplots for the different immune cell infiltration levels in the high- and low-risk groups in the TCGA (A) and PUCH cohorts (C). (B, D) Immune cell heatmap for patients in the TCGA (B) and PUCH cohorts (D) in the high- and low-risk groups. Only immune cells whose nonzero proportions exceeded half in all samples are plotted. *P < 0.05, ** represents P < 0.01, ***P < 0.001, and **** P < 0.0001. (E, F) Boxplot of the stromal scores (SSs), immune scores (ISs), and ESTIMATE scores (ESs) between the high- and low-risk groups in the TCGA (E) and PUCH cohorts (F).
In the high-risk group of the TCGA dataset, the infiltration levels of naïve B cells (P < 0.001), resting dendritic cells (P < 0.0001), eosinophils (P < 0.001), M1 macrophages (P < 0.05), resting mast cells (P < 0.0001), and monocytes (P < 0.05) were lower, whereas the infiltration levels of M0 macrophages (P < 0.0001), plasma cells (P < 0.001), CD8+ T-cells (P < 0.01), follicular helper T-cells (P < 0.01), and Treg cells (P < 0.0001) were higher (P < 0.05) (Figure 4A and B). In the PUCH cohort, the high-risk group had a lower resting mast cell infiltration level (P < 0.05) and a higher CD8+ T-cell infiltration level (P < 0.05) than the low-risk group (Figure 4C and D).
The SS, IS, and ES were evaluated between the high- and low-risk groups. In the TCGA dataset, the SS, IS, and ES were higher in the high-risk group (Figure 4E). In comparison, in the PUCH cohort, the IS and ES were higher in the high-risk group than those in the low-risk group. However, the SS did not significantly differ between the two groups (Figure 4F).
Differences in the Immune Checkpoint and T-effector cell- and IFN-γ-related gene Expression between High- and Low-risk Groups
In total, 74 immune checkpoint-associated genes were selected (Supplemental Table 2),
35
with 42 and 32 genes being immunosuppressive and immune-activating, respectively. Genes with P < 0.1 for comparison between the high- and low-risk groups were selected for clustering, which showed that the overall expression of immune checkpoint-associated genes was higher in the high-risk group than in the low-risk group in both the TCGA (Figure 5A, Supplemental Table 3) and PUCH cohorts (Figure 5B, Supplemental Table 4). Thirteen T-effector cell- and IFN-γ-related genes were selected (Supplemental Table 5)
36
; in the TCGA dataset, the expression of the T-effector cell- and IFN-γ-related cytotoxic genes TBX21, CCL4, CCL5, GBP5, and EOMES were higher; however, GBP4 expression was lower in the high-risk group than that in the low-risk group (P < 0.05; Figure 5C, Supplemental Table 6). In the PUCH cohort, GBP4, PRF1, CCL4, IFNG, GBP5, and EOMES expression was higher in the high-risk group than in the low-risk group (P < 0.05; Figure 5D, Supplemental Table 7). Differentially expressed immune checkpoint-associated and T-effector cell- and interferon (IFN)-γ-related genes in the high- and low-risk groups of The Cancer Genome Atlas (TCGA) and PUCH cohorts. (A, B) Heatmap of the expression of immune checkpoint-associated genes in the TCGA (A) and PUCH cohorts (B). (C, D) Heatmap of T-effector cell- and IFN-γ-related gene expression in the TCGA (C) and PUCH cohorts (D). Asterisks indicate genes significantly differentially expressed between the high- and low-risk groups (P < 0.05).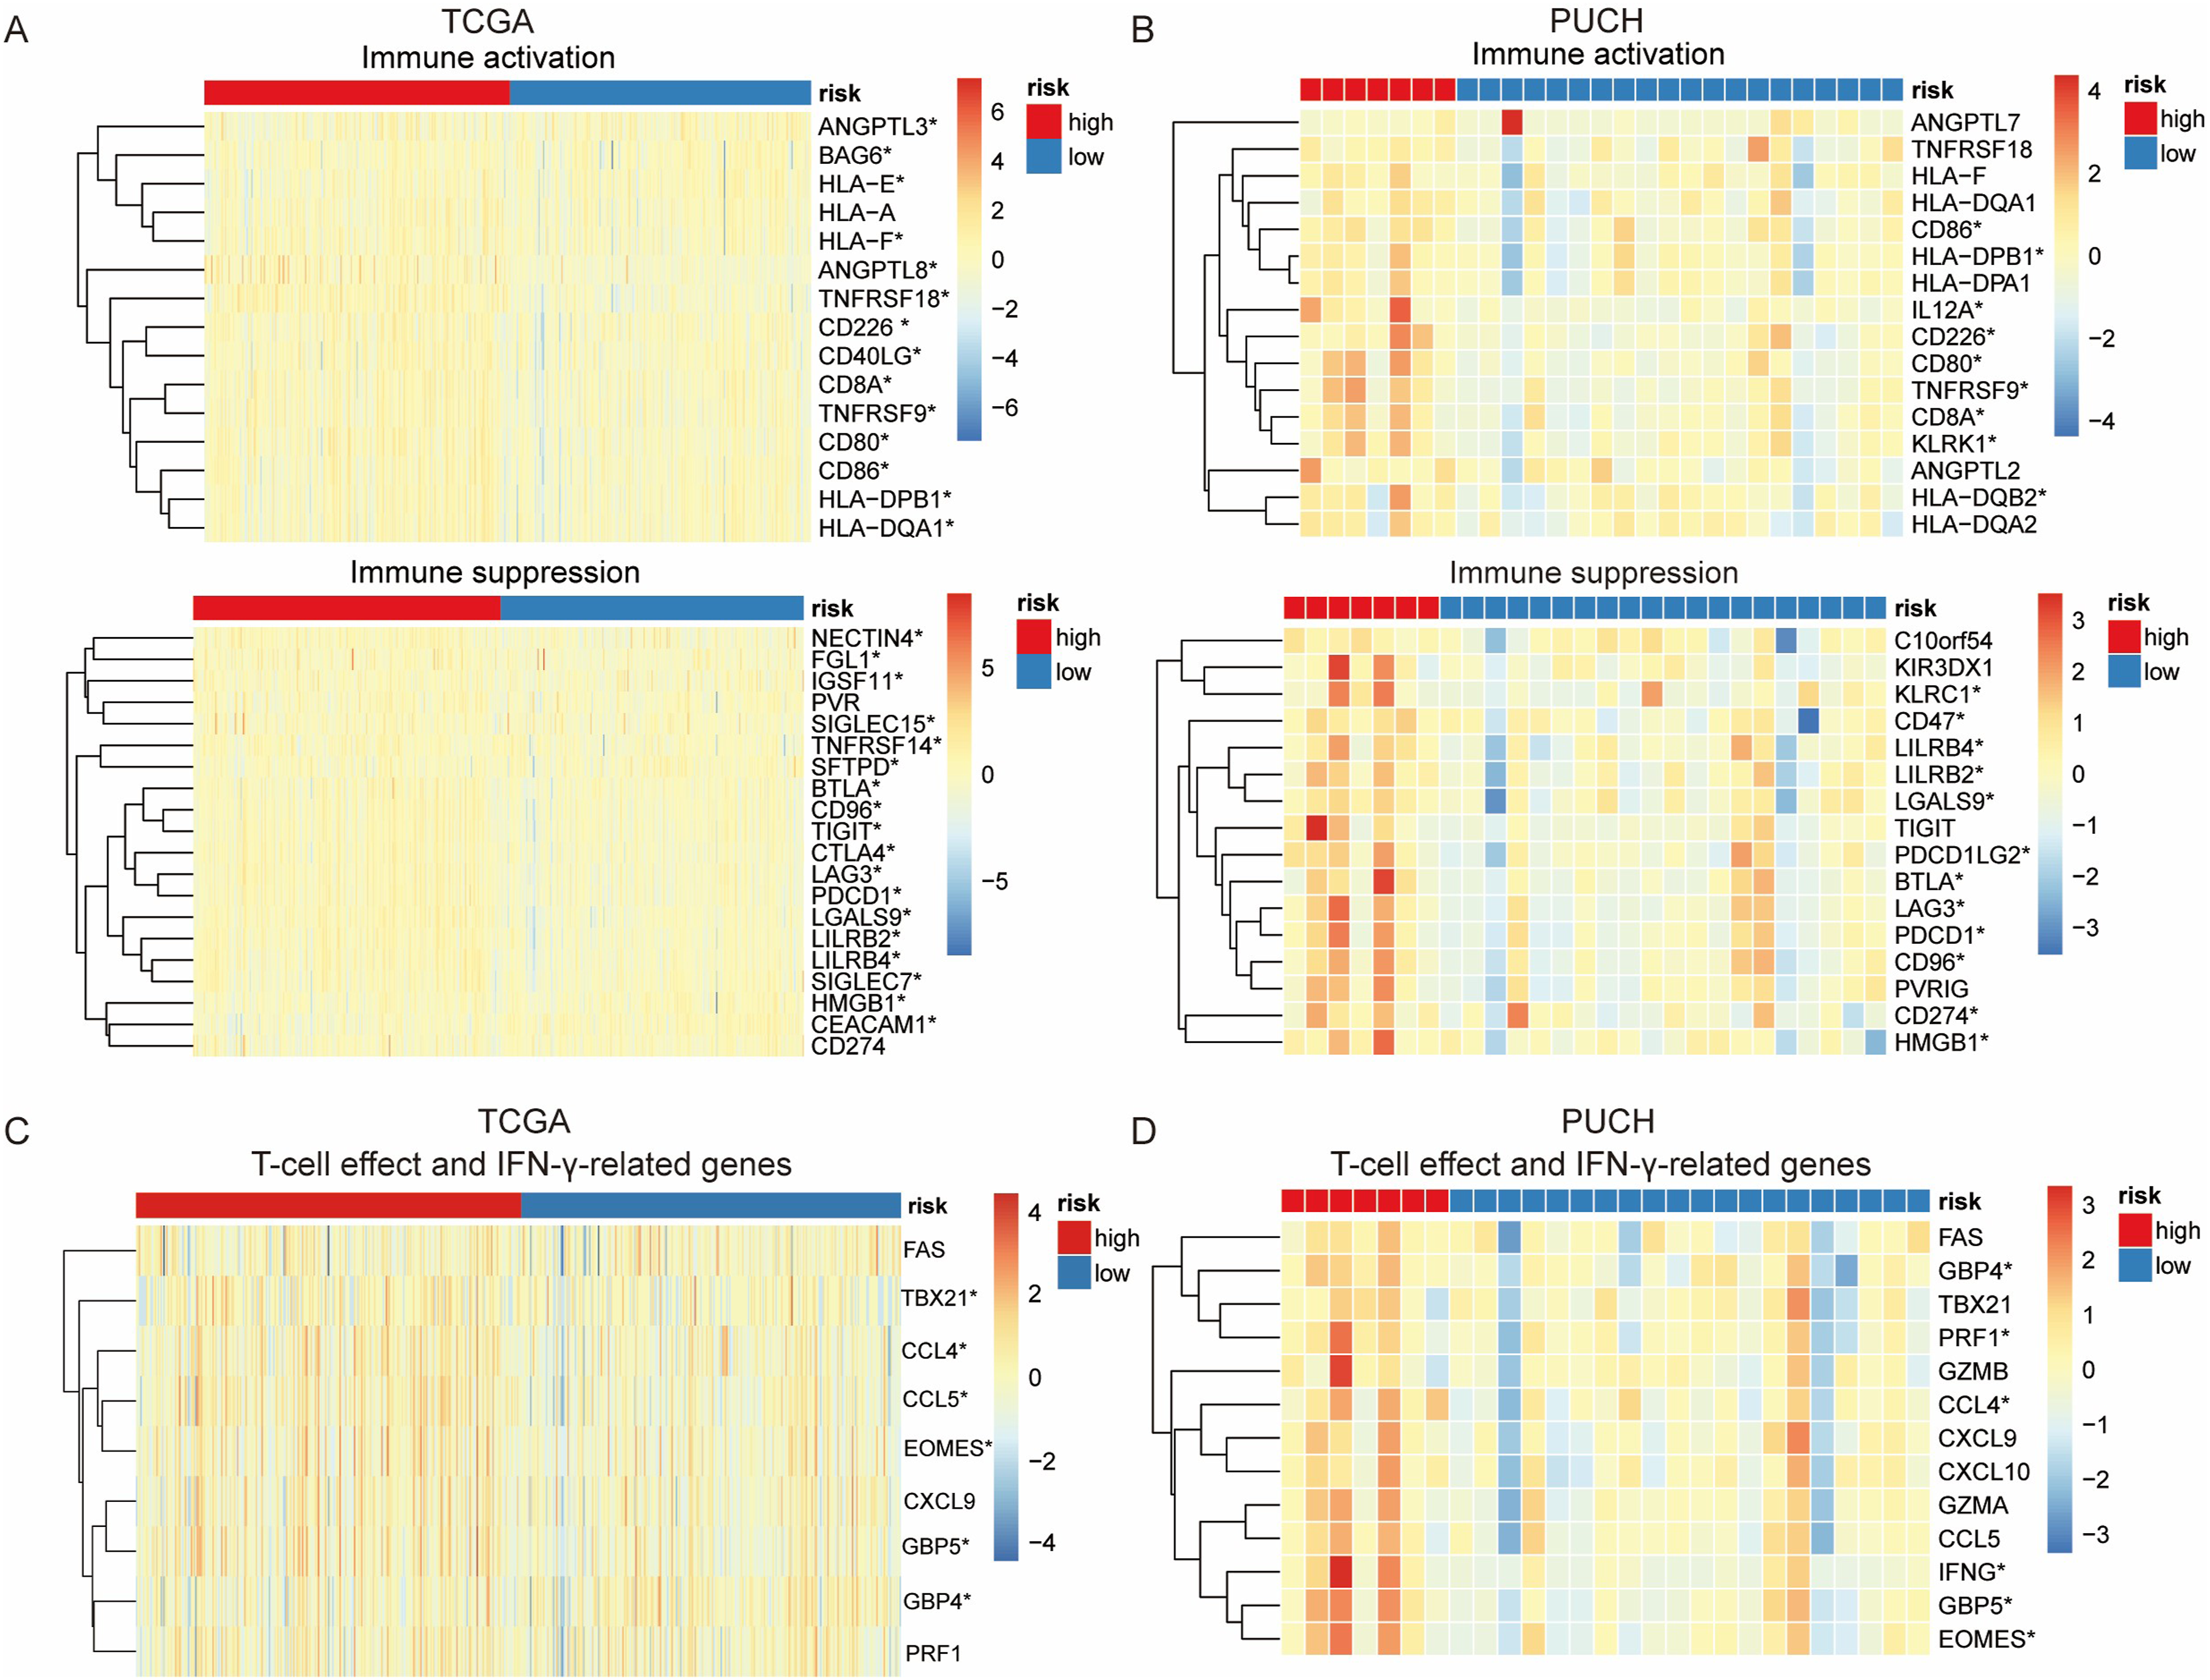
Discussion
The National Comprehensive Cancer Network guidelines recommend the use of prognostic risk models for guiding clinical decisions. 37 To our knowledge, for patients with early-stage RCC who underwent radical nephrectomy, the UISS and SSIGN were the main prognostic models and both were based on postoperative pathological findings, including TNM staging and Fuhrman grade. For metastatic RCC, the IMDC and MSKCC prognostic models mainly relied on biochemical indicators.8-13 These models often fail to consider the influence of gene expression on ccRCC. IRGs have gradually gained attention through in-depth tumor microenvironment studies. Their predictive value for ccRCC prognosis may be a useful supplementary to the current prognostic models. In this study, we constructed a prognostic model for ccRCC based on the expression of IRGs and OGs.
The prognostic risk model consisted of 12 IRGs and OGs, most of which have been previously identified as potential biomarkers for the prognosis of patients with malignancies. HMOX1, 38 ESRRG, 39 and RNF4340,41 are all associated with ccRCC prognosis, and higher expression levels better prognosis, which is consistent with our findings. Xu et al 42 reported that the activation of the HMOX1 pathway may impede the function of antitumor CD8 T-cells in the tumor microenvironment. Thus, HMOX1 was identified as a potential predictive biomarker for immunotherapy plus tyrosine kinase inhibitor therapy in RCC. Nam et al 43 demonstrated that ESRRG inhibited the migratory and invasive behaviors of RCC cells. Exosomal miR-181d-5p derived from cancer-associated fibroblasts directly inhibits the expression of RNF43 and activates the Wnt/β-catenin signaling pathway in RCC cells, thereby promoting cancer stemness and tumor progression. 44 High serum concentrations of PGF markers have been associated with a high-risk of recurrence. 45 The high expression of PI3, 46 HAMP, 47 MXD3,48,49 and WNT7B 50 are associated with poor ccRCC prognosis. PI3 encodes an inhibitor specific to elastase that functions as an antimicrobial peptide.51,52 Caruso et al demonstrated that PI3 is a predictor of poor outcomes in ovarian and breast cancers and may play a role in tumor dormancy. Furthermore, PI3 is an important therapeutic target for breast and ovarian carcinoma53-55; however, the specific mechanism still needs to be investigated. HAMP, a ferroptosis-related gene, has a potentially important role in the diagnosis and prognosis ccRCC, and its expression has been positively correlated with immune infiltration in ccRCC. 56 IL20RB is a potential prognostic and therapeutic biomarker for ccRCC. 57 LTB4R promotes the occurrence and progression of ccRCC by regulating the AKT/mTOR signaling pathway. 58 An immune-related prognostic model identified RORB as a predictive factor of ccRCC. 59 The 12 genes used in the prognostic model of the current study were primarily associated with signaling pathways such as ferroptosis, the Wnt/β-catenin signaling pathway, CD8+ T-cell function, and tumor migration. Hence, these signaling pathways possibly contribute to the shaping of the TIME. Meanwhile, the present study is unique in that it considers the combined effects of the 12 genes on the prognosis and TIME of patients with ccRCC rather than solely focusing on the roles of individual genes.
Furthermore, our prognostic risk model reliably predicted the survival probability based on age, sex, stage, and grade in the TCGA dataset and can differentiate patients into high- and low-risk groups in similar staging and grading subsets. These findings demonstrate that gene expression-based models can predict prognosis more accurately than, for example, clinical staging and grading.
The TIME analysis based on the TCGA or PUCH cohorts showed that the high proportion of CD8+ T-cells was associated with poor prognosis, which was consistent with previous reports. CD8+ T-cell level has been associated with poor metastatic ccRCC prognosis. 60 In a more detailed analysis, the intratumoral heterogeneity of ccRCC analysis based on single-cell transcriptome sequencing showed that a higher proportion of exhausted CD8+ T-cells was associated with a worse prognosis. 61
Similar to our results in the TCGA dataset, Wang et al 62 found that M1 macrophages, resting dendritic cells, and resting mast cells were more enriched in the low-risk group with better ccRCC prognosis, whereas M0 macrophages, plasma cells, follicular helper T-cells, and Treg cells were more enriched in the high-risk group. Expectedly, the low-risk group had a better ccRCC prognosis than the high-risk group. However, we identified some unique cell types enriched in the low-risk group that may play a significant role in antitumor immunity, including naïve B cells, eosinophils, and monocytes. Previous studies have shown that naïve B cells differentiate into extrafollicular B cells; subsequently, extrafollicular B cells generate memory B cells and long-lived antibody-secreting cells. 63
Previous studies have associated increased resting dendritic cells, resting mast cells, and eosinophil levels with improved ccRCC prognosis, 64 which is consistent with our results. Moreover, further studies have reported that, despite different clusters being classified according to the expression levels of ferroptosis regulators, monocytes were enriched in the cluster with good ccRCC prognosis. 65 Similarly, in our study, the high- and low-risk groups were divided according to different criteria; however, monocytes were frequently enriched in the low-risk group. These observations indicate that various predictive classification systems for ccRCC prognosis eventually affect prognosis by influencing the TIME. However, a study that included 375 patients with RCC showed that intratumoral CD14+ monocytes were associated with decreased survival in RCC s. 66 These varying results indicate that subpopulations of monocytes play different role in the TIME, thereby variously affecting the prognosis of patients with RCC.
A previous study reported that a higher IS was associated with worse prognosis in patients with ccRCC and was positively associated with tumor grade, stage, T stage, and M stage. 67 We obtained similar results regarding the poor prognosis of patients with high IS. Moreover, we compared the expression of 74 immune checkpoint-associated genes between the high- and low-risk groups. The high-risk group had higher expression levels in both immune activation and suppression genes, demonstrating that immune cell function disorders occur in high-risk patients, which induce immunosuppression and tumor progression, promotion, and escape.68,69
With the advancement of tumor genetics and the utilization of next-generation sequencing (NGS) technology in tumor treatment, the identification of tumor treatment and prognosis models based on tumor transcriptome and genomic data will significantly contribute to the development of personalized and precise cancer treatment. Currently, research in this field primarily relies on public databases, which may have limited sample sizes for validating prediction models and even lack validation across multiple independent cohorts. Similar limitations were identified in our study, despite performing validation studies within the PUCH cohort. Therefore, the prognostic risk model also lacks validation in other independent cohorts, which necessitates a future large-scale randomized controlled trial. NGS is being increasingly employed in clinical practice and can help develop more accurate prediction models to guide the clinical management of ccRCC. Although some mechanisms involved in shaping the tumor microenvironment have been proposed, the mechanism underlying a worse prognosis remains unclear. Experimental and clinical studies on the TIME of ccRCC need to be performed to further understand its role and functions. These studies would help elucidate the mechanism of the TIME and the mechanism of action on tumor therapy. Only survival time was used as an indicator for prognostic evaluation in this study. ccRCC responds positively to immunotherapy; thus, prognostic analyses should consider a wider range of indicators and influencing factors, such as QoL, 70 sex, 71 and ECOG performance status. 72 More measures in independent cohorts also need to be considered in the future to obtain more accurate clinical prognostic models. With the accumulation of patient clinical data and tumor NGS data, more accurate prediction models are expected to be developed to guide the clinical management of ccRCC based on an expanded range of factors.
Conclusions
We constructed a prognosis risk model consisting of 12 IRGs and OGs that can be used as independent prognostic markers for patients with ccRCC. Furthermore, the model was strongly associated with the TIME of ccRCC.
Supplemental Material
Supplemental Material - Construction of a 12-Gene Prognostic Risk Model and Tumor Immune Microenvironment Analysis Based on the Clear Cell Renal Cell Carcinoma Model
Supplemental Material for Construction of a 12-Gene Prognostic Risk Model and Tumor Immune Microenvironment Analysis Based on the Clear Cell Renal Cell Carcinoma Model by Shuo Wang, Ziyi Yu, Yudong Cao, Peng Du, Jinchao Ma, Yongpeng Ji, Xiao Yang, Qiang Zhao, Baoan Hong, Yong Yang, Yanru Hai, Junhui Li, Yufeng Mao, and Shuangxiu Wu in Cancer Control.
Footnotes
Acknowledgments
We would like to thank all patients for their contribution and the Genetron Health, Inc for its contribution to sequencing.
Author Contributions
Peng Du and Shuo Wang designed the study. Shuo Wang, Ziyi Yu, Jinchao Ma, Peng Du, Yudong Cao, Yongpeng Ji, Xiao Yang, Qiang Zhao, Baoan Hong, and Yong Yang performed the study. Shuo Wang, Ziyi Yu, Jinchao Ma, Peng Du, Yudong Cao, Yongpeng Ji, Xiao Yang, Qiang Zhao, Baoan Hong, Yong Yang, Junhui Li, Yufeng Mao, and Shuangxiu Wu analyzed the data. Peng Du, Shuo Wang, Yudong Cao, Ziyi Yu, and Jinchao Ma wrote the manuscript draft, Peng Du, Shuo Wang, Yudong Cao, Ziyi Yu, Jinchao Ma, and Junhui Li revised the manuscript. Yanru Hai performed bioinformatics analysis and visualization of the figures. All authors have read and agreed to the published version of the manuscript.
Declaration of conflicting interests
The author(s) declared the following potential conflicts of interest with respect to the research, authorship, and/or publication of this article: Yanru Hai, Junhui Li, Yufeng Mao and Shuangxiu Wu are from Genetron Health (Beijing) Technology, Co Ltd The other authors have no conflict of interest to disclose.
Funding
The author(s) disclosed receipt of the following financial support for the research, authorship, and/or publication of this article: This work was supported by the Science Foundation of Peking University Cancer Hospital (2021-7) and Capital’s Funds for Health Improvement and Research (2022-1G-1021).
Ethical Statement
Data Availability Statement
Supplemental Material
Supplemental material for this article is available online.
References
Supplementary Material
Please find the following supplemental material available below.
For Open Access articles published under a Creative Commons License, all supplemental material carries the same license as the article it is associated with.
For non-Open Access articles published, all supplemental material carries a non-exclusive license, and permission requests for re-use of supplemental material or any part of supplemental material shall be sent directly to the copyright owner as specified in the copyright notice associated with the article.