
Abstract
Background
Heat shock factor 1 (HSF1), the principal transcriptional regulator of cellular stress responses, has been exhibited to play a role in the progression of various human cancer types. However, the function of HSF1 in endometrial cancer (EC) has not yet been evaluated.
Objective
This study examined the expression and role of HSF1 in EC.
Methods
Immunohistochemistry was performed to explore HSF1 level in 135 endometrial tissue specimens. The relationship between HSF1 level and EC patients’ clinicopathological characteristics was analyzed. Quantitative reverse-transcriptase polymerase chain reaction (qRT-PCR) and Western blotting were employed to explore HSF1 expression level in tissues in vitro. Small interfering RNA (siRNA) was employed to suppress HSF1 expression level. The invasion and migration capacities were evaluated using transwell and wound healing assays. Cell cycle arrest and apoptosis were assessed by flow cytometric analysis.
Results
EC tissues exhibited higher HSF1 expression level compared with normal endometrial and atypical endometrial hyperplasia tissues. High HSF1 expression level was associated with histological grade, muscular invasion, lymph node metastasis, and estrogen receptor (ER) expression level in EC tissues and cells. Kaplan–Meier analysis indicated that EC patients with elevated HSF1 expression level had poorer overall survival. Knockdown of HSF1 in EC cells resulted in cell cycle arrest, increased apoptosis, and inhibited EC cell proliferation, invasion, and migration.
Conclusion
The results demonstrated that HSF1 could function as an oncogene in EC. HSF1 could play a notable role in EC progression. HSF1 may be a potential molecular target for both the treatment and prognosis of patients with EC.
Introduction
Endometrial cancer (EC) is the most common gynecological cancer in several countries, and its incidence is rising globally. 1 Patients with endometrial carcinoma mainly face poor prognosis and high mortality due to the invasion and metastasis occurring in the early stage. Despite significant advances in surgery and chemotherapy over the recent decades, therapeutic failure and disease progression are still quite frequent.2,3 Therefore, there is an urgent requirement for proposing new biomarkers for EC, so as to develop more efficacious diagnostic and therapeutic strategies.
Heat shock factors (HSF) contain four subtypes, involving HSF1, HSF2, HSF3, and HSF4. 4 HSF1, a notable transcription factor in the heat shock response, consists of 529 amino acids and is composed of four domains: DNA binding domain (DBD), trimerization domain (TD), regulatory domain (RD), and transcriptional activation domain (TAD). It also includes two highly conserved nuclear regions: the TD and DBD.5,6 It is mainly assumed that these effects are mediated through regulation of heat-shock protein (HSP) expression. However, the transcriptional network directly coordinated by HSF1 in malignancy and its relationship with the heat-shock response have never been defined. 7 It was recently found that HSF1 contributes to the development of malignant tumors not only by regulating HSP genes, but also by individually or collectively influencing cancer-causing genes. 8 Researches demonstrated that HSF1 is highly expressed in a variety of malignant tumors, such as colon cancer, breast cancer, prostate cancer, liver cancer, lung cancer, etc..5,8 It is closely associated with the development, invasion, and metastasis of tumors.9–11 High expression level of HSF1, which is associated with estrogen level, is also related to breast cancer patient's prognosis. 8 Thus, HSF1 may be a potential target for EC and may lead to improved diagnosis and treatment strategies for the disease. To date, few studies have concentrated on HSF1 expression and function in EC, and this study aimed to explore HSF1 expression level in EC and the related mechanism.
The present study examined HSF1 expression level in EC tissues and cell lines, exploring its correlations with various clinicopathological parameters and estrogen receptor (ER) status. Furthermore, the functional roles of HSF1 expression level in EC cell lines were determined. The results could be valuable to evaluate the potential of HSF1 as a novel biomarker for EC.
Materials and methods
Patients and specimens
This study was approved by the Ethics Committee of the Fourth Military Medical University (Xi'an, China). For immunohistochemical analysis, 135 patients with endometrial lesions who underwent diagnostic curettage or surgical treatment at Xijing Hospital (Xi’an, China) between January 2011 and January 2013 were included in this study. There were 17 cases of normal endometrial tissue, 28 cases of atypical endometrial hyperplasia, and 90 cases of EC tissue. Patients’ ages ranged from 30 to 77 years, with a mean age of 54.6 (54.6 ± 9.3) years. Clinical data were obtained from electronic medical databases, and tumors were staged according to the International Federation of Gynecology and Obstetrics (FIGO) guidelines. None of the patients received chemotherapy or adjuvant treatments preoperatively. The study's protocol was approved by the Ethics Committees of Xijing Hospital, and informed consent was obtained from each patient before sample collection.
Immunohistochemistry
The 4-μm thick sections were fixed in 10% formalin, followed by embedded into paraffin. The slices were deparaffinized with xylene and dehydrated with graded alcohols. Endogenous peroxidase activity was quenched by 0.3% hydrogen peroxide, and antigen retrieval was performed using 0.01 mol/L citric acid buffer. Nonspecific binding was blocked using 10% normal goat serum at 37 °C for 30 min. The primary antibodies for HSF1 (1:250, ab52757; Abcam, Cambridge, UK) and ER (1:300, sc-8002; Santa Cruz Biotechnology Inc., Dallas, TX, USA) were incubated overnight at 4 °C, followed by incubation with anti-rabbit/mouse IgG-horseradish peroxidase (1:500; Zhongshan, China) at 37 °C for 30 min. Then, the sections were incubated with standard DAB reagents and lightly counterstained with hematoxylin. After serial dehydration, the slides were mounted for microscopic examination. Finally, the results were evaluated microscopically by two independent pathologists; in cases of conflicting opinions, a third independent pathologist was consulted for resolution. The intensity of HSF1/ER staining was scored as follows: 0 (no signal), 1 (weak), 2 (moderate), and 3 (strong). The percentage of positive cells was scored as 1 point for 1–25%, 2 points for 26–50%, 3 points for 51–75%, and 4 points for 76–100%. The intensity and percentage scores were multiplied to yield a final score ranging from 0 to 12 points. Tumors were classified as negative (−) for a score of 0 points, low expression (+) for scores ≤4 points, moderate expression (++) for scores 5–8 points, and high expression (+++) for scores ≥9 points. 12 In the present study, all the samples were grouped into the low-expression group (overall score, 0–4 points), the moderate-expression group (overall score, 5–8 points), and the high-expression group (overall score, 9–12 points).
Cell lines and cell culture
Human EC cell lines (HEC-1B, Ishikawa, and RL95-2) and human endometrial epithelial cells were purchased from the Cell Bank of Type Culture Collection of the Chinese Academy of Sciences (Shanghai, China). HEC-1B cell line was cultured in a Dulbecco's modified Eagle's medium (DMEM)/high-glucose (HyClone, Logan, UT, USA) supplemented with 10% fetal bovine serum (FBS) and 1% penicillin-streptomycin. Ishikawa and human endometrial epithelial cells were cultured in a DMEM (GIBCO, Waltham, MA, USA) supplemented with 10% FBS and 1% penicillin-streptomycin. RL95-2 cells were cultured in a DMEM/F-12 (GIBCO) supplemented with 10% FBS, 10 µg/ml insulin (Sigma-Aldrich, StLouis, MO, USA), and 1% penicillin-streptomycin (Invitrogen, Carlsbad, CA, USA). All cells were cultured in a humidified incubator at 37 °C with 5% CO2 atmosphere.
RNA interference
For the knockdown of HSF1 using small-interfering RNA (siRNA), HSF1 siRNA (siHSF1) was transfected into Ishikawa cells using Lipofectamine™ 2000 reagent (Invitrogen) according to the manufacturer's instructions. Three groups were established: one with specific siRNAs targeting HSF1, one with a nonspecific control using non-targeting siRNAs (siNC), and a control group. Gene knockdown was assessed in the transfected cells 24 h post-transfection. The sequences of oligoRNAs were as follows: siHSF1, sense siRNA: 5’-GCACAUUCCAUGCCCAAGUTT-3’, and anti-sense siRNA: 5’-ACUUGGGCAUGGAAUGUGCTT −3’; siNC, sense: 5'-UUCUCCGAACGUGUCACGUTT-3’; anti-sense: 5'-ACGUGACACGUUCGGAGAATT-3’. The siNC was used as the negative control.
Quantitative reverse-transcriptase polymerase chain reaction (qrt-PCR)
TRIzol reagent (Invitrogen) was used to extract total RNA from different cells. The qRT-PCR was conducted using 2×SYBR-Green PCR Master Mix (Applied Biosystems, Waltham, MA, USA) and Premix Ex Taq reagent (TaKaRa, Shiga, Japan) on an Mx4000 Multiplex QPCR System (Stratagene, La Jolla, CA, USA). The cycling program was initiated at 95 °C for 3 min and 40 cycles of 94 °C for 30 s, 59 °C for 30 s, and 72 °C for 1 min, and a final step of 10 min at 72 °C. The results were normalized as the ratio of absolute mRNA copy numbers of HSF1 to those of GAPDH, which were calculated using standard curves that were obtained from dilutions of precisely quantified template plasmid. The primers used were summarized as follows: HSF1, forward primer (5’-GCACATTCCATGCCCAAGTAT-3’) and reverse primer (5’-GGCCTCTCGTCTATGCTCC-3); ER, forward primer (5’-TTATGGAGTCTGGTCCTGTGAG) and reverse primer (5’-TCCTCTTCGGTCTTTTCGTATC-3’); HSP90, forward primer (5’-GCCTTCTATTTGTCCCACG-3’) and reverse primer (5’-ATCCTCCGAGTCTACCAC-3’); MMP2, forward primer (5’-GGATGATGCCTTTGCTCG-3’) and reverse primer (5’-ATCCTCCGAGTCTACCAC-3’); MMP9,(5’-TCCCTGGAGACCTGAGAACC-3’) and reverse primer (5’-GGCAAGTCTTCCGAGTAGTTT-3’); CDH1(E-cadherin), forward primer (5’-AGGCCAAGCAGCAGTACATT-3’) and reverse primer (5’-ATTCACATCCAGCACATCCA-3); CTNNB1 (β-catenin), forward primer(5’-GAAACGGCTTTCAGTTGAGC-3’) and reverse primer (5’-CTG GCCATATCCACCAGAGT-3’); GAPDH, forward primer (5’-GTCACCAGGGCTGCTTTTAAC-3’) and reverse primer (5’- GACAAGCTTCCCGTTCTCAG-3’). Data were analyzed using the comparative Ct method, and GAPDH expression level served as the normalization control for each sample (relative quantity, 2−ΔΔCt).
Western blot analysis
Cells were lysed in precooled radioimmunoprecipitation assay buffer (RIPA), containing protease inhibitor cocktail. Cell protein concentrations were determined by a BCA protein assay kit (Pierce, New York, NY, USA). Equal amounts of protein lysate were separated using 10% sodium dodecyl sulfate-polyacrylamide gel electrophoresis (SDS-PAGE), followed by transferring onto polyvinylidene difluoride (PVDF) membranes (Millipore, Burlington, MA, USA). Subsequently, the membranes were blocked with 1% bovine serum albumin (BSA) for 2 h at room temperature and incubated with HSF1 (1:5000, ab52757, Abcam), ER (1:1000, sc-8002, Santa Cruz Biotechnology), HSP90 (1:1000, sc-69703, Santa Cruz Biotechnology), MMP2 (1:1000, sc-13595, Santa Cruz Biotechnology), MMP9 (1:1000, sc-393859, Santa Cruz Biotechnology), E-cadherin (1:1000, sc-8426, Santa Cruz Biotechnology), β-catenin (1:1000, sc-7963, Santa Cruz Biotechnology), and β-actin (1:5000, ab8227, Abcam) at 4°C overnight, followed by incubation with peroxidase-conjugated secondary antibody (Santa Cruz Biotechnology) at room temperature for 1 h. Protein expression levels were quantified using Quantity One software to measure the intensity of the protein bands.
Wound healing assay
Cells were cultured in 24-well plates at a density of 2 × 10⁴ cells per well, and a small wound area was created using a sterilized pipette tip to generate a linear scratch. Then, the cells were twice rinsed with phosphate-buffered saline (PBS) and cultured in a fresh culture medium. The wound closure was monitored under a microscope at 0 and 48 h after the wounding. Photos were taken under a magnification of ×40 (Olympus, Tokyo, Japan), and the degree of cell migration was quantified by pixel through ImageJ software.
Cell migration and invasion assays
Migration and invasive abilities were evaluated by 24-well chamber with 8-μm pore size polycarbonate membrane filter (Corning Costar Corp., Dallas, TX, USA). Invasion chamber was identical to migration chamber, while the filter was pre-coated with 200 mg/ml Matrigel (BD Biosciences, San Jose, CA, USA). The upper chambers were filled with the serum-free DMEM, while the lower chambers were filled with standard DMEM containing 10% FBS as chemoattractant. About 3 × 10⁵ cells were added to the upper chamber and allowed to migrate for 48 h. Afterward, the non-migration cells on the upper surface of the filters were removed gently by a cotton-tip swab. Cells on the lower surface of the chamber were fixed in methanol, stained with 0.1% crystal violet, and five random fields were counted and photographed.
Flow cytometric analysis of cell cycle progression and cellular proliferation
The Ishikawa cells were transfected with specific siRNAs (siNC, siHSF1) 48 h prior to analysis. For cell cycle analysis, cells were detached from the culture plates using trypsin without EDTA (Gibco), and then twice washed with ice-cold PBS. Next, cells were fixed with 70% ice-cold ethanol. Thereafter, cells were collected by centrifugation and resuspended in PBS containing RNase (100 μg/ml) and propidium iodide (PI) (40 μg/ml, BD Biosciences), followed by incubation at 37 °C for 1 h. Finally, the cell cycles were analyzed by the FACS scan flow cytometer (BD Biosciences), and the relative proportions of G1, S, and G2 phases were analyzed by FlowJo 2.8 software.
Flow cytometric analysis of apoptosis
The Ishikawa cells were transfected with specific siRNAs (siNC, siHSF1) 48 h prior to analysis. Cells were harvested and suspended in PBS at a density of 1 × 10⁶cells/mL. Cell apoptosis analysis was performed by the CYTOMICS FC 500 flow cytometer (Beckman Coulter, Brea, CA, USA). Cells were stained with the Annexin V-fluorescein isothiocyanate (FITC) and PI (BD Biosciences) for 15 min in the dark at room temperature.
Statistical analysis
SPSS 20.0 software (IBM, Armonk, NY, USA) was used to statistically analyze the data. Chi-square test or the Fisher's exact test, as appropriate, was used to evaluate the correlations between immunohistochemical expression and the clinical variables. Student's t-test and one-way analysis of variance (ANOVA) were employed to compare differences in Western blot analysis, wound healing assay, migration, and invasion. Survival curves were generated using the Kaplan-Meier method, and survival analysis was performed through the log-rank test. Two-sided P < 0.05 was considered statistically significant (*P < 0.05, **P < 0.01, ***P < 0.001, and ****P < 0.0001).
Results
HSF1 was upregulated in Ec tissues and it was correlated with the clinical parameters
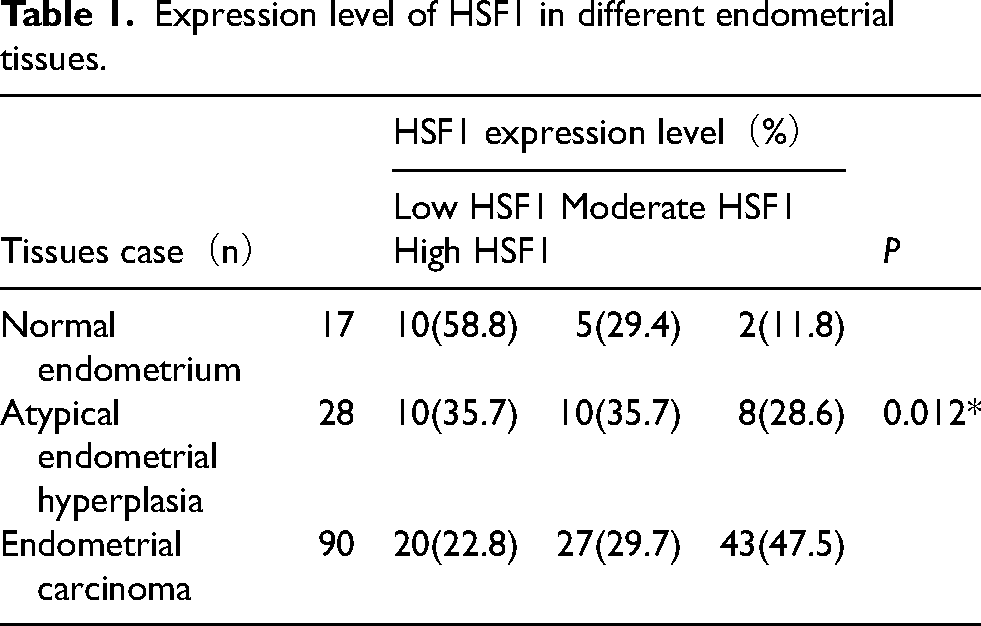
HSF1 expression level in EC (n = 90), atypical endometrial hyperplasia (n = 28), and normal proliferative endometrial (n = 17) tissues was analyzed. It was found that HSF1 expression level was upregulated in cancer tissues compared with the matched normal endometrial tissues and atypical endometrial hyperplasia, and the positive staining was predominantly observed in the nucleus (Figure 1A and B). The correlation of HSF1 expression level with different endometrial tissues was presented in Table 1. The staining level was substantially higher in the EC group than that in other groups (Figure 1C). In the normal endometrium group, 58.8% (10/17) exhibited low HSF1 expression level, 29.4% (5/17) had moderate HSF1 expression level, and 11.8% (2/17) had high HSF1 expression level. Of the atypical endometrial hyperplasia group, 35.7% (10/28) exhibited low HSF1 expression level, 35.7% (10/28) had moderate HSF1 expression level, and 28.6% (8/28) had high HSF1 expression level. Of the EC group, 22.8% (20/90) exhibited low HSF1 expression level, 29.7% (27/90) had moderate HSF1 expression level, and 47.5% (43/90) had high HSF1 expression level. Significant associations were found among the normal endometrium group, atypical endometrial hyperplasia group, and EC group. The correlation of HSF1 expression level with EC patients’ clinicopathological features was presented in Table 2. HSF1 expression level was positively correlated with histological grade (P = 0.004), muscular invasion endomembrane (P = 0.049), and lymph node metastasis (P = 0.036), rather than with age and FIGO stage. Both moderate and high HSF1 expression levels were significantly associated with ER negativity (P = 0.001). Additionally, survival analysis revealed that patients with high HSF1 expression level had significantly shorter 5-year survival rates compared with those with low or moderate HSF1 expression levels (P = 0.029, Figure 2).
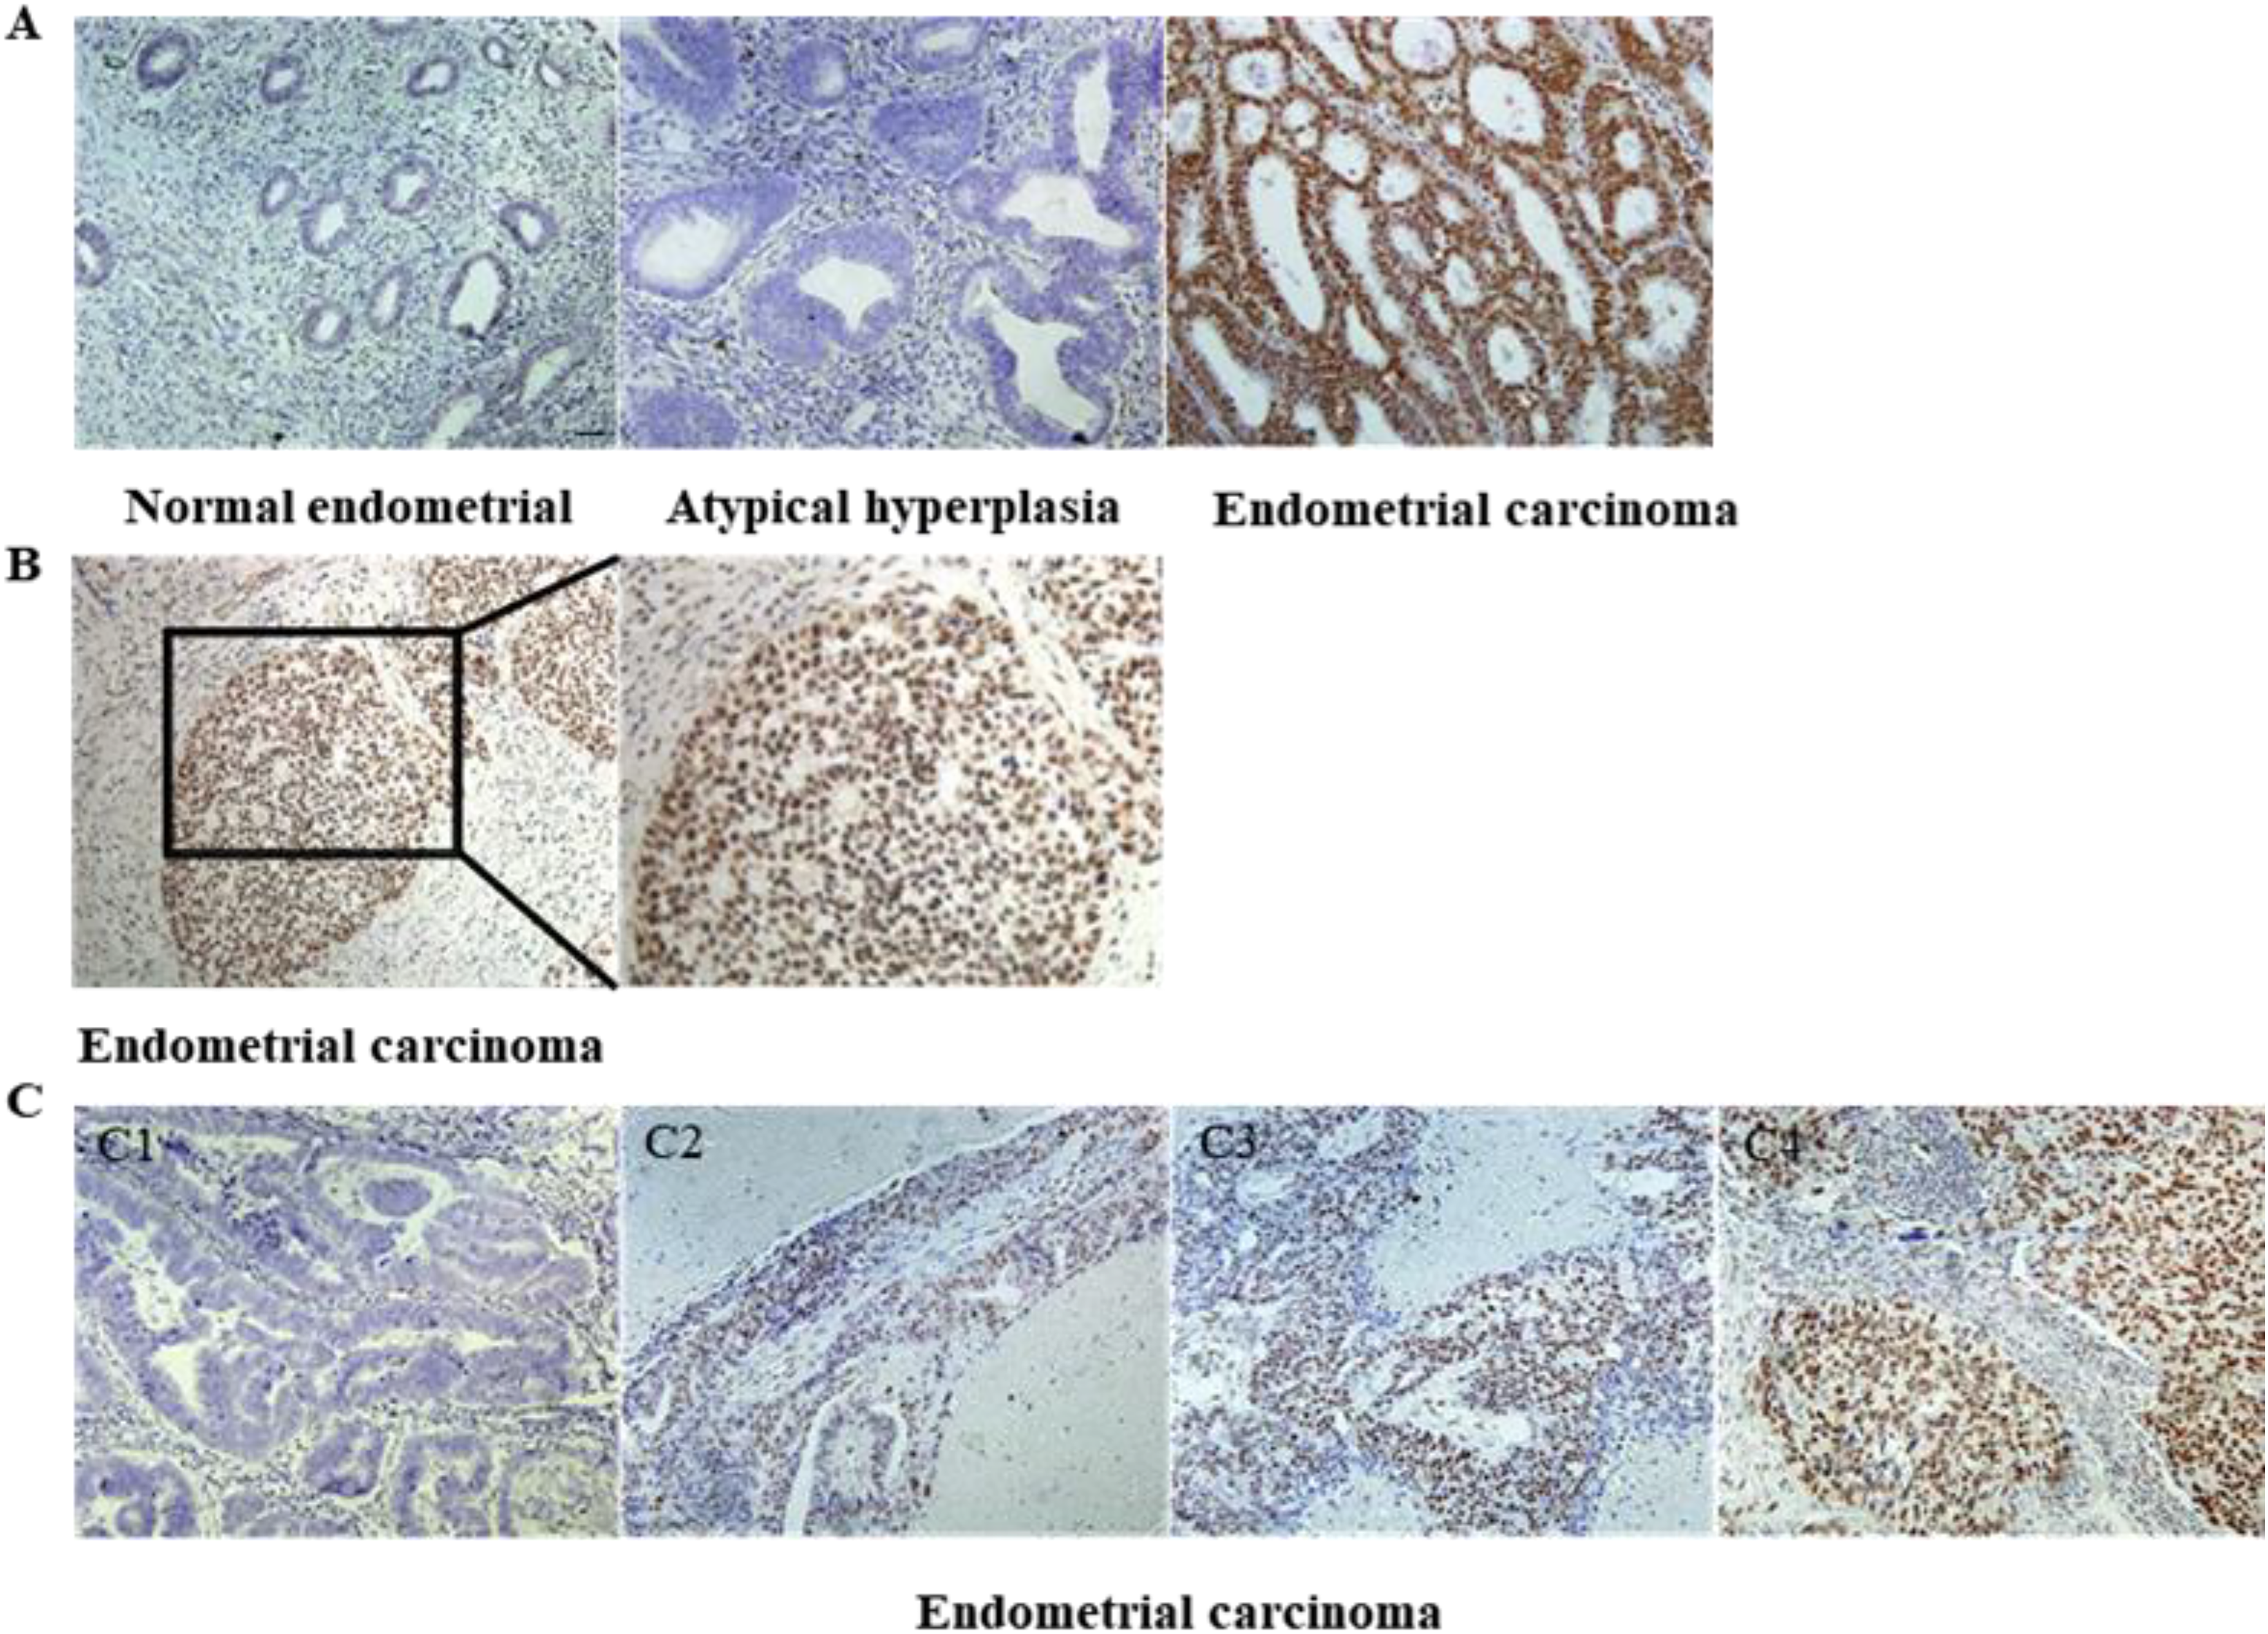
Immunohistochemical staining was employed to detect HSF1 protein in normal endometrial tissue, atypical endometrial hyperplasia, and EC. A: Immunohistochemical micrographs display that HSF1 expression level was strongly positive in EC tissues, while it was weakly stained in normal endometrial and atypical endometrial hyperplasia tissues (magnification, × 200). B: In EC, HSF1 expression level was primarily localized in the nucleus (magnification, × 200 and ×400). C: Immunohistochemical micrographs of HSF1 expression level in EC, which was categorized by staining intensity: (C1) negative, (C2) low, (C3) moderate, and (C4) high (magnification, × 200). Scale bar: 50 µm.
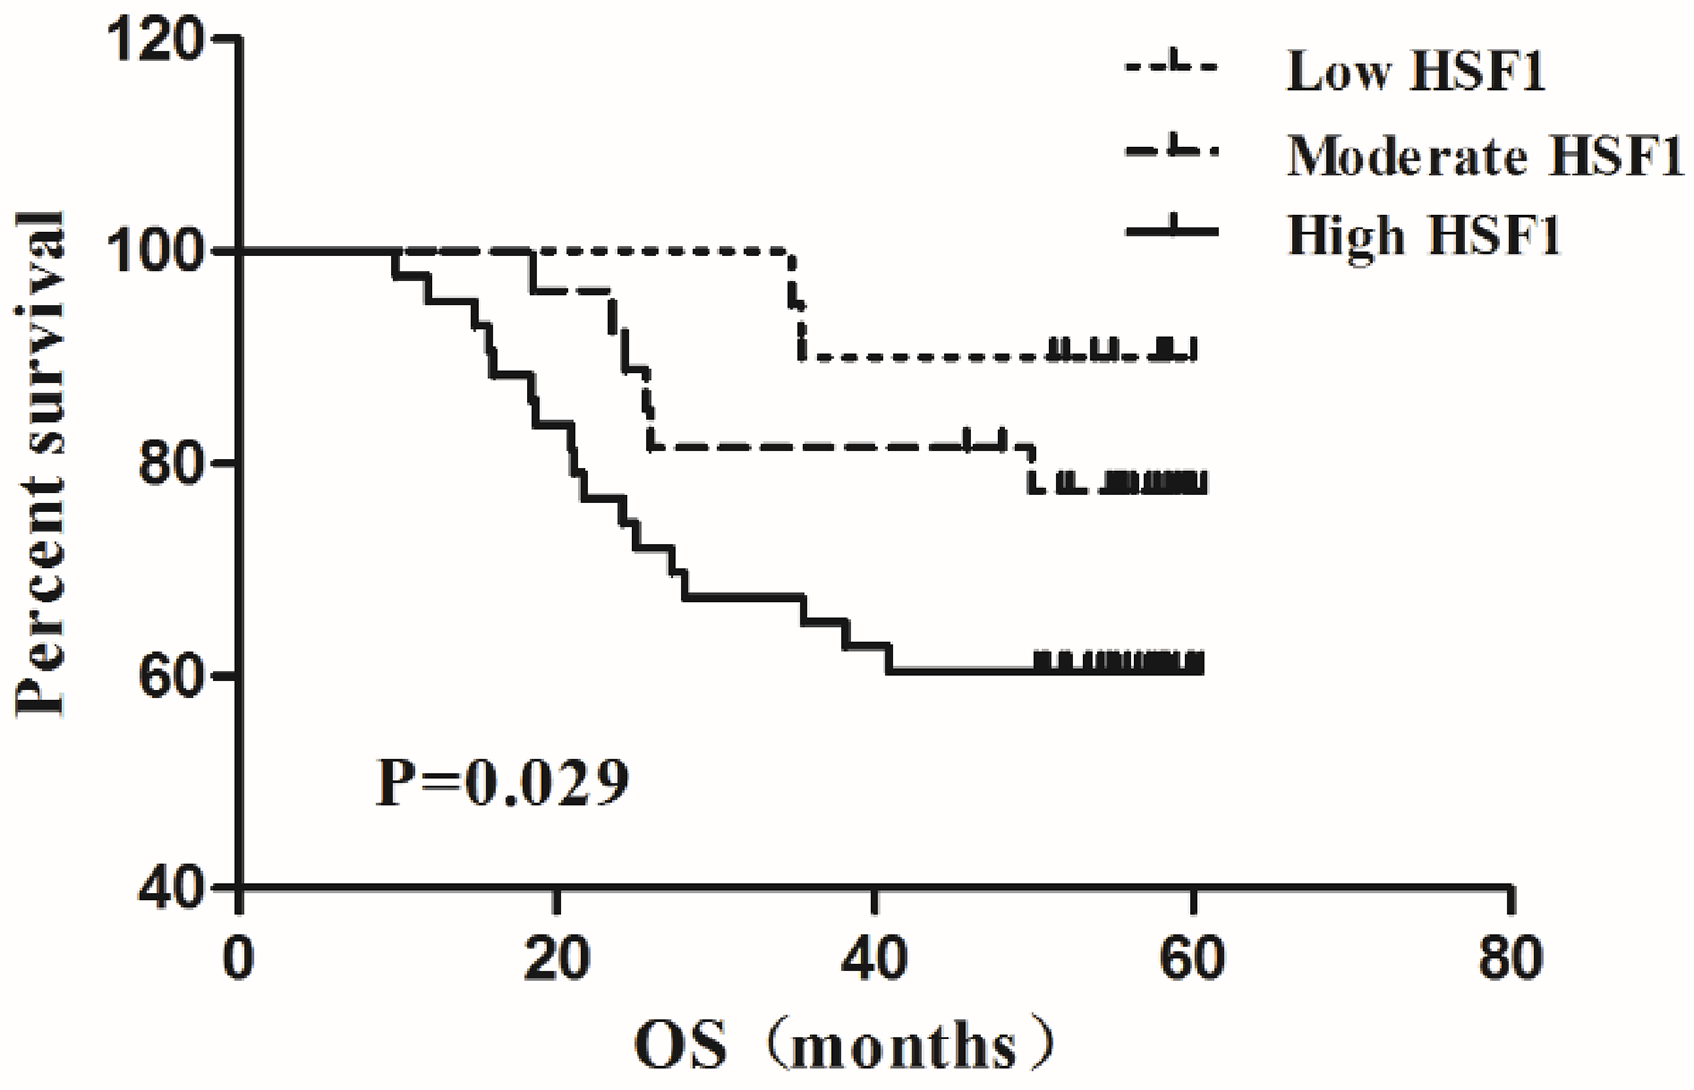
The 5-year survival curves according to the HSF1 expression level in EC patients indicated that those with high HSF1 expression level had significantly shorter overall survival (OS) compared with patients with moderate or low HSF1 expression level.
Expression level of HSF1 in different endometrial tissues.
Relationship between HSF1 expression level and EC patients’ clinicopathological features.
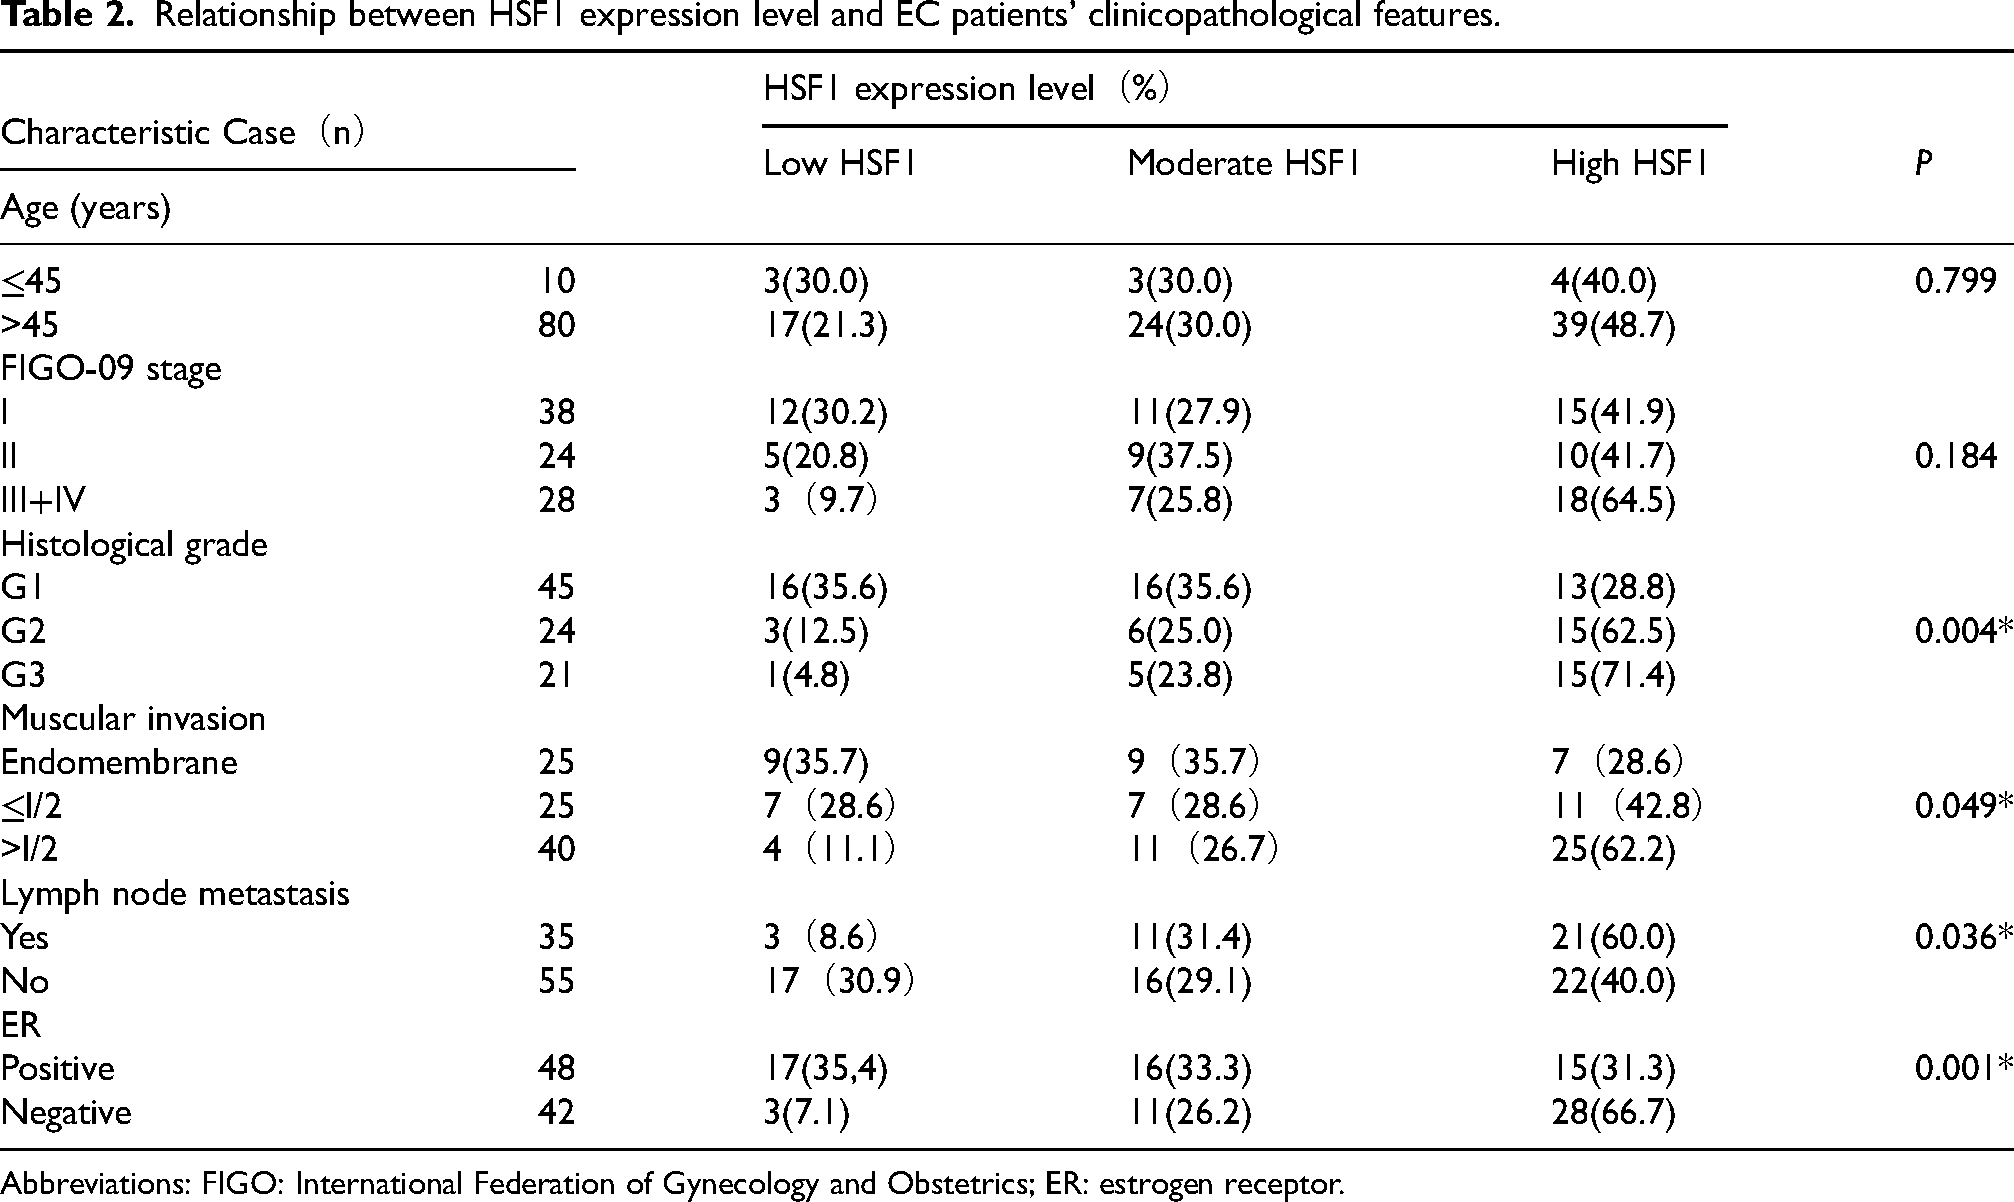
Abbreviations: FIGO: International Federation of Gynecology and Obstetrics; ER: estrogen receptor.
High HSF1 expression level in Ec cells was associated with low Er expression level
To explore HSF1 expression level, qRT-PCR, and Western blotting were employed to detect HSF1 mRNA and protein expression in human endometrial epithelial cells and three endometrial carcinoma cell lines. Human endometrial epithelial cells were used as the negative control. HSF1 and ER were detectable in all the cell lines. Among them, HSF1 expression level was the highest in Ishikawa cells (Figure 3A, C, and D), while ER expression level was the lowest (Figure 3B, E, and F).
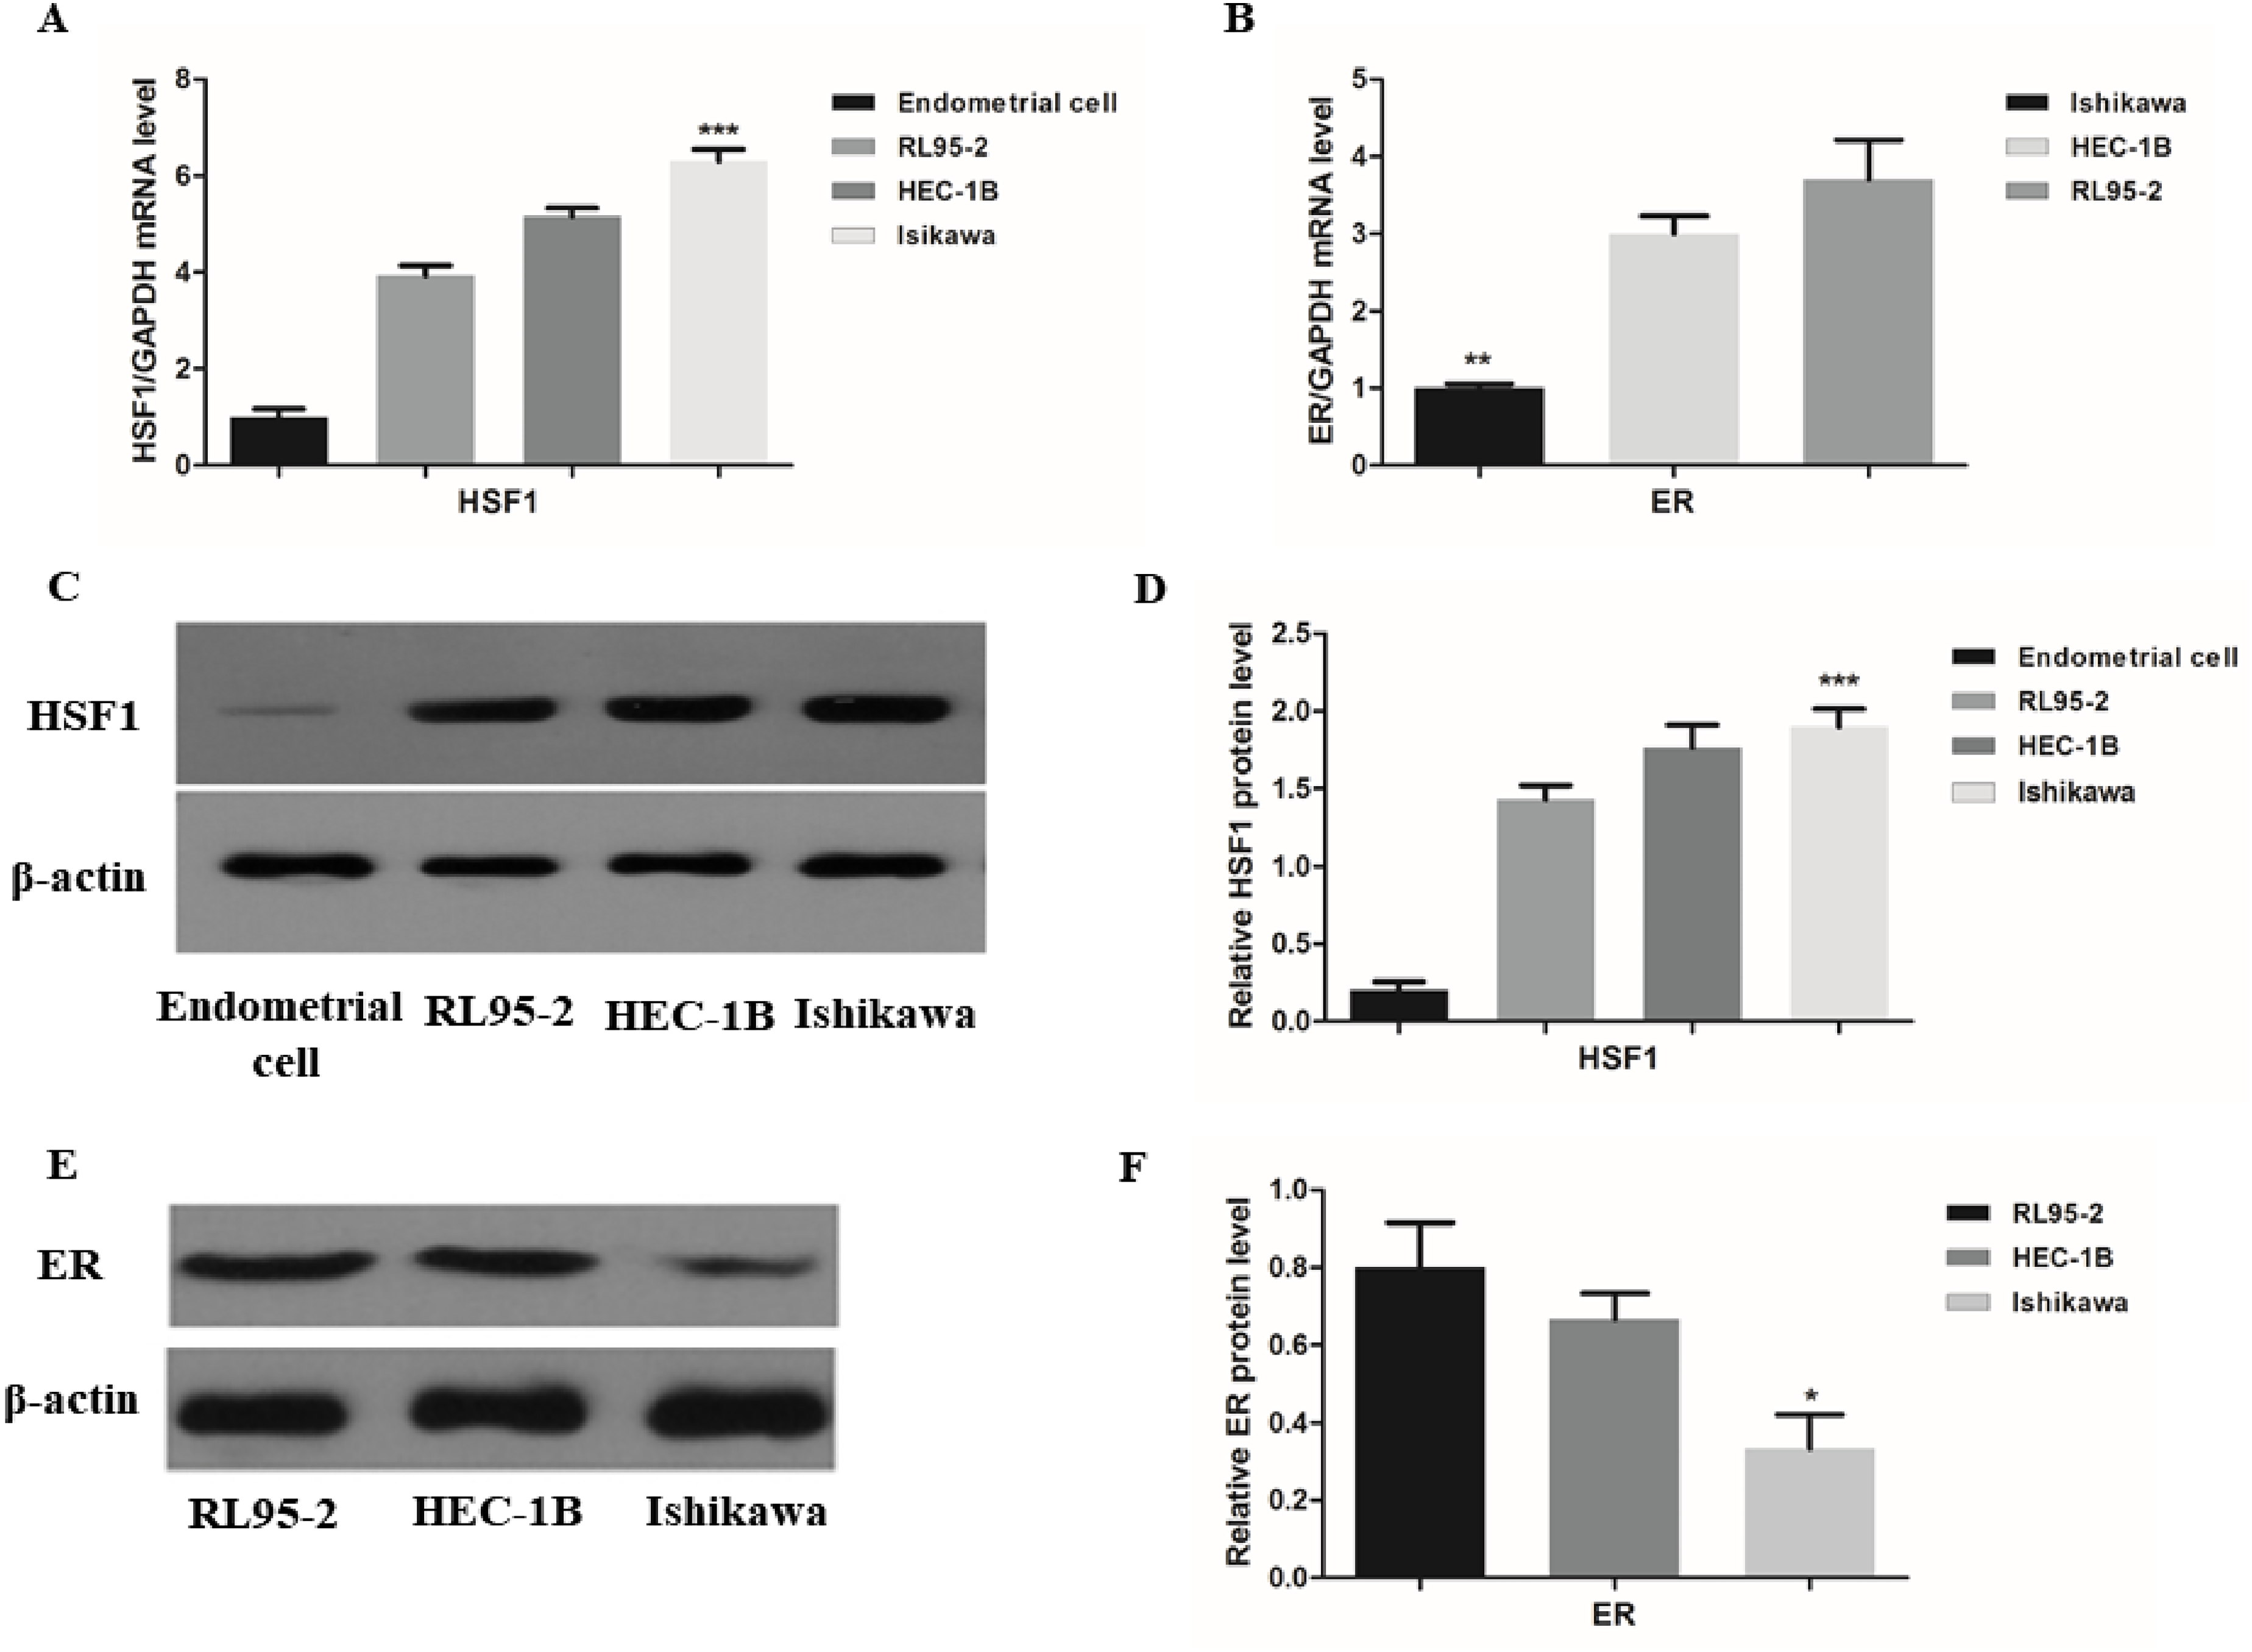
Expression levels of HSF1 and ER in normal endometrial and EC cells. A: qRT-PCR analysis detected mRNA expression level of HSF1 in EC and the matched normal endometrial cells. B: qRT-PCR analysis detected mRNA expression level of ER in EC cells. C and D: Western blotting detected protein expression level of HSF1 in EC and the matched normal endometrial cells. E and F: Western blotting detected protein expression level of ER in EC cells. *P < 0.05; **P < 0.01; ***P < 0.001.
Knockdown of HSF1 expression level inhibited invasiveness and migration of Ishikawa cells
To explore the potential function of HSF1 in EC, HSF1 expression level was knocked down in Ishikawa cells by siRNAs. Compared with the siNC group, in the siHSF1 group, both qRT-PCR (Figure 4A–E) and Western blotting (Figure 4F–G) revealed downregulation of the invasiveness and metastasis indicators HSP90, MMP-2, MMP-9, and β-catenin, accompanied by upregulation of E-cadherin expression level. Subsequently, transwell (Figure 5A and B) and wound healing (Figure 5C and D) assays indicated a significant reduction in invasiveness and migration in the siHSF1 group compared with the siNC group.
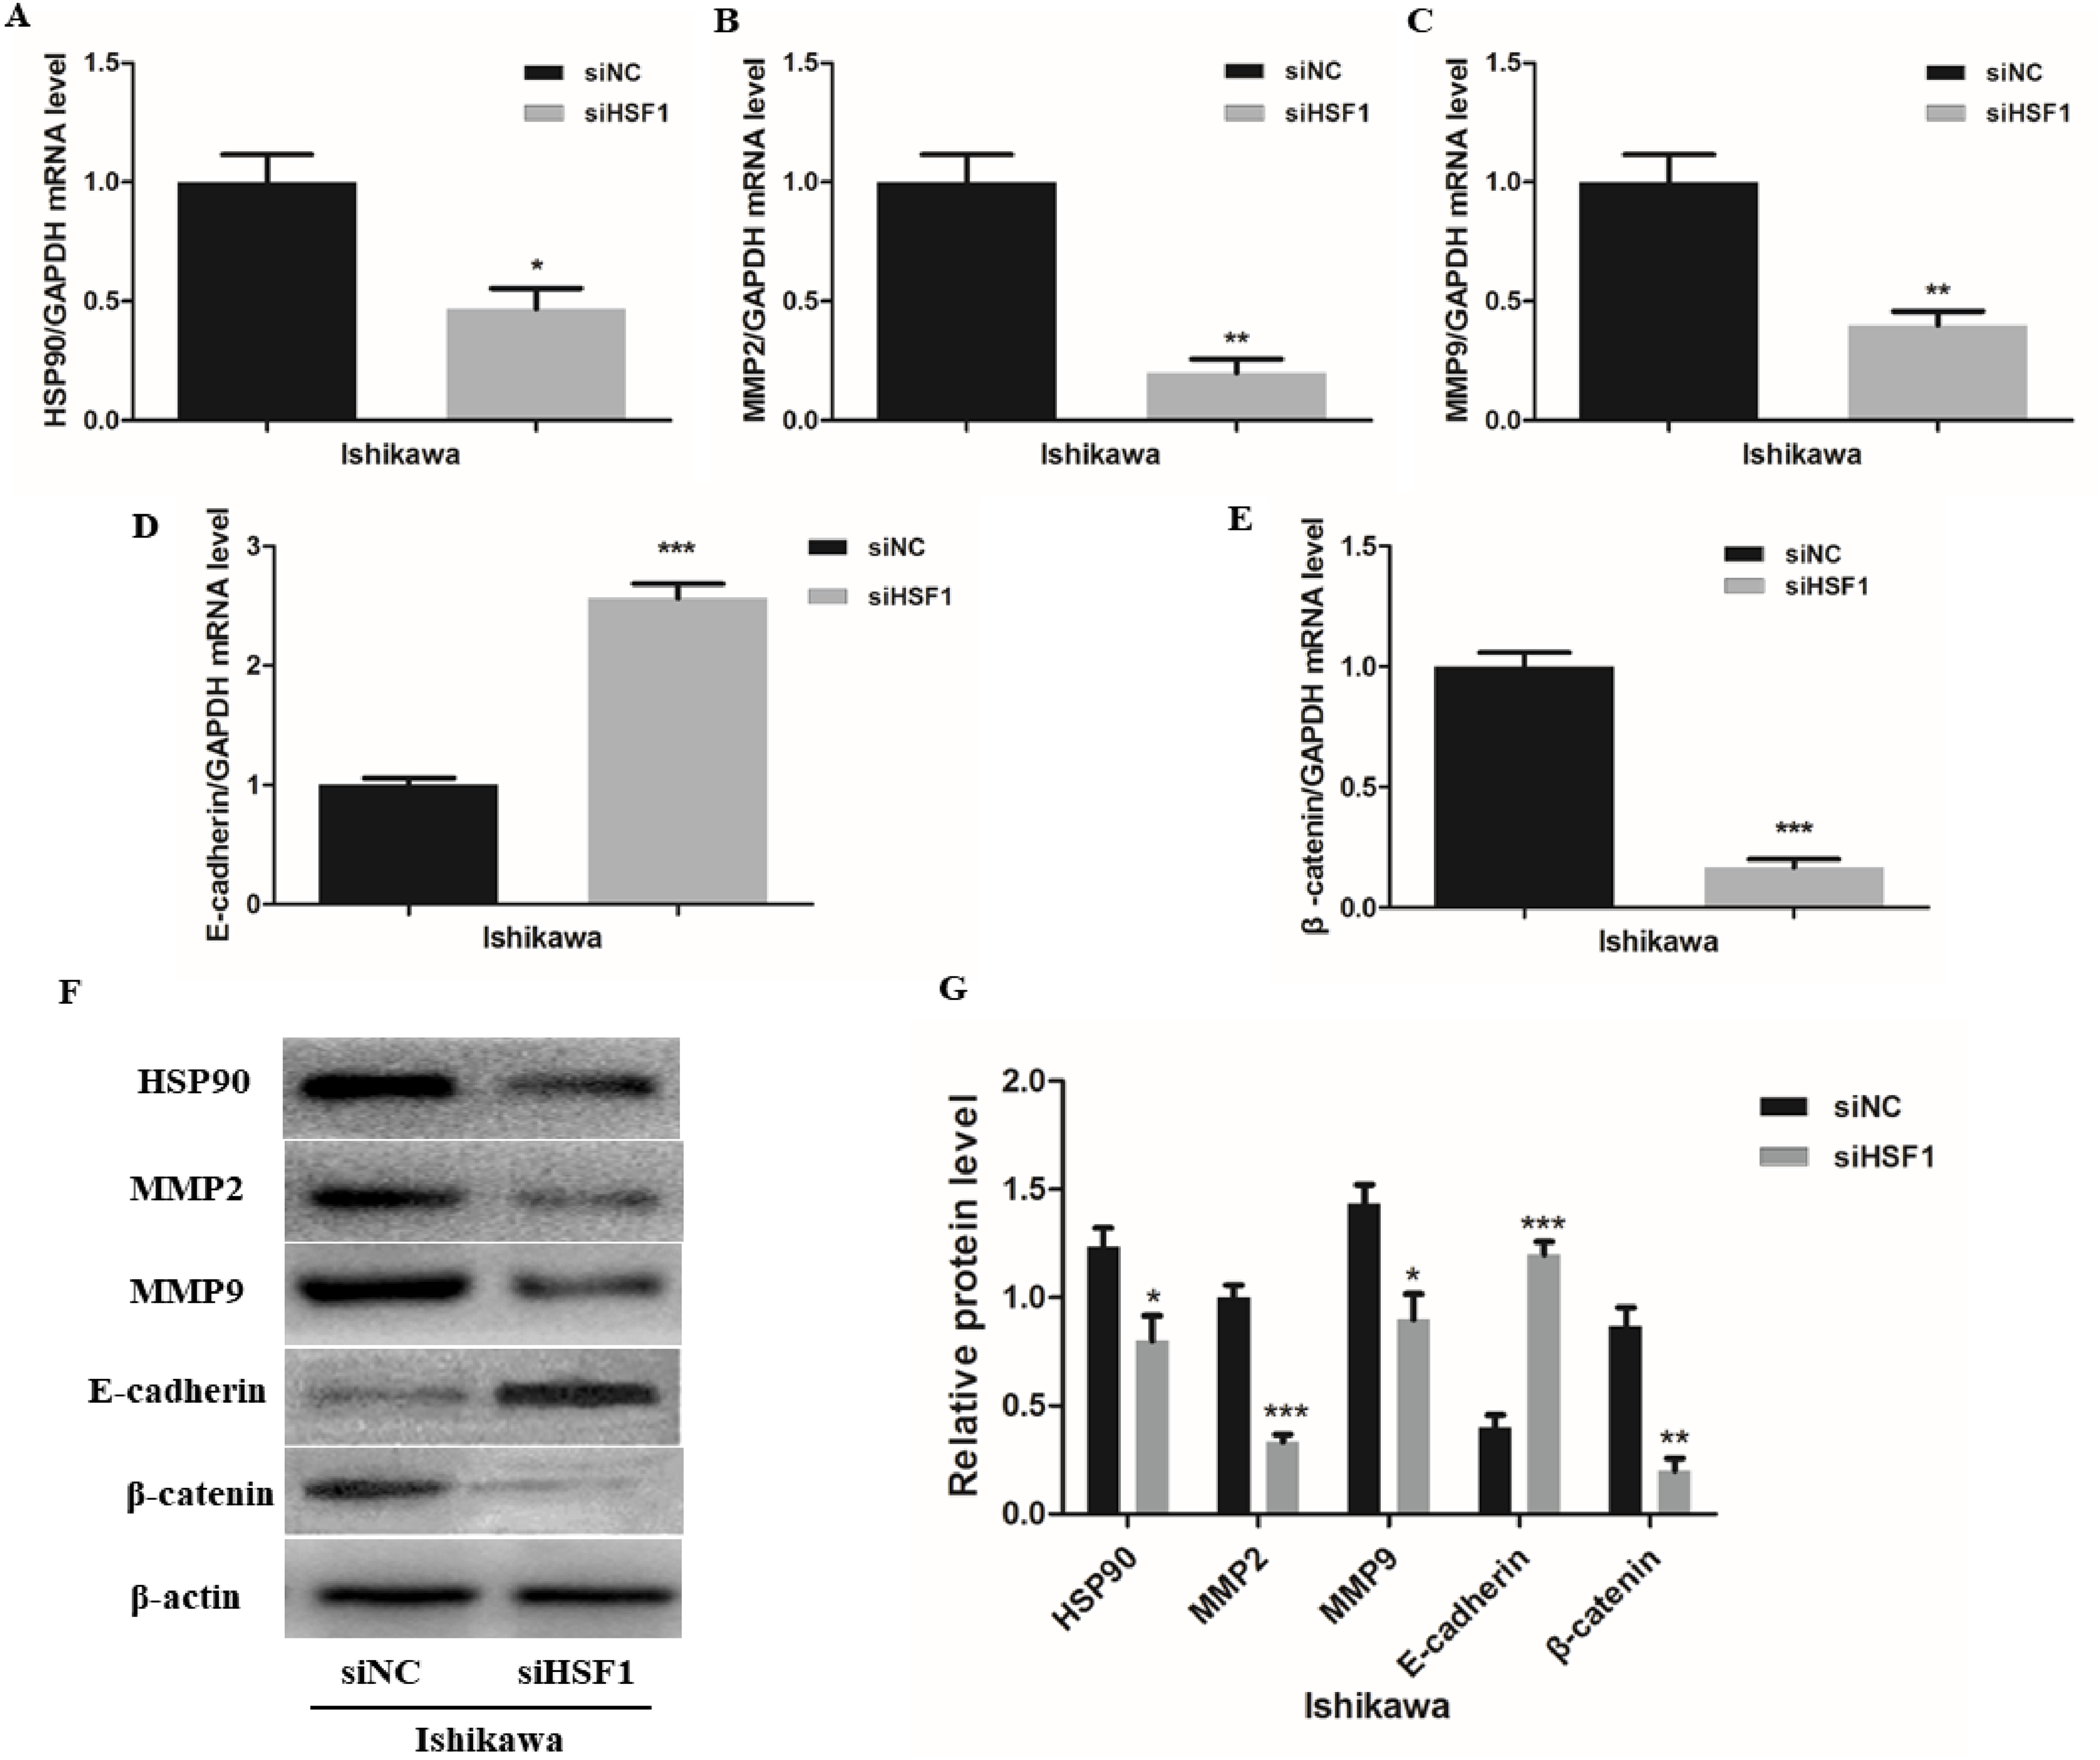
Knockdown of HSF1 affected the expression levels of genes associated with invasion and metastasis in ishikawa cells. Knockdown of HSF1 resulted in changes in HSP90 (A), MMP2(B), MMP9(C), CDH1(E-cadherin) (D), and CTNNB1(
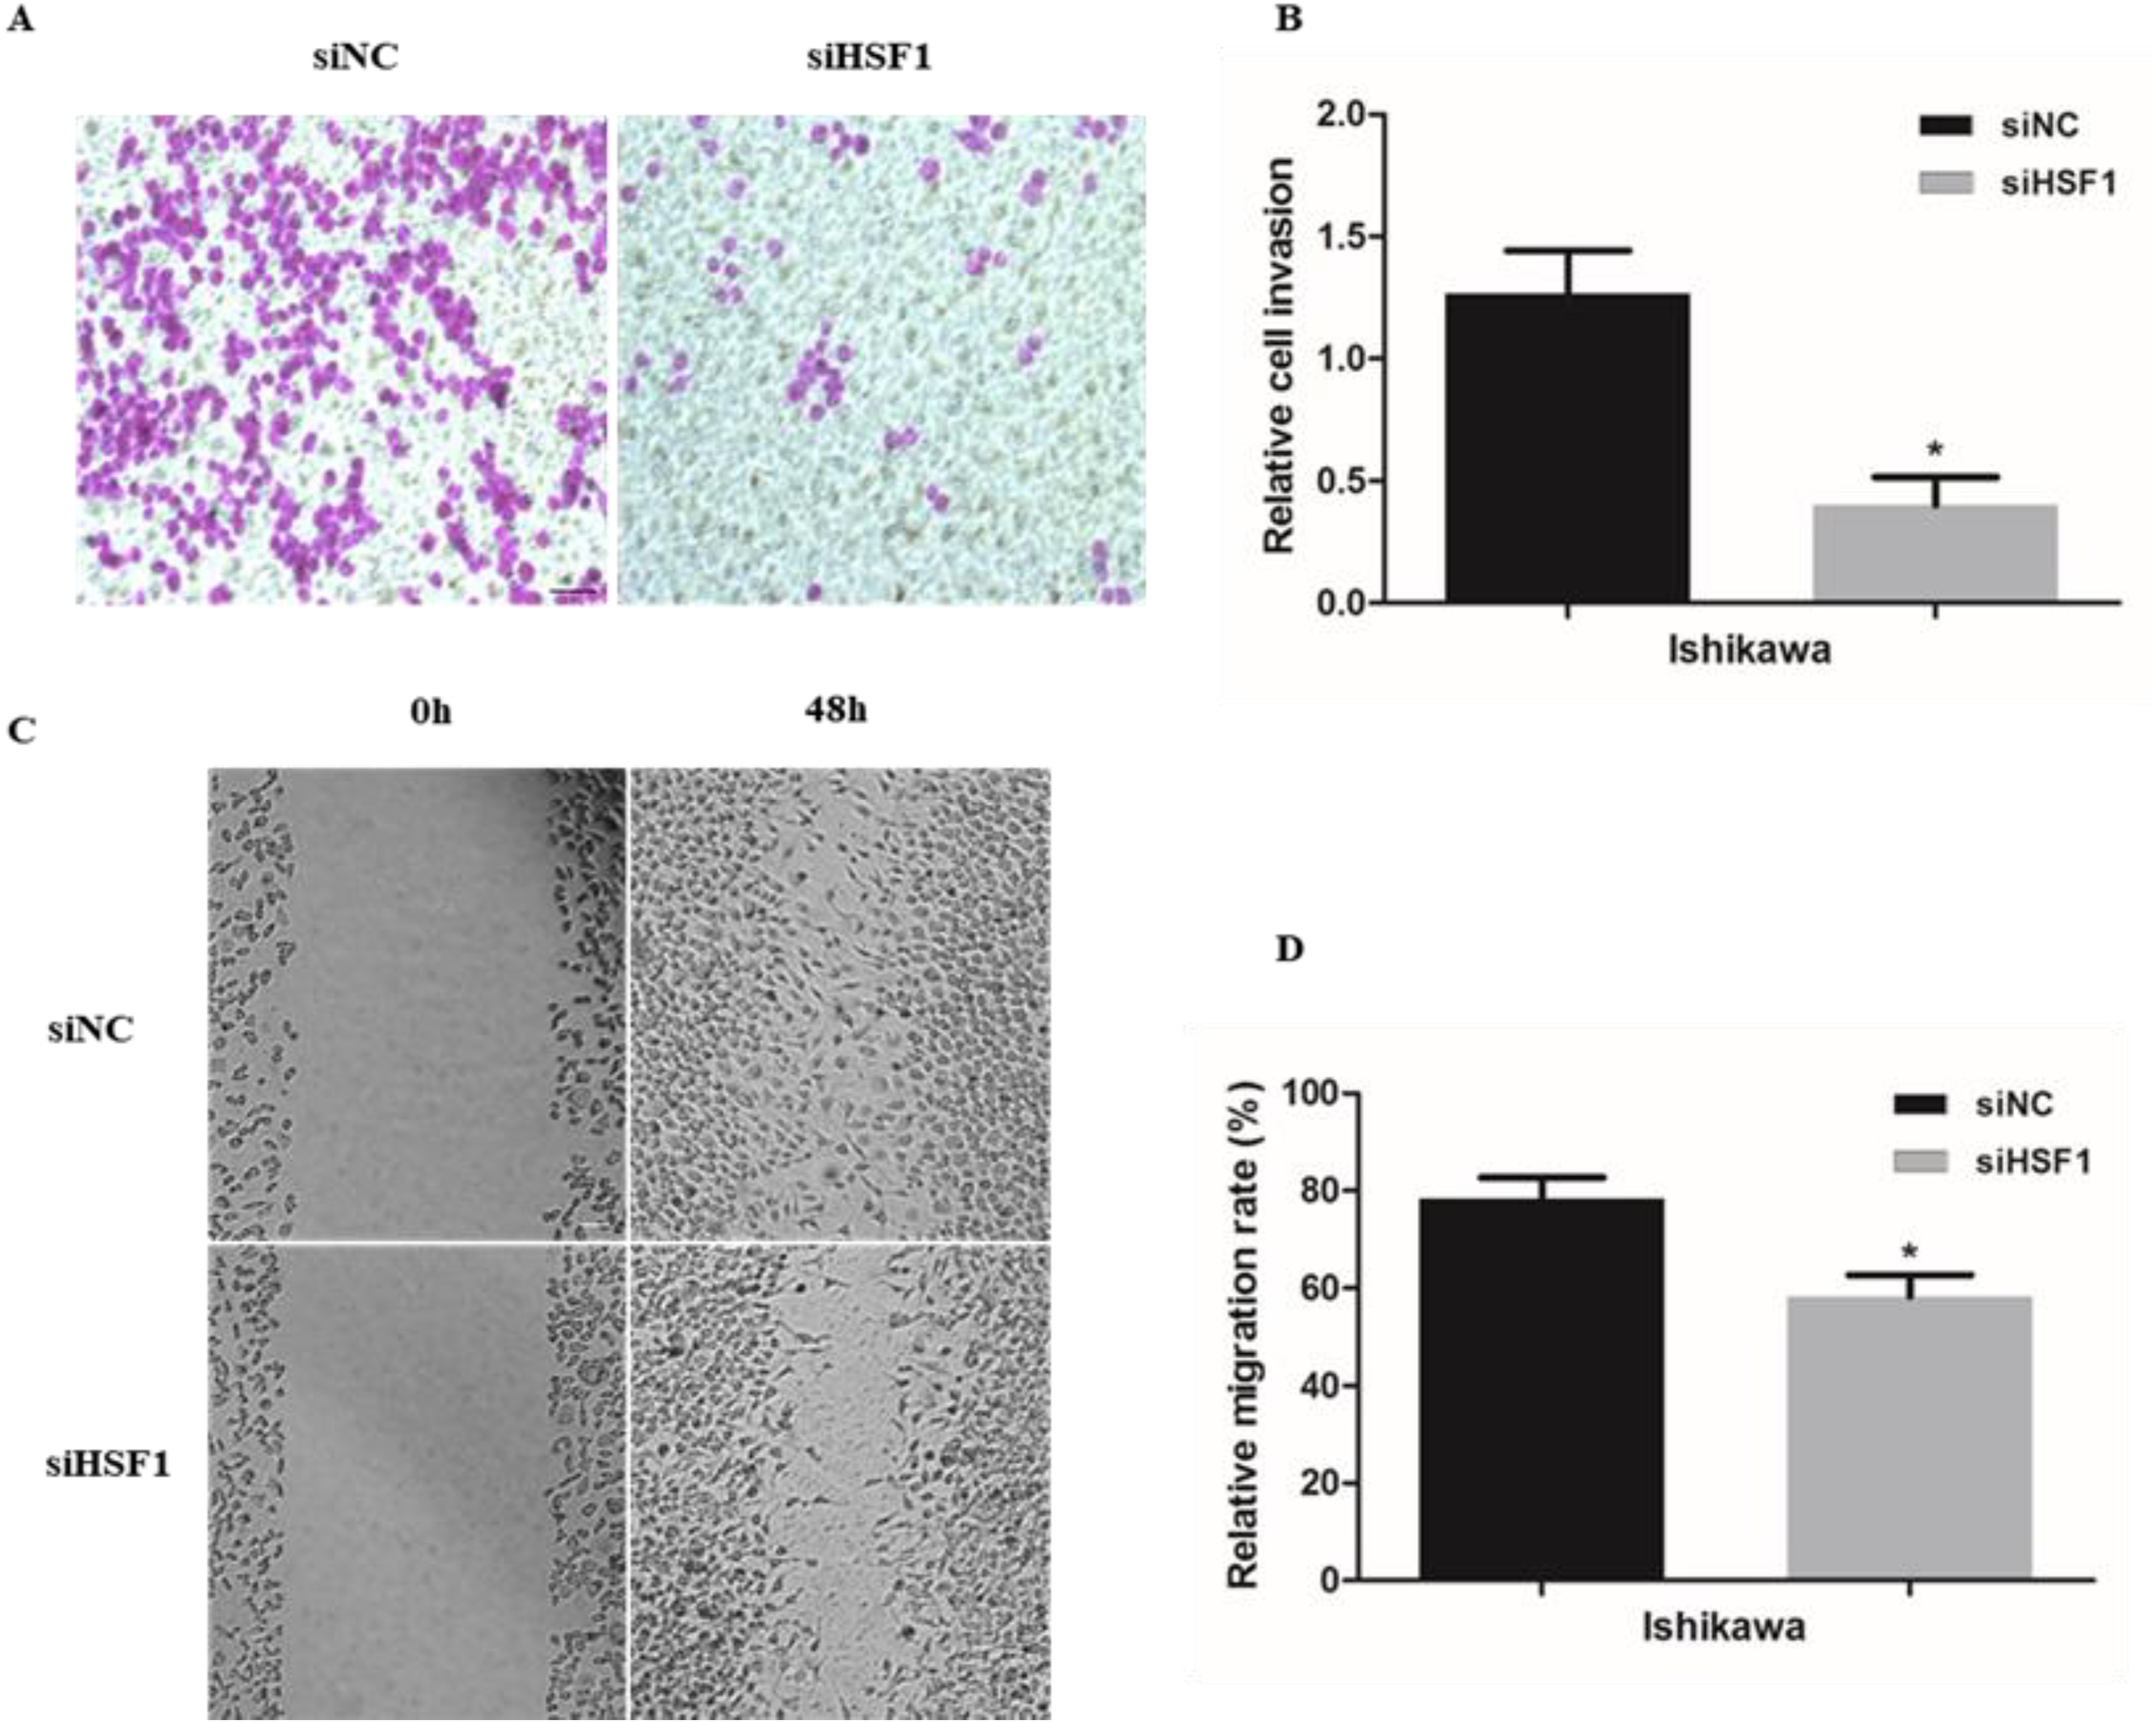
Cell invasion and migration were assessed in Ishikawa cells transfected with HSF1 siRNA. A and B: Cell invasion ability was determined by transwell assay. C and D: Cell migration ability was determined by scratch assay. Data were presented as the mean ± standard deviation (SD) from three independent experiments. *P < 0.05 versus siNC; **P < 0.01 versus siNC; ***P < 0.001 versus siNC. Scale bar: 50 µm.
Knockdown of HSF1 induced cell cycle arrest and apoptosis in Ishikawa cells
To assess the role of HSF1 in proliferation and apoptosis in Ishikawa cells, Ishikawa cells were treated with siRNAs targeting HSF1. Cell cycle and apoptosis were analyzed by flow cytometry, and it was found that the number of Ishikawa cells increased in the G1 phase, while decreasing in the S phase (Figure 6A). Moreover, the proliferation index was reduced in HSF1 knockdown cells compared with control cells (Figure 6B). Additionally, the effects of HSF1 knockdown on apoptosis were also evident (Figure 6C-D). The apoptosis rate in the siHSF1 group was higher than that in the siNC group (Figure 6C-D).
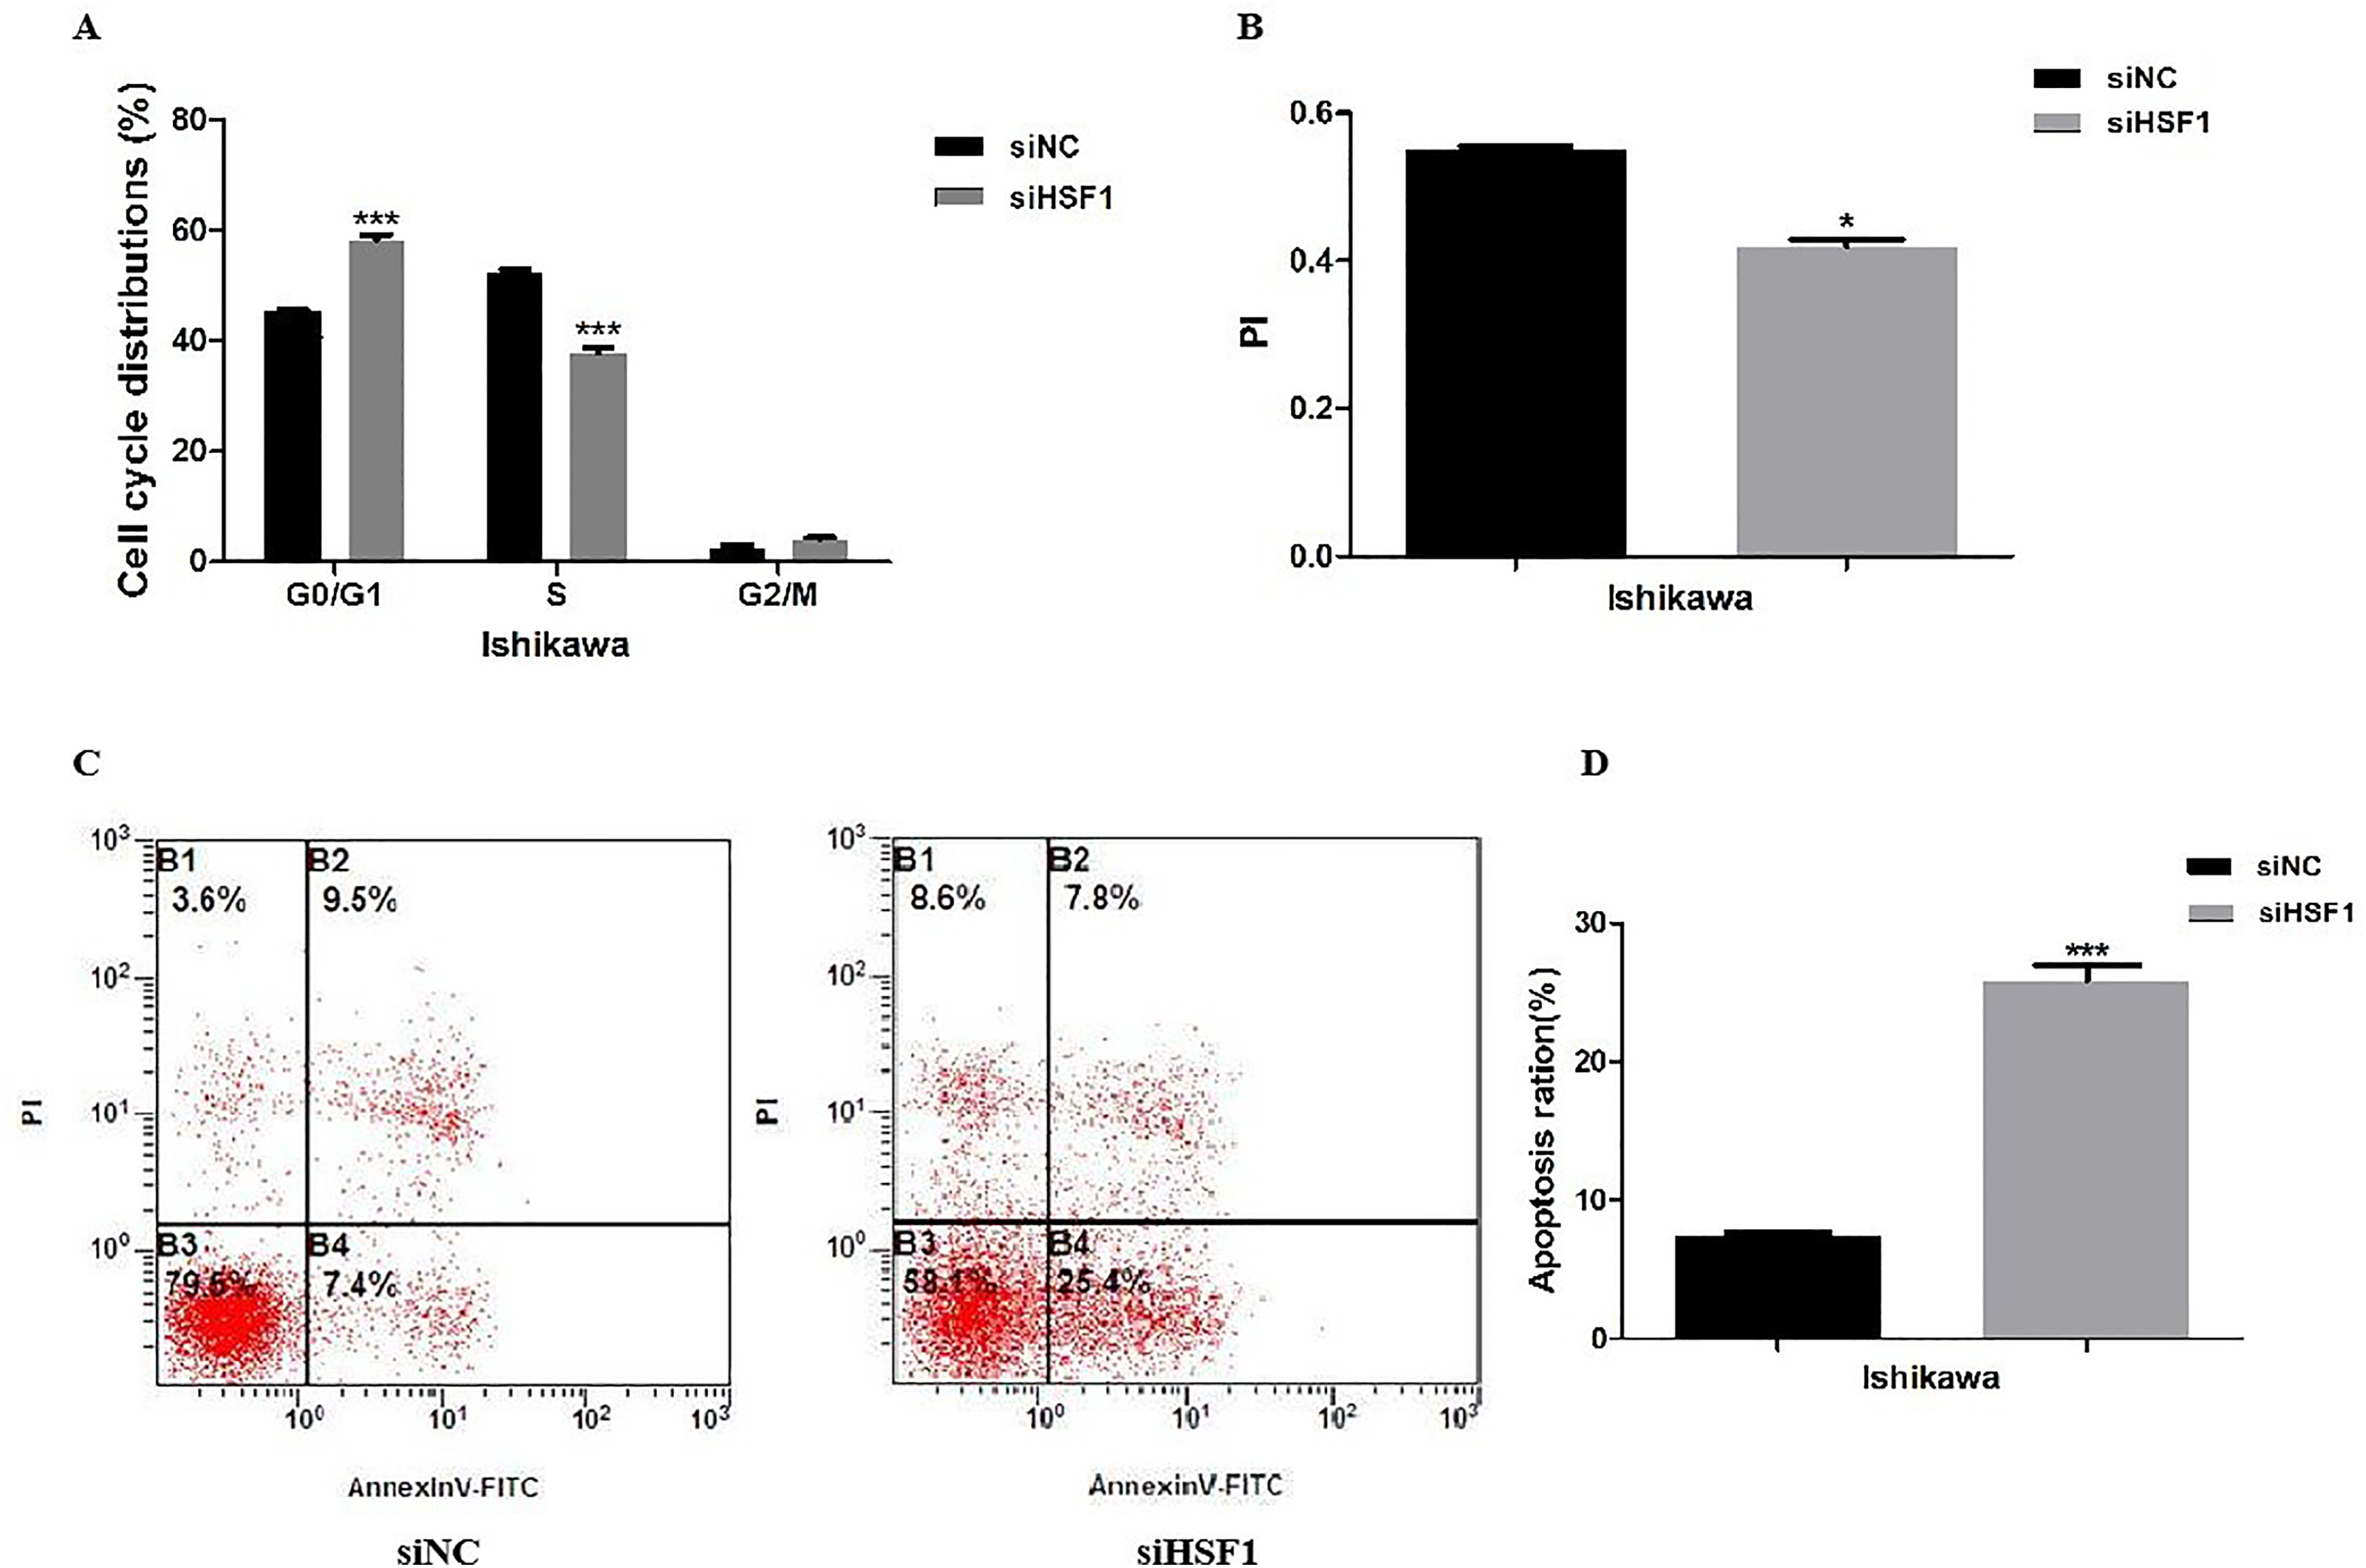
Knockdown of HSF1 resulted in cell cycle arrest and apoptosis in Ishikawa cells. A and B: Cell cycle analysis of the HSF1 knockdown and control in Ishikawa cells. C and D: Apoptosis analysis of the HSF1 knockdown and control in Ishikawa cells. Data were representative of three independent experiments. Data were expressed as the mean ± standard deviation (SD) from three independent experiments. *P < 0.05 versus siNC; **P < 0.01 versus siNC; ***P < 0.001 versus siNC.
Discussion
EC is a prevalent malignant tumor in obstetrics and gynecology, ranking first among malignant tumors of the female reproductive system in developed countries and second only to cervical cancer in China.1–3 However, the pathogenesis of EC has not yet been well documented. Existing literature suggests that HSF1 is a potential biomarker for poor prognosis and is associated with the survival and progression of EC.13,14 However, the role of HSF1 in the pathogenesis of EC remains elusive.
In the present study, the relationship between HSF1 expression level and 90 EC patients’ clinicopathological characteristics was assessed using immunohistochemistry. It was found that HSF1 expression level was positively correlated with histological grade, muscular invasion endomembrane, histological type, lymph node metastasis, and ER expression level. HSF1 is associated with aggressive disease and poor survival in EC. Engerud's study of 823 EC samples indicated that high HSF1 expression level was significantly associated with older age, non-endometrioid histological type, high tumor grade, and aneuploidy. 13 EC is typically categorized into type I (estrogen-dependent) and type II (non-estrogen-dependent) according to its main biological behavior. 15 Type I tumors typically express high levels of ER and progesterone receptor (PR) and are associated with superior prognosis. In contrast, type II tumors have low levels of ER and PR and are associated with poor prognosis.16–18 HSF1 has been increasingly reported to be highly expressed in various epithelial malignant tumor tissues and cell lines, such as colorectal cancer, gastrointestinal cancer, breast cancer, cervical cancer, prostate cancer, ovarian cancer, etc..19–24 In particular, a high HSF1 expression level in breast cancer tissues is closely associated with ER expression level, and it was hypothesized that HSF1 also exhibits a similar effect in EC. 8 Engerud's study indicated that cases with moderate to high expression levels of HSF1 were more likely to be ERa positive. However, it was revealed that in EC with high HSF1 expression level, ERα level was reduced.
To elucidate the mechanism by which HSF1 functions as an oncogene in EC, HSF1 expression level was quantified in EC cell lines and tissues. The outcomes revealed that EC tissues exhibited elevated HSF1 expression level. Additionally, qRT-PCR and Western blotting were employed to quantify the expression levels of HSF1 and ER in four EC cell lines. HSF1 expression level was upregulated in the highly metastatic Ishikawa EC cell line, which is associated with low ER expression level, aligning with previously documented findings. 25
Invasion and metastasis are the major causes of EC patients’ poor prognosis.26,27 Therefore, it is essential in the ongoing research to explore the molecular mechanisms underlying the pathogenesis and progression of metastasis, emerging necessary for developing novel therapies to treat EC. The function of HSF1 in EC cells was further investigated by utilizing siRNA to knockdown HSF1 expression level. It was found that knockdown of HSF1 was associated with genetic alterations of invasion and metastasis, such as HSP90, MMP-2, MMP-9, E-cadherin, and β-catenin. In vitro examinations also revealed that the knockdown of HSF1 resulted in impaired invasion and migration in Ishikawa cells. Furthermore, the results demonstrated that knockdown of HSF1 resulted in cell cycle arrest, increased apoptosis, and inhibited cell proliferation in Ishikawa cells. These data suggest that the suppression of HSF1 expression level has the potential for antimetastatic therapy.
Conclusions
This study further elucidated the molecular mechanisms underlying invasion and metastasis of EC. It was revealed that the expression level of HSF1 was highly elevated in EC tissues and cells. In addition, HSF1 expression level was significantly correlated with survival and the malignant metastasis of EC. In conclusion, HSF1 may serve as a promising therapeutic target for EC, and downregulation of HSF1 can potentially be an effective therapeutic approach for inhibition of EC progression.
Footnotes
Acknowledgments
The authors thank the clinical staff who supported this study.
Ethics statement
This study was approved by the Ethics Committee of the Fourth Military Medical University. The patients/participants provided their written informed consent to participate in this study.
Author's contributions
Conceptualization: Haixia Liu, Xietong Wang, Biliang Chen, Junbin Yin, and Aihua Li.
Interpretation or analysis of data: Xiao Gu and Liang Shen.
Preparation of the manuscript: Haixia Liu, Jinlai Meng, and Yongzhong Gu.
Revision for important intellectual content: Jia Li and Yanhong Lv.
Supervision: Xietong Wang, Biliang Chen, Junbin Yin, and Aihua Li.
Funding
This study was supported by the Young Scientists Fund of the National Natural Science Foundation of China (Grant No. 81402133), Clinical Science and Technology Innovation Program of Ji’nan Province (Grant No. 202328072), and Medical Technology Innovation Incentive Program of Shandong Provincial Hospital Affiliated to Shandong First Medical University (Grant No. CXJL: ZQN – 202209).
Declaration of conflicting interests
The authors declared no potential conflicts of interest with respect to the research, authorship, and/or publication of this article.
Data availability
The raw data that support the findings of this study are available from the corresponding author.