
Abstract
Introduction
Neuroblastoma (NB) is derived from primordial neural crest cells and is the most common extracranial malignant solid tumor in children. 1 There are approximately 10.5 cases of NB per million children under the age of 15. 2 In addition, NB accounts for 7%–8% of childhood malignancies, but the median diagnosis age of NB patients is 18 months.3–5 In clinical practice, we find that the prognosis of NB can be variable, including metastatic spread, unresponsiveness to drug treatment, and spontaneous regression. Consequently, predicting the prognosis of NB children is a difficult task.
The modified version of International Neuroblastoma Risk Group (INRG) classified NB patients into different risk groups for treatment: very low risk, low risk, intermediate risk, and high risk.4,6 MYCN status, ploidy, segmental chromosome aberrations (SCA) (1p and 11q), and international neuroblastoma pathology classification histology are all vital features of neuroblastoma. 7 MYCN amplification is associated with segmental chromosomal loss of the distal short arm of chromosome 1 (1p) and usually associated with poor outcome, and the majority of MYCN amplified patients show SCA.8,9 The diploidy of tumor cells also indicates a less favorable prognosis. Histology is classified into favorable and unfavorable subsets based on the patient's age, the grade of differentiation of the tumor, as well as the mitosis and karyorrexia index. 10
Some novel biomarkers, however, may be difficult to detect. Thus, NB classifications could be improved, and patients and physicians could use them easily. Despite more than 50 years of treatment strategies for NB, it still accounts for up to 15% of all pediatric cancer deaths. 11 In order to predict the individual prognosis of NB patients, a reliable scoring system is required. A biopsy of NB may provide the most accurate and specific information before resection. Recent developments in analytical methods have made it possible to effectively measure large amounts of data. According to some recent studies, the Bouta algorithm, which is used to select risk features, has a high predictive power.12,13
The purpose of this study is to screen some characteristics that can be obtained from biopsy that affect NB children's prognosis, and to construct a credible model to estimate overall survival (OS) rate. Our goals were approved by using a Boruta algorithm to screen risk features, followed by artificial neural networks (ANNs) to predict clinical outcomes. We then verified the results of ANN with univariable and multivariable Cox regression analysis, and employed a nomogram to predict the OS for NB children.
Methods
Data Collection
The clinical cohort and other data of NB children were obtained from the therapeutically applicable research to generate effective treatments (TARGET) program. The clinicopathological features of TARGET are publicly available and anonymously on the TARGET website (https://ocg.cancer.gov/programs/target), so ethical approval and patient consent are not required for our study. All patient information has been de-identified. The reporting of this study conformed to STROBE guidelines. 14
TARGET database contains discovery datasets and validation datasets. The discovery dataset includes high-risk cases, including relapsed cases, and low-risk or stage 4S cancers (which spontaneously regress without treatment). A validation dataset effort was carried out on an unbiased cohort randomly selected from patients enrolled in a single Children's Oncology Group (COG) protocol. This allowed for the determination of the frequency of changes across a greater range of NB subtypes. Thus, data from the validation group was the only data we gathered in the present study.
To obtain consistently reliable results, we retrospectively collected data on patients diagnosed between 2007 and 2012, whose latest follow-up occurred in 2019. The information of NB children was included as follows: gender, race, age at diagnosis, OS time, MYCN status (not amplified, amplified), INSS stage (Stage 1, Stages 2a and 2b, Stage 3, Stages 4 and 4 s), ploidy value, histology (undifferentiated or poorly differentiated, differentiating), MKI (low, intermediate, and high), diagnosis information, COG risk classifications (low risk, intermediate risk, high risk), the primary sites of tumor, final status at the endpoint of follow up (alive or dead), and OS time (in days). The exclusion criteria were (1) diagnosis unknown; (2) incomplete data; (3) age at diagnosis more than 18 years old. The flowchart of patient screening was shown in Figure 1.

The analysis flowchart of this study. AUC, area under curve; NB, neuroblastoma; DCA, decision curve analysis.
We defined the status of NB patients at the end of follow-up as a binary variable: “dead” or “alive.” A training set of patients (70%) and a validation set of patients (30%) were randomly selected from the original patient collection (Figure 1).
Features Selection
A Boruta algorithm was used in R (version 4.2.0, Boruta package) to select variables from clinical data to get independent risk features for NB children. The main ideal of Boruta analysis is to compare the importance of the real predictor variables with shadow variables using statistical testing and several runs of random forests. Shadow variables are calculated by permuting the original values across observations. For each real variable, a statistical test is performed comparing its importance with the maximum value of all the shadow variables. Unimportant variables and shadow variables are removed and the previous steps are repeated until all variables have been classified or a predetermined number of runs have been completed. 7 Boruta algorithm will give three results of input features imported feature, tentative feature, and unimportant feature.
Modeling through Artificial Neural Network
We first evaluated the predictive value of selected features with an ANN. ANN was feed-forward neural networks with hidden layers, solving classification and regression problems. 15 ANN was conducted in R 4.2.0 using the “neuralnet” package. The package can process covariates, response variables, hidden layers, and hidden neurons in order to approximate the functional relationship. ANN was calculated with globally convergent algorithm. Additionally, the function modifies either the smallest learning rate or the smallest absolute gradient associated with the smallest learning rate via resilient backpropagation without weight backtracking. 16 The number of hidden vertices (layers) in each layer was set between two and three, and employed the Sigmoid function as standard activation method. After cross-entropy was used for error calculation, receiver operating characteristic (ROC) plots were used to visualize the results.
Cox Regression Analysis and Nomogram Construction
The Cox regression model can be expressed by the hazard function denoted by h (t), which can be defined as formula

Cox regression is used for OS prediction of cancers in some previous researches.17,18 To evaluate selected features in training and validation sets, univariate and multivariate Cox regression were used. And we recorded the hazard ratio (HR) and 95% confidence interval (CI) simultaneously. According to published articles described,19,20 the clinicopathological features associated with OS were selected based on results of Cox analysis and Boruta algorithm, clinical importance, and specific knowledge in clinic.
To predict the 1-, 3-, and 5-year OS rates of children with NB, a nomogram was constructed using selected factors. By summing the points of all variables in the nomogram, we can calculate survival rates at various points in time for each individual.
Additionally, the consistency index (C-index), calibration curves, and the area under the receiver operating characteristic curve (ROC) were used to evaluate the performance of the nomogram. The R packages of “car,” “rms,” “pROC,” and “timeROC” were used for nomogram construction, calibration curves and ROC curves.
Clinical Utility of Nomogram
Decision curve analysis (DCA) was a novel algorithm for evaluating the clinical benefits of alternative models, and it was applied to nomograms to quantify net benefits under various threshold probabilities.21,22 Patients were divided into low-risk and high-risk groups based on their nomogram scores. The Kaplan–Meier (K–M) curve and log-rank test were used to compare the survival differences in different risk groups. The curves were established with the “ggDCA” package.
Developing an Online Nomogram
An online program was developed based on the efficiency validation of the nomogram model to estimate the survival rate for patients with NB for 1, 3, and 5 years as previously described.23,24
Statistical Analysis
All statistics were performed with SPSS (version 22.0, IBM, Chicago, IL, USA) and R software (version 4.2.0). Age and OS time were described with median and inter-quartile ranges. The log-rank test was used to find differences between different risk groups. Continuous variables were represented by median and inter-quartile range, and a Many–Whitney U-test was conducted to compare differences between groups. The comparison of categorical variables used the Pearson X2 test. A p-value < 0.05 was considered statistically significant.
Results
Clinical Features
A total of 448 children with NB were included in the present study. The clinicopathology features were listed in Table S1. And then, samples were randomly divided into a training set (N = 314) and a validation set (N = 134) (Figure 1). The primary selected features were not significantly different between the training and validation sets (Table S1).
The median patient age was 604.5 days (1.65 years old; IQR, 268.2-1148.8 days), and 54.5% (N = 244) of the patients were male. The majority of patients (74.3%, N = 333) were white. The median survival time was 2590 days (7.01 years; IQR, 1386–3198 days), and about a quarter of patients died (N = 111, 24.8%). According to the INSS stage assessment, most patients were in stage 4 (N = 248, 55.4%). The histology of 60.9% of the patients (N = 273) was unfavorable, and 94.9% of the patients (N = 425) had poorly differentiated or undifferentiated tumors. Furthermore, the MYCN gene did not appear to be amplified in most cases (N = 322, 71.9%), while the MKI was low in 41.5% of NB children in the present study. According to the COG risk assessment, the majority of patients (N = 262, 58.5%) were categorized as high-risk.
Features Selected by Boruta Algorithm, ANN Prediction with Risk Features
By comparing original attributes' importance with importance achievable at random, the results of Boruta algorithm showed that COG risk was also selected as a tentative feature, five features were identified as risk factors for NB (age at diagnosis, MYCN status, ploidy value, histology, and MKI), and other features were rejected. Those risk features were identified as risk factors for NB prognosis, and ANN method was used to analyze them.
Then, we defined the final status (dead or alive) as predicted object and conducted ANN model training with “logistic” and “tanh” activation functions. In Figure 2A, the ANN was plotted with the weights of each selected feature. In the training and validation subsets, the misclassification rate was 11.0% and 8.1%, respectively. The AUC of ANN was 0.91 (Figure 2B).

(A) The framework of the ANN model. (B) ROC curve of ANN results. ANN, artificial neural network; ROC, receiver operating characteristic; AUC, area under curve.
Univariable and Multivariable Cox Regression Analysis
To verify selected features with the Boruta algorithm, all features were estimated using univariable and multivariable Cox regression. The HR was presented to quantify its impact on OS. Results also showed age at diagnosis, MYCN status, ploidy value, histology, and MKI were still independent risk factors for OS in NB children (Table S3). The forest plot (Figure 3) was used to describe the independent risk factors.

The forest plot of selected features with Cox regression. CI, confidence interval; MKI, mitosis-karyorrhexis index.
Nomogram Construction for 1-, 3-, and 5-Year OS of NB Children
Based on Cox regression, we constructed a nomogram model using five features selected from the training set. The nomogram could be used to estimate 1-, 3-, and 5-year OS. The histology and MKI status of the children in the present cohort both had significant impacts on the OS of NB children (Figure 4).
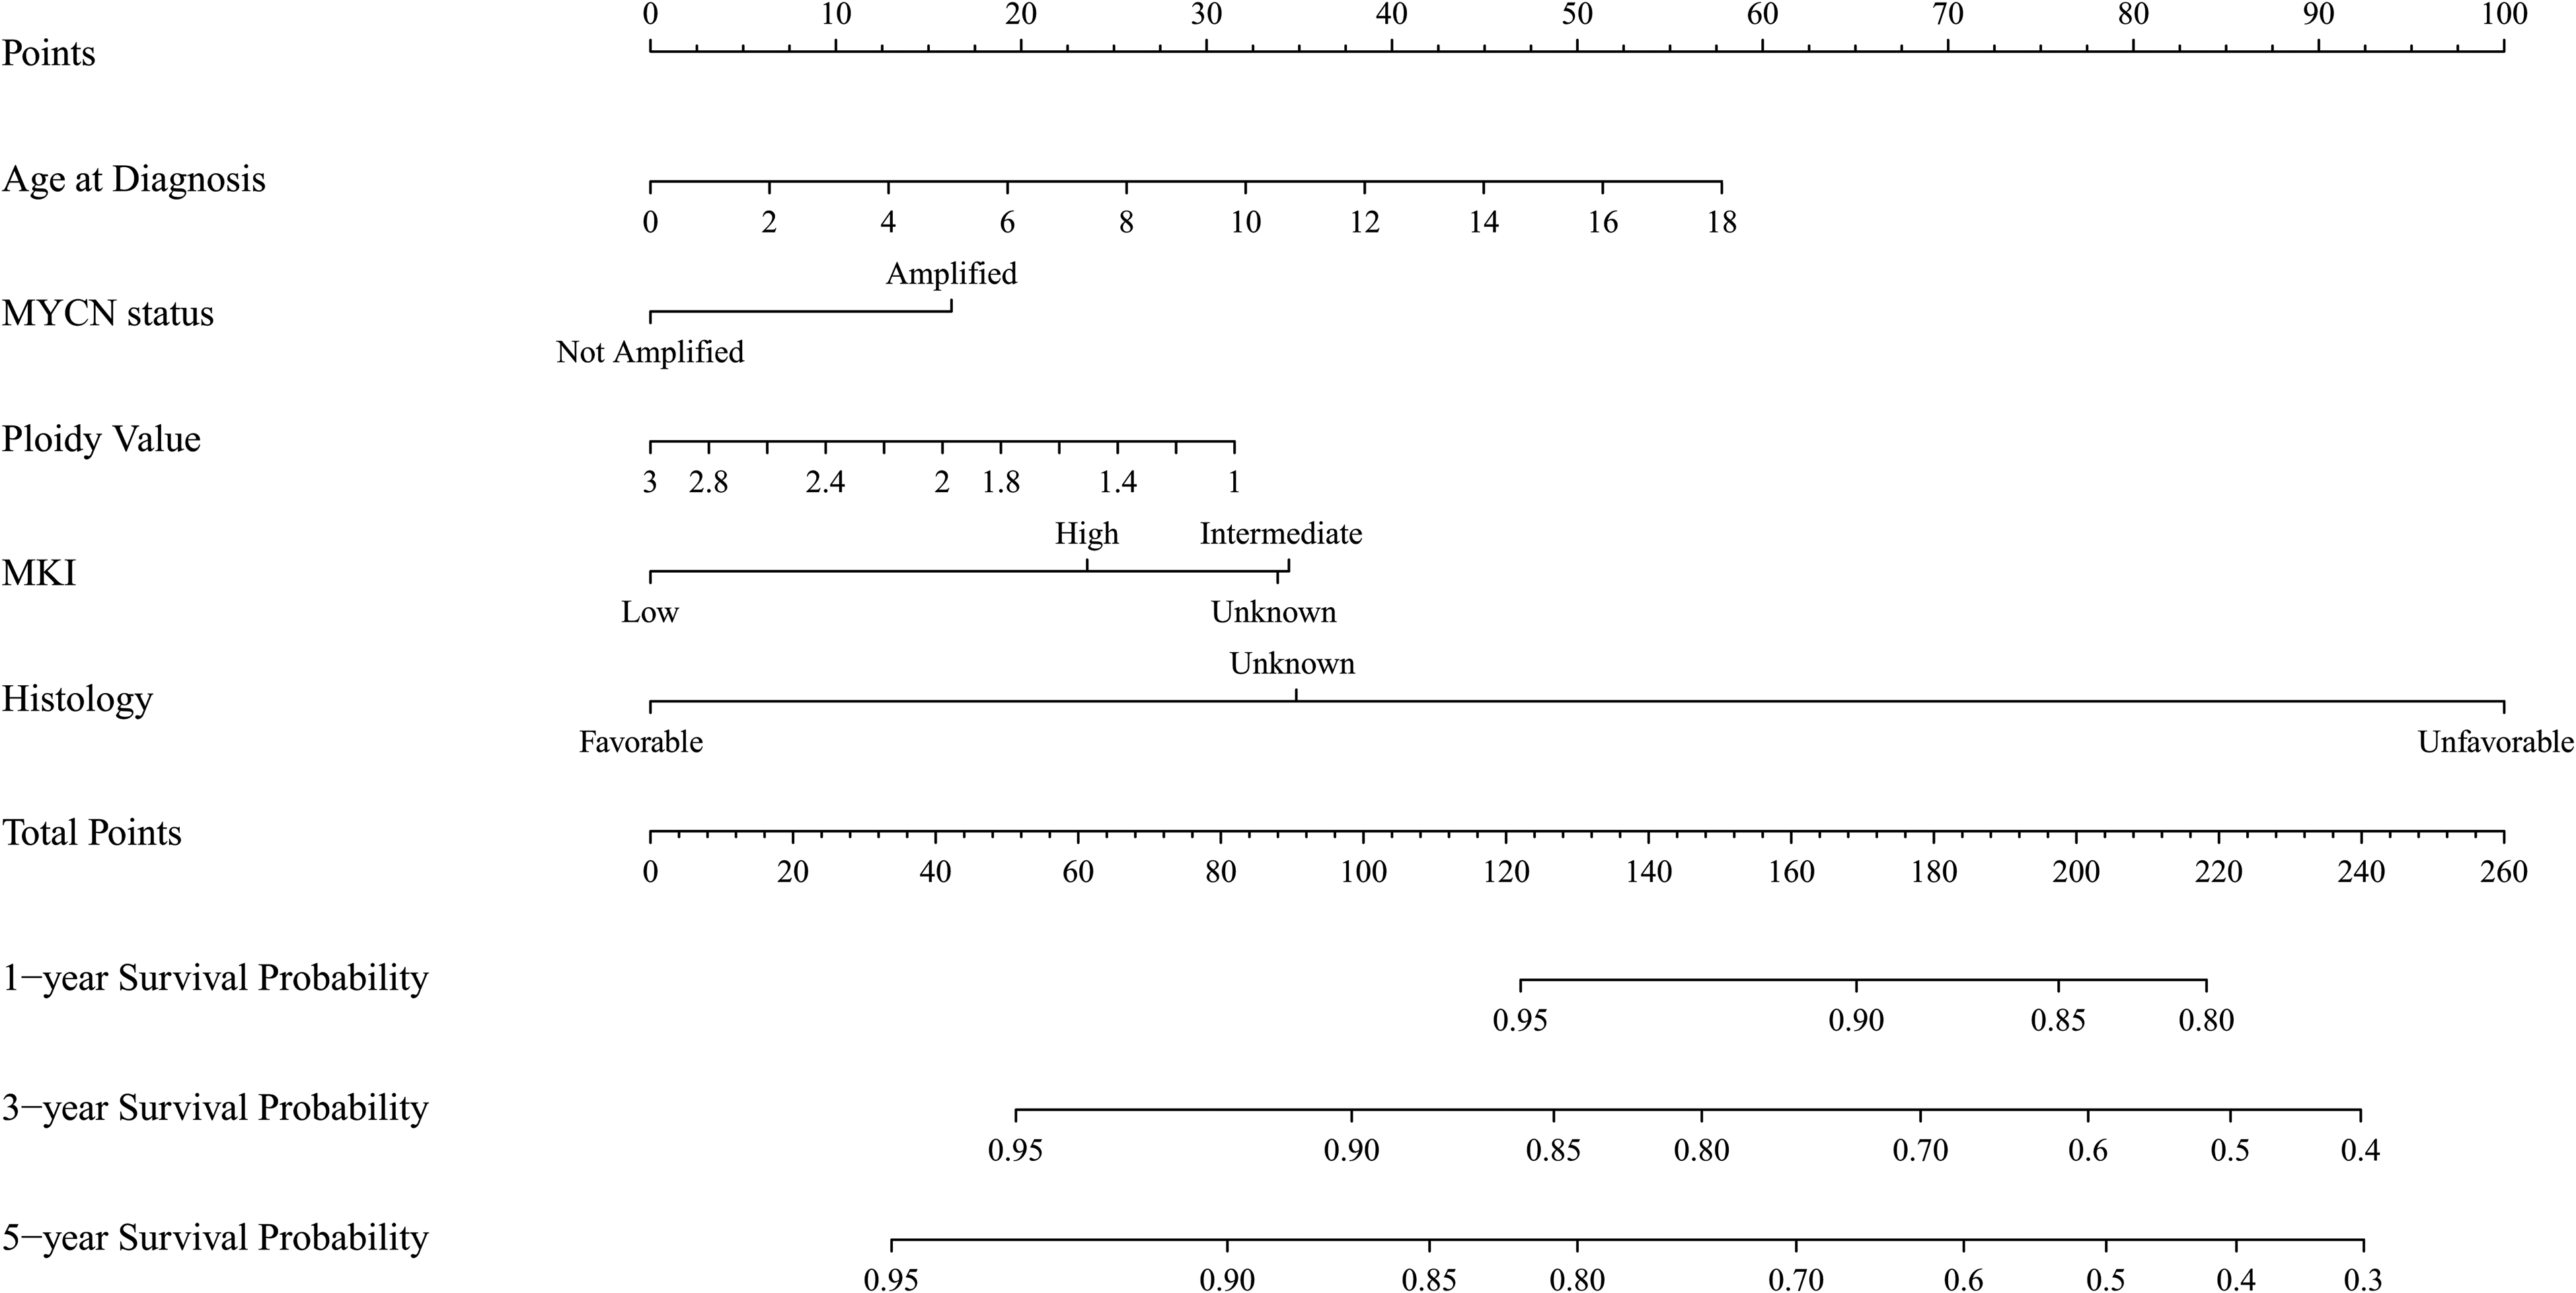
Nomogram for 1-, 3-, and 5-year OS of children with NB. NB, neuroblastoma; MKI, mitosis-karyorrhexis index.
Validation of the Nomogram
The C-indices for the training subset were 0.716 (95% CI, 0.667–0.765) and the validation subset was 0.731 (95% CI, 0.648–0.814), suggesting that this nomogram model was well discriminatory. Next, we measured AUC to analyze the prediction ability of the nomogram. In the training subset, the AUC for 1-, 3-, and 5-year were 0.706, 0.755, and 0.762, respectively (Figure 5A). In the validation cohort, the AUC for 1-, 3-, and 5-year were 0.608, 0.663, and 0.699, respectively (Figure 5B). According to the calibration curves for 1-, 3-, and 5-year in the training cohort and validation cohort, predicted values were highly consistent with observed values (Figure 6A-F). Observation of the above results revealed that the nomogram was reliable for predicting OS in children with NB.

(A) The ROC curves for OS rates of 1-, 3-, and 5-year of NB children in training and (B) validation cohorts. ROC, receiver operating characteristic; AUC, area under curve.

Calibration curves of the nomogram. (A)–(C) The 1-, 3-, and 5-year OS of NB children in the training cohort and (E)–(F) in the validation cohort. OS, overall survival; NB, neuroblastoma.
Clinical Application of the Nomogram
Analysis of DCA curves demonstrated that the nomogram model had a better prediction value than the model of including all variables for OS of NB children in training cohort and validation cohort, especially for 3- and 5-years OS rates (Figures 7A, 7B). We found the clinical value of the nomogram model was more effective than histology alone (Figures 7C, 7D). Moreover, patients were divided into two groups according to their total points calculated with the nomogram: high-risk group (total point ≥ 118.34) and low-risk group (total point < 118.34). As shown in Figure 8, the survival probability is significantly higher in the low-risk group than in the high-risk group (p < 0.05). Results in this part indicated that the nomogram had clinical utility for predicting the survival probability of NB children.

(A) Decision curves of the nomogram predicting OS in training cohort and (B) validation cohort . (C) Decision curves of the nomogram for OS and histology for OS in the training cohort and (D) validation cohort. OS, overall survival.

The Kaplan–Meier curve and log-rank test between high-risk and low-risk groups.
Online Application of the Nomogram
A web-based application was developed to predict the OS of NB children, which could be used in the clinic conveniently. If you enter the characteristics of NB patients, you will be able to obtain an estimate of their OS probability immediately. The application is available at https://mdzhou.shinyapps.io/DynNomapp/.
Discussion
Despite the development of NB treatment strategies in the past half century, children with NB have been found to have poor long-term outcomes.2,25 Therefore, estimation of the OS for NB children is crucial for the selection of therapeutic options and the selection of surgical opportunities. In order to achieve this goal, the significant features could be obtained by biopsy and analyzed with the Boruta algorithm and Cox regression.
First, we examined the performance of selected clinical features using an ANN model. In addition, the nomogram constructed with risk features was used for predicting OS rates of 1-, 3-, and 5-year of NB children. After verifying the performance of the nomogram model, the online application was developed.
The TARGET program collected clinical features and vital biological markers from NB children. The present study collected data on 448 children from the TARGET program from 2007 to 2012. In recent years, clinical and laboratory testing have improved the understanding of biology characters for NB.5,26 The Boruta method, created to determine all relevant variables, is named after a mythical woodland god in Slavic mythology. The Boruta algorithm has been used in more than 100 studies and is considered one of the most powerful algorithms for analyzing large data sets.27,28 Thus, the risk features in the present cohort were screened by the Boruta algorithm.
COG risk was defined as a tentative feature in the current study using the Boruta algorithm. Furthermore, we intend to investigate the influence of COG risk on the nomogram model. Based on AUC values and DCA analysis, there was no obvious improvement in the overall prediction of OS for NB children between the “nomogram + COG risk” model and the nomogram model (Figure S1). Integrated discrimination improvement index results (Figure S1) indicated only a 0.7% improvement in the “nomogram + COG risk” model when compared with the nomogram model (p > 0.05). In clinic, fewer variables make it easier for clinicians to practice. As a result, the nomogram was constructed using age at diagnosis, MYCN status, ploidy value, histology, and MKI.
A high prediction accuracy rate has been demonstrated using the ANN in a number of different scientific domains. 29 Additionally, we found that the misclassification rate for predicting the final status of NB children was quite low in the present study (around 10%). As a result of the ANN analysis, the Boruta algorithm was also verified as to its reliability in selecting risk features. However, ANN could not be conveniently used in clinical practice.30,31 Next, we performed Cox regression and constructed a nomogram model that could be used in clinical practice.
Consistent with the results of the Boruta algorithm, univariable and multivariable Cox regression models showed those five clinicopathological features had significant impact on the OS for NB children. These features included age at diagnosis, MYCN status, ploidy value, histology, and MKI. A nomogram with five selected features was constructed and showed reliable accuracy in predicting OS in NB children, especially for 3- and 5-year.
Previous studies have widely discussed that age at diagnosis and MYCN amplification status were crucial prognostic factors in children with NB.32,33 In the current study, we assessed the biological features of MKI and DNA ploidy for OS in NB children. These features had some controversies even though they were identified as risk factors.
MKI is recognized as an independently prognostic factor for NB children. 34 However, the nomogram indicated that MKI status unknown and intermediate had a greater adverse impact on OS for NB children in this study, which may have been caused by the MKI cut-off value. The cutoff value of MKI could be optimized in further study. Additionally, molecular biology research has found new markers that may replace MKI, such as MIB-1. 35 There is also controversy over the cut-off points for diploidy, triploidy, and hyperdiploidy. 36 The present study showed significant associations between a ploidy value of strictly 1.0 and poor prognosis.
Next, DCA curves were used to validate the accuracy and predictive ability of the nomogram for OS in NB children. In recent decades, histology has been considered as a risk factor for NB.37,38 Accordingly, we compared the predictive ability of histology and the nomogram for OS. DCA analysis demonstrated that the nomogram predicts more accurately than histology alone.
Furthermore, OS rate of the high-risk group was significantly lower than that of the low-risk group at various points in time. In brief, the nomogram was able to accurately predict the 1-, 3-, and 5-year OS rate for NB children.
Thus, this nomogram may be useful for identifying high-risk patients with biopsy information, so that an appropriate treatment protocol may be chosen. For example, some children with NB may receive neoadjuvant chemotherapy if they are deemed to have a low OS rate or are considered to be in a high-risk group before surgery resection, evaluation by this nomogram model.
Besides, the online nomogram is a more convenient tool for OS prediction in NB children than paper nomograms in previous studies. 39 Additionally, the present nomogram model can be used if some biological characteristics are unknown. The C-indexes of the nomogram model were higher than 0.7 in both the training cohort and validation cohort. We also used cross-validation to test the stability and reliability of the present model and estimated with C-index, calibration curves, and DCA analysis, which is more comprehensive than the previous study. 34
However, the present study also has some limitations. First, this is a retrospective case study, so selection bias is inevitable. And only OS rate was provided in TARGET database. The ratio of deaths to alive is about 1:2 in the current study. The training cohort and validation cohort each had more than 100 cases. Five features were selected for OS prediction. Thus, it could largely compensate for the deviation. Second, the latest follow-up time of patients collected in the present study was in 2019. With the improvement of treatment methods, the survival rate of patients in recent years may be different. But according to COG guidelines, treatment methods have not changed significantly in the past few years. 7 Finally, although we have conducted internal cross-validation, large sample prospective clinical trials and external validation are still needed in future studies.
Conclusion
In brief, we have established a novel nomogram with five clinical characters screened by Boruta algorithm and Cox regression for OS in NB children. These characters include age at diagnosis, MYCN status, ploidy value, histology, and MKI. The construction of a web-based nomogram and the investigation of risk features may assist doctors in responding to patient consultations with information obtained from biopsy prior to surgery resection, as well as assisting in making accurate treatment and follow-up strategies for NB children.
TARGET Therapeutically applicable research to generate effective treatments
Supplemental Material
sj-rar-1-tct-10.1177_15330338221145141 - Supplemental material for A Novel Online Nomogram Established with Five Features before Surgical Resection for Predicating Prognosis of Neuroblastoma Children: A Population-Based Study
Supplemental material, sj-rar-1-tct-10.1177_15330338221145141 for A Novel Online Nomogram Established with Five Features before Surgical Resection for Predicating Prognosis of Neuroblastoma Children: A Population-Based Study by Yu Zhou and Jing Gao in Technology in Cancer Research & Treatment
Footnotes
Abbreviations
Author Contributions
Declaration of Conflicting Interests
The author(s) declared no potential conflicts of interest with respect to the research, authorship, and/or publication of this article.
Funding
The author(s) disclosed receipt of the following financial support for the research, authorship, and/or publication of this article: This study was financially supported by The Plan of Innovation Capacity Building and Key Laboratory Construction of Science and Technology Bureau (grant number HAP202104), and Huai’an Science and Technology Plan Project (grant number HAB202126).
Institutional Review Board Statement
Ethical review and approval were waived for this study because the data in the present study were obtained from a public database.
Informed Consent Statement
Informed consent was not collected as this was a retrospective analysis of existing data.
Data Statement
All data generated or analyzed during this study are included in this published article (and its Supplementary Information files).
This study was financially supported by The Plan of Innovation Capacity Building and Key Laboratory Construction of Science and Technology Bureau (Grant No. HAP202104), and Huai’an Science and Technology Plan Project (Grant No. HAB202126).
Supplemental Material
Supplemental material for this article is available online.
References
Supplementary Material
Please find the following supplemental material available below.
For Open Access articles published under a Creative Commons License, all supplemental material carries the same license as the article it is associated with.
For non-Open Access articles published, all supplemental material carries a non-exclusive license, and permission requests for re-use of supplemental material or any part of supplemental material shall be sent directly to the copyright owner as specified in the copyright notice associated with the article.