
Abstract
Purpose
To predict bone marrow metastasis in neuroblastoma using contrast-enhanced computed tomography (CECT) radiomics features and explainable machine learning.
Methods
This cohort study retrospectively included a total of 345 neuroblastoma patients who underwent testing for bone marrow metastatic status. Tumor lesions on CECT images were delineated by two radiologists, and 1409 radiomics features were extracted. Correlation analysis, Least Absolute Shrinkage and Selection Operator regression, and one-way analysis of variance were used to identify radiomics features associated with bone marrow metastasis. A predictive model for bone marrow metastasis was then developed using the support vector machine algorithm based on the selected radiomics features. The performance of the radiomics model was evaluated using the area under the curve (AUC), 95% confidence interval (CI), accuracy, sensitivity, and specificity.
Results
The radiomics model included 16 features, with a predominant focus on texture features (12/16, 75%). In the training set, the model demonstrated an AUC of 0.891 (95% CI: 0.848-0.933), an accuracy of 0.831 (95% CI: 0.829-0.832), a sensitivity of 0.893 (95% CI: 0.840-0.946), and a specificity of 0.757 (95% CI: 0.677-0.837). In the test set, the AUC, accuracy, sensitivity, and specificity were 0.807 (95% CI: 0.720-0.893), 0.767 (95% CI: 0.764-0.770), 0.696 (95% CI: 0.576-0.817), and 0.851 (95% CI: 0.749-0.953), respectively.
Conclusion
Radiomics features extracted from CECT images are associated with the presence of bone marrow metastasis in neuroblastoma, providing potential new imaging biomarkers for predicting bone marrow metastasis in this disease.
Introduction
Neuroblastoma is a pediatric solid tumor originating from primitive neuroblasts and is often characterized by distant metastasis, with over 90% of metastatic lesions involving the bone marrow.1,2 Bone marrow involvement in neuroblastoma is associated with a higher risk of disease progression and poor outcomes. 3 Despite aggressive multi-modal combination therapies, the overall survival rate for high-risk patients with metastatic neuroblastoma remains below 50%. 4 Studies have shown that bone marrow metastasis is a significant risk factor associated with the prognosis of neuroblastoma patients.3,5 Therefore, timely and accurate detection of bone marrow metastasis is crucial for optimizing treatment strategies and improving patient outcomes.
Bone marrow biopsy and aspiration are commonly used to detect bone marrow metastasis in neuroblastoma. However, due to the typical involvement of multiple bone marrow compartments in neuroblastoma, diagnosis can be challenging, especially when the infiltrating neuroblastoma cells in the bone marrow are less than 30%. 6 Although commonly used methods such as morphological or immunocytological analysis can detect bone marrow metastasis in neuroblastoma, the sensitivity of these methods varies.7,8 Some laboratory indicators, such as vanillylmandelic acid (VMA), have been found to be associated with bone marrow metastasis in neuroblastoma. 9 However, the VMA test is sensitive to many external influences, such as foods and drugs. Additionally, these laboratory indicators can differ significantly across lesions located in different anatomical sites. 10 Furthermore, tumor markers may show limited correlation with minimal residual disease in high-risk neuroblastoma patients. 11 Therefore, the investigation for additional supplementary biomarkers associated with bone marrow metastasis in neuroblastoma is crucial. This could aid in the early diagnosis of bone marrow metastasis, particularly for lesions with minimal metastatic involvement. 12
In medical imaging, positron emission tomography/computed tomography (PET/CT) has the potential to reduce the need for invasive bone marrow biopsy and aspiration in cases where PET/CT results are negative. 13 However, although total lesion glycolysis and metabolic tumor volume were significantly associated with neuroblastoma bone marrow metastasis in univariate analysis, these conventional PET parameters were not independent risk factors for neuroblastoma bone marrow metastasis in multivariate analysis. 9 Recently, several studies have suggested that radiomics derived from medical imaging could provide imaging biomarkers for the diagnosis of neuroblastoma. 14 Feng et al. 15 observed a significant association between radiomics features based on PET/CT imaging and bone marrow metastasis in neuroblastoma, with their predictive model demonstrating excellent performance. Radiomics features derived from PET/CT were found to be as important as clinical features and conventional PET parameters. 16 While PET/CT is valuable for detecting distant metastasis and clinical staging of neuroblastoma, preoperative planning for neuroblastoma often relies on contrast-enhanced CT (CECT) or magnetic resonance imaging (MRI).17,18
Therefore, the aim of this study was to predict bone marrow metastasis in neuroblastoma using CECT radiomics features through an explainable machine learning approach. Additionally, we employed global and local explainable methods to emphasize the model's explainability. These methods also illustrated how the radiomics model could provide personalized predictions for individual cases.
Materials and Methods
Patient Selection
This retrospective study received approval from the Institutional Review Board of Children's Hospital of Chongqing Medical University (approval number: 202235), with a waiver of the requirement for informed consent from patients. All methods were performed in accordance with relevant guidelines and regulations, including the Declaration of Helsinki. The reporting of this study conforms to STROBE guidelines, 19 which is included in Supplemental Materials. Clinical and CECT imaging data were retrospectively and consecutively gathered from neuroblastoma patients who visited our institution between January 2010 and May 2023. All patient details were de-identified. Based on inclusion and exclusion criteria, a total of 345 pediatric patients were included in the study (Figure 1). The data were collected by two operators working together to ensure accuracy and consistency. The inclusion criteria were as follows: (1) pathologically confirmed neuroblastoma; (2) arterial-phase CECT examination; (3) bone marrow metastatic status confirmed by bone marrow aspiration with samples taken from the iliac bones. Exclusion criteria included: (1) prior anti-cancer therapy before the CECT examination; (2) the presence of artifacts or poor image quality. The time interval between the testing of bone marrow metastasis and the acquisition of the CT scan was less than two weeks. Based on the presence of bone marrow metastasis, all cases were categorized into metastasis and non-metastasis groups. The cases were then randomly stratified in a 7:3 ratio to form the training set (n = 242) and the test set (n = 103).

Flowchart of patient selection.
Image Acquisition, Image Preprocessing, and Tumor Delineation
CECT images were acquired using GE Lightspeed and Philips Brilliance CT scanners. The tube voltage ranged from 80 to 100 kV, with a tube current between 150 and 200 mAs, and a scanning slice thickness of 5.0 mm. A non-ionic iodinated contrast agent (Iodixanol, GE Healthcare) at a concentration of 320 mgI/ml was administered at a dosage of 1.5–2.0 ml/kg of body weight. The contrast agent was delivered through the cubital vein at a flow rate of 0.5 to 3.5 ml/s, and arterial-phase images were captured 20–28 s after the injection. To ensure the generalization of radiomics features across different scanners and scanning protocols, the CECT images were preprocessed before radiomics feature extraction. The preprocessing methods primarily included 1.0 mm × 1.0 mm × 1.0 mm voxel resampling and discretization of images with a bin width of 25.
CECT images for all cases were anonymously retrieved from the Picture Archiving and Communication System. The radiomics flowchart is illustrated in Figure 2. Initially, a pediatric radiologist with more than three years of experience delineated entire primary tumor lesions slice by slice on arterial-phase CECT images using the ITK-SNAP open-source software (version 4.0.0), excluding encased vascular structures (eg aorta, renal artery, veins, etc). Subsequently, another pediatric radiologist with over ten years of experience reviewed all delineated tumor lesions. Both radiologists were blinded to the bone marrow metastatic status of the cases during the delineation process. To assess the reproducibility of radiomics features across different operators, 40 cases were randomly selected from the training set, and the same method was used to delineate tumor lesions again for radiomics feature extraction. The intra-class correlation coefficient (ICC) for radiomics features extracted from twice delineations was calculated using the “psych” R package (https://CRAN.R-project.org/package=psych).

Radiomics flowchart in this study. ICC, intra-class correlation coefficient; PCC, Pearson correlation coefficient; LASSO, Least Absolute Shrinkage and Selection Operator; GLDM, Gray Level Dependence Matrix; GLCM, Gray Level Co-occurrence Matrix; GLSZM, Gray Level Size Zone Matrix; GLRLM, Gray Level Run Length Matrix; ANOVA, analysis of variance; SVM, support vector machine.
Radiomics Feature Dimension Reduction
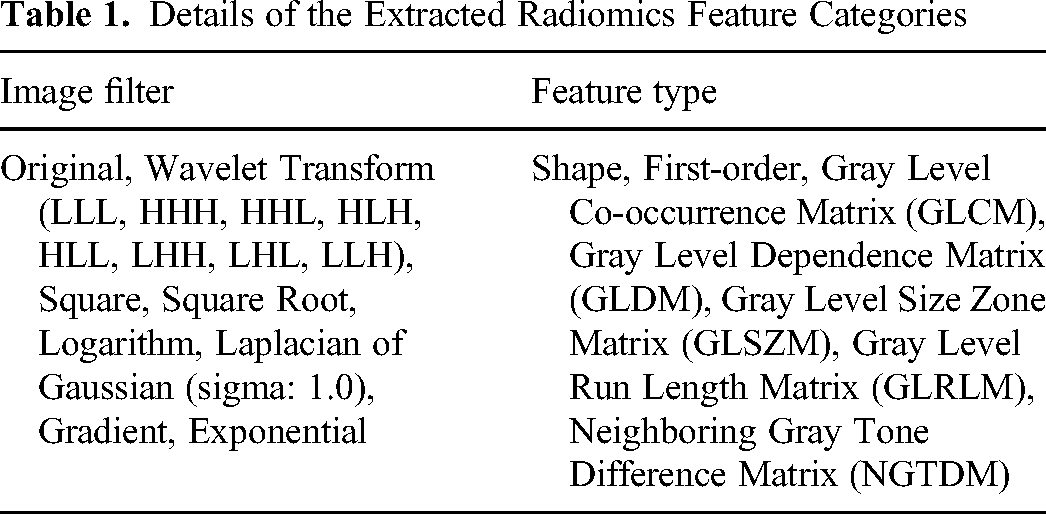
A total of 1409 radiomics features were extracted from each tumor lesion using various filters (Table 1). The extraction was performed using the FAE open-source software. 20 Since the Pyradiomics package was embedded within the FAE open-source software, the extracted radiomics features complied with the Image Biomarkers Standardization Initiative standards. 21 All radiomics features were standardized using z-sore standardization to eliminate the effects of different dimensions. In this study, we employed the following statistical methods for selecting radiomics features in the training set. First, radiomics features with an ICC greater than 0.75 were retained to enhance the repeatability of selected features across different operators. ICC values between 0.75 and 0.90 indicate good reliability, and values greater than 0.90 indicate excellent reliability. 22 As a result, many radiomics studies used 0.75 as the screening threshold for ICC.23,24
Details of the Extracted Radiomics Feature Categories
To address potential redundancy among radiomics features extracted from a high-dimensional data space, Pearson correlation analysis was applied, and features with a Pearson correlation coefficient (PCC) less than 0.90 were retained. Pearson correlation is a statistical method that measures the linear relationship between two data objects, and it can be used for dimensionality reduction of radiomics features. 25 Next, the “glmnet” R package (https://CRAN.R-project.org/package = glmnet) was used to input the remaining features into the Least Absolute Shrinkage and Selection Operator (LASSO) algorithm, which selects radiomics features with non-zero coefficients. The optimal lambda value was determined through five-fold cross-validation. LASSO is a widely used method for high-dimensional data analysis because it performs both regularization and variable selection simultaneously. 26 Finally, one-way analysis of variance (ANOVA) was conducted to retain radiomics features with a P-value less than 0.05. ANOVA is a statistical method used to determine if there are significant differences between the means of independent groups. It helps retain the most relevant radiomics features and is effective for improving predictive performance in radiomic studies. 27
Machine Learning and Validation
Based on the radiomics features retained after ANOVA analysis, a radiomics model was constructed in the training set using the support vector machine (SVM) algorithm from the “e1071” R package (https://CRAN.R-project.org/package = e1071). The SVM parameters were optimized through grid search to identify the best configuration. The final parameters were set as follows: kernel = “radial”, gamma = “1/feature number”, cost = “1.0”, degree = “3.0”. The predictive performance of the established radiomics model for bone marrow metastasis was then validated in both the training and test sets. Receiver operating characteristic (ROC) curves and precision-recall curves were generated to visualize the predictive efficacy of the radiomics model in both datasets. Additionally, lift charts were created to evaluate the performance of the radiomics model in the training and test sets. To evaluate the robustness of the proposed model, we used five-fold cross-validation within the training set to further validate the model's robustness. This is to assess the consistency of the model's performance across different subsets of the training data, ensuring that the model is not overly dependent on any single data partition. By repeatedly validating the model within the training set, variations in performance can be identified, and the stability and reliability of the model's predictions can be confirmed.
Global and Local Explanations of Machine Learning Model
Despite the outstanding performance of non-linear machine learning algorithms in previous studies, their inherent lack of transparency and explainability has become a significant constraint, limiting their application in the medical field. 28 Linear algorithms, such as linear regression, predict outputs based on linear relationships, which makes them relatively explainable. The contribution of each feature can be directly understood through model coefficients, allowing for a clear understanding of each feature's impact on the output. In contrast, non-linear algorithms produce more complex models that capture intricate non-linear relationships between features, but they are difficult to explain with simple mathematical expressions. The importance of features in non-linear models is harder to quantify, often requiring methods like SHapley Additive exPlanations (SHAP) values to interpret the contributions of individual features.29,30 Therefore, explainable machine learning aims to address key questions, such as identifying the most important features, explaining individual predictions, and understanding the overall behavior of the model.
In this study, we used the “DALEX” R package for both global and local explanations of the radiomics model, which clarified the relationship between input variables and model output (https://CRAN.R-project.org/package = DALEX). To start, we generated feature importance plots and partial dependence plots (PDPs) to provide a global explanation of the features in the radiomics model. The “DALEX” R package employs a permutation-based method for assessing feature importance, determining the significance of each feature by calculating the increase in model prediction error after permuting the feature values. 31 Additionally, PDPs visualize how different features influence predictions in machine learning models, showing how the model's average predictions change as a single feature varies while other features remain constant. 32
We then provided detailed local explanations for four cases within the test set using Breakdown and SHAP methods. These four cases included: one where bone marrow metastasis occurred with accurate model prediction, one where it occurred with inaccurate model prediction, one where it did not occur with accurate model prediction, and one where it did not occur with inaccurate model prediction. The Breakdown method illustrates which features in the model influence the prediction of a specific case and the extent of their impact, helping to clarify each feature's contribution to the prediction. 33 Additionally, the SHAP method, based on Shapley values, quantifies the contribution of each feature to the model's prediction for a specific case. 34 Finally, we used Ceteris-paribus plots to show how the radiomics model's predictions for these four specific cases change with variations in important features.
Statistical Analysis
In this study, we used RStudio (version 4.2.2) and SPSS (version 26.0, IBM Corp., Armonk, NY) for statistical analysis. Age was expressed as mean ± standard deviation, and a Student t-test was conducted to compare age between the two groups. Categorized data were presented as case number (percentage), and a Chi-square test was used to compare these categorized variables between the groups. To evaluate the predictive performance of the radiomics model in both the training and test sets, we calculated the area under the curve (AUC), 95% confidence interval (CI), sensitivity, specificity, accuracy, negative prediction value, and positive prediction value using the “reportROC” R package. Correlation heatmaps of the radiomics features were generated using the “pheatmap” and “corrplot” R packages. A two-sided P-value less than 0.05 was considered statistically significant.
Results
Patient Clinical Information
We enrolled 345 pediatric patients diagnosed with neuroblastoma, consisting of 193 males and 152 females. The mean age was 36 ± 29 months, ranging from 1 month to 14 years. The dataset was divided into a training set (n = 242) and a test set (n = 103). Overall, 54% (187/345) of the cohort exhibited bone marrow metastasis, while 46% (158/345) did not. The clinical information for the metastasis and non-metastasis groups in both the training and test sets is presented in Table 2.
Distribution of Patient Clinical Information in the Training and Test Sets

Reduction of Radiomics Feature Dimensionality
A total of 1409 radiomics features were extracted from each lesion. Forty cases were included in the analysis of radiomics feature reproducibility, comprising 25 boys and 15 girls, with a median age of 14 months (interquartile range: 9 to 35 months). Among these, 23 cases had bone marrow metastasis, while 17 cases did not. The ICC analysis revealed that the average and standard deviation of the ICC for radiomics features extracted from the two delineations were 0.88 and 0.20, respectively. Among all features, 1203 features (1203/1409, 85%) had an ICC greater than 0.75 and were therefore included in the Pearson correlation analysis. PCC analysis indicated that 839 radiomics features (839/1203, 70%) had a PCC greater than 0.90. Consequently, 364 radiomics features (364/1203, 30%) with a PCC less than 0.90 were input into the LASSO algorithm (Figures 3A and 3B). Following LASSO selection, 32 radiomics features (32/364, 9%) with non-zero coefficients were retained (Figures 3C-3E). One-way ANOVA analysis revealed that 16 radiomics features (16/32, 50%) had a P-value less than 0.05. The importance ranking of these features is shown in Figure 3F. In the entire cohort, the distribution differences between the metastasis and non-metastasis groups for the representative radiomics features are depicted in Figure 4.
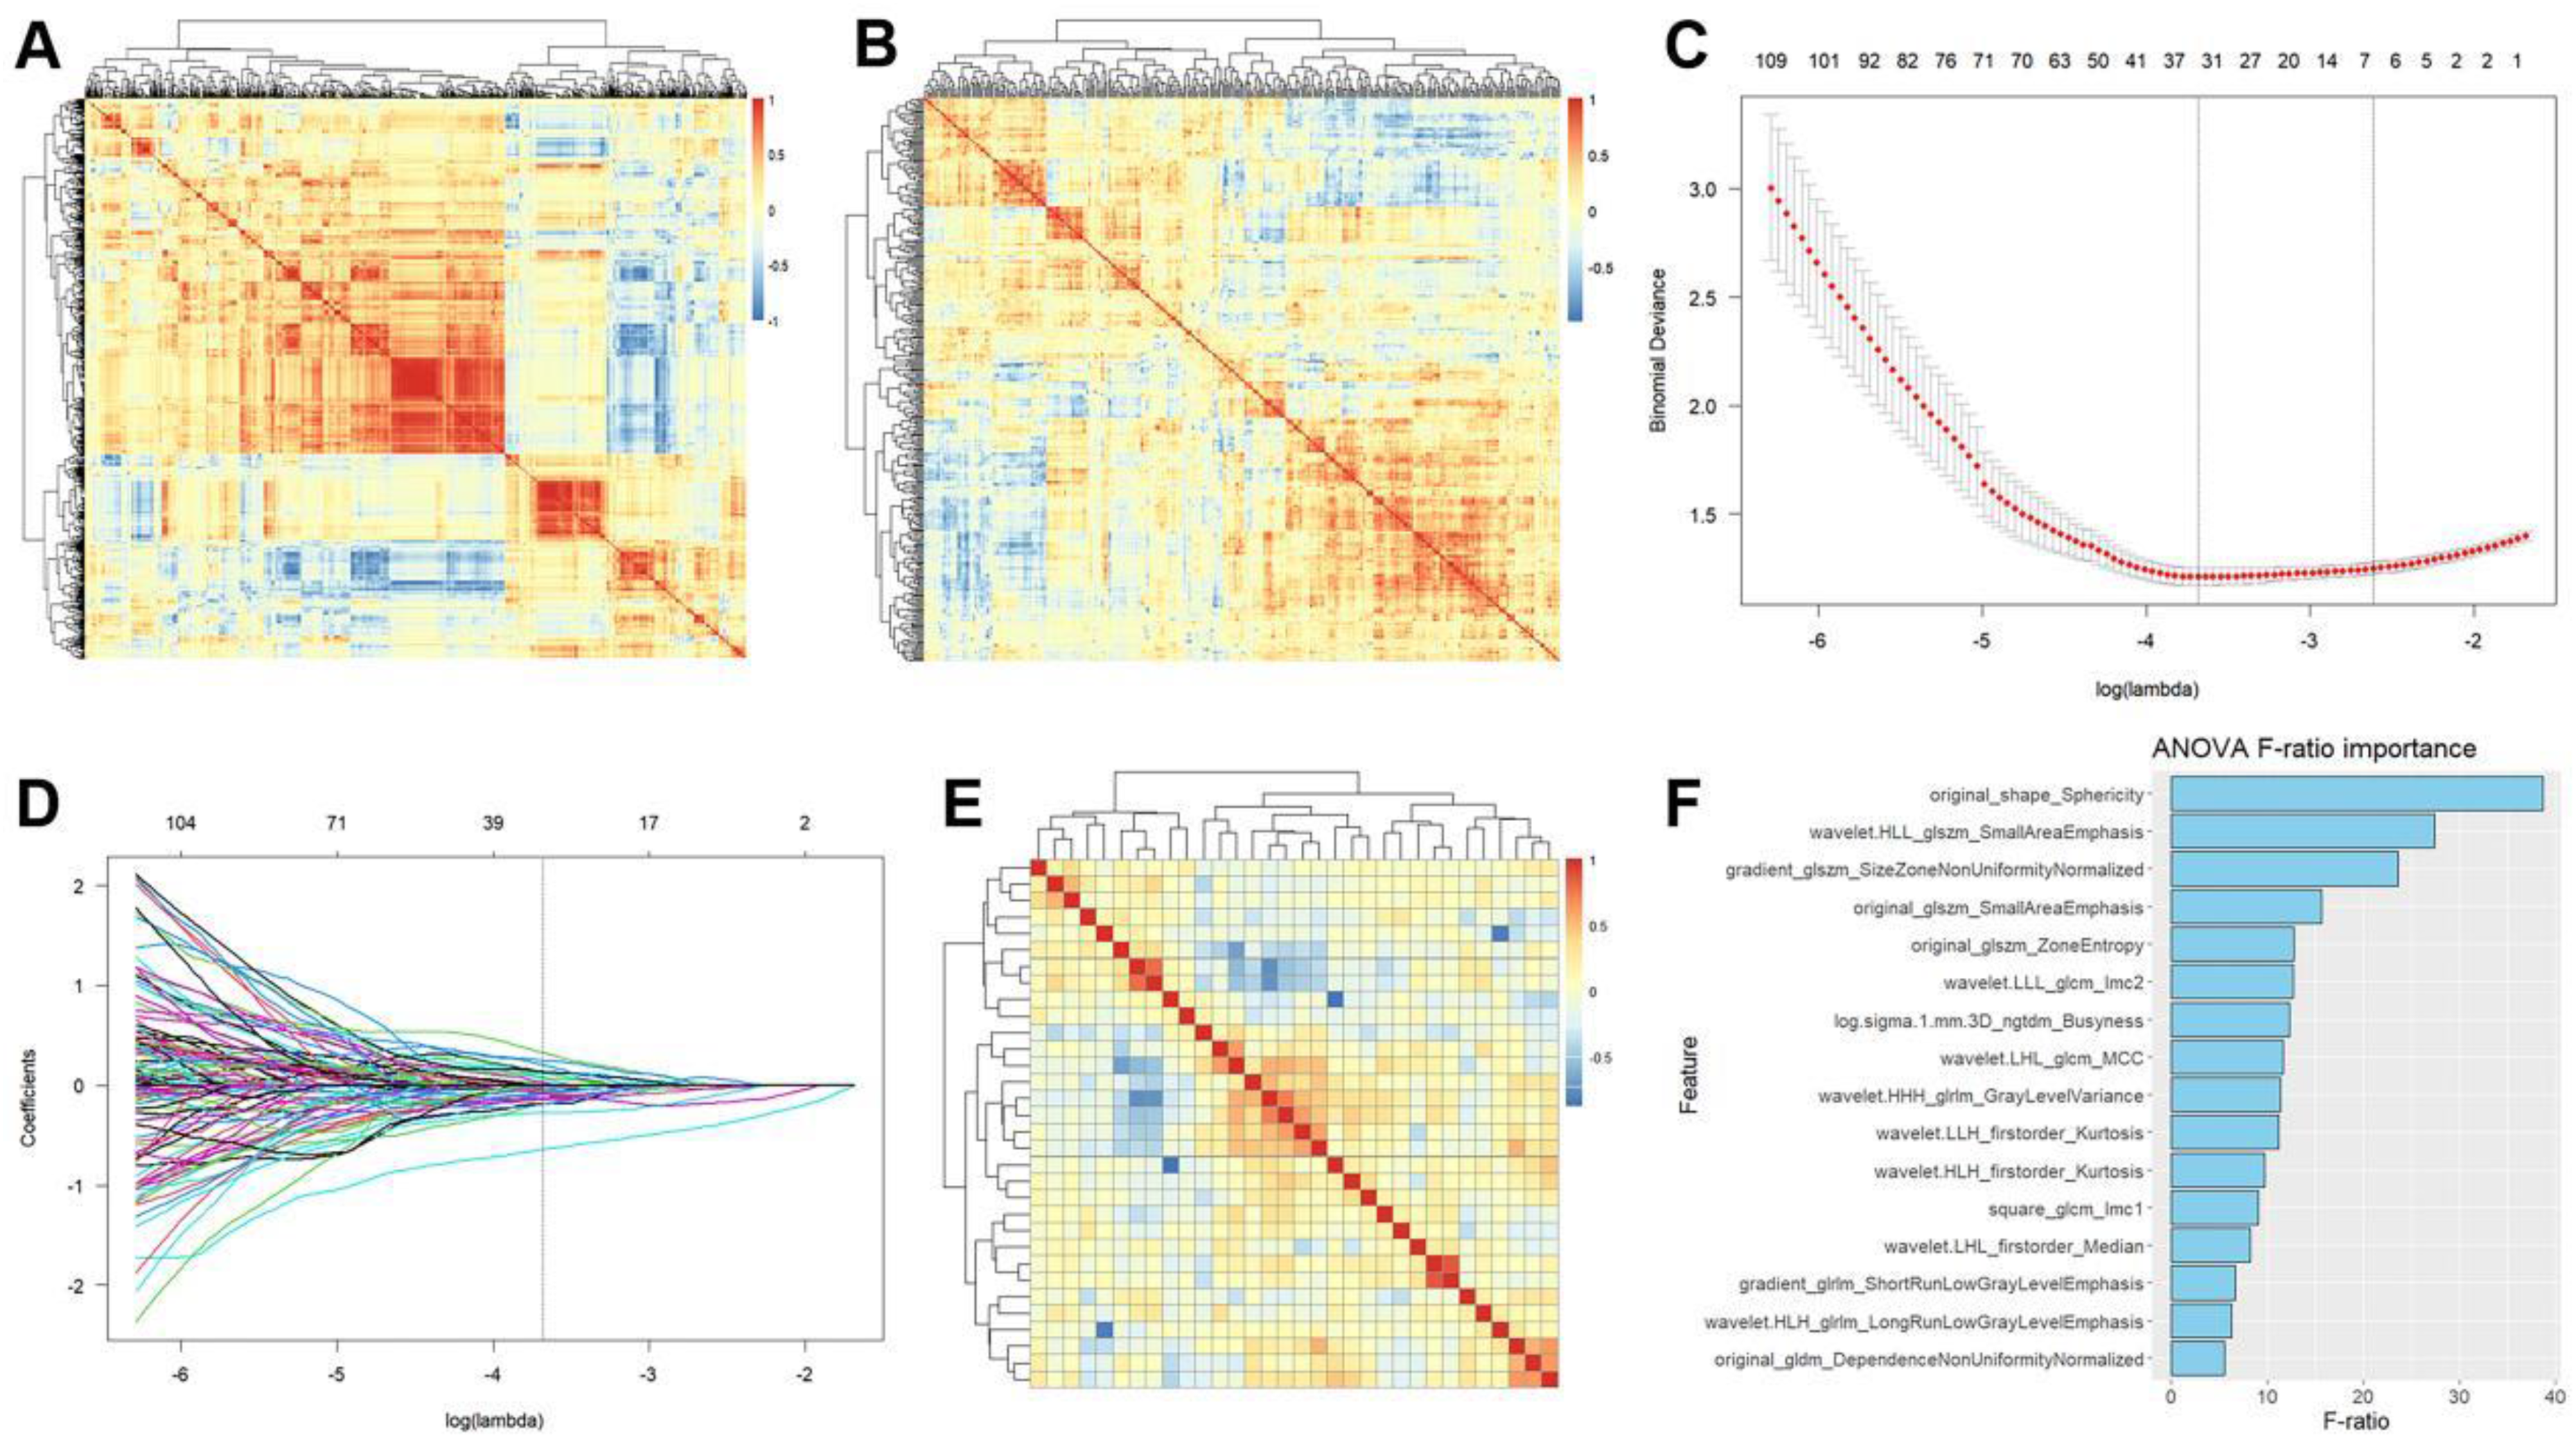
Selection process of the radiomics features. Figures A and B display the correlation heatmap of radiomics features before and after Pearson correlation analysis, respectively. Figure C illustrates the determination of the optimal lambda value with the minimum predictive error via a five-fold cross-validation process using the Least Absolute Shrinkage and Selection Operator algorithm. Figure D showcases the selection of radiomics features with non-zero coefficients under the threshold of the optimal lambda value. Figure E presents the correlation heatmap of radiomics features selected by the Least Absolute Shrinkage and Selection Operator. Figure F demonstrates the importance plot of the selected radiomics features with a P-value less than 0.05 through one-way ANOVA analysis.

Comparison of representative radiomics features between the non-metastasis and metastasis groups in the entire cohort.
Performance of the Radiomics Model
The radiomics model included 16 radiomics features, with a predominant focus on texture features (12/16, 75%). In the training set, the model demonstrated an AUC of 0.891 (95% CI: 0.848-0.933), an accuracy of 0.831 (95% CI: 0.829-0.832), a sensitivity of 0.893 (95% CI: 0.840-0.946), and a specificity of 0.757 (95% CI: 0.677-0.837). In the test set, the AUC, accuracy, sensitivity, and specificity were 0.807 (95% CI: 0.720-0.893), 0.767 (95% CI: 0.764-0.770), 0.696 (95% CI: 0.576-0.817), and 0.851 (95% CI: 0.749-0.953), respectively. The ROC and precision-recall curves for the radiomics model in both the training and test sets are depicted in Figures 5A-5C. The lift charts in the training and test sets indicated that the model's predictive ability for positive samples was superior to random acquisition without the use of this model (Figures 5D and 5E). Table 3 presents a more detailed set of evaluation metrics for the radiomics model.

Performance of the radiomics model. Figure A displays the receiver operating characteristic curves of the radiomics model in the training and test sets. Figures B and C present the precision-recall curves of the radiomics model in the training and test sets, respectively. Figures D and E showcase the lift curves of the radiomics model in the training and test sets, respectively. The solid curves above the lower dashed lines in Figures D and E indicate that the radiomics model outperforms a random model.
Evaluation Metrics of the Radiomics Model in the Training and Test Sets

Explainability of the Radiomics Model
After the permutation of radiomics features, different features exhibited varying degrees of influence on the model performance (Figure 6A). The top three most crucial features were wavelet.LLH.firstorder_Kurtosis, wavelet.LLL_glcm_Imc2, and wavelet.HHH_glrlm_GrayLevelVariance. The PDPs in Figure 6B revealed that different radiomics features had unique correlations with the model's average predictions. Furthermore, in the four cases from the test set, various features in the radiomics model showed differences in importance for predicting these cases. The local explanations of the radiomics model for these four cases are illustrated in Figures 7–10.

Global explanation of the radiomics model. Figure A depicts the feature importance of the radiomics features. Figure B illustrates the partial dependence plot of the radiomics features. On the horizontal axis of Figure B, individual feature values are represented, while the vertical axis shows the effects of each feature on the predicted outcomes of the radiomics model. Features 1 to 16 correspond to the radiomics features ranked by ANOVA F-ratio importance in Figure 1F in sequential order.
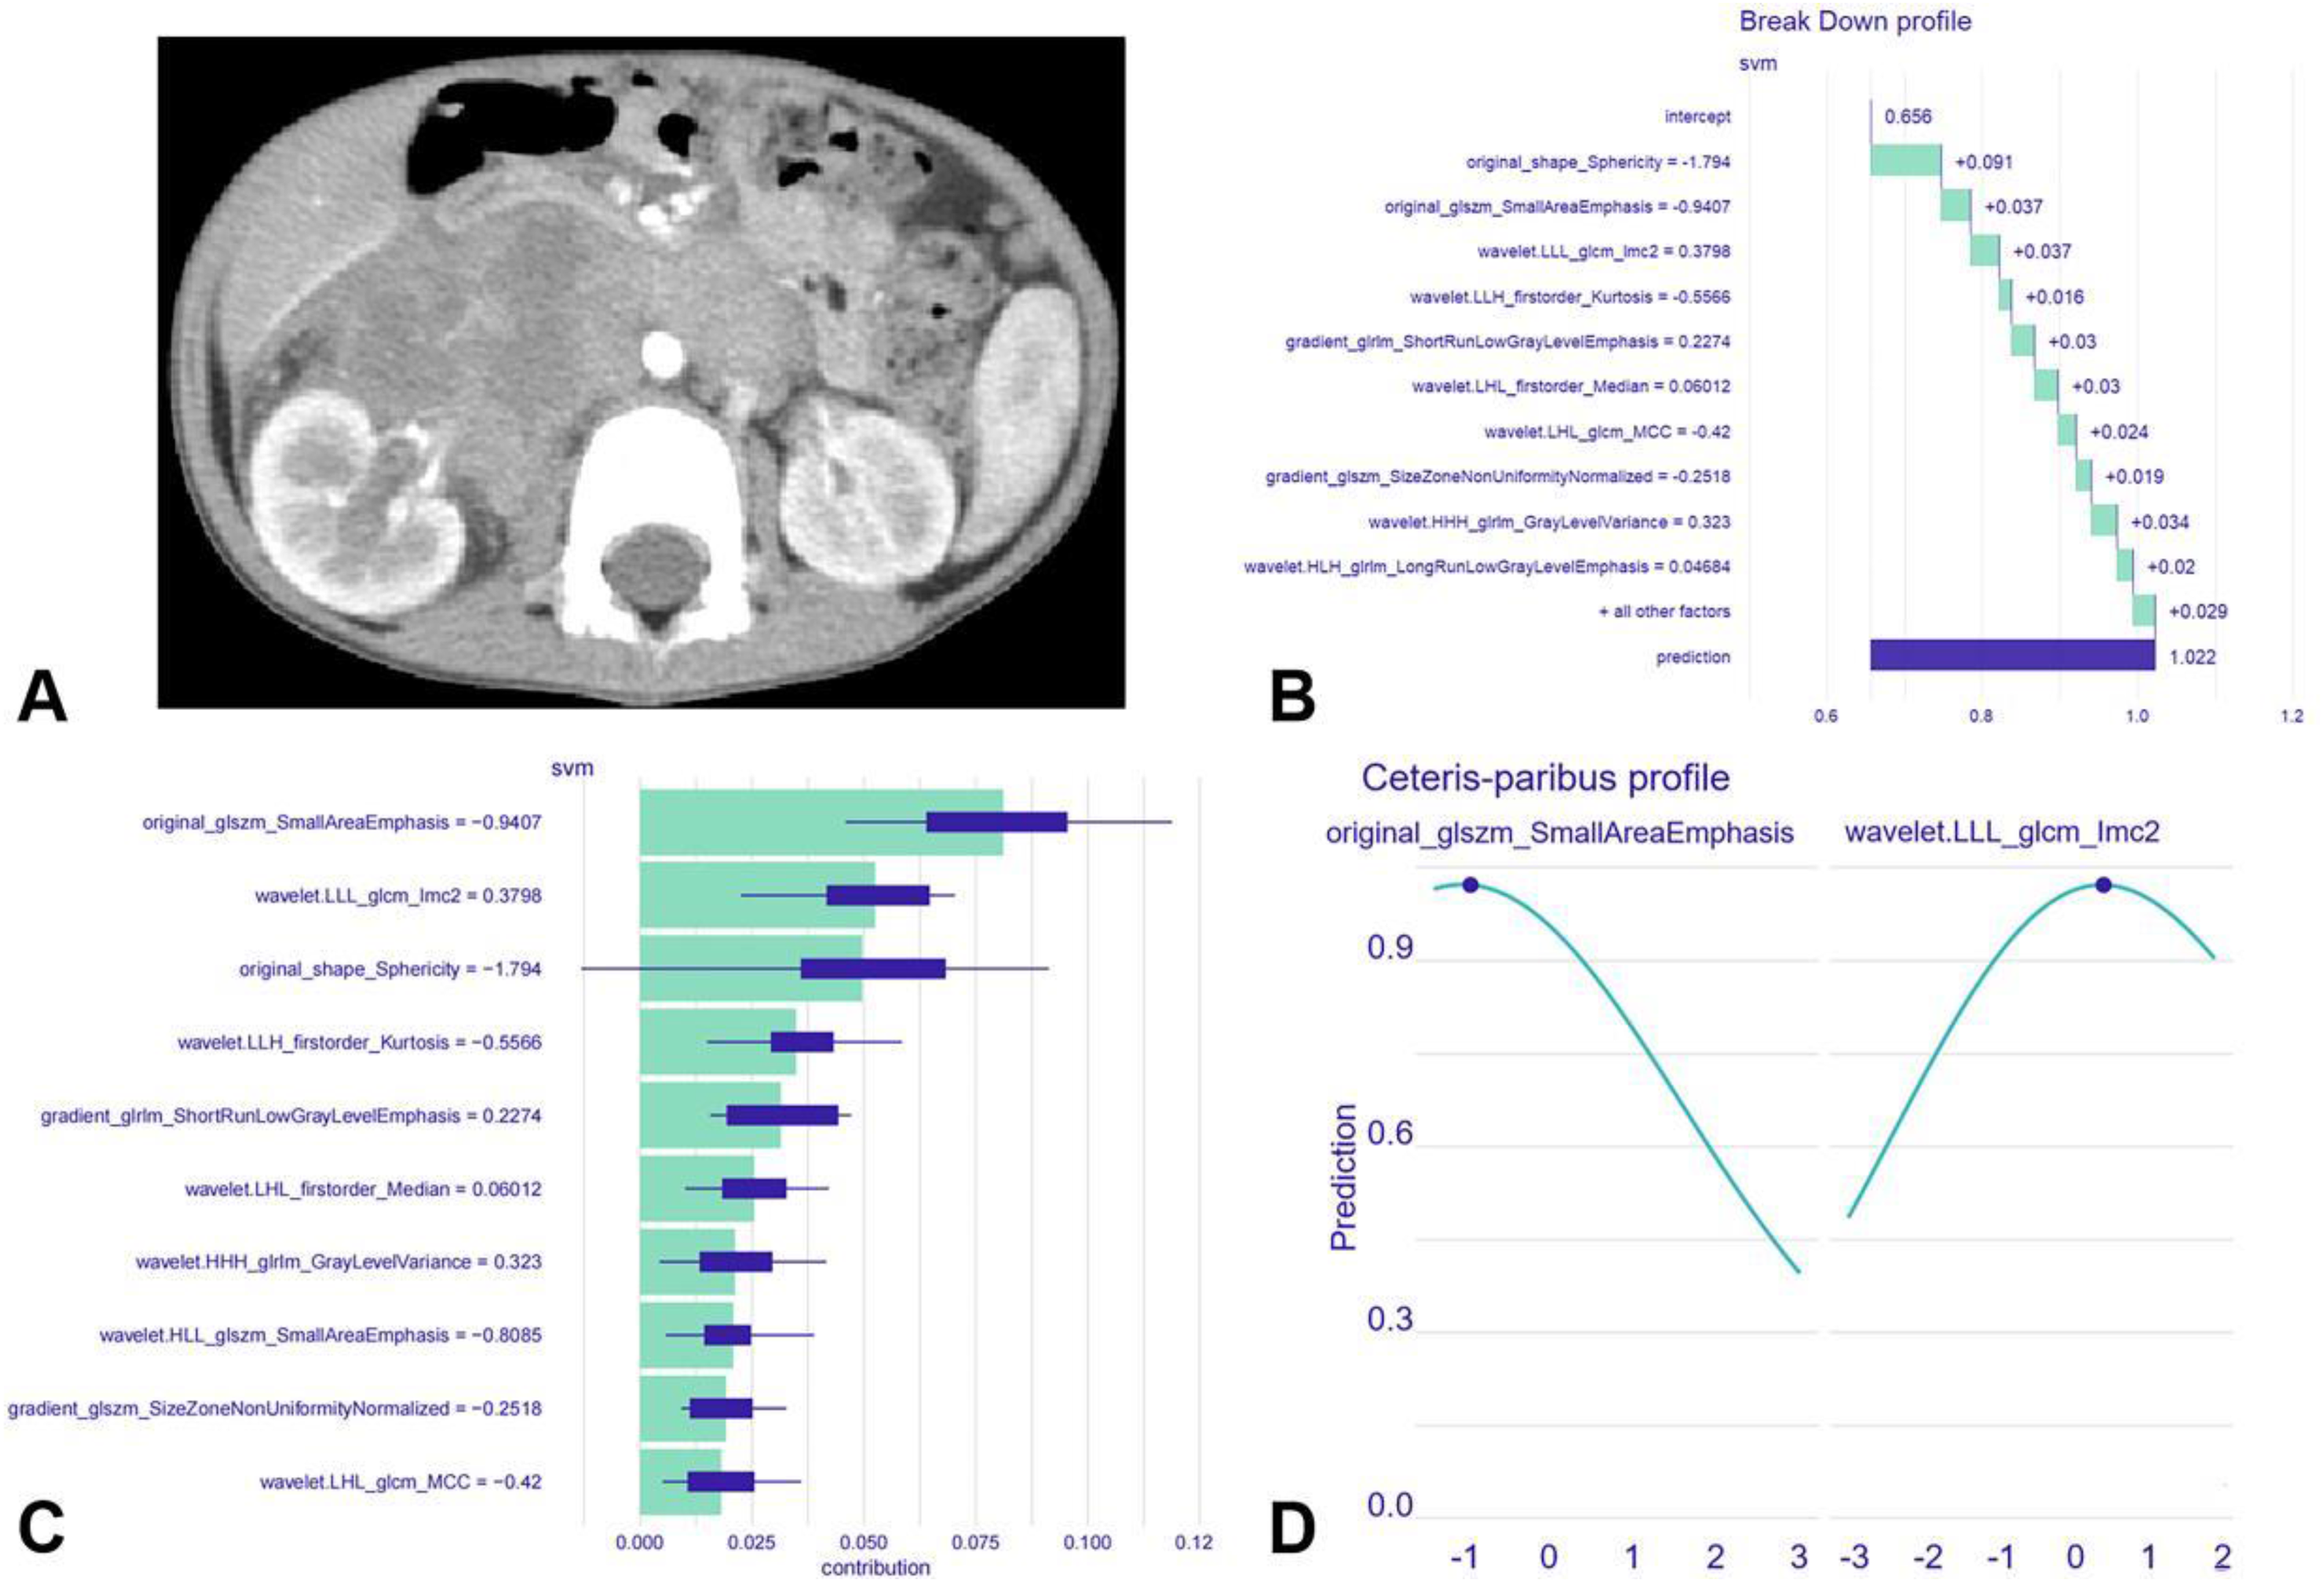
Local explanation of the radiomics model for case 1, where bone marrow metastasis actually occurred and the radiomics model correctly predicted it. Figure A presents the axial CECT image of the neuroblastoma lesion in a 4-year-old male patient. For Case 1, the model's prediction was 1.022, surpassing both the average model prediction of 0.656 and that for 92% of all observations (Figure B). The most significant feature was original_glszm_SmallAreaEmphasis, contributing to a prediction increase of 0.081. The second most significant feature was wavelet.LLL_glcm_Imc2, leading to a prediction increase of 0.052 (Figure C). Figure D illustrates how the radiomics model's prediction for Case 1 changes with alterations in these two features, where the blue dots represent the actual predictions for Case 1.

Local explanation of the radiomics model for Case 2, where bone marrow metastasis actually occurred, but the radiomics model predicted that bone marrow metastasis did not occur. Figure A shows the axial CECT image of the neuroblastoma lesion in a 1-month-old female patient. For Case 2, the model's prediction was −0.004, which was lower than both the average model prediction of 0.656 and that for 96% of all observations (Figure B). The most significant feature was original_glszm_SmallAreaEmphasis, contributing to a prediction decrease of 0.241. The second most significant feature was wavelet.HLL_glszm_SmallAreaEmphasis, leading to a prediction decrease of 0.151 (Figure C). Figure D illustrates how the radiomics model's prediction for Case 2 changes with alterations in these two features, where the blue dots represent the actual predictions for Case 2.
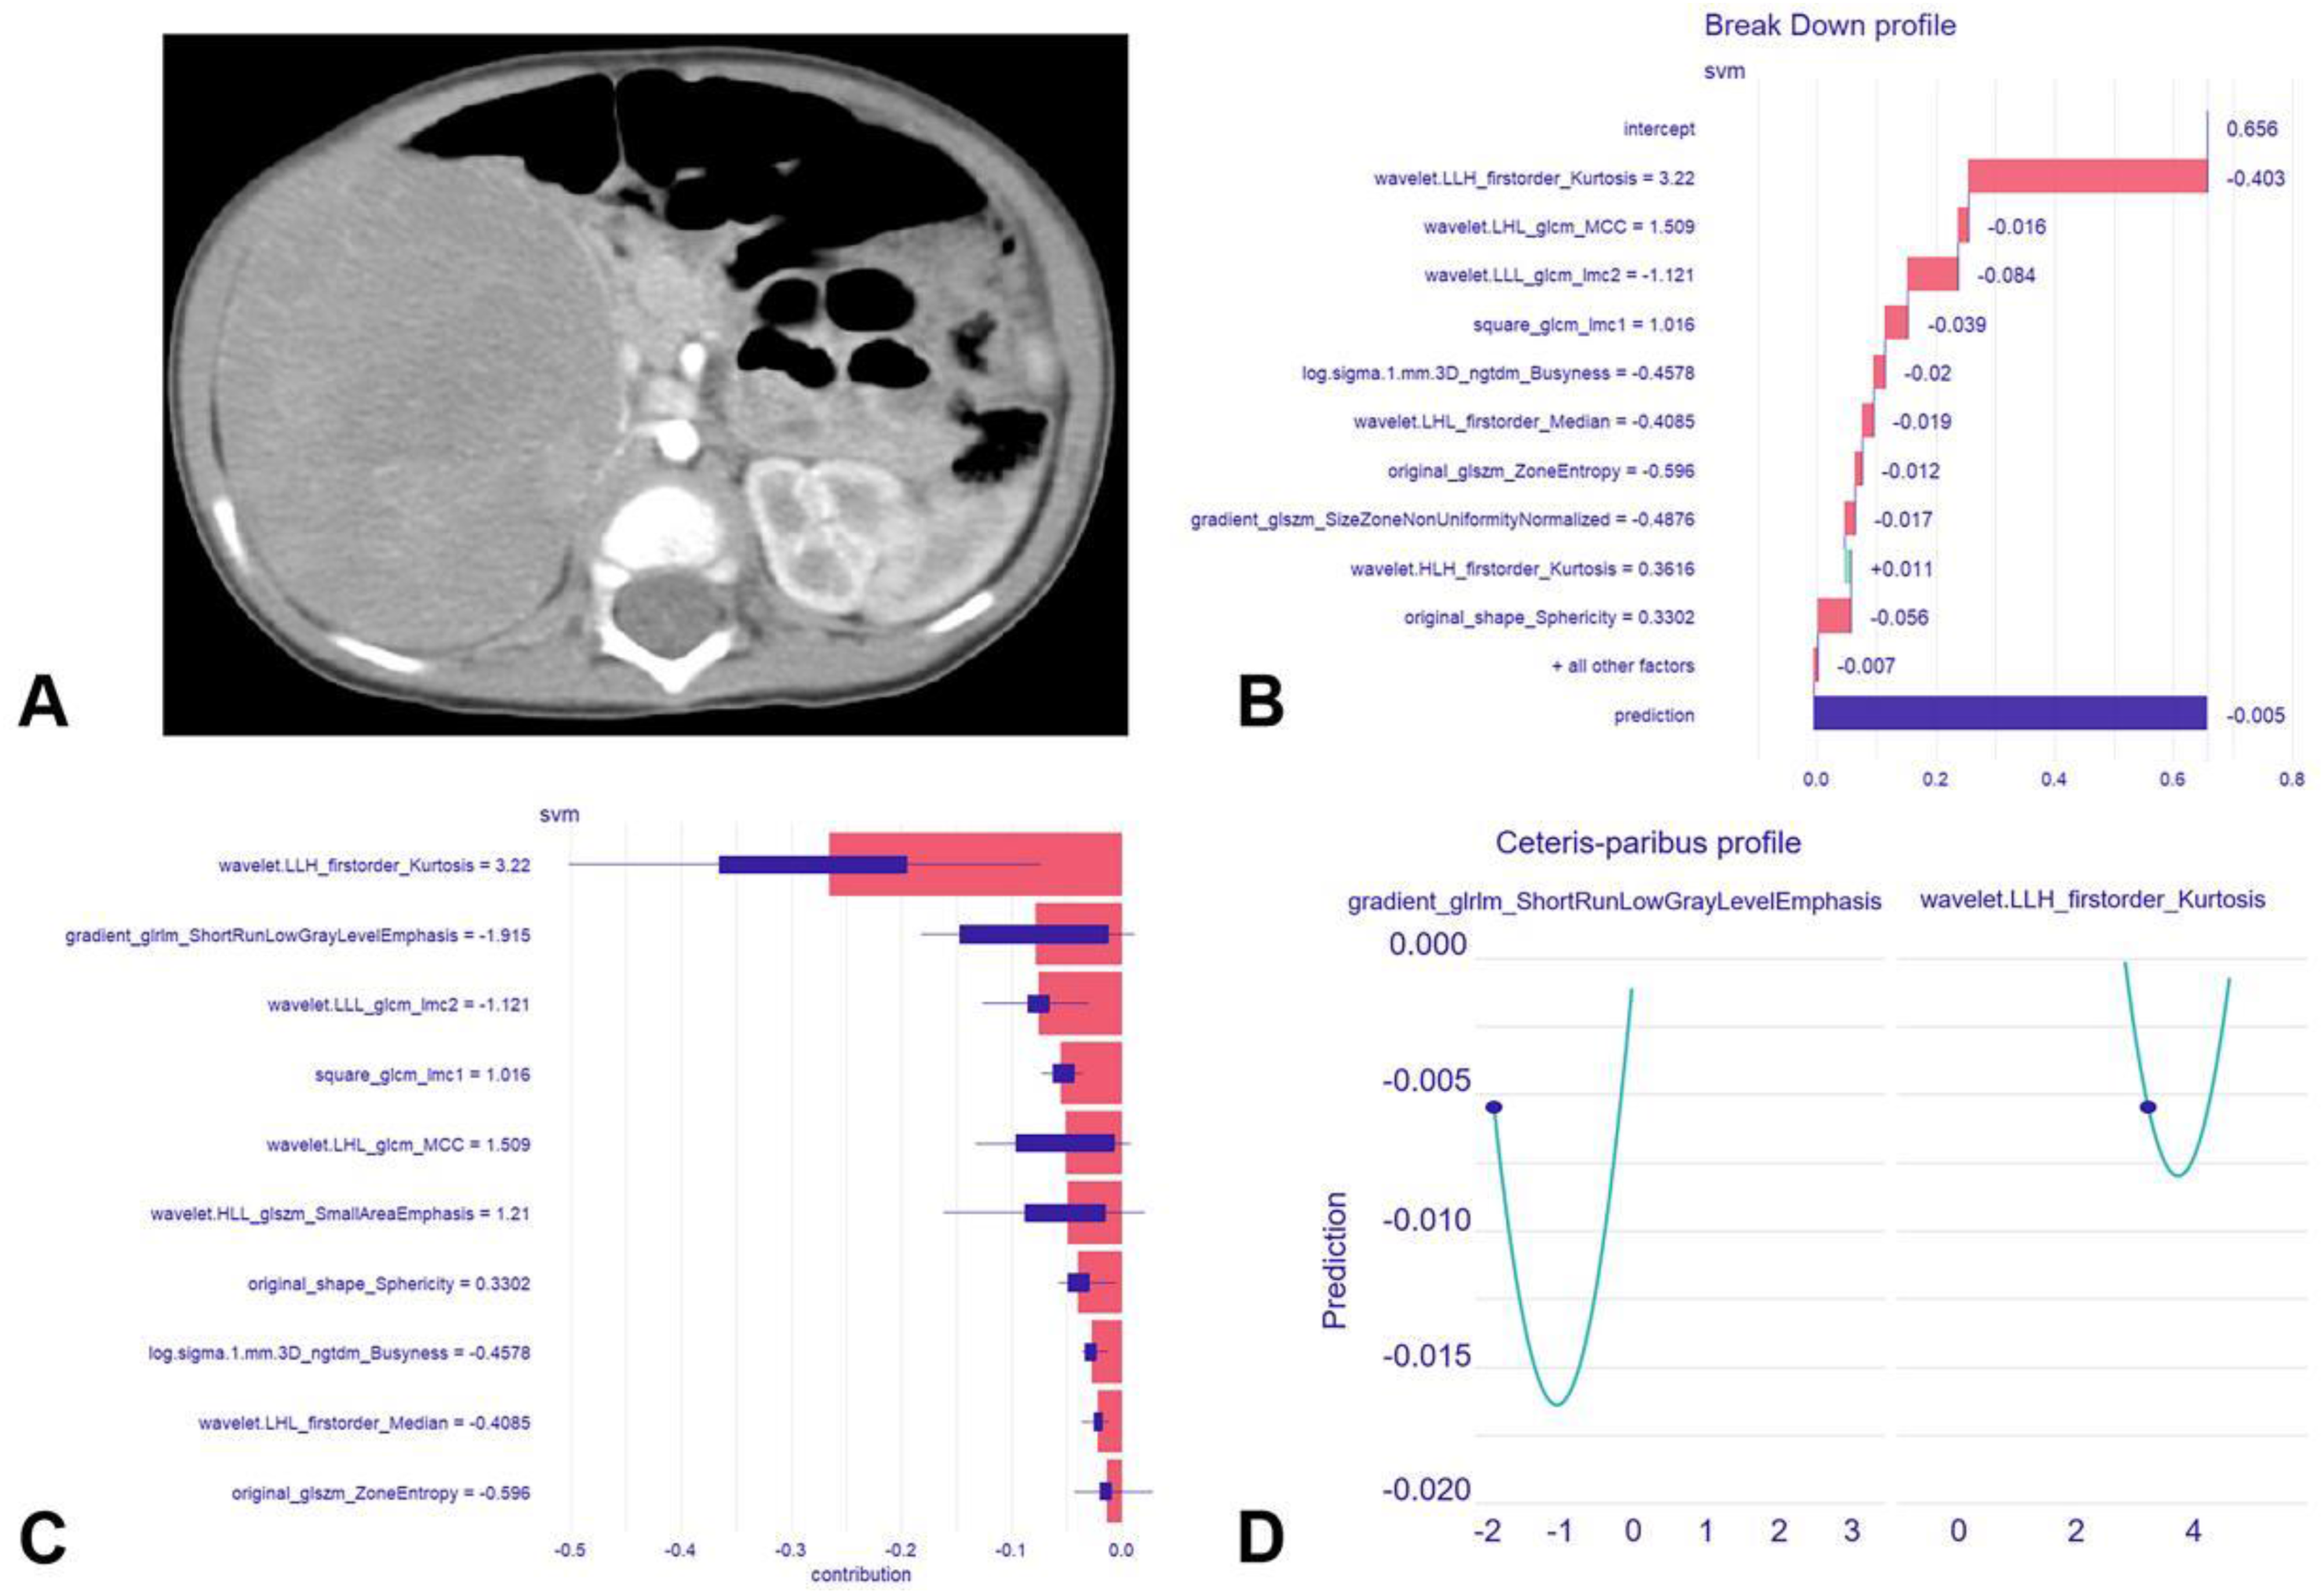
Local explanation of the radiomics model for Case 3, where bone marrow metastasis did not actually occur and the radiomics model correctly predicted it. Figure A shows the axial CECT image of the neuroblastoma lesion in a 9-month-old male patient. For Case 3, the model's prediction was −0.005, which was lower than both the average model prediction of 0.656 and that for 96% of all observations (Figure B). The most significant feature was wavelet.LLH_firstorder_Kurtosis, contributing to a prediction decrease of 0.267. The second most significant feature was gradient_glrlm_ShortRunLowGrayLevelEmphasis, leading to a prediction decrease of 0.079 (Figure C). Figure D illustrates how the radiomics model's prediction for Case 3 changes with alterations in these two features, where the blue dots represent the actual predictions for Case 3.

Local explanation of the radiomics model for case 4, where bone marrow metastasis did not actually occur, but the radiomics model predicted the occurrence of bone marrow metastasis. Figure A shows the axial CECT image of the neuroblastoma lesion in a 16-month-old male patient. For Case 4, the model's prediction was 0.769, surpassing both the average model prediction of 0.656 and that for 54% of all observations (Figure B). The most significant feature was square_glcm_Imc1, contributing to a prediction decrease of 0.068. The second most significant feature was gradient_glrlm_ShortRunLowGrayLevelEmphasis, leading to a prediction decrease of 0.066 (Figure C). Figure D illustrates how the radiomics model's prediction for Case 4 changes with alterations in these two features, where the blue dots represent the actual predictions for Case 4.
Discussion
In this study, we employed CECT radiomics analysis to predict bone marrow metastasis in neuroblastoma. The results demonstrated a significant correlation between CECT radiomics features and the risk of bone marrow metastasis. Furthermore, the radiomics model based on these features achieved good predictive performance. These findings suggest that CECT radiomics provides additional imaging biomarkers for predicting bone marrow metastasis in neuroblastoma, potentially enhancing the detection of subtle bone marrow metastases that might be challenging to identify through conventional methods. Additionally, the explainable methods used to explain the radiomics model established by non-linear machine learning help clarify the relationship between input variables and model output.
Different imaging modalities can lead to discrepancies in radiomics features. A recent study comparing radiomics features derived from CECT and MRI for predicting pathological subtypes of neuroblastoma found differences between the features obtained from these modalities, with the CECT radiomics model showing superiority over the MRI radiomics model. 35 In two recent studies using radiomics features from CT and MRI to predict neuroblastoma bone marrow metastasis, the optimal CT-based radiomics model outperformed the optimal MRI-based radiomics model in the validation set,36,37 indicating CT images may better capture the heterogeneity of neuroblastoma. Therefore, investigation focused on CT radiomics relevant to bone marrow metastasis is crucial, as it holds the potential to advance the field of multi-modality imaging for neuroblastoma. In our study, we also identified a significant correlation between CECT radiomics features and the incidence of bone marrow metastasis in neuroblastoma. Among the selected radiomics features, texture features were predominant, suggesting a strong association between the heterogeneity in voxel distribution within CECT images and the occurrence of bone marrow metastasis in neuroblastoma.
It is worth noting that while the final CECT radiomics features selected in our study were primarily texture features, similar to those in another study, 37 differences in the specific types of texture features may arise due to variations in CT scanners and scanning protocols. In our preliminary experiments, we found that the radiomics model based on arterial-phase CECT images performed better than one based on venous-phase CECT images in predicting bone marrow metastasis. Consequently, we chose to use arterial-phase images for the formal study to optimize our predictive accuracy. We speculate that arterial-phase CECT images may better reflect the heterogeneity of neuroblastoma because neuroblastoma often encases adjacent vascular structures. Previous studies have also demonstrated that arterial-phase CECT images are effective in differentiating between both histological subgroups of neuroblastoma and high-risk versus non-high-risk subtypes.38–40
In a previous study, Feng et al 11 found that lesions with bone marrow metastasis exhibited significantly higher radiomics scores from PET/CT, further indicating the heterogeneity of image texture in lesions with bone marrow metastases. Prior studies have also highlighted a correlation between texture features observed in medical images and the aggressive biological behavior of neuroblastoma.41–43 The texture features of CECT images in our study were associated with neuroblastoma bone marrow metastasis, reflecting potential changes in the microscopic structure and biological characteristics of tumor tissues. Texture features are mathematical indicators designed to characterize the distribution of voxels and grayscale variations within an image, with their variations revealing the heterogeneity and complexity of tissues. 44 The occurrence of metastasis can induce changes in local cell density and extracellular matrix,45,46 and such alterations may be reflected in the texture features. Moreover, the growth and metastasis of tumors are frequently accompanied by the emergence of new blood vessels and changes in blood flow. 47 These processes may lead to an uneven grayscale distribution in the images, thereby influencing the texture features.
In prior studies, non-linear machine learning algorithms, including multilayer perceptron and random forest, provided better predictive performance than linear machine learning algorithms for establishing radiomics models to predict neuroblastoma bone marrow metastasis.36,37 This suggests that non-linear algorithms are better at capturing complex data relationships that linear models might overlook, resulting in more accurate predictions. However, the enhanced performance of non-linear algorithms comes with a trade-off: they tend to lack transparency, making it challenging to understand the contribution of individual features to the model's predictions. This opacity hinders an intuitive grasp of the relationship between input features and model outputs. 48 In the medical field, explainable artificial intelligence is becoming increasingly important, as it helps clinicians interpret artificial intelligence-generated insights and incorporate them effectively into patient care plans. 49 Compared to deep learning, traditional machine learning algorithms require fewer computational resources and can operate in smaller computing environments, making them more accessible for use in institutions with limited data and infrastructure. 50 Many traditional machine learning algorithms perform well on smaller datasets and have fewer hyperparameters, making the tuning process relatively straightforward.
In our established radiomics model, there is a disparity between the feature importance rankings obtained through global explanation and those derived from ANOVA. The SVM algorithm considers the interactions between features, whereas ANOVA typically focuses on the impact of individual features. This suggests that machine learning algorithms are more likely to accurately capture nonlinear relationships when there are interactions between features. In previous radiomics studies, although non-linear machine learning algorithms have shown excellent performance across various prediction tasks, the explainability of these models has been a longstanding concern. 51 Despite their ability to flexibly adapt to complex datasets, the intricate internal workings of these non-linear algorithms pose challenges for explaining the prediction processes of the models. 52 In this study, we tried to gain a deeper understanding of the local explainability of the radiomics model, particularly focusing on the impact of individual features on the predictions for specific cases. Through local explanation of four cases, we discovered variations in the importance of different radiomics features in specific case predictions. For example, in the case of Small Area Emphasis, high values indicate a concentration of voxel intensity in small regions of the image, while low values suggest a more dispersed distribution of voxel intensity. In Cases 1 and 2, Small Area Emphasis emerges as the most important feature influencing the radiomics model's predictions. This indicates that the distribution of voxel intensity in small regions significantly affects the model's predictions for these cases in CECT images. Therefore, applying local explanations to specific cases helps clarify why the radiomics model generates certain predictive decisions.
This study has some limitations. First, it was a single-center retrospective study, and the imaging data used were derived from the scanners and protocols of our institution. This could limit the application of the radiomics model across different scanners and protocols at other institutions, necessitating further validation through multi-center data to ensure the model's generalizability. Second, our sample size is relatively small, which may impact the statistical power and reliability of the model. Therefore, expanding the sample size in future research is necessary. Third, we retrospectively collected cases continuously in an effort to include as many cases as possible. However, due to the retrospective nature of the study and the availability of cases, a formal sample size calculation was not performed. Then, the extensive time span of this study, covering patients treated over a ten-year period, resulted in some missing or unavailable laboratory markers, which were not incorporated into the combined model construction process. Future studies should aim to establish different combined models for neuroblastoma in various locations, considering that the clinical variables of neuroblastoma in different anatomical sites can differ significantly. 53 Finally, in the context of clinical decision-making support systems, deep learning techniques such as Class Activation Mapping are frequently utilized, whereas radiomics-based machine learning technology typically employs radiomics maps. These maps generate heatmaps that display the importance of different regions. However, the primary focus of our study was on explaining the contribution of each feature in a non-linear algorithm model to the model prediction. Therefore, we did not use visual techniques like radiomics maps, as our approach prioritizes quantifying feature importance directly within the context of the non-linear model.
Conclusion
In conclusion, radiomics features derived from CECT images are associated with the presence of bone marrow metastasis in neuroblastoma, offering promising new imaging biomarkers for predicting such metastasis. Moreover, the incorporation of explainable machine learning strategies enhances the explainability of the radiomics model, providing clinicians with more reliable clinical decision support.
Abbreviations
vanillylmandelic acid
positron emission tomography/computed tomography
contrast-enhanced CT
magnetic resonance imaging
intra-class correlation coefficient
Pearson correlation coefficient
Least Absolute Shrinkage and Selection Operator
analysis of variance
support vector machine
Receiver operating characteristic
partial dependence plots
SHapley Additive exPlanations
area under the curve
confidence interval
Supplemental Material
sj-docx-1-tct-10.1177_15330338241290386 - Supplemental material for Predicting Bone Marrow Metastasis in Neuroblastoma: An Explainable Machine Learning Approach Using Contrast-Enhanced Computed Tomography Radiomics Features
Supplemental material, sj-docx-1-tct-10.1177_15330338241290386 for Predicting Bone Marrow Metastasis in Neuroblastoma: An Explainable Machine Learning Approach Using Contrast-Enhanced Computed Tomography Radiomics Features by Haoru Wang, Ling He, Xin Chen, Shuang Ding, Mingye Xie and Jinhua Cai in Technology in Cancer Research & Treatment
Footnotes
Acknowledgments
Not applicable.
Authors’ Contributions
Conceptualization: H.W., L.H., X.C., and J.C., Methodology: H.W., Formal analysis: H.W., Investigation: H.W., X.C., SD, and M.X., Writing—original Draft: H.W., Writing—review and editing: all authors, Visualization: H.W., Supervision: J.C. All authors contributed to manuscript revision, read, and approved the submitted version.
Availability of Data and Material
The datasets generated or analyzed during the study are available from the corresponding author on reasonable request.
Consent for Publication
Not applicable.
Competing Interests
Haoru Wang is an Editorial Review Board Member of Technology in Cancer Research & Treatment and was excluded from all editorial decision-making related to the acceptance of this article for publication. The remaining authors declare no conflict of interest.
Declaration of Conflicting Interests
The authors declared no potential conflicts of interest with respect to the research, authorship, and/or publication of this article.
Ethics Approval and Consent to Participate
This retrospective study received approval from the Institutional Review Board of Children's Hospital of Chongqing Medical University, and patient informed consent was waived (File No. 202235).
Funding
The authors disclosed receipt of the following financial support for the research, authorship, and/or publication of this article: This work was supported by the Key Project of Technology Innovation and Application Development of Chongqing Science and Technology Bureau, Natural Science Foundation of Chongqing Municipality, (grant number No. CSTB2022TIADKPX0151, (CSTB)2023NSCQ-BHX0127).
Supplemental Material
Supplemental material for this article is available online.
References
Supplementary Material
Please find the following supplemental material available below.
For Open Access articles published under a Creative Commons License, all supplemental material carries the same license as the article it is associated with.
For non-Open Access articles published, all supplemental material carries a non-exclusive license, and permission requests for re-use of supplemental material or any part of supplemental material shall be sent directly to the copyright owner as specified in the copyright notice associated with the article.