
Abstract
Regardless of its utility as a measure of actual corruption, perceived corruption is related to many political attitudes and other variables which makes it an important phenomenon to understand. This paper explores demographic variables, ideological orientations, socioeconomic status, interpersonal trust, political attitudes and feelings of resentment as explanations for corruption perception with response styles controlled within a structural equation modelling framework using survey data collected in Guyana where corruption is salient and thought to be pervasive. It finds that the categories of variables jointly explain 31.5% of the variance in corruption perception and that there is explanatory utility for each category of variables evaluated except socioeconomic status with demographics and ideological orientations accounting for the largest changes in explained variance. It also finds that political cynicism attenuates an initial effect of interpersonal trust and concludes that ethnicity appears to function as partisan orientation in its relationship with corruption perception.
Introduction
Corruption has devastating consequences for economies and development, particularly for the well-being of ordinary people in the lower strata in society (Ariely and Uslaner, 2017). Over the years, numerous high-profile corruption scandals have engulfed prominent political figures worldwide, including heads of state, some of whom faced criminal charges and incarceration (Canache et al., 2019; Canache and Allison, 2005). It is noteworthy that corruption is often identified as one of the foremost challenges in Latin American countries (Arnold, 2012). In spite of the attention on corruption, the measurement of the phenomenon remains unresolved, and the use of perceived corruption as a proxy has attracted criticism (Heath et al., 2016). Nevertheless, this does not diminish the importance of understanding corruption perception, given its links to various political attitudes, such as trust (Wroe et al., 2013) and its potential implications for regime support (Erlingsson et al., 2016; Seligson, 2002). Remarkably, elevated levels of corruption perception might even be more consequential than corruption itself (Melgar et al., 2010).
Corruption perception tends to be more pronounced in developing countries than in Western societies (Melgar et al., 2010; Stevens, 2016). Socioeconomic status, political attitudes, ideological dispositions and individual characteristics, among other variables, have been linked to corruption perception (for example, Fungáčová et al., 2016; Maeda and Ziegfeld, 2015) and researchers have also discerned the importance of the national context (Ariely and Uslaner, 2017) and the moderating and conditioning effects of contextual factors on its relationships with antecedents (Heath et al., 2016; Maeda and Ziegfeld, 2015; Tverdova, 2011). As a result, findings from one country or region may not be immediately applicable elsewhere, underscoring the necessity of studying the phenomenon in different country contexts.
This paper focuses on corruption perception in a context where corruption is pervasive by investigating its antecedents within a structural equations modelling framework while controlling for response styles, which are known to affect rating scale data (see van Vaerenbergh and Thomas, 2013). It utilises survey data collected in Guyana, a non-Western, developing, English-speaking country located on the mainland of South America. Though the existing literature contains studies on corruption perception in Latin America, there is a paucity of research on the Anglophone Caribbean in general and Guyana in particular. Furthermore, by examining various types of potential explanatory variables, including demographics, socioeconomic status, ideological dispositions, political attitudes, and feelings of resentment, and modelling their effects concurrently, this study aims to clarify their genuine relationships with corruption perception. The results also suggest that, except for controlling response styles and including the variety of explanatory variables, some spurious effects might have been erroneously deemed relevant.
Corruption Perception and Its Measurement
The quest for direct and unbiased measurements of corruption that could be applied widely remains a challenge (Heath et al., 2016). Corruption often operates in concealed realms, rendering documented cases a mere fraction of the reality. Additionally, rampant corruption can undermine the very institutions tasked with its detection and mitigation leading to measurements of institutional effectiveness rather than the actual extent of corruption (Heath et al., 2016). Popular measurement approaches, such as victimization surveys or inquiries into respondents’ personal experiences with corruption, are affected by issues of underreporting and misreporting due to reluctance or disbelief in personal victimization (Verwee and Vande Walle, 2008). Moreover, recognizing the existence of corruption or forming assessments need not hinge on personal victimization which often neglects the importance of vicarious experiences (Canache et al., 2019).
Turning to corruption perception offers a more inclusive perspective that encompasses personal, vicarious, and mass-mediated experiences. Transparency International's Corruption Perception Index (CPI); a widely adopted measure, relies on expert opinions (elite perception) (see Transparency International, 2023), which may differ from those of the general population (mass perception) (Erlingsson et al., 2016). However, the CPI demonstrates a strong correlation with mass perception obtained from population surveys, albeit with regional variations (Canache and Allison, 2005; Heath et al., 2016; Maeda and Ziegfeld, 2015; Tverdova, 2011). Socioeconomic status and awareness can explain these disparities (Arnold, 2012; Maeda and Ziegfeld, 2015).
Beyond the challenges associated with elite and mass perceptions, divergent definitions of corruption introduce distinct criteria which further complicate measurement. Corruption is often associated with the political arena and public service but in reality, it extends into the private sector, bridging interactions between private entities and public officials (Verwee and Vande Walle, 2008). Furthermore, survey respondents may not strictly adhere to formal definitions and may rely on varying perspectives to shape their responses (De Lancer Julnes and Villoria, 2014; Navot and Beeri, 2017; Redlawsk and McCann, 2005). Some might emphasize legality, while others consider any unethical behaviour or even actions about which they are uncertain as corruption (Wroe et al., 2013).
While corruption perception provides insights into actual corruption, it may not offer a precise reflection of its true extent as it could be influenced by broader political attitudes and governmental performance evaluations (Heath et al., 2016; Vande Walle, 2008). Additionally, perceptions can be inflated by sensationalized vicarious experiences. Despite its limitations as a measure of actual corruption, perceived corruption holds significance due to its associations with various political and social attitudes. Corruption perception can reinforce political trust (Chang and Chu, 2006), impact satisfaction with democracy, and influence support for democratic societies (Canache and Allison, 2005), thus bearing substantial implications for democratic governance.
Antecedents of Corruption Perception
Corruption perception is often related to socioeconomic status with the suggestion that individuals with lower socioeconomic status tend to perceive higher levels of corruption than their higher-status counterparts (Fungáčová et al., 2016; Maeda and Ziegfeld, 2015). The latter are more likely to benefit from corruption whereas those with lower socioeconomic status often bear greater burden of its outcomes (Tverdova, 2011) and are hence less tolerant of it (Fungáčová et al., 2016). Stronger corruption perception among persons with lower socioeconomic status could also be influenced by a more critical judgmental conception (see Redlawsk and McCann, 2005). However, the negative effects of income, education, employment and social class are not consistently supported by research. Some studies report a negative relationship with education (Ariely and Uslaner, 2017; Chang and Chu, 2006; Fungáčová et al., 2016; Maeda and Ziegfeld, 2015), while others detect no correlation (Canache and Allison, 2005; Wroe et al., 2013). Similar inconsistencies arise for income and employment, with some studies indicating negative impacts (Melgar et al., 2010; Maeda and Ziegfeld, 2015; Tverdova, 2011), while others find no significant effects (Tverdova, 2011; Fungáčová et al., 2016). The variations may be attributed to contextual factors, with socioeconomic status exerting greater influence on corruption perception in advanced countries (see Maeda and Ziegfeld, 2015; Tverdova, 2011).
Ideological beliefs serve as powerful lenses through which individuals perceive the world and as heuristics to make judgements (see Barros et al., 2020; Huckfeldt et al., 1999). For instance, Redlawsk and McCann (2005) find that whereas there is a lack of partisanship in determining whether people adopt a judgmental (any favouritism) or a permissive (limited to lawbreaking) conception of corruption, liberals tend to converge less than conservatives on the permissive conception that places greater emphasis on breaking the law. Conservatives are therefore more likely to perceive lower levels of corruption than liberals due to their more stringent definition of corruption. While researchers often refer to left-right placement when studying ideology (for example, Wroe et al., 2013), other ideological dispositions such as individualism and authoritarianism also play roles in shaping corruption perceptions (Vande Walle, 2008). Given the findings of Redlawsk and McCann (2005), left-wing self-placement results in stronger corruption perception, although its impact appears to be weak, with several reporting no significant effect (Arnold, 2012; De Lancer Julnes and Villoria, 2014; Wroe et al., 2013). For both individualism and authoritarian attitudes, Vande Walle (2008) reports positive relationships with corruption perception.
Social trust plays a pivotal role in shaping corruption perceptions, revealing a negative relationship between interpersonal trust and corruption perception (for example, Ariely and Uslaner, 2017; Canache and Allison, 2005). Interpersonal trust indicates a sense of social cohesion, and in societies where people believe that most people can be trusted, levels of corruption tend to be lower (Ariely and Uslaner, 2017). Since corruption fundamentally involves betrayal of trust, an inverse relationship between these two is expected. The significance of trust is particularly decisive when there is uncertainty about an act; in such cases, low levels of trust tend to result in harsher judgments about corruption (Wroe et al., 2013).
Perceptions of corruption are linked to various political attitudes like partisanship, political cynicism, political interest, and political participation. Partisanship captures personal affiliations with specific political parties or politicians. Though partisanship could be measured in several ways, it is often operationalised as whether or not the person voted for the incumbent in the previous election or is currently a member of the political party in power (for example, Tverdova, 2011). Support for the incumbent indicates alignment with the current political leadership, which could inspire more lenient assessments (Barros et al., 2020; Blais et al., 2017; Chang and Chu, 2006) and, consequently, lower perceived corruption (Blais et al., 2017; Canache and Allison, 2005; Fungáčová et al., 2016; Tverdova, 2011). Nevertheless, some studies do not find a significant effect of partisanship (Arnold, 2012; De Lancer Julnes and Villoria, 2014; Wroe et al., 2013).
Political cynics regard politicians, politics, and the political system as immoral, incompetent, dishonest and driven by self-interest (Rijkhoff, 2018). Those with higher levels of political cynicism are more likely to perceive corruption as pervasive (see Davis et al., 2004; Klitgaard, 1991), resulting in stronger corruption perception (Cumbreras and Powell, 2019). Political interest, which captures the extent to which individuals engage with political information and discussions, reflects their attentiveness to politics and a more measured than dismissive approach to political issues. Stronger interest in politics can therefore lead to lower corruption perceptions (Blais et al., 2017; Canache and Allison, 2005). However, some research contradict this effect (Wroe et al., 2013). Corruption perception can motivate people to become more politically involved with such involvemnet focused on participation in politics (see Bazurli and Portos, 2021; Kelly, 2016). This, in turn, may lead to more judgmental views and is hence also associated with elevated corruption perception (Navot and Beeri, 2017). Concurrently, participation could potentially normalize corruption through contact with politicians and situations wherein corruption occurs and thereby lower perceived corruption. Therefore, the direction of the effect of participation remains difficult to sort out theoretically.
Inclusion of demographic variables is a critical feature of research on corruption perception. Demographic variables might be linked to socioeconomic status, with factors such as gender, age, and urban residence potentially explaining some of its variation. For example, older individuals, men and urban residents tend to have more contact with politicians, and men and older persons often occupy higher socioeconomic positions and tend to perceive less corruption. However, research findings are mixed, with some studies confirming the expected effects (Chang and Chu, 2006; Melgar et al., 2010; Tverdova, 2011) and others reporting contrary findings (Ariely and Uslaner, 2017).
Religiosity might also explain corruption perception. Gokcekus and Ekici (2020) indicate that corruption (based on perception measure) tends to be higher in more religious countries. However, they emphasise that religiosity is more important as a predictor than religious identification since identification does not necessarily imply religious adherence. They argue further that the effect of religiosity might stem from people sheltering themselves from the evil in the world with religion or are otherwise comforted by religious teachings and either ignore or become oblivious to what is going on around them.
Apart from the variables commonly examined in corruption perception research, we consider the role of feelings of resentment. These feelings arise in response to the perception of being wrongfully disadvantaged or deprived, mainly as a group (Abts and Baute, 2022; Rogenhofer et al., 2023). We focus on three constructs – powerlessness, relative deprivation, and status insecurity – to capture feelings of resentment (see Abts and Baute, 2022). Powerlessness reflects a sense of lacking control over one's circumstances (Geis and Ross, 1998). Group relative deprivation involves the belief that one's ingroup is worse off than some reference outgroup, seen as unjust (Smith and Pettigrew, 2015), leading to anger and attributing responsibility to the government (see Abts and Baute, 2022). Status insecurity, on the other hand, encompasses the fear of losing one's economic status, prestige and standard of living, which can result in anti-establishment sentiments and loss of hope (Gidron and Hall, 2017; Hoggett et al., 2013). Together, the feelings of resentment highlight perceived lack of fairness, loss of control, and inequality in treatment, often attributing responsibility to the government and the structures that it controls. It therefore seems reasonable to expect that feelings of resentment are positively associated with corruption perception.
The Guyana Context
The country-specific context plays a crucial role in shaping corruption perception and its relationship with antecedents (Maeda and Ziegfeld, 2015; Tverdova, 2011). Given Guyana's status as a developing country, it is likely that the significance of socioeconomic explanations for corruption perception is relatively low. This need not automatically suggest a complete absence of socioeconomic effects; rather, it suggests that significant effects, if present, are likely to be small in size.
Guyana is a diverse, multi-ethnic society composed of six main ethnicities: Afro-Guyanese, Amerindians, Chinese, Indo-Guyanese, Portuguese and European. Among these, Indo-Guyanese and Afro-Guyanese are the two largest groups, neither of which constitutes an outright majority of the population. Guyana's economy also features a substantial underground economy, estimated to account for between 36.7 and 57.3 percent of the official Gross Domestic Product (see Thomas et al., 2009). The country was upgraded to the status of upper-middle-income in 2015 (two years after data collection) (World Bank, 2022), and subsequently achieved high-income status in 2022, driven by the emergence of a new petroleum industry (Hamadeh et al., 2023). Nevertheless, Guyana has consistently been ranked among countries with pervasive corruption based on the Corruption Perceptions Index (CPI) results (Transparency International, 2023).
Guyana has a post-colonial political history marked by ethnic tensions, primarily between the two largest groups (Indo-Guyanese and Afro-Guyanese). These groups have been separately targeted by the two main political parties as their primary constituents (see Griffith, 1997; Singh, 1994). At different times, these political parties have adopted a state-capture approach to governance, resulting in a net transfer of wealth to Indo-Guyanese and to exacerbation of economic inequality (Constantine, 2017; Edwards, 2017). Corruption and accusations of corruption are prominent features of Guyanese politics, with news reports frequently highlighting instances of corruption and impropriety within the government. For instance, one popular newspaper, Kaieteur News, features a dedicated section titled “The Heist of Guyana” focused on reporting on corruption within the government. In addition, the government in place at the time of data collection exhibited characteristics reminiscent of an “elected oligarchy” (see Khemraj, 2013: 11).
Data and Methods
Data
The data used were obtained from the Values and Poverty Study in Guyana (VAPO) which was executed in the frame of a North-South development cooperation programme “Capacity Building in Social Science Survey Research and Analysis” that had been reviewed for its ethical dimension by the VLIRUOS selection committee. The Study employed a face-to-face survey and collected data in two distinct phases under the supervision of the University of Guyana and the University of Ghent. The first phase of data collection concentrated on the coastal regions of Guyana and was conducted between May and June of 2012. Subsequently, the second phase targeted the interior regions and was executed between October and November of 2013. These two phases facilitated mutually exclusive and exhaustive coverage of all regions of the country, resulting in a nationally representative sample of 1557 respondents, comprising 1048 from the coastal regions and 509 from the interior regions.
In the first phase of the survey, a two-step sampling procedure that involves selecting municipalities (Neighbourhood Democratic Councils in rural areas) with probability proportional to size, followed by the selection of clusters of size 12 within the chosen municipalities. This approach resulted in random selection of 51 municipalities and the subsequent identification of 87 clusters within them in the coastal areas. In the second phase, a similar sampling approach was utilized with some modifications. Due to the absence of similar local government structures in the interior regions, communities were used in the same capacity as municipalities were in the coastal regions. This pragmatic choice was made also due to challenges related to inaccessibility and sparse populations in the interior regions. This sampling process resulted in the selection of 17 communities. To correct for oversampling in the interior regions and gender nonresponse overall, data weights were calculated using iterative proportional fitting based on the most recently available census data at the time.
Measures
Dependent Variable. The dependent variable is corruption perception, which is measured by three items that capture the perceived extent of corruption among three distinct groups: politicians, police, and government employees (see Table 1). The construct provides an indication of the perceived level of corruption in the public service.
Measurements of Latent Constructs.
The mean and standard deviation are reported for continuous and rating scale variable and the percentages are reported for categorical variables.
Independent Variables. Several categories of independent variables are included in this study, encompassing socioeconomic status, ideology, political attitudes, and feelings of resentment. The phrasing, response scales and summary statistics for the items used are provided in Table 1.
The demographic variables included are age, sex, ethnicity, religious affiliation and location (see Table 1). Age is the chronological age of the respondent in years whereas sex is a dichotomous variable indicating whether or not the respondent is male. Ethnicity has three categories that indicate respectively whether the respondent identifies as Afro-Guyanese, Indo-Guyanese or with some other ethnicity. Religious affiliation is a categorical variable that indicates whether the respondent identifies with Hinduism, Islam or with some other religion. Location indicates whether the respondent lives in an urban, rural or hinterland area. Hinterland communities are all in the interior regions of the country (regions 1, 7, 8, 9) whereas rural areas are those in regions 2, 5, 6, and 10 which is a subset of the coastal regions. The urban areas are located in regions 3 and 4. The classification into location types draws on the classifications for Guyana suggested by Thomas et al. (2014b) which is based on assessments of size, density and diversity in accordance with the definition of urbanism advanced provided by Wirth (1938). One modification to the classifications provided by Thomas et al. (2014b) is that region 3 is included in the urban group because of its proximity to region 4 and because its population density is higher than all other regions except region 4.
The variables used as measures of socioeconomic status are assets, unemployment and education. Assets is a proxy for household income and it is employed to avoid using directly reported income which suffers from much nonresponse. Unemployment is a dichotomous variable that indicates whether or not the respondent is unemployed. Education is a categorical variable indicating the highest level of schooling completed: primary, secondary or university.
The ideology variables are left-right placement, preference for authoritarian government, individualism, egalitarianism and beliefs about inequality. For left-right, placement larger values are more to the right and lower values indicate a position that is more to the left of the scale. Preference for authoritarian government is a single-item measure of whether or not the respondent believes that an authoritarian government is preferable in some circumstances. Individualism and egalitarianism are latent constructs each having three indicators. Egalitarianism focuses on income inequality. Beliefs about inequality focus on perceptions about the class structure of the Guyanese society. In the analysis, the fourth and fifth options (D and E) are combined into a single category (due to the size of the fifth option) and used as the reference.
The measure of interpersonal trust include in this study is in effect a measure of lack of interpersonal trust since the two indicators are reversed worded to capture the opposite sentiment. The political attitudes included are political cynicism and political interest. Both are multiitem latent constructs. Feelings of resentment are captured by three multiitem constructs – powerlessness, group relative deprivation and status insecurity.
Data Analysis
The data are analysed using confirmatory factor analysis and structural equations modelling with the weighted least squares means and variance estimator (WLSMV). Consistent with this method, the rating scale data are treated as ordered categorical. The models also control for response styles, which represent respondents’ systematic tendencies to respond to rating scale items in specific ways, irrespective of the content of the items (see van Vaerenbergh and Thomas, 2013). Response styles are known to vary across rural and urban areas in Guyana, potentially distorting effect sizes and concealing mean differences. Therefore, controlling for response styles is deemed necessary, even in within-country research whenever rating scales are employed (see Thomas et al., 2014a, 2014b).
We control acquiescence and midpoint response styles using the representative indicator response style means and covariance structure (RIRSMACS) method, which utilizes separate items to model the response styles, allowing them to correlate with each other but not with the substantive factors under study (Weijters et al., 2008). The response styles are modelled using 30 five-point rating scale (agree/disagree) items with an average interitem correlation of 0.053 (see items in Table A5). The acquiescence response style factor is estimated based on three computed indicators, whereas midpoint response style factor is estimated based on two indicators due to a linear dependency issue.
An initial confirmatory factor model is estimated to assess the measurement of the latent constructs the explanatory model for corruption perception is estimated through five cumulative steps, each of which adds a new category of potential predictors. This approach allows determination of the contribution of the categories of variables to explaining the variance in corruption perception subject. For the predictors of corruption perception, we emphasise the results obtained from the final model (Model 6) and use the preceding five models to explain important changes in significant effects that occur due to inclusion of different categories of predictors. The fit of both the measurement and structural models is determined using a combination of the root mean square error of Approximation (RMSEA), comparative fit index (CFI), Tucker and Lewis index (TLI) and the weighted root mean square residual (WRMR).
Results
Measurements
The initial confirmatory factor model containing all the multiitem constructs fits the data well (see Measurement 1 in Table 2). However, some indicators show relatively low item loadings, specifically the second item for powerlessness (q36_2 = 0.243) and the third for egalitarianism (q70_3 = 0.431). To address this issue, a two-step process is employed, involving the removal of these indicators sequentially (beginning with q36_2, followed by q70_3). This leads to the final measurement model (see Table 2) which demonstrates overall good fit (see Table 2) and discriminant validity is achieved for each factor (see Table 3) even though the average variance extracted for especially powerlessness is low (Table 4).
Model Fit.
Discriminant Validity.
The off-diagonal elements are correlations and the diagonal elements in bold are the square roots of the average variance extracted.
Auth = Authoritarianism; Egal. = egalitarianism; Indiv. = individualism; Int. Trust (rev) = interpersonal trust (reversed); Group Relative Dep. = group relative deprivation; Power = powerlessness; Status Insecur = status insecurity.
Standardized Factor Loadings.
The table shows the standardized factor loadings and the average variance extracted for each construct.
AVE = average variance extracted; Auth = Authoritarianism; Egal. = egalitarianism; Indiv. = individualism; Int. Trust (rev) = interpersonal trust (reversed); Group Relative Dep. = group relative deprivation; Power = powerlessness; Status Insecur = status insecurity; ARS = Acquiescence response style; MRS = Midpoint Response style.
The structural models fit the data well even though the CFI is a bit below 0.95 for model 5 and model 6. Nevertheless, both the RMSEA and the TLI are within acceptable limits for each of the models estimated (see Table 2).
Explaining Corruption Perception
Explained Variance. The independent variables in the full structural model (model 6) jointly explain approximately 31.5% of the variance in corruption perception (see Table 5). The initial model (model 1), containing only demographic variables as predictors, explains 23.8% of the variance. The explained variance increases minimally (by 0.7 percentage points) when socioeconomic variables are added. A more noticeable increase of 4.1 percentage points is observed upon the inclusion of ideology variables. The introduction of interpersonal trust results in a marginal increase of 1.3 percentage points, while the insertion of political attitudes leads to a slight 1.1 percentage point increase. Lastly, the inclusion of feelings of resentment results in a marginal 0.5 percentage point increase in explained variance. Among the categories of predictors under study, it appears that the structural characteristics of the respondents are the most influential antecedents, followed by ideological orientation. It should be acknowledged that these categories include a greater number of variables than the others, and the order in which the categories of variables are introduced into the models can also affect the results.
Explanatory Model.
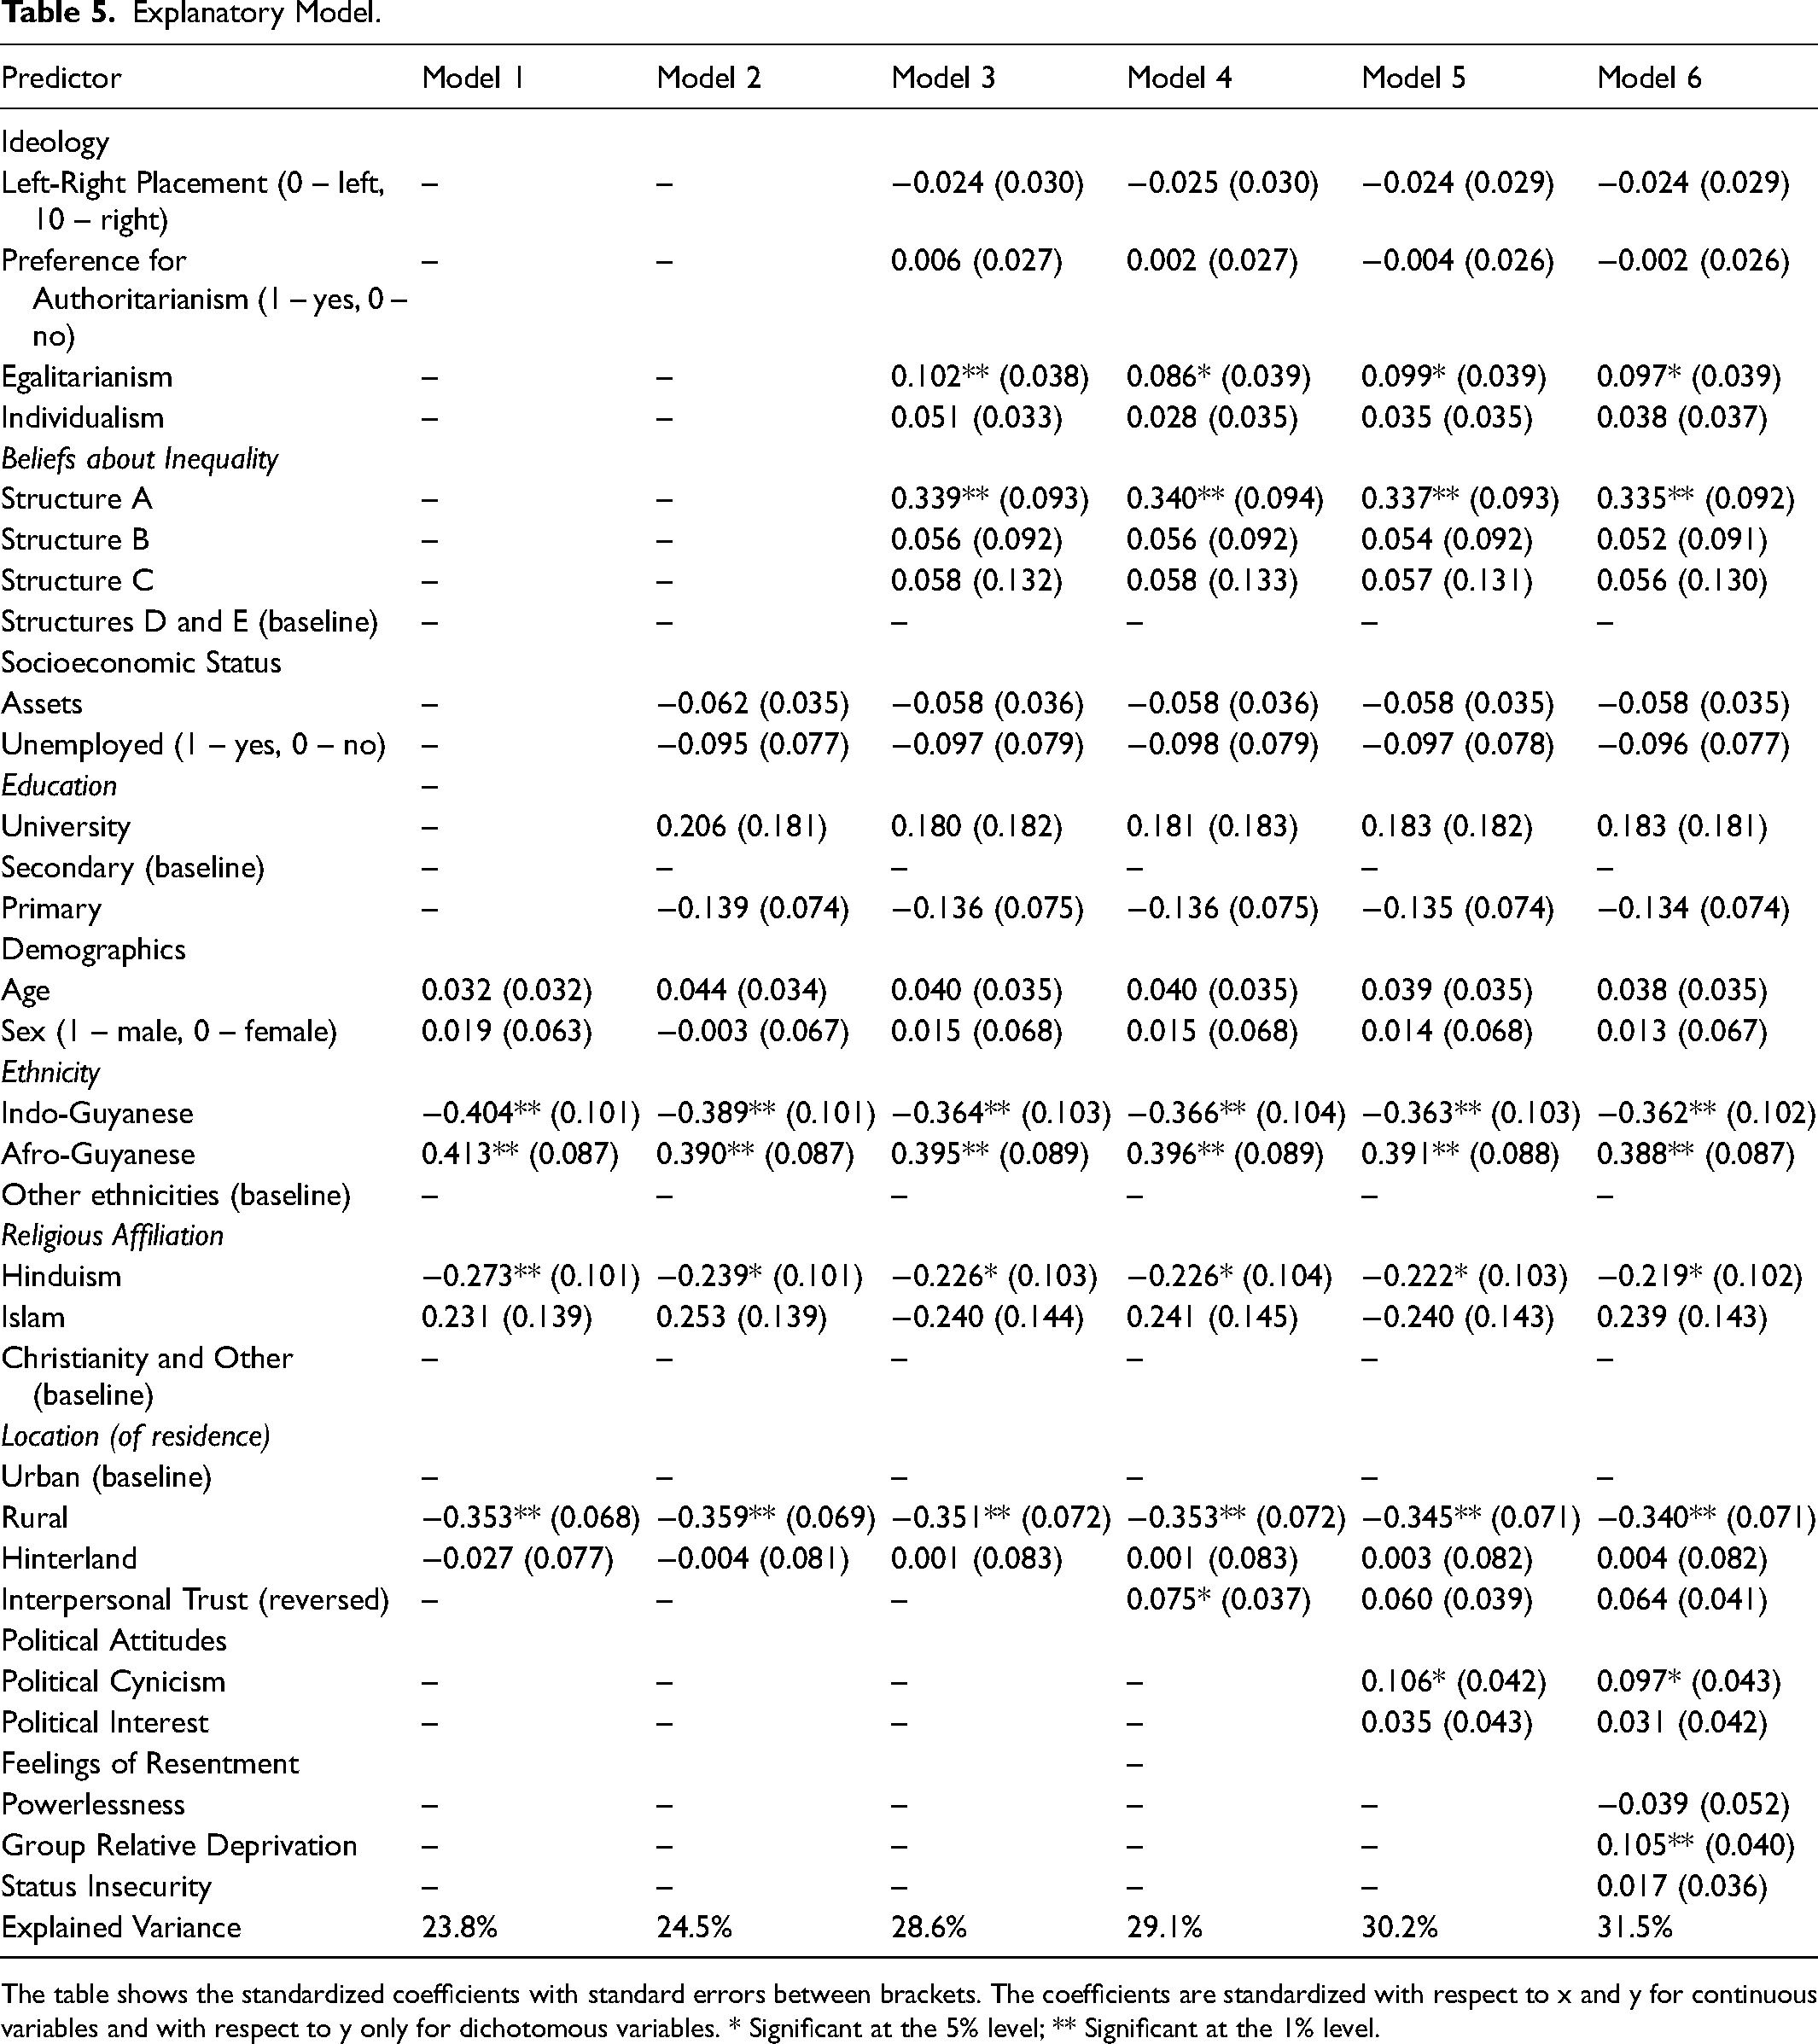
The table shows the standardized coefficients with standard errors between brackets. The coefficients are standardized with respect to x and y for continuous variables and with respect to y only for dichotomous variables. * Significant at the 5% level; ** Significant at the 1% level.
The categories of independent variables operate independently, with one exception: the initial effect of interpersonal trust is completely attenuated due to its shared variance with political cynicism, a matter discussed further below. We note also that model estimation without controlling for response styles leads to initial effects of both individualism and political interest losing significance in subsequent models (see Table A5). However, these variables do not have significant effects when we account for the response styles. In these cases, the initial effects are due to uncontrolled response styles contaminating both the indicators of these constructs and those of the respective dependent variables.
Demographics. Of the demographic variables evaluated, age and sex lack statistical significance and are therefore unrelated to corruption perception. Significant effects are observed for ethnicity, religious affiliation, and location. On average, Indo-Guyanese tend to perceive less corruption, whereas Afro-Guyanese tend to perceive more corruption than persons of other ethnicities. This observation is consistent with the political power balance of Guyana at the time of data collection, where Indo-Guyanese were the politically relevant ethnic group, whereas Afro-Guyanese were largely aligned with the opposition (Edwards, 2017; Griffith, 1997; Khemraj, 2013; Singh, 1994). The observed results suggest that ethnicity is functioning as a proxy for partisanship in the absence of a direct measure. Indo-Guyanese may perceive less corruption due to a leniency toward their home team, while Afro-Guyanese may perceive more corruption due to a harsher judgment against the opponent (Blais et al., 2017).
Moving on to religious affiliation, those who identify with Hinduism, compared to other religions (excluding Islam), tend to perceive lower levels of corruption. It is important to note that this variable does not measure of religiosity, which is typically expected to be positively related to corruption perception (Gokcekus and Ekici, 2020). We have no arguments for concluding that adherents of Hinduism are more devout on average; it is not immediately clear why religious identification itself is significantly related to corruption perception.
Location is also significant in the model. Rural residents tend to perceive less corruption than urban dwellers. Interestingly, residents of hinterland areas are closer in corruption perception to those of urban residents than rural ones. This finding contradicts the idea of a linear urbanity effect and challenges the hypothesis that corruption perception is linked to contact with political actors, especially given that hinterland areas are even less urban than rural areas (see Heath et al., 2016). On the contrary, corruption perception is higher in urban areas than rural areas, a result consistent with a study by Fungáčová et al. (2016). Thus, the idea of a normalizing or perhaps even an enlightening effect of contact with political actors appears to be inadequate for explaining the effects of age, sex, and location on political cynicism in Guyana.
Socioeconomic Status. The role of socioeconomic status in explaining corruption perception is marginal and remains consistent across all relevant models (models 2 to 6). Neither assets, unemployment, nor education demonstrates a significant relationship with corruption perception. While this finding contradicts results from several studies in the existing literature, the divergence may be attributed to contextual specificity (Maeda and Ziegfeld, 2015; Tverdova, 2011). It is important to recognize that this discrepancy could be reflective of the Guyanese context, where corruption is highly salient and pervasive (Edwards, 2017; Khemraj, 2013). Additionally, Guyana is faced with high inequality (Constantine, 2017) and has been characterized as a country with lower socioeconomic status and development (see World Bank, 2022). In such circumstances, variables targeting socioeconomic status are expected to lose explanatory power (Tverdova, 2011), although drawing definitive conclusions based on a single-country study would be premature.
Ideology. Ideology explains part of the variance in corruption perception due to significant effects of egalitarianism and beliefs about inequality. Egalitarianism is positively associated with corruption perception, which indicates that individuals who advocate for closing income inequality gaps tend to perceive more corruption than those with less pronounced egalitarian beliefs. In addition, those who believe that society consists of a small upper class with few people in the middle and the vast majority at the lowest level (Structure A) tend to perceive more corruption than those who subscribe to alternative views, such as the belief that either most people are in the middle class (Structure D) or that there are many at the top and few near the bottom (Structure E). Both egalitarianism and beliefs about inequality center on the theme of inequality in society which suggests that general views about inequality are linked to elevated corruption perception. Furthermore, lay interpretations of societal structures often involve allusions to unequal opportunities, life chances, and pervasive disadvantage (see Irwin, 2018). This seems more likely applicable to structure A, which places the majority of the people at the lowest class, and may underlie the detected effect of beliefs about inequality on corruption perception.
Left-right placement, preference for authoritarian government, and individualism are all unrelated to corruption perception. The result for left-right placement aligns with findings reported by others (for example, De Lancer Julnes and Villoria, 2014; Wroe et al., 2013), though it contradicts the expectation that corruption perception would increase among persons positioned more towards the left on the ideological scale. The lack of significant effects for individualism and preference for authoritarian government diverges from the indications of Vande Walle (2008).
Interpersonal Trust. The initial significant effect of (lack of) interpersonal trust on corruption perception ultimately disappears when the effect of political cynicism is controlled. The construct of interpersonal trust, as measured in this study, reflects a lack of interpersonal trust since the indicators are phrased negatively. Furthermore, this construct can be reframed as an indication of general cynicism, which overlaps conceptually with political cynicism (see Dekker and Meijerink, 2012; Pattyn et al., 2011). It appears that the shared variance between interpersonal trust and political cynicism is linked to corruption perception. Thus, when political cynicism is controlled, interpersonal trust no longer contributes to explaining corruption perception. This outcome aligns with the lack of effect indicated by Wroe et al. (2013), rather than the negative effect reported in other studies (for example, Ariely and Uslaner, 2017; Canache and Allison, 2005). However, it also raises questions about whether the exclusion of political cynicism in other studies might explain the detection of significant effects of interpersonal trust.
Political Attitudes. Consistent with findings from other researchers, political cynicism is positively related to corruption perception (Cumbreras and Powell, 2019). This suggests that individuals who are more disillusioned about politics tend to believe that corruption is more widespread (Davis et al., 2004; Klitgaard, 1991). In contrast, there is no significant effect of interest in politics. This implies that political information has no discernible effect on corruption perception, which is also supported by the previously mentioned lack of effect of education. This is perhaps related to the overall salience of corruption in the country (see Edwards, 2017; Khemraj, 2013) and the pervasiveness of the phenomenon as suggested by the results of the CPI. It might be that when corruption is highly salient to the point of not permitting naivety about its existence, proxy variables for information do not provide additional utility for distinguishing among levels of corruption perception.
Feelings of Resentment. Feelings of resentment affect corruption perception by virtue of a significant positive relationship between group relative deprivation and perceived corruption. Group relative deprivation is likely linked to the prevailing ethnic cleavage in Guyanese politics, as governments often mobilise the state machinery to reach their ethnic constituents (see Edwards, 2017; Khemraj, 2013). The non-significant effects observed for other facets of resentment (powerlessness and status insecurity) are unexpected and pose challenges for explanation.
Conclusion
The variables employed in this study explain approximately 31.5% of the variance in corruption perception. Among the categories of predictors examined, demographics, ideology, political attitudes, and feelings of resentment emerge as significant explanations for corruption perception. However, socioeconomic status and interpersonal trust do not exhibit significant effects. The lack of significant effects related to socioeconomic status is consistent with the expectation that in countries where corruption perception is high, and socioeconomic status is generally low, the capacity of individual socioeconomic factors, including education, to explain corruption perception tends to diminish (Maeda and Ziegfeld, 2015; Tverdova, 2011).
Beyond the general importance of the country context to the relevance of antecedents of corruption perception, the Guyanese context introduces the uniqueness of ethnicity as a significant factor, seemingly functioning as a proxy for partisanship. This phenomenon is deeply rooted in Guyanese history, where ethnicity pervades politics (see Griffith, 1997; Singh, 1994). Additionally, the prominence of corruption in Guyanese politics and political life (Edwards, 2017; Khemraj, 2013) further reinforces the correlation between ethnicity and political affiliation. It is important to clarify that this does not imply determinism, but rather indicates that on average, ethnicity correlates with party affiliation and support.
The expected positive relationship between political cynicism and corruption perception, as suggested by previous literature (Cumbreras and Powell, 2019; Davis et al., 2004; Klitgaard, 1991), is supported by our results but concurrently, political cynicism completely attenuates a previously detected effect of interpersonal trust. The precise nature of this relationship between political cynicism and interpersonal trust might be specific to the Guyanese context, warranting further research.
Controlling response styles continues to be important whenever rating scales are employed. Though their effects are expected to be less pronounced with smaller cultural distances within the sample, Guyanese data across rural and urban areas meet the threshold that necessitates adjustments for response styles (see Thomas et al., 2014a). Whereas acquiescence and midpoint response styles do not impact on the independent variables that are significant in the final model, they are responsible for detection of spurious effects of individualism and interest in politics in preliminary models that do not contain all of the predictor variables. Controlling the response styles leads to a ‘cleaner’ set of results that avoids the complexity of additional attenuated effects in the sequence of models estimated.
This study has a few limitations that should be considered in the interpretation of the results. Firstly, the measurements of powerlessness and egalitarianism have less than ideal convergent validity and this might affect the detected relationships. Secondly, the data provide a window into the circumstance some ten years ago and while the relationships might still be relevant, it is necessary to reassess as the economic conditions within the country change and take hold.
Supplemental Material
sj-docx-1-pla-10.1177_1866802X241235195 - Supplemental material for Antecedents of Corruption Perception in Guyana
Supplemental material, sj-docx-1-pla-10.1177_1866802X241235195 for Antecedents of Corruption Perception in Guyana by Troy D. Thomas, Koen Abts and Koen Stroeken in Journal of Politics in Latin America
Footnotes
Declaration of Conflicting Interests
The authors declared no potential conflicts of interest with respect to the research, authorship, and/or publication of this article.
Funding
The authors received no financial support for the research, authorship, and/or publication of this article.
Supplemental Material
Supplemental material for this article is available online.
Author Biographies
References
Supplementary Material
Please find the following supplemental material available below.
For Open Access articles published under a Creative Commons License, all supplemental material carries the same license as the article it is associated with.
For non-Open Access articles published, all supplemental material carries a non-exclusive license, and permission requests for re-use of supplemental material or any part of supplemental material shall be sent directly to the copyright owner as specified in the copyright notice associated with the article.