
Abstract
Institutional trust is often measured by several items that are analyzed individually or as sum-scores. However, it is difficult to summarize the results of individual-items analyses, whereas sum-scores may be meaningless if the dimensions that the items are assumed to measure are not verified. Although these limitations are circumvented by using factor analysis, response styles may still bias research results. We use data from Guyana to show that a second-order factor model is appropriate for measuring institutional trust. We also demonstrate that response styles can inflate item and factor convergent validity and may either distort regression effects or create completely spurious ones. We therefore recommend using factor models with corrections for response styles in institutional trust research instead of sum-scores and individual-items analyses.
Measurement of Institutional Trust: Three Approaches
Institutional trust refers to people's expectations of how institutions should treat people and what institutions should deliver based on the definition of the objectives and the principles according to which institutions are expected to function (see Offe 1999; Warren 1999; Abts 2006). In this sense, institutional trust is based on
the shared recognition and the acceptance of the principles guiding the operation of an institution as well as the view that the institution actually performs according to these principles. (Grönlund and Setälä 2012: 526)
People's assessment is connected to the expectation that the institution and its professional experts will act in good faith and will solve specific problems efficiently (Giddens 1990). Offe (1999) viewed institutional trust as consisting of three components: the institution needs to be perceived as meaningful and useful; it needs to be credible; and one needs to be convinced that others also trust this institution (Offe 1999: 63–67).
Although there is no general agreement regarding the best way of measuring institutional trust, the use of several items focusing on various institutions is recommended because this approach captures the variations across institutions (Mishler and Rose 1997). In this regard, many surveys measure trust in different institutions such as the parliament, police, justice, media, or political parties with rating scales. However, even when several items are employed, the included institutions vary among studies and the data are often analyzed as individual items referring to particular institutions (Blanco and Ruiz 2013; Blanco 2013), as sum-scores (Espinal, Hartlyn, and Kelly 2006; Horne 2011), or as latent factors. Other methods of analysis are available (for example, latent class analysis), but research on institutional trust is mostly based on the three approaches listed above.
The individual-items-approach requires several separate analyses, each focused on a particular institution (Christensen and Lægreid 2005). This approach has the advantage of providing information about specific institutions and it is quite effective when such details are desirable. However, overviews of institutional trust are often the goal of research and analyzing individual institutions makes it difficult to combine the results to provide meaningful summary interpretations. This difficulty is exacerbated when many institutions are included and when the relationships with the same variables differ among institutions (Blanco and Ruiz 2013; Blanco 2013). Besides, the fact that measurement errors are not modeled in individual-items approaches affects the validity of the results.
Sum-score measurements of institutional trust are also popular in the literature (Poznyak et al. 2013). Sums over several items easily provide overall summaries (Chang and Chu 2006; Ham et al. 2011; Huang, Lee, and Lin 2013; Hutchison and Johnson 2011; Lühiste 2006; Espinal, Hartlyn, and Kelly 2006; Horne 2011), but these scores are often based on untested assumptions that the combined items measure the same dimension of institutional trust in the context under study. For example, institutional trust items are sometimes combined into a single score, reflecting the belief that the construct is unidimensional (Mishler and Rose 2001; Rohrschneider and Schmitt-Beck 2002). In other cases, the sum-scores are derived under the assumption of multidimensionality, although the dimensions are not usually verified (Huang, Lee, and Lin 2013; Lühiste 2006). These approaches neglect the possibility of contextual effects, namely culture and country. Culture can affect the structure of measurement models, even when the same items are employed (Van de Vijver and Poortinga 1997); consequently, the measurements may differ from one country or region to another, or over time (Bouckaert and Van de Walle 2001; Poznyak et al. 2013). Unless the assumptions about which dimensions the items measure are evaluated, they may be incorrect, and this can lead to meaningless results.
Furthermore, sum-scores also neglect measurement error (Neale et al. 2005). The inherent assumption that the items are perfectly reliable is unlikely to be correct, leading to inconsistent regression effects (Bollen and Lennox 1991). When a single predictor is used in regression analysis, the coefficient is likely to underestimate the true value; when several explanatory variables are included, however, the direction of the bias cannot be predicted (Bollen and Lennox 1991). In addition, Shevlin, Miles, and Bunting (1997) showed that the bias due to sum-scores is likely to be downward and more pronounced if the reliability of the items is moderate to low. These consequences remain even when the items are correctly assigned to the constructs (Neale et al. 2005).
The limitations of sum-scores and single-items analyses may be addressed with factor models. Factor models for institutional trust help to determine the measured dimensions and simultaneously account for measurement error. Factor models have continuous latent variables that are often measured by continuous indicators, but the indicators may also be categorical or a combination of the two measurement levels (Bollen 1989). These models require the assumption that the data follow a multivariate normal distribution (Wang and Wang 2012) and take the variance-covariance matrix of the manifest variables and separate the items into groups that are referred to as dimensions. Factor analysis may be exploratory, in the sense that the dimensions are allowed to emerge from the data, or confirmatory, wherein the dimensions are specified by the researcher. Both approaches permit evaluation of the dimensions, and factor models perform well even when the reliability of the items is moderate to low (Shevlin, Miles, and Bunting 1997). In this regard, factor analysis is superior to both sum-score and individual-items analyses.
Based on exploratory factor analyses, researchers have indicated that one dimension of institutional trust is justifiable in some cases (Listhaug 1984; Mishler and Rose 1997, 2005), but that up to three dimensions are appropriate in others (Rothstein and Stolle 2008; Bean 2003). In particular, Rothstein and Stolle (2008) and Bean (2003) identified three dimensions of institutional trust as follows: partisan, wherein membership is based on elections (for example, parliament and government); non-partisan, wherein membership is not based on elections (for example, police and army); and media. The differences in dimensions from one study to another with the same exploratory factor analysis underscore the need for context-specific evaluations of the dimensions of institutional trust.
The Impact of Response Styles
A context-specific effect that directly concerns the data obtained is that of response styles (RSs). Although factor models address the limitations of individual-items and sum-score approaches, RSs are usually not controlled when such models are employed, which can have undesirable consequences for institutional trust research. RSs emerge with the use of rating scales and are the respondents’ tendencies to disproportionately select certain scale categories regardless of the content of the items (Van Vaerenbergh and Thomas 2013). The best-known RSs are acquiescence RS (ARS: tendency to agree), extreme RS (ERS: tendency to use the scale endpoints), disacquiescence RS (DARS: tendency to disagree), and midpoint RS (tendency to use the scale midpoint).
RSs bias the factor loadings and constructs means (Billiet and McClendon 2000; Weijters, Schillewaert, and Geuens 2008; Welkenhuysen-Gybels, Billiet, and Cambré 2003). For example, higher (lower) ERS increases (decreases) factor loadings whereas higher (lower) ARS increases (decreases) the means of manifest variables (Cheung and Rensvold 2000). These effects are non-uniform across subgroups of respondents. Indeed, the mean levels of RSs may differ significantly between countries, cultures, and subcultures, which can affect measurement comparability and factor convergent validity. RSs can also either distort or altogether conceal mean differences between factor means (Morren, Gelissen, and Vermunt 2012; Thomas, Abts, and Vander Weyden 2014a, b). Furthermore, RSs can bias structural (regression) relationships (Moors 2012; Blaisus and Thiessen 2001). For instance, Moors (2012) showed that the well-accepted gender effect on leadership styles is really due to RSs. Such spurious relationships are caused by inflated (deflated) factor variances and covariances in combination with the other effects of RSs on the measurement models (Baumgartner and Steenkamp 2001; Moors 2012).
The fact that RSs bias structural relationships is especially distressing since much of institutional trust research focuses on regression effects and correlations among variables. The results of such research are likely to be biased regardless of the way in which the data are analyzed (individual-items, sum-score, or factor models). Hence, we argue that adjustments for RSs should be made when factor models are employed in institutional trust research.
In the present paper, our primary goals are to demonstrate the impact of RSs on the results of institutional trust research, and to illustrate how RSs can be measured and controlled in such research. A secondary goal is to illustrate some of the impacts that the method of measurement has on the results. To achieve these goals, we focus on the effects of the respondents’ socio-demographic characteristics on institutional trust and compare the effects among four methods of measurement: individual-items, sum-score, and the factor model with and without corrections for RSs. We use data from Guyana; an English-speaking country that is part of South America and the Caribbean. Use of the English language in the questionnaire facilitated the collaboration between authors in formulating questions in function of RSs and in selecting the 27 dedicated, unrelated items to measure RSs (see Appendix). Guyana is sufficiently culturally heterogeneous (including ‘East Indian’, ‘Black African’, ‘Mixed’ and ‘Amerindian’ ethnicities) to verify our hypotheses. It has a clear geographical and socio-cultural division between rural and urban areas, as is characteristic of South America. A rare study comparing institutional trust on the continent, specifically trust in the municipal government, has situated Guyana together with Brazil and Venezuela around the mean rate of 22 countries (Montalvo 2010, applying AmericasBarometer by LAPOP).
Our primary and secondary goals contribute to the literature in three main ways. First, they add to what is known about institutional trust in developing democracies. Second, the factor model enables assessment of the dimensions of institutional trust and facilitates evaluation of the sum-score approach. Third, we demonstrate the impact of the method of measurement and of RSs on the results. We also discuss two procedures for RSs corrections in order to provide some guidance on how to implement RSs corrections in institutional trust research.
Data and Methods
Data
The data were obtained from the Values and Poverty Study in Guyana (VAPO Guyana) conducted between April and May 2012. The study was funded by the Flemish Interuniversity Council (VLIR) and jointly executed by the University of Guyana and Ghent University. The data were collected via face-to-face interviews by a survey organization under the supervision of the University of Guyana and Ghent University. These data are representative of Guyana's coastal regions (regions 2, 3, 4, 5, 6 and 10), which account for approximately 90 percent of the country's population.
The VAPO Guyana employed a sampling procedure that randomly selected municipalities with probability proportional to size, and respondents within the municipalities with equal probabilities. This resulted in the selection of 87 clusters within 51 municipalities, and a total of 1048 individuals were interviewed, with a response rate of 87 percent (American Association for Public Opinion Research 2011, RR2). The data were weighted for non-response using iterative proportional fitting.
The advantage of using the VAPO Guyana instead of other more popular surveys such as the Latin American Public Opinion Project is that the study was developed with specific attention to rigorously measuring and controlling RSs. It did so by including 30 dedicated items to measure RSs in addition to the items measuring substantive content. Therefore, the VAPO Guyana data are ideal for illustrating the main issues addressed in this paper.
Independent Variables
With a view to illustrating some of the effects of RSs and of the methods of measurement on substantive research, there are several ways to conduct the analysis, given the breadth of research on institutional trust. However, for the purpose of illustrating some of the impacts, we have restricted our focus to the socio-demographic characteristics, namely age, gender, education and ethnicity. This is sufficient to illustrate the points about the effects of RSs and the methods of measurement.
Trust in institutions is associated with socio-demographic characteristics. Whereas some authors have found that institutional trust increases with age (Hutchison and Johnson 2011; Listhaug 1984), others have found no effect (Rohrschneider and Schmitt-Beck 2002; Mishler and Rose 1997; Lühiste 2006). For gender, Listhaug (1984) and Mishler and Rose (1997) indicated that males are less trusting, whereas Hutchison and Johnson (2011) reported that gender has no effect on institutional trust. For education, some have found a negative effect (Rohrschneider and Schmitt-Beck 2002; Blanco 2013; Hutchison and Johnson 2011; Lühiste 2006), but Abts (2012) indicated that the effect is positive and Mishler and Rose (1997) found no relationship. Finally, Lühiste (2006) indicated that the majority ethnic group has higher institutional trust, whereas Hutchison and Johnson (2011) found no consistent effect of ethnicity. Despite the inconsistencies in the results, the respondents’ socio-demographic characteristics appear to predict institutional trust (Espinal, Hartlyn, and Kelly 2006). Therefore, these variables are expected to provide a basis for evaluating the impact of the methods of measurement and the effects of the RSs on structural relationships in institutional trust research.
Measurement of Institutional Trust
Institutional trust is measured by nine items. The respondents were asked: “Can you tell me to what extent you trust the following institutions?” and the institutions presented are: “the justice system, Guyana Defence Force (army), parliament, national government, Guyana Police Force (police), national elections, political parties, mayor's office of your city or town/neighborhood democratic council (NDC) chairman's office, and the Regional Democratic Council (RDC)”. Each item is scored on a five-point scale with the labels: 1 (distrust very much), 2 (distrust), 3 (neither trust nor distrust), 4 (trust), 5 (trust very much).
The set of institutions included is not as extensive as those used in many other studies. This is largely due to the restrictions of the questionnaire of the VAPO Guyana. Therefore, the use of this data involves a trade-off between exhaustive measurement of institutional trust and being able to demonstrate the effects of RSs. In addition to the institutions already identified, the questionnaire includes the media and the actual president, neither of which are included in this study. The data regarding the actual president are excluded given that the responses can be expected to focus on the individual who held the office at the time rather than the office itself. Similarly, data regarding the media do not concern an institution connected to government, unlike the nine institutions listed above. Indeed, trust in the media tends to follow a different logic from trust in the other institutions (Cook and Gronke 2001). 1
A separate exploratory factor analysis indicates that trust in the media forms a single-item factor and does not affect the measurement model developed for the listed institutions.
In the present study, age is measured in years (average = 36.25). Gender is dichotomous: 1 = male (49 percent) and 0 = female (51 percent). Education is the level of schooling completed; it is coded as: 1 = primary education (31 percent), 2 = secondary education (57 percent), and 3 = above secondary education (13 percent). Ethnicity is dichotomous: 1 represents majority (East Indians: 46 percent), 0 represents minority (Afro, Amerindians, Chinese, Mixed, Portuguese, and White: 54 percent).
A combination of ordinary least squares regression (OLSR), confirmatory factor analysis (CFA), and structural equation modeling were employed in the analysis. The OLSR models were estimated with IBM SPSS Statistics 21, while the CFA and structural equation models (SEMs) were implemented with Mplus 7.11 with robust maximum likelihood estimation. Given the large sample size, the CFA models were evaluated with alternative fit indices. However, Jrule was also used to identify misspecification that may have gone undetected by the global fit indices (Van der Veld 2008; Oberski 2008).
2
The convergent and discriminant validities of the factors were also evaluated. Convergent validity is adequate if the average variance extracted (AVE) is greater than or equal to 0.50, whereas discriminant validity is adequate if the AVE (or
Jrule (judgement rule) for Mplus is a program that takes the Mplus output as its input and uses a combination of the expected parameter change (EPC), modification index and power (all obtained or calculated automatically from the Mplus output) to detect parameter misspecification, which can occur in spite of adequate global fit as indicated by the fit indices (Saris, Satorra, and van der Veld 2009; Van der Veld and Saris 2011). For our study, high power was set at 0.80 and Type I error at 0.05. The EPC was set to 0.10 for error covariances and at 0.40 for factor loadings.
A step-wise approach was followed in the analysis. We start by presenting the results of the individual-items and the sum-score analyses; both measures were analyzed with OLSR models. In the case of the sum-score approach, we used an overall sum of the ratings across the nine institutions – generalized institutional trust – which involves the assumption that institutional trust is unidimensional. Secondly, we analyzed the data using a CFA (and SEM) model. Thirdly, the measurements were adjusted for RSs and analyzed using CFA (and SEM). This final CFA model facilitates determination of the impacts of the RSs.
Several model-based approaches for controlling RSs are available. The use of CFA for institutional trust narrows the potential models. In this regard, Van Vaerenbergh and Thomas (2013) recommended the representative indicators response styles means and covariance structure (RIRSMACS) model that was proposed by Weijters, Schillewaert, and Geuens (2008), due to its coverage of several RSs. The RIRSMACS model includes ARS, ERS, DARS, and MRS as latent variables, each having three indicators that are calculated from three blocks of dedicated RSs items (one indicator each per block) (Weijters, Schillewaert, and Geuens 2008).
A basic requirement of the dedicated items approach is that the content of the items must be controlled to avoid confounding with style. Therefore, it is important to ensure that the dedicated RSs items do not measure a common underlying construct and that they have low inter-correlations. To achieve this control, it is recommended to select one item at random from each construct included in the questionnaire and scored on the same rating scale format (Weijters, Schillewaert, and Geuens 2008). A minimum of six heterogeneous items are required, but the use of 15 such items is recommended for the measurement of RSs (Weijters, Schillewaert, and Geuens 2008).
The VAPO Guyana addresses the need for controlling RSs by availing separate, dedicated RSs items. These items represent a random selection from various constructs covering several topics (including government, politics, society, crime, and gender roles). The RSs items were included in the VAPO Guyana questionnaire along with those designed to measure several substantive constructs (Vander Weyden et al. 2012). 3 In this study, the RSs are measured by 27 items (see appendix), which have an average inter-item correlation of 0.06. The RS items are all scored on five-point fully labeled rating scales with disagree/agree verbal labels. The numeric labels of these items match those of the trust items, but the mismatch of verbal labels is a limitation since the scale format can affect RSs (Weijters, Cabooter, and Schillewaert 2010).
Heterogeneous items can usually be obtained by randomly selecting one item per construct from the constructs that are included in the questionnaire, provided that the questionnaire covers a variety of topic areas.
In the RIRSMACS model, each RS factor is measured by three indicators. These indicators are obtained by dividing the pool of dedicated RSs items into three blocks at random, then calculating the value of one indicator for each RS from each block as:


Where f (x) is the frequency of the response option x, and k is the number of items per block (Weijters, Schillewaert, and Geuens 2008). This procedure was adopted in the present study, leading to three blocks that each contained nine (that is, 27 divided by 3) items, and one indicator per RS being calculated as defined from the dedicated RS items from each block.
In the model, the error terms of the indicators that are calculated from the same block of items are allowed to correlate, and the RSs factors are also correlated with each other. However, the substantive constructs are not allowed to correlate with the RSs. Each RS has a direct effect on each institutional trust item (Weijters, Schillewaert, and Geuens 2008) and the impact of each RS is set as equal for all the items, although the impacts of separate RSs are allowed to be different (see Figure 2). This is consistent with the definition of an RS as a systematic tendency, regardless of the content of the items.
Levels of Institutional Trust
The responses to the institutional trust items are coded so that higher values indicate higher trust. As observed in Table 1, the level of trust in institutions in Guyana is generally low. Only three institutions have average scores above the scale midpoint. The army is the most trusted institution, whereas the police is the least trusted; both of these are non-partisan institutions.
Levels of Trust in Institutions
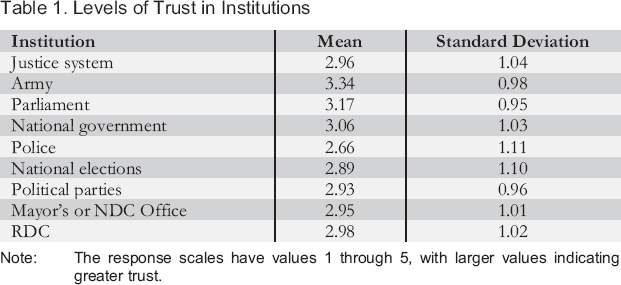
Levels of Trust in Institutions
Note: The response scales have values 1 through 5, with larger values indicating greater trust.
The individual-items analyses (Table 2) indicate that age does not explain trust in any of the institutions and that gender explains trust in only the justice system and the mayor's/NDC office, for which males have less trust than females. The effects of education are more nuanced with respect to both the significance and the nature of the relationships. Education is significantly related to trust in parliament, national government, police, national elections, political parties and the RDC, but not in the justice system, the army, and the mayor's/NDC office. In particular, highly educated people are less trusting than people with up to secondary education, while less-educated people are more trusting of the national government and the police.
Standardized Regression Coefficients of the Individual Items Models
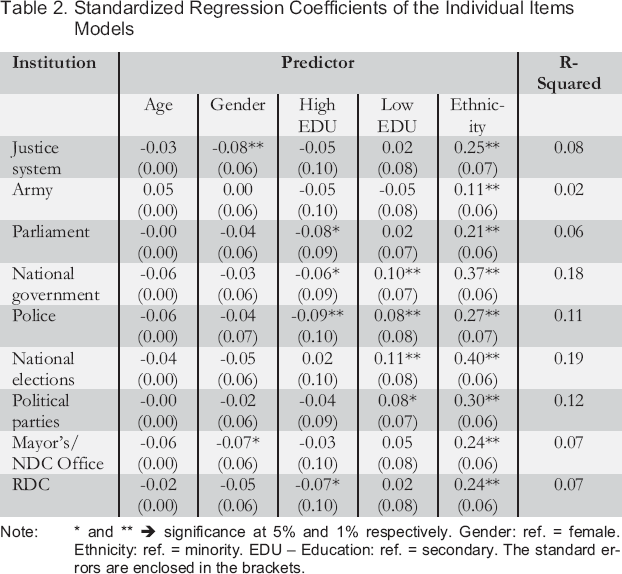
Standardized Regression Coefficients of the Individual Items Models
Note: * and ** → significance at 5% and 1% respectively. Gender: ref. = female. Ethnicity: ref. = minority. EDU - Education: ref. = secondary. The standard errors are enclosed in the brackets.
For some institutions, either the higher educated or the lower educated group is distinguished from the group with secondary education, but not both. This occurs for trust in parliament and the RDC, which is lower for more highly educated individuals and for trust in the national elections and political parties, which is higher among less-educated individuals.
The results for ethnicity are easier to summarize. Ethnicity explains trust in each institution and institutional trust is consistently higher among the majority ethnic group (positive sign of coefficients). However, the sizes of the standardized coefficients range from 0.11 (army) to 0.40 (national elections). At the time of the data collection, the incumbent – People's Progressive Party/ Civic – was the political party generally thought to be more strongly linked to the majority ethnic group (East Indians) than the minority groups. The positive association between trust (especially national elections) and the politically relevant ethnicity suggests that party ideology plays a role in institutional trust in Guyana.
The explained variances of the individual-items models show large variations between the institutions. It is worth noting that the institution with the highest level of trust (the army) has the lowest explained variance. A similar conclusion could be made for the justice system, parliament, mayors'/NDC office, and the RDC, which have higher-than-average levels of trust, but low explained variances. However, socio-demographics explain larger proportions of the variances in trust in the national government, national elections, and political parties, all of which are national-level partisan institutions.
The internal consistency (Cronbach's Alpha) of the sum-core is high (0.91) and the socio-demographic variables explain approximately 16 percent of the variance in generalized institutional trust (Table 3).
Regression of the Socio-Demographic Variables on the Sum-Score Measure of Generalized Institutional Trust
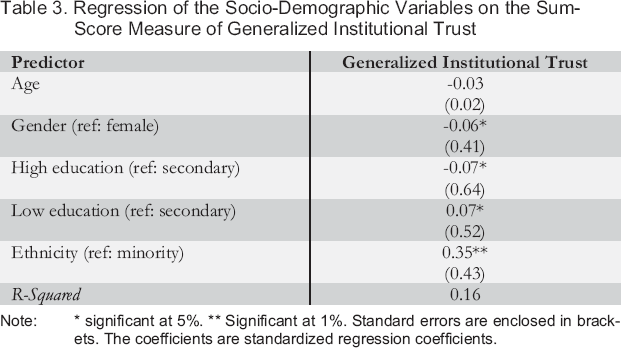
Regression of the Socio-Demographic Variables on the Sum-Score Measure of Generalized Institutional Trust
significant at 5%.
Significant at 1%.
Standard errors are enclosed in brackets. The coefficients are standardized regression coefficients.
The results indicate that age has no relationship with institutional trust; that males have less trust in institutions than females; that education has a negative linear relationship, wherein higher education is associated with lower institutional trust and lower education is associated with higher institutional trust; and that the majority ethnic group has a higher level of institutional trust. The lack of an effect of age and the observed higher institutional trust among the majority ethnicity are consistent with the results from the individual-items analyses. Though it is more difficult to compare for gender and education, the effect of education is consistent with most of what was observed in the individual-items analyses.
In this section, we describe the results from the factor models: one without the RSs controlled and the other with the RSs controlled. We evaluate the form and fit of the models and then proceed to the results of the SEM.
Establishing the Factor Models
The initial one-factor model without controlling for the RSs fits the data poorly (see Table 4). A large modification index (MI) with accompanying large expected parameter change (EPC) (MI = 198.65, EPC = 0.35, standardized EPC = 0.83) is observed for the error covariance between trust in the mayor's/NDC office and trust in the RDC. These are the only two items that refer to local institutions and they form a separate dimension. This contradicts the notion that institutional trust is unidimensional, or at least cautions against such an assumption.
Fit of the Factor Models for Institutional Trust
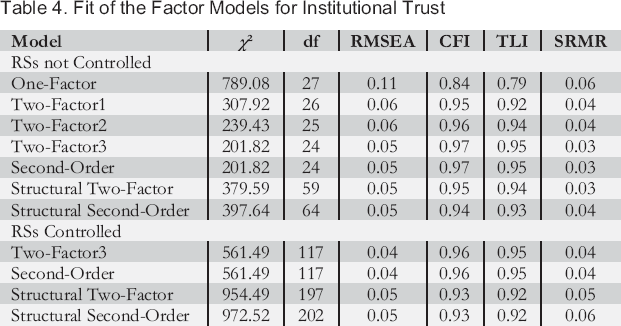
Fit of the Factor Models for Institutional Trust
The two-factor model (Two-Factor1) fits well overall with respect to the global fit indices (Table 4), but additional checks for misspecification using Jrule for Mplus 0.91 (Oberski 2008) result in two freed error covariances: between army and national elections (MI = 26.82, EPC = −0.16, Power = 0.89) and between national elections and political parties (MI = 16.15, EPC = 0.11, Power = 0.96). The negative covariance between trust in the army and the national elections indicates that citizens with higher trust in the national elections are less trusting of the army. This could be interpreted as meaning that those who trust the elections more are less open to organized military force, for instance (Two-Factor2). The second freed error covariance is also plausible (Two-Factor3); those who trust the national elections more are also more trusting of the political parties that compete at these elections. With these revisions, the model (Two-Factor3) fits the data adequately and no interpretable misspecification remains (Table 4). In this revised model, the convergent validity of each factor is adequate (Table 5). The factors also show adequate discriminant validity (
Standardized Factor Loadings for the Institutional Trust Model
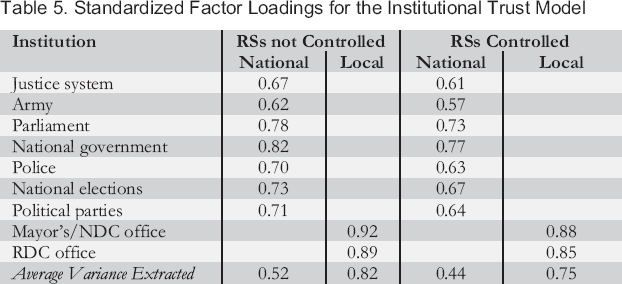
When a second-order factor is imposed on the two first-order factors, the fit of the model does not change. We refer to this second-order factor as “generalized institutional trust.” However, the interpretation of this measure is different from that of the generalized institutional trust based on the sum-score because it takes the sub-dimensions into account.
Turning attention to the model with the RSs controlled, we first establish the RSs factors that will be included. The initial four-factor RIRSMACS model (containing ARS, ERS, DARS and MRS) fits the data adequately (RMSEA = 0.03, CFI = 1.00, TLI = 1.00, and SRMR = 0.03). Apart from DARS (AVE = 0.37), each factor has adequate convergent validity with standardized loadings ranging from 0.74 to 0.95, but ARS lacks discriminant validity (
To obtain the model with the RSs controlled, we begin with the accepted factor model, in which the RSs are not controlled and impose the corrections for the RSs (Two-Factor3) (Table 4). The fit of this model is similar to that of the model in which the RSs are not controlled, but there are reductions in the standardized factor loadings (Table 5). Therefore, the RSs inflate the validity of the indicators and, once controlled, the AVE for national institutional trust falls below 0.50. Nevertheless, the factor loadings are still usefully large and the constructs continue to show adequate discriminant validity (correlation = 0.72,
Based on the accepted factor models (one without and one with RSs controlled), four structural equation models (SEMs) are estimated. Two such models are estimated when the RSs are not controlled and two parallel models are estimated when the RSs are controlled. In particular, the first SEM focuses on the first-order institutional trust factors (national and local trust: Ntrust and Ltrust in Figure 1), with the second-order factor (generalized trust: Gtrust in Figure 1) excluded from the model. The second SEM focuses on generalized institutional trust with the respondents’ characteristics impacting on the second-order factor only (see Figures 1 and 2).
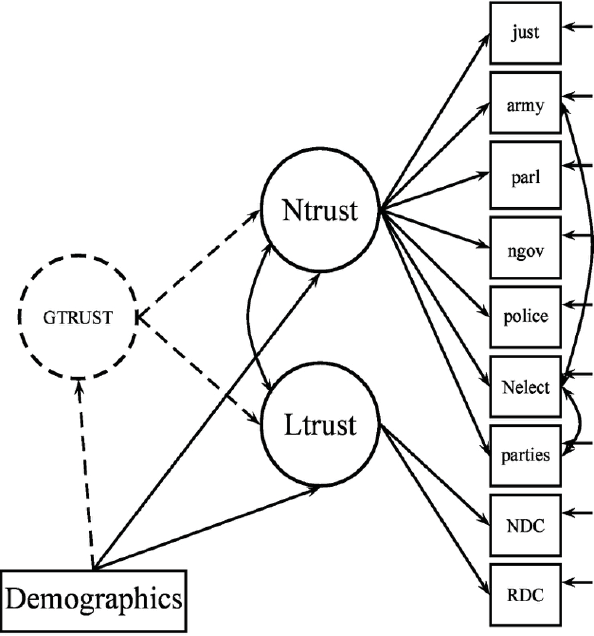
Structural Model for Institutional Trust without Corrections for RSs
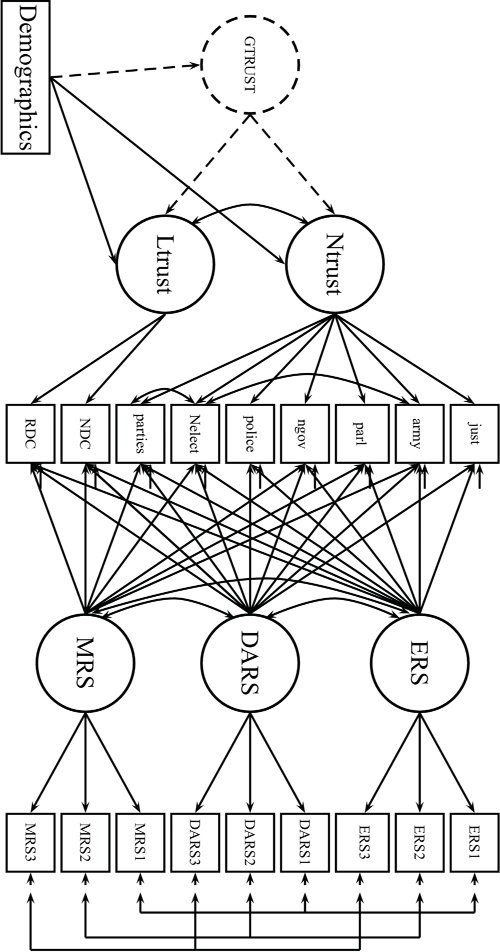
Structural Model for Institutional Trust with Corrections for RSs
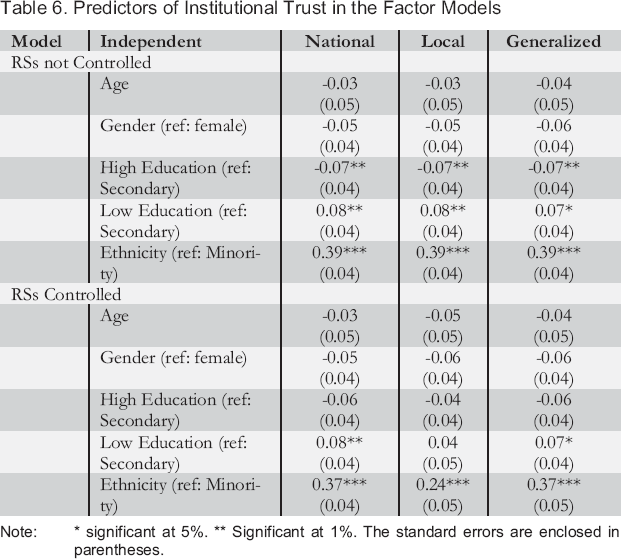
Inclusion of the socio-demographic variables does not affect the fit of the models substantially when the RSs are not controlled (see Table 4: Structural Two-Factor and Structural Second-Order), but the change in fit is larger when the RSs are controlled (Table 4). In addition, the explained variances for generalized institutional trust are larger than those obtained in the sum-score model. However, the explained variances in the model without the RSs controlled (national, 19 percent; local, 9 percent; and generalized, 19 percent) are slightly larger than those for the model with the RSs controlled (national, 17 percent; local, 7 percent; and generalized, 17 percent).
Predictors of Institutional Trust in the Factor Models
significant at 5%.
significant at 1%.
The standard errors are enclosed in Significant parentheses.
The results for the respondents’ variables when the RSs are controlled show some similarities and some differences compared to both the sum-score model and the factor models in which the RSs are not controlled. The results for age and gender are the same in the factor models with and without RSs with respect to significance and direction. Neither age nor gender explains institutional trust. This result for gender is in conflict with that from the sum-score analysis, which suggests that males have lower generalized institutional trust.
In some cases, the findings about education when the RSs are controlled are different from both the sum-score models and the factor models in which the RSs are not controlled. Whereas education has a negative linear effect on generalized institutional trust in both the factor model without RSs and the sum score models, only the lowest level of education is distinguished in the model with RSs controlled with respect to generalized institutional trust. Furthermore, the factor models in which the RSs are not controlled indicate that this negative linear relationship with education holds for local and national institutional trust, but education is unrelated to local institutional trust and only the lowest level of education is distinguished in relation to national institutional trust when the RSs are controlled. Therefore, the RSs account for the significant effect of education on local institutional trust and for a significantly lower institutional trust among university educated compared to secondary educated individuals. Although factor models (and SEMs) are generally superior to sum-score analyses (Bollen 1991; Shevlin, Miles, and Bunting 1997), RSs can still lead to spurious structural relationships. Consequently, unless RSs are controlled, significant regression effects determined in institutional trust research will remain uncertain.
A consistent result across all the models is that the majority ethnicity has higher institutional trust than the other ethnicities. This supports the conclusion that party ideology plays an important role in institutional trust in Guyana. Although the effect of ethnicity remains significant when the RSs are controlled, there is a large drop in the standardized coefficient for its effect on local institutional trust; from 0.39 to 0.24. Therefore, the RSs resulted in a 63 percent increase in the size of the standardized effect. This result indicates that, in addition to creating spurious effects as observed for education, RSs can distort the sizes of structural (regression) relationships.
The assumption that institutional trust is unidimensional is untenable in Guyana, as it is elsewhere (Cook and Gronke 2001). This holds even for political institutions since, as we found, trust in national and local institutions form separate dimensions. In this regard, the commonplace use of sum-scores without verification of the dimensions is not justified. In order to arrive at meaningful results, it is important to know which items to combine into a dimension. However, as Neale et al. (2005) demonstrated, even when the items are combined appropriately to produce a sum-score, the results may still be inaccurate due to some inherent characteristics of the measure. Although it is possible to measure generalized institutional trust, it is not a first-order factor, at least in Guyana, which is where the data used in this paper were obtained. Therefore, the use of factor analysis is preferable to sum-scores.
Apart from the need to correctly assign items to dimensions, it is important to note that sum-scores neglect measurement error. This is also true for individual-items analyses, which involve additional difficulties of summarizing the findings meaningfully. Factor models account for measurement error and the results remain accurate even when the reliabilities of the items are not high (Shevlin, Miles, and Bunting 1997; Bollen and Lennox 1991). Therefore, differences in the effects when factor models are employed are regarded as being due to measurement errors (Neale et al. 2005; Shevlin, Miles, and Bunting 1997). We found no effect of gender on generalized institutional trust in the factor models; however, when a sum-score is employed, males emerge as less trusting, and are also less trusting of two institutions in the individual-items analyses. Therefore, sum-scores in particular can lead to spurious regression effects and once findings about specific institutions are not of major interest, factor analysis is recommended for use in institutional trust research.
What we have learnt from this study, however, is that factor analysis is not a panacea, as RSs may still bias research results. RSs can inflate the factor loadings and the factor convergent validity (confirming Thomas, Abts, and Vander Weyden 2014a; Welkenhuysen-Gybels, Billiet, and Cambré 2003) and may either distort or lead to spurious regression effects when factor models are employed. For example, we find that RSs lead to a spurious negative linear effect of education, whereas only the result for the lowest education category is confirmed when the RSs are controlled. Furthermore, an effect of education on trust in local institutions is entirely due to the RSs. The RSs also inflated the effect of ethnicity on trust in local institutions by approximately 63 percent.
It is generally accepted that education and race/ethnicity are related to the use of RSs. Whereas RSs are sometimes regarded as characteristics of less-educated individuals, minority groups tend to use RSs at higher rates (Ayidiya and McClendon 1990). In particular, higher education is associated with lower acquiescence and Extreme RS, but with higher Disacquiescence RS. In addition, both ARS and ERS are lower among the majority ethnic group in the Guyanese context (cf. Thomas, Abts, and Vander Weyden 2014b). The relationships between RSs and education and between RSs and ethnicity may account for the conflicting results for education on the one hand and the different levels of impact of ethnicity on the other hand encountered in the present study. This is because education and ethnicity are likely to detect the RSs variance in the measures of institutional trust when RSs are not explicitly controlled. If the relationship between education and RSs can be generalized, the negative relationship of education with institutional trust reported by several studies (Tohrschneider and Schmitt-Beck 2002; Blanco 2013; Lühiste 2006; Hutchison and Johnson 2011) may be due to uncontrolled RSs.
Beyond the immediate allusion to socio-demographic variables, many independent variables in institutional trust research are measured with rating scales (see, for example, Aydin and Cenker 2012; Blanc 2013; Espinal, Hartlyn, and Kelly 2006). These scales are contaminated with the same RSs as those of the trust items, which means they are likely to artificially correlate with the institutional trust, even in the absence of substantive relationships with institutional trust. Therefore, the practice of neglecting RSs in institutional trust research is potentially perilous.
The consequences of RSs highlighted in this paper are deduced from data from a single country. However, RSs are expected to have similar consequences in cross-national and cross-cultural research. Given that culture itself is related to RSs (Baumgartner and Steenkamp 2001; Harzing 2006), the comparability of both the measurements and the regression relationships are likely to be affected in cross-national and cross-cultural research. Therefore, it is important that RSs are controlled in both within-country and cross-national/cultural research on institutional trust. Accordingly, we conclude this paper by offering a remedy.
One of the challenges involved in correcting for RSs in institutional trust research stems from the fact that exploratory factor analysis is commonly used. We propose that, in such cases, the individual items be adjusted for RSs before the factor model is implemented. This could be done by regressing each item on the RSs, then using the residuals as the new variable (Baumgartner and Steenkamp 2001). For this procedure, one indicator per RS can be calculated across all the RSs items. An important limitation of this approach is that the measures of the RSs themselves contain measurement errors that are not accounted for in the preliminary ordinary least squares regression models, and these errors are passed on to the adjusted scores, thereby introducing new errors (Weijters, Schillewaert, and Geuens 2008). Therefore, it is advisable to use the CFA framework to analyze the data instead of exploratory factor analysis. When CFA is employed, we recommend the RIRSMACS model for RSs corrections (Weijters, Schillewaert, and Geuens 2008) because it permits a wide coverage of the various RSs and because it is flexible in terms of permitting the inclusion of other RSs or exclusion of some that may not be warranted in the context. Nevertheless, there are other methods of correcting for RSs with different requirements (see Billiet and McClendon 2000; Moors 2012; Blaisus and Thiessen 2001, for example). Researchers can choose methods depending on their research constraints. However, it is important to understand the advantages and limitations of the methods before making a selection (cf. Van Vaerenbergh and Thomas 2013).
Limitations and Directions for Future Research
In future work, researchers are advised to use factor models with corrections for RSs instead of individual-items or sum-score analyses. Also, the established relationships between institutional trust and other variables must be re-examined with the RSs controlled in light of their adverse effects on the results. The differentiated view of national and local institutions in Guyana, along with the variations across several individual items, present a challenge to the use of a single item to measure trust in government. To determine the extent to which such a measure is appropriate, attempts should be made to correlate generalized institutional trust (determined from a factor model) with the single-item measure of trust in government. There is also a need for comparative research on the dimensionality of institutional trust with RSs controlled. This would be beneficial in two ways. Firstly, it would help determine which dimensions are appropriate in various countries. Secondly, studies that have examined the dimensions of institutional trust have done so without controlling RSs. Since RSs can also affect the structure of measurement models (Billiet and McClendon 2000), controlling RSs while investigating the dimensions of institutional trust can lead to more accurate identification of the dimensions of the construct. Such standard control would be an advance that befits socio-political research in a globalized world of increasingly multicultural regions.
This paper has certain limitations that should be taken into account when considering the results and may also point towards the need for further research. Firstly, the list of items available to measure institutional trust in the VAPO Guyana questionnaire is not as extensive as the list used in some other questionnaires, which may have affected the form of the measurement model. There may be other dimensions of the construct or the measured dimensions may have other indicators. This should be investigated using data from other surveys, but the questionnaires must provide items to support RSs measurement and correction.
Secondly, as is always the case, the developed factor model and all the specific findings are relevant to the context studied (Guyana in this case) and may not hold elsewhere. Research is needed in other contexts to determine the appropriate form of the measurement model and how RSs impacts on substantive research results there.
Thirdly, the present study has only addressed the impacts of socio-demographic variables, whereas substantive research may include many independent variables focusing on different issues. An exhaustive list of such variables cannot be included in a study such as this. Nevertheless, we believe that the focus on the socio-demographic variables is sufficient to illustrate the main point about controlling RSs. Researchers can conduct their analyses with and without controlling RSs to illustrate their impacts in substantive research. This should provide evidence about a wide variety of independent variables.
Footnotes
Appendix
Each RS item is scored on the following five-point scale: 1 – completely disagree, 2 – disagree, 3 – neither agree nor disagree, 4 – agree, 5 – completely agree.