
Abstract
The formulation of theories and hypotheses is done at the level of concepts. These concepts are often tested by operationalizing them using survey questions. However, measurement errors make it impossible for survey questions to measure the concepts of interest perfectly. In order to correct for measurement errors, information is needed about their size, or the size of their complement, the quality. For the USA and Europe, a lot is already known about the quality of questions, but this has not yet been studied in some other parts of the world. In this paper, we use a multitrait-multimethod approach to estimate the quality of 27 questions in Mexico and Colombia. These initial results on quality for Central and Latin American countries show quality estimates that are relatively similar in terms of their relationships with the scale characteristics to what has been observed in the USA and Europe.
Introduction
Research usually starts with the formulation of theories, based on observations. From these theories, hypotheses are derived and tested to determine whether they should be accepted or rejected. The formulation of theories and hypotheses is done at the level of concepts. These concepts are mental representations; that is, entities that exist in the brain, but are not directly observable.
In order to test the hypotheses, these concepts are operationalized by specifying empirical indicators or measures for each of them. In observational designs, the measures are often survey questions. If the concepts are simple – what Northrop (1947) calls “concepts by intuition” -then a single question is enough to measure them. If they are complex -what Northrop (1947) calls “concepts by postulation” – then more than one question is needed to measure them and explicit definitions are necessary.
A good operationalization selects a question that maximizes the strength of the relationship between the latent variable of interest (or concept) and the observed answer to the question (also called indicator or measure). In other words, the question maximizes the quality, which can be computed as the product of validity and reliability. The measurement errors are equal to one minus the quality. Therefore, there are no measurement errors when the quality is equal to one. Researchers should try to get as close as possible to this ideal situation.
In practice, however, there are always errors, and these errors may affect many of the results of a study. Differences can be observed that are not real, but are in fact the consequences of using different measures of the concepts of interest. Saris and Gallhofer (2007) provided an illustration using the European Social Survey round 1. They asked the following questions to measure social trust and trust in institutions, respectively:
“Would you say that most people can be trusted or that you can't be too careful in dealing with people?”
“How much do you personally trust the parliament?”
Saris and Gallhofer (2007) reported that the correlation between these two measures in Great Britain, using a four-point scale, was −0.147, which is significant. One may conclude that there is a negative relationship between trusting others and trusting the parliament. Nevertheless, when an 11-point scale was used to ask the same question to the same sample, the correlation was 0.291 (significant). One may conclude that there is a positive relationship.
The same pattern was found using other indicators of social trust and/or trust in institutions. The above example shows that opposite conclusions can be drawn using the same questions asked in the same country in the same survey to the same people, just because the number of response categories changed. Since small variations in the choice of the format of the scales have such important consequences on the substantive conclusions, it is crucial to study and take into account the quality of the questions. It is also necessary to correct for measurement error (Saris and Gallhofer 2007; Saris and Revilla 2015).
In order to do this correction, one needs to know the size of the errors. In other words, it is necessary to have an estimate of the quality of the questions.
Research has been done in this direction (e.g. Andrews 1984; Scherpenzeel and Saris 1997; Alwin 2007; Saris and Gallhofer 2007). Also, procedures have been developed in order to help researchers operationalize their concepts of interest. For instance, Saris and Gallhofer (2007) proposed a three-step procedure for moving from the concept to the request for an answer.
In most survey questions, a specific scale is proposed to the respondents in addition to the request for an answer. Therefore, researchers must also have make decisions about the format of the scale. The literature provides information about the effects of the wording of questions on the responses (Belson 1981; Schuman and Presser 1981; Alwin and Krosnick 1991; Tourangeau, Rips, and Rasinski 2000) and guidelines about which scale to use (Sudman and Bradburn 1983; Converse and Presser 1986; Dillman 2000).
Saris and Gallhofer (2007) used the estimates of a meta-analysis of many experiments to predict the impact that the different characteristics of a question would have on the quality. Even now, such predictions can be made in a semi-automatic way using the program SQP 2 (Saris et al. 2011), which is available for free at <www.sqp.nl/>.
However, previous research has concentrated on the quality of questions asked in Europe and in the USA, but has also shown that the quality varies across countries. This could be due to cultural differences across respondents from different countries or to language-specific differences that do not make it possible for some questions to retain their exact meaning once translated.
Therefore, we cannot extend the results from the USA and Europe to other parts of the world. Accordingly, very little is known about the quality of questions in Latin America. Handlin (2013) evaluated several common measures of social class in terms of validity and reliability in Venezuela. Nyitray et al. (2009) used a test–retest approach to estimate the reliability of questions about sexual behavior in Brazil and Mexico. However, the total number of studies conducted so far is quite small and their topics are quite specific.
The main goal of the present paper 1 is to start filling this gap by providing initial information about the quality (computed as the product of reliability and validity) of questions asked using different scales in Mexico and Colombia.
Acknowledgement: We are very grateful to Netquest for providing us with the necessary data for this paper, and especially to Germán Loewe, which made this collaboration possible. We would also like to thank Willem Saris, Salvador Masdeu and Oriol Barras, who supported us at different levels during the process.
These quality estimates can be used while designing future questionnaires. They can help to decide which scale to put in the survey. They can also be used after data collection in order to correct for measurement errors and achieve proper standardized relationships across the different variables (DeCastellarnau and Saris 2014).
We start by presenting the different characteristics of the scales studied and our hypotheses regarding how these characteristics influence the quality. We then explain the method used to test the hypotheses, followed by a short presentation of the data. Finally, the results will be shown and discussed.
Hypotheses
In IS scales the categories used to express the opinion are exactly the answers that the researcher would like to obtain for this item (Saris et al. 2010). For instance, if one is interested in the degree of trust a person has in different institutions, an IS scale may be a scale that ranges from “no trust at all” to “complete trust”. An AD scale asks respondents how much they agree or disagree with a specific statement; for example: “I generally trust this institution”. The answer categories can range, for instance, from “disagree totally” to “agree totally”.
The impact on the quality of using AD versus IS scales has already been studied (Scherpenzeel and Saris 1997; Saris and Gallhofer 2007; Saris et al. 2010). In almost all experiments and countries, the quality of IS scales is higher than that of AD scales. Over several topics and many countries, Saris et al. (2010) obtained an average difference in quality estimates of around 20 percent in favor of the IS scales. One of the main problems that Saris et al. identified with AD scales is that they can elicit high levels of acquiescence bias; that is, a high tendency of some respondents to agree with any item, regardless of its content. Such behavior is usually explained by a tendency to avoid social friction (Leech 1983) or to defer to people with higher social status (Lenski and Leggett 1960). Harzing (2006) shows significant differences in acquiescence across countries from different continents. Mexico has a higher level of acquiescence than the USA and all European countries (Harzing 2006: 253). Among the possible cultural causes (cf. Hofstede 2001) for these differences are the high power distance existing in Mexico, the medium uncertainty avoidance, and the high degree of collectivism (Johnson et al. 2005). Higher acquiescence can lead to more systematic errors when AD scales are used and, therefore, to lower quality. The general trend for Western countries was that IS scales perform better. We expect this to be the case to an even greater degree in Latin American countries. Thus, our first hypothesis is as follows: The AD scales will lead to a much lower quality than the IS ones (H1).
The Number of Answer Categories
The theory of information (Garner 1960) states that a scale with two response categories can only assess the direction of the respondents’ opinion, attitude or behavior; if the number of response categories increases, the intensity of the opinion, attitude, or behavior can also be assessed. Additionally, if the scale has an odd number of response categories, a neutral position can be observed. Therefore, more information can be obtained by using longer scales and middle points. However, the recommendations about how many points should be used vary in the literature (Likert 1932; Alwin 1992; Dawes 2008).
The question is whether more information means that the questions will have higher quality. The evidence from real data about the impact of the number of answer categories on the quality, defined as the strength of the relationship between the observed answer and the latent construct of interest, are not so clear (Andrews 1984; Scherpenzeel 1995; Alwin 1997, 2007).
Revilla, Saris, and Krosnick (2013) suggested that you need to distinguish between AD and IS scales. They found that, for the AD scales, the quality decreases when going from five to seven response categories and from seven to 11 response categories. They did not study IS scales, but they assumed that the trend is opposite for IS. This is one of their explanations for the mixed results in the literature.
The theory of information is not country-specific. Therefore, also for Latin American countries, we propose Hypothesis 2: Increasing the number of response categories (up to 11) positively affects the quality of IS scales (H2).
The Use of Fixed Reference Points
A “fixed reference point” is a response category that indicates beyond any doubt the position of this response category on the subjective opinion scale for all respondents (Saris and Gallhofer 2007). An example of a label that everybody understands without hesitation is the most extreme possible position, like “completely agree”.
A basic assumption in survey research is that all respondents have the same response function. This means that two persons with the same opinion will select the same answer category. If respondents interpret the labels of the response categories differently, they might choose different answers even if they have the same opinion. This is the problem of variation in response functions that was observed in practice by Saris and De Rooij (1988).
Saris and De Rooij (1988) showed that using fixed reference points reduces the potential variations by giving a clear meaning, shared by all the respondents, to the answer categories. With one fixed reference point, quite large variations can still be observed, whereas with two fixed reference points at the two endpoints of the scale, the response functions of the different respondents become much more similar.
We can expect the impact of using fixed reference points to vary depending on the level of extreme response style (ERS) in a country, which is defined as the tendency of some respondents to select the end-points categories of a scale. ERS varies in terms of the function of the social need for clarity and precision (Johnson et al. 2005) and of the country-level extraversion (Harzing 2006). For Spanish-speaking countries, Harzing found high ERS, with Mexico having the highest ERS of the 26 countries she studied (cf. Harzing 2006: 253).
Therefore, we assume the following: The use of fixed reference points for the two end points of the scale increases the quality, but only slightly (H3).
How Can We Test these Hypotheses?
Method
We tested the hypotheses by comparing the quality estimates of scales with different characteristics: AD versus IS scales, scales with different numbers of answer categories, and scales using fixed-reference points versus those that did not.
However, we first need to compute the quality estimates. For a given question i (also called “trait”) and a given scale j (also called “method”), the quality, denoted q ij 2 , can be computed as the product of the reliability r ij 2 and the validity v ij 2 . The reliability coefficient r ij and the validity coefficient v ij can be estimated using structural equation modeling (SEM). The approach used is the multitrait-multimethod (MTMM, Campbell and Fiske 1959). More specifically, we use the true score MTMM model proposed by Saris and Andrews (1991), which explicitly distinguishes reliability and validity coefficients, as can be seen in the system of equations below or in the graphical representation of Appendix 1.


Where F i is the i th trait, M j is the j th method, Y ij is the observed answer for the i th trait and the j th method, T ij is the true score or systematic component of the response, and e ij is the random error associated with Y ij .
Equation (1) defines each observed variable as the sum of the associated systematic component and random errors. Equation (2) says that each systematic component is itself the sum of the trait and the effect of the method used to assess it. By substituting (2) into (1), we obtain the more common MTMM model, which does not differentiate between reliability and validity.
As usual, the random errors are assumed to be uncorrelated with each other and with the independent variables in the different equations. On the contrary, the traits are assumed to be correlated. The method factors are assumed to be uncorrelated between them and with the traits. Also, the impact of the method factor on the different traits measured with a common scale is assumed to be equal.
In order to be identified, such a true score MTMM model usually requires at least three correlated traits, each measured with three different methods. This means a lot of repetition if the same respondents have to answer all forms. In order to reduce the cognitive burden of the respondents and to limit possible memory effects (van Meurs and Saris 1990), the MTMM approach is combined with a split-ballot approach (Saris, Satorra, and Coenders 2004). Using this approach, respondents are split randomly into several groups and each group is given a combination of two methods for a given set of three traits, instead of getting all the three methods.
The model is still identified under quite general conditions (Saris, Satorra, and Coenders 2004), even if, in practice, many non-convergence problems and improper solutions occur (Revilla and Saris 2013). However, using a three-group design (that is, respondents are randomly assigned to three groups; for instance, group 1 gets methods 1 and 2, group 2 gets methods 2 and 3, and group 3 gets methods 3 and 1) solves most of the non-convergence and improper solutions problems. On the other hand, differences in quality can be obtained depending on whether the method is used at the beginning or at the end of the survey: respondents can learn (in which case the quality will increase) or they can get tired of answering (in which case the quality will decrease).
The split-ballot true score MTMM model can be estimated using any SEM software. We used the maximum likelihood multiple-group estimation procedure of LISREL (Jöreskog and Sörbom 1991) with the Pearson correlation matrices, means, and standard deviations as input data (see Appendix 2 for an example of the initial LISREL input). The groups correspond to the different split-ballot groups. Each country is analyzed separately because our goal is not to compare the countries, but to compare the quality of different scales within each country. Therefore, conducting a combined analysis would not add essential information, but it would make the testing of the model more delicate.
In SEM, before looking at the estimates it is crucial to test the fit of the model. Following Saris, Satorra and Van der Veld (2009), we test the models using the JRule software (Van der Veld, Saris, and Satorra 2008). This software takes into account the power of the test, the modification indices, and the expected parameter change, to test at the level of a single parameter whether there is a misspecification. 2 If the model is more complex, it is more difficult to know which parameters should be freed first.
Default values of the software are used so that a misspecification is defined as a deviation larger than .4 for the standardized loadings and larger than .1 for the causal effects and correlations.
Starting from the initial model described above, the model is corrected step by step when misspecifications are found until an acceptable fit is achieved (see Appendix 3 for a list of the extra parameters freed). The reliability and validity coefficients of the final models are then used to compute the quality estimates: q 2 ij = r 2 ij *v 2 ij .
We test the hypotheses using data from a survey completed by respondents from the Netquest online panel (<www.netquest.com>) in Mexico and Colombia. Approximately 1000 panelists responded in each country. Quotas for age and gender were used in order to obtain similar distributions in the sample as in the general population on these two variables.
The use of web data collection was driven by practical reasons. This method may affect the quality estimates slightly, but previous research shows that it is possible to get similar quality estimates for web and face-to-face surveys, both for a probabilistic-based online panel (Revilla and Saris 2012) and for an access online panel (Revilla et al. 2015). However, the Internet penetration is higher in the countries studied in previous research (92.9 percent in the Netherlands, 67.2 percent in Spain 3 ) than in Colombia (59.5 percent) and even more than in Mexico (36.5 percent). Therefore, the samples may not be completely representative of the general population. However, Revilla (2012) did not find any effect on the quality estimates of respondents’ main background characteristics, so the general results should not be disturbed.
See www.internetworldstats.com/stats4.htm#europe (9 November 2015).
The survey is a shortened version of the European Social Survey (ESS) round 4. The survey contains three split-ballot MTMM experiments regarding satisfaction, social trust, and trust in institutions.
The satisfaction experiment asks how satisfied the respondents are with the present state of the economy in the country (trait 1), with the way the government is doing its job (trait 2), and with the way democracy works (trait 3). The experiment about social trust asks whether the respondents would say that most people can be trusted or that you cannot be too careful in dealing with people (trait 1), whether the respondents think that most people would try to take advantage of them or would try to be fair (trait 2), and whether they would say that most people deserve their trust or that only very few deserve it (trait 3). The experiment about trust in institutions asks the degree to which the respondents personally trust the country's parliament (trait 1), legal system (trait 2), and the police (trait 3).
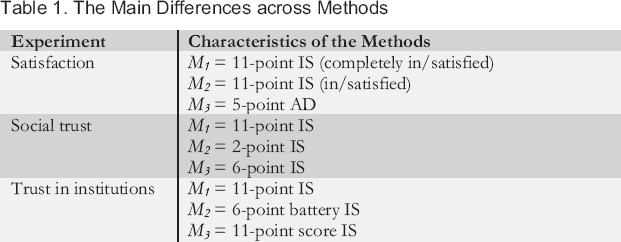
Each of the traits is measured with three methods. Table 1 gives their main characteristics. The complete questionnaire can be found online. 4
The Main Differences across Methods
The version for Mexico is available at http://test.nicequest.com/surveys/global_glacier/eb5e4c34-e56e-4f1c-be7d-7354febeb01f (it was adapted to Colombia just by changing the name of the country) (9 November 2015).
The satisfaction experiment makes it possible to test the difference between AD and IS scales (H1) and the effect of fixed-reference points (H3). We expect the quality of M 3 to be the lowest (H1) and the quality of M 1 to be higher than that of M 2 (H3). Overall, therefore, we expect the satisfaction experiment to have: q 2 M1 > q 2 M2 > q 2 M3.
The social trust and trust in institution experiments makes it possible to look at the quality for different numbers of response categories when focusing on IS scales (H2). For the social trust experiment, we expect: q 2 M1 > q 2 M3 > q 2 M2 . For the trust in institutions experiment, we expect: q 2 M1 = q 2 M3 > q 2 M2 .
Results: The Quality Estimates
Table 2 presents the quality estimates for each experiment in Mexico and Colombia. It gives the quality for each trait and method separately, together with the average quality across the three traits. When the quality varies depending on the position of the method, both are indicated: the estimate when the method is at the beginning (with a “B” in parentheses) and when the method is at the end (with an “E” in parentheses).
Quality Estimates q2ij in Mexico and Colombia for the Different Traits (t i ) and Methods (M j )
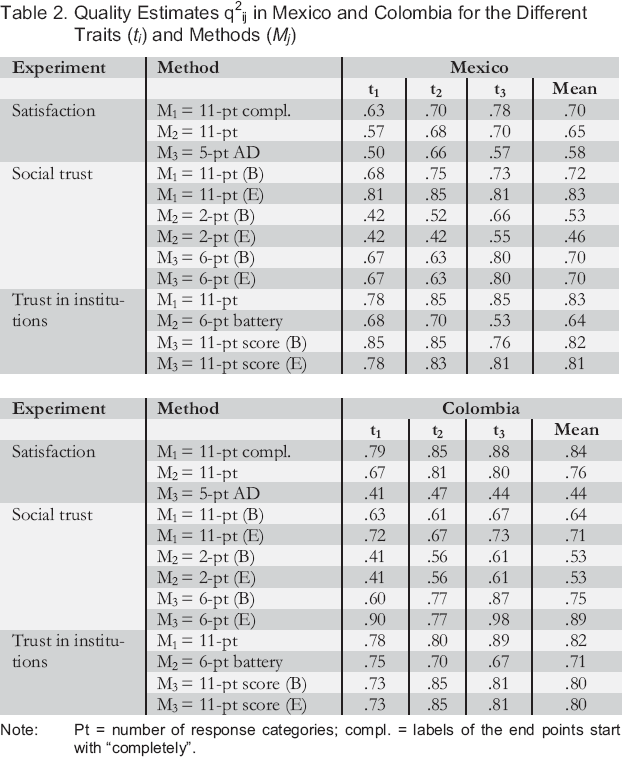
Note: Pt = number of response categories; compl. = labels of the end points start with “completely”.
Before looking at these estimates, we should mention some limits encountered during the analyses. First, even if a three-group design was used, in the social trust experiment, the initial model in both countries led to improper solutions, with a negative variance for the third method factor. By allowing some parameters to vary for a given method depending on whether the method was asked at the beginning of the survey or at the end, we obtained a proper solution. However, the results are very sensitive to corrections. It is difficult to be sure that the corrections we made are all adequate and that we did not miss any other correction that would be necessary. Therefore, we should be careful about the conclusions we draw from this experiment. Replication of the results would be needed in order to achieve greater confidence.
For the two other experiments, the initial models led to proper solutions and the results were less sensitive to corrections. When the introduction of parameters misspecified in JRule did not change the results, we chose not to introduce them, even if the general fit measures of the model were not so good.
Keeping this in mind, Table 2 shows that in the satisfaction experiment, the quality for the 11-point scale with fixed reference endpoints (M1) is the highest. It is followed by the one 11-point scale that does not have fixed reference endpoints (M2), and finally that of the five-point AD scale (M3). The differences are generally larger between M2 and M3 than between M1 and M2. Using AD scales led to lower quality. In particular, the difference in Colombia is huge. We should note that the number of points also varies. However, Revilla, Saris, and Krosnick (2013) found that AD scales with 11 points generally have lower quality than those with five points. Finally, using fixed reference points also increases the quality, but in a lower proportion. This is in line with H3.
With regard to the trust in institution experiment, we expected the quality of the 11-point scales (M1 and M3) to be equal and higher to that of the six-point scale (M2). Indeed, we found that M2 has the lowest quality. The quality estimates for M1 and M3 are very similar in general. In Mexico, we also found a difference for M3 depending on the position of the method within the questionnaire, but taking the average over the three traits erased this difference. Overall, using 11-point scales with separate questions (either with a radio button scale or by asking respondents to write a score between 0 and 10) leads to a better quality than using a six-point scale with all questions in a battery. This can be a combined effect of the number of points and presentation in a battery.
Finally, for the social trust experiment, the shortest scale (M2) has the lowest quality. However, the order between the 11-point (M1) and the six-point scale (M3) is different depending on the country. In Mexico, M1 has the highest quality (as expected), whereas in Colombia it is M3. This finding suggests that using a two-point scale results in lower quality than a six- or 11-point scale; however, which of the six- and 11-point scales is better varies across countries. Nevertheless, these results should be confirmed by further research, for the limits mentioned earlier.
What Can We Conclude?
In conclusion, this study used a split-ballot MTMM approach to get estimates of the quality, defined as the strength of the relationship between the latent variable of interest and the observed answers, in two countries for which this had not been done before: Mexico and Colombia.
Overall, we found support for two hypotheses:
: AD scales lead to a much lower quality than IS ones, especially in Colombia.
The use of fixed reference points for the two end points of the scale increases the quality, but only slightly.
Hypothesis 2 is also generally supported:
: Increasing the number of response categories (up to 11) positively affects the quality of IS scales.
It was only in Colombia in the social trust experiment that the results were not completely in line with H2, since the six-point scale has a higher quality than the 11-point scale. However, this may be linked to the problems encountered during the analyses of the model for this experiment. In general, therefore, this study shows support for the three hypotheses. Moreover, the quality estimates are quite similar in our analyses to what has been found in the USA or Europe (for example, compared with results in Saris and Gallhofer 2007).
Therefore, a few recommendations can be made for future questionnaire design in Mexico and Colombia. First, researchers should prefer the use of IS scales and avoid the AD ones, which lead to much lower quality. Second, when using IS scales, researchers might prefer using 11-points, even if there is one experiment in Colombia where the six-point scale performs better. Third, fixed-reference points should be used for the two endpoints of the scales.
Nevertheless, more MTMM experiments need to be conducted in these new geographical areas. It is possible that the impact of the scale characteristics depends on the topic, so more concepts should be tested. Also, different modes of data collection should be used to check the robustness of the results, particularly in Mexico where Internet coverage is quite low. Besides, the quality estimates are not exactly equal in the different countries and languages. To be able to correct for measurement errors in surveys done in different places, it is necessary to obtain estimates of the size of the errors or of their complement: the quality estimates. This is a crucial first step in order to be able to obtain correct estimates of the relationships of interest, even when the questionnaires have been designed very carefully. As Table 2 shows, even the best methods are far from having a quality of one. Therefore, researchers should always correct for the remaining measurement errors. It is even more crucial in the frame of comparative research: standardized relationships cannot be compared across countries if the quality estimates are not similar, except if we first correct for these differences in quality. Therefore, more MTMM experiments are necessary in Central and Latin America. If a large number are conducted, a meta-analysis similar to that of Saris and Gallhofer (2007) could be made and Latin American countries could be included in a program like SQP. This would create the attractive situation whereby researchers could obtain estimates of the quality without having to do MTMM experiments.
Footnotes
Appendices
Initial Model,LISREL Input
Analysis of Netquest satisf group 1 Colombia
Analysis of group 2
Analysis of group 3 Netquest
List of Corrections from the Initial Model,Indicators of Fit
The variables are in the following order: first, method 1 trait 1, trait 2, trait 3, then, method 2 trait 1, trait 2, trait 3, and finally, method 3 trait 1, trait 2 and trait 3.