
Abstract
Au nanodots decorated Cu2O nanooctahedrons were fabricated by a facile liquid-phase process combined with a galvanic replacement reaction for nonenzyme glucose detection. A simple rapid test strip based on the nanooctahedrons was proposed to evaluate the possibility of commercial application in nonenzymatic glucose detection. This test strip shows excellent response toward glucose. Linear response was obtained over a concentration ranging from 0.05 mM to 15 mM, and the detection accuracy is 0.05 mM. The good detection performance in selectivity, stability, and feasibility proving the great potential application in human blood glucose monitoring. This study demonstrated the possibility of a high-performance nonenzyme glucose test strip based on metal-oxide nanostructures decorated by catalysts.
Introduction
Diabetes is a major cause of mortality and morbidity in the world. 1,2 Patients with diabetes need to monitor their blood glucose concentration regularly for the diagnosis and management. Therefore, the fast, accurate, and reliable glucose sensor is necessity. In addition, glucose sensors are also important in food safety and biotechnology, so the research of glucose sensor has attracted much attention. 3 –5 Clark and Lyons proposed in 1962 the initial concept of glucose enzyme electrodes. 6 Based on this principle, Updike and Hicks first developed glucose sensors using the glucose oxidase (GOx) and completed the determination of glucose content in biological liquid. 7 The enzymatic glucose sensor has made great contributions to the monitoring of glucose in the body and the control of diabetes complications, although the accuracy and stability need to be improved.
At present, the glucose sensors are mainly divided into enzyme glucose sensors based on glucose oxidation and nonenzymatic glucose sensors. 8,9 Previous glucose sensors usually involve the use of enzymes such as GOx, which takes advantage of the high efficiency, specificity, and mild effect of enzymes. 10 However, enzyme glucose sensor suffer from some problems such as poor stability, unsatisfactory reproducibility, and complicated enzyme immobilization procedures. To overcome the shortcomings of enzyme glucose sensor, many nonenzymatic glucose sensors have been proposed. 11 –13 Nonenzymatic glucose sensor is used on the catalytic activity of glucose with electricity avoiding the influence factors of the enzyme such as temperature, humidity, pH, and other disturbances, which leading to the advantages of high stability, simple preparation, and good reproducibility. 14,15
The nonenzymatic glucose sensor can be divided into noble metal electrode materials, nonnoble metal electrode materials, carbon-based composite electrode materials, and other types of nonenzymatic glucose sensors according to the different electrodes. Fleischmann and colleagues first investigated in detail and established the electrochemical oxidation mechanism of glucose on the surface of nickel electrodes. 16 Tang’s team used cubic and octahedral Cu2O crystals to study the facet-dependent activities for nonenzymatic detection of glucose, and the electrode material showed high sensitivity and good uniqueness. 17 Zhang reported that the Cu2O electrode prepared by low-temperature hydrothermal synthesis method exhibited good glucose detection performances with a larger linear response range. 18 Therefore, there have been extensive investigations on Cu2O-based materials for nonenzymatic biosensors. 19,20 In addition, the octahedral Cu2O nanostructures have the advantages of high surface state distribution uniformity, large proportion of detection and recognition sites for specific particles, good thermodynamic stability, and repeatability. 21,22 Owing to these merits, the Cu2O nanooctahedrons have become a promising candidate material for electrochemical oxidation of glucose. Stanciu’s team prove that the {111} crystallographic planes of Cu2O are more effective than the {100} crystallographic planes for catalyzing the electrochemical reactions of glucose, hence the Cu2O octahedrons with maximum {111} crystallographic orientation shown much better glucose response compared with cubic and granule structures. 23 Au nanoparticles can be prepared onto suitable substrates for biosensor applications. 24,25 Sun reported that Cu2O showed better catalytic performance after deposition of metal particles (e.g. Au, Ag, and Cu). 26 Liu reported that hybrid Cu2O-Au film showed excellent catalytic activity toward glucose in an alkaline medium, and the linear response was obtained over a concentration ranging from 1 mM to 20 mM. 27
At present, the commercial enzyme glucose test strip is very small and easy to carry, which is one of the basic requirements for home-type testing. The test requires only a few dozen microliters of blood and the damage to the body is negligible. However, most of the reported nonenzymatic glucose testing based on Cu2O nanostructures have been done in the electrolytic cell, and the glucose detection performance of Cu2O electrodes was measured in excess glucose solution (about tens of mL in volume). This method is not suitable for home-type testing and rapid detection. On the other hand, the performance of Cu2O nanostructures in the case of trace solution (about tens of µL in volume) has not been well-studied. In other words, the portable test strips based on Cu2O nanostructures for fast and convenient glucose detection remain to be studied systematically.
In this article, a simple rapid test strip based on Au nanodots (NDs) decorated Cu2O (Au@Cu2O) nanooctahedrons was proposed to evaluate the possibility of commercial application in nonenzymatic glucose detection. A facile liquid-phase process was used for fabricating Cu2O nanooctahedrons combined with a galvanic replacement reaction for decoration of Au NDs on the surfaces of nanooctahedrons. The detection performance of the rapid test strips was studied by cyclic voltammetry (CV) and chronoamperometry, and the studies prove the great potential application in human blood glucose monitoring.
Experimental section
Materials
The chemical reagents used are copper chloride dihydrate (CuCl2·2H2O), sodium hydroxide (NaOH), ascorbic acid (AA), polyvinylpyrrolidone (PVP), glucose, uric acid (UA), cysteine (Cys), sodium chloride (NaCl), sodium tetrachloroaurate dihydrate (NaAuCl4·2H2O), and potassium hydroxide (KOH). All of the chemicals are analytical grade reagents and used as received.
Synthesis of Cu2O nanooctahedron
In a typical synthesis, 0.176 g (0.01 mmol) of CuCl2·2H2O and 4 g PVP were added into 100 mL of deionized water to form a light transparent solution. Successively, the mixture was transferred into a 500 mL round-bottomed three-necked flask and heated at 55°C under magnetic stirring. Every 30 min, 10 mL 2 mol/L NaOH solution and 10 mL 0.6 mol/L AA solution were injected into the mixture, and the mixtures were continue heated at 55°C and stirred for 5 h. The resulting brick-red precipitate was collected by centrifugation, washed several times with deionized water and ethanol, and dried in a vacuum for 12 h.
Synthesis of Au@Cu2O nanooctahedrons
The obtained Cu2O nanooctahedrons were dispersed in 0.1 mmol/L NaAuCl4 solution for 1–13 mins to produce Au NDs decorated nanooctahedrons, followed by rinsing with deionized water. Then the sample was collected by centrifugation again and dried in a vacuum chamber at room temperature. In this reaction, AuCl4− ions were reduced by Cu2O to form Au NDs due to the galvanic replacement reaction. The reaction is as follows 23

Characterization of materials
The morphology of Au@Cu2O nanooctahedrons was obtained by scanning electron microscope (SEM, EVO 18, ZEISS, Germany) with an operating voltage of 15 kV. The transmission electron microscopy (TEM, JEM-2200FS, JEOL, Japan) was used to observe the size and morphology of the Au NDs on the nanooctahedrons. Crystallinity was studied by X-ray diffraction (XRD, Bruker, D8 Advance, Germany). The surface elemental was checked with X-ray photoelectron spectroscopy (XPS, ESCALAB MKII, VG, USA).
Characterization of glucose detection
The characterization of the glucose detection involved CV and chronoamperometry experiments were carried out using a custom-made four-probe tester (including a four-electrode probe, a Keithley 2400 sourcemeter, and a computer). The CV experiments are performed between 0 V and 2.0 V using a scan rate of 0.01 V/s, while a DC bias voltage of 1.45 V is utilized in the chronoamperometry experiments. In the typical chronoamperometry process, 0.2 mol/L KOH aqueous solution is first dripped onto the test strip with a bias voltage of 1.45 V, then equal volume of glucose solution was dripped into KOH solution. The response was calculated according to the formula: R = (I max − I KOH)/I KOH, where the I max is the maximum current after the addition of glucose and I KOH is the average current after a drop of KOH.
Results and discussion
The morphology of the obtained Cu2O and Au@Cu2O nanooctahedrons were revealed by SEM and TEM observations. A typical SEM image of octahedral Cu2O nanoparticles is shown in Figure 1(a), and the high magnification of individual nanooctahedron is shown in Figure 1(b). It can be clearly seen that the Cu2O nanooctahedrons are uniform with an average edge length of 900 nm, and they exhibit standard octahedral construction with sharp edges and corners. In addition, Figure 1(b) clearly showing the smooth surface of nanooctahedrons. Figure 1(c) shows the TEM image of Cu2O nanooctahedrons, which further confirm the sharp edges and smooth surfaces of nanooctahedrons.

(a) and (b) SEM images of Cu2O nanooctahedrons with low magnification and high magnification. (c) TEM image of Cu2O nanooctahedrons. (d) SEM images of Au@Cu2O nanooctahedrons. (e) to (g) TEM and HRTEM images of Au@Cu2O nanooctahedrons. The red- and green-dotted lines in (f) indicate the surface of the Cu2O nanooctahedron and the Au NDs, respectively. SEM: scanning electron microscope; TEM: transmission electron microscopy; HRTEM: high-resolution transmission electron microscopy; ND: nanodot; Au@Cu2O: Au NDs decorated Cu2O.
While the morphology of the Au@Cu2O nanooctahedrons is shown in Figure 1(d), and the standard octahedral construction is still clear with no significant change in size after the Au NDs decoration. However, significant adhesion NDs could be observed on the surface of the nanooctahedrons. Figure 1(e) to (f) shows the TEM and high-resolution transmission electron microscopy images of Au@Cu2O nanooctahedrons. From the Figure 1(e) and (g), we can see the dense NDs on the surface of nanooctahedrons with lattice spacing of 0.235 nm, which corresponds to the Au {111} crystal planes. Furthermore, the Au NDs are partially embedded in the Cu2O surface, as the magnified view in the Figure 1(f). The red- and green-dotted lines in Figure 1(f) indicate the surface of the Cu2O nanooctahedron and the Au NDs, respectively. So, we can infer that Cu2O on the surface of nanooctahedrons was oxidized (from Cu+ to Cu2+) and dissolved into the solution in the process of galvanic replacement reaction. The resulting vacancy due to the dissolution of Cu2O happens to be filled by the Au NDs. This can also indicate that the galvanic replacement reaction occurs only at the surface of nanooctahedrons. The Au@Cu2O nanooctahedrons in Figure 1 were obtained by treating with NaAuCl4 for 8 min.
The phase formation of Au@Cu2O nanooctahedrons was evaluated by performing an XRD analysis. Figure 2(a) shows the XRD pattern of the nanooctahedrons. The diffraction peaks correspond to (110), (111), (200), (220), (311), and (222) crystal faces of hexagonal wurtzite Cu2O (JCPDS: 036–1451), and no peaks ascribed to impurities were found. At the same time, the intensity of crystallization peak is high, which means that the Cu2O nanooctahedrons have good crystallization purity. However, no Au diffraction peaks can be found in the XRD spectrum. XPS spectrum was further employed to investigate the compositions and element chemical states of the sample. Figure 2(b) indicated that the high-resolution Cu 2p XPS spectrum has two strong main peaks at the binding energy of 952.2 and 932.4 eV, which are attributed to the 2p1/2 and 2p3/2 spin-orbital components of Cu1+. Therefore, XPS proves the formation of Cu2O. In addition, 2-weak binding energy peaks appear at near 955.3 and 934.7 eV, which are attributed to the 2p1/2 and 2p3/2 spin orbital components of Cu2+. There is the observation of other satellite peaks on the high-binding energy side of the main peak of Cu2+, which are absent in the spectra for Cu2O. The appearance of Cu2+ may be due to the slight surface oxidation of Cu2O in the air under ambient conditions. 28 Figure 2(c) displays that O 1 s has two strong peaks at 531.6 and 530.3 eV, which are assigned to the surface oxygen ions or oxygen vacancies and the lattice oxygen. Meanwhile, the higher resolution XPS data for Au 4f peaks from the Figure 2(d) show two individual peaks at approximately 87.9 and 84.3 eV. These peaks are assigned to Au0, suggesting the formation of Au NDs.
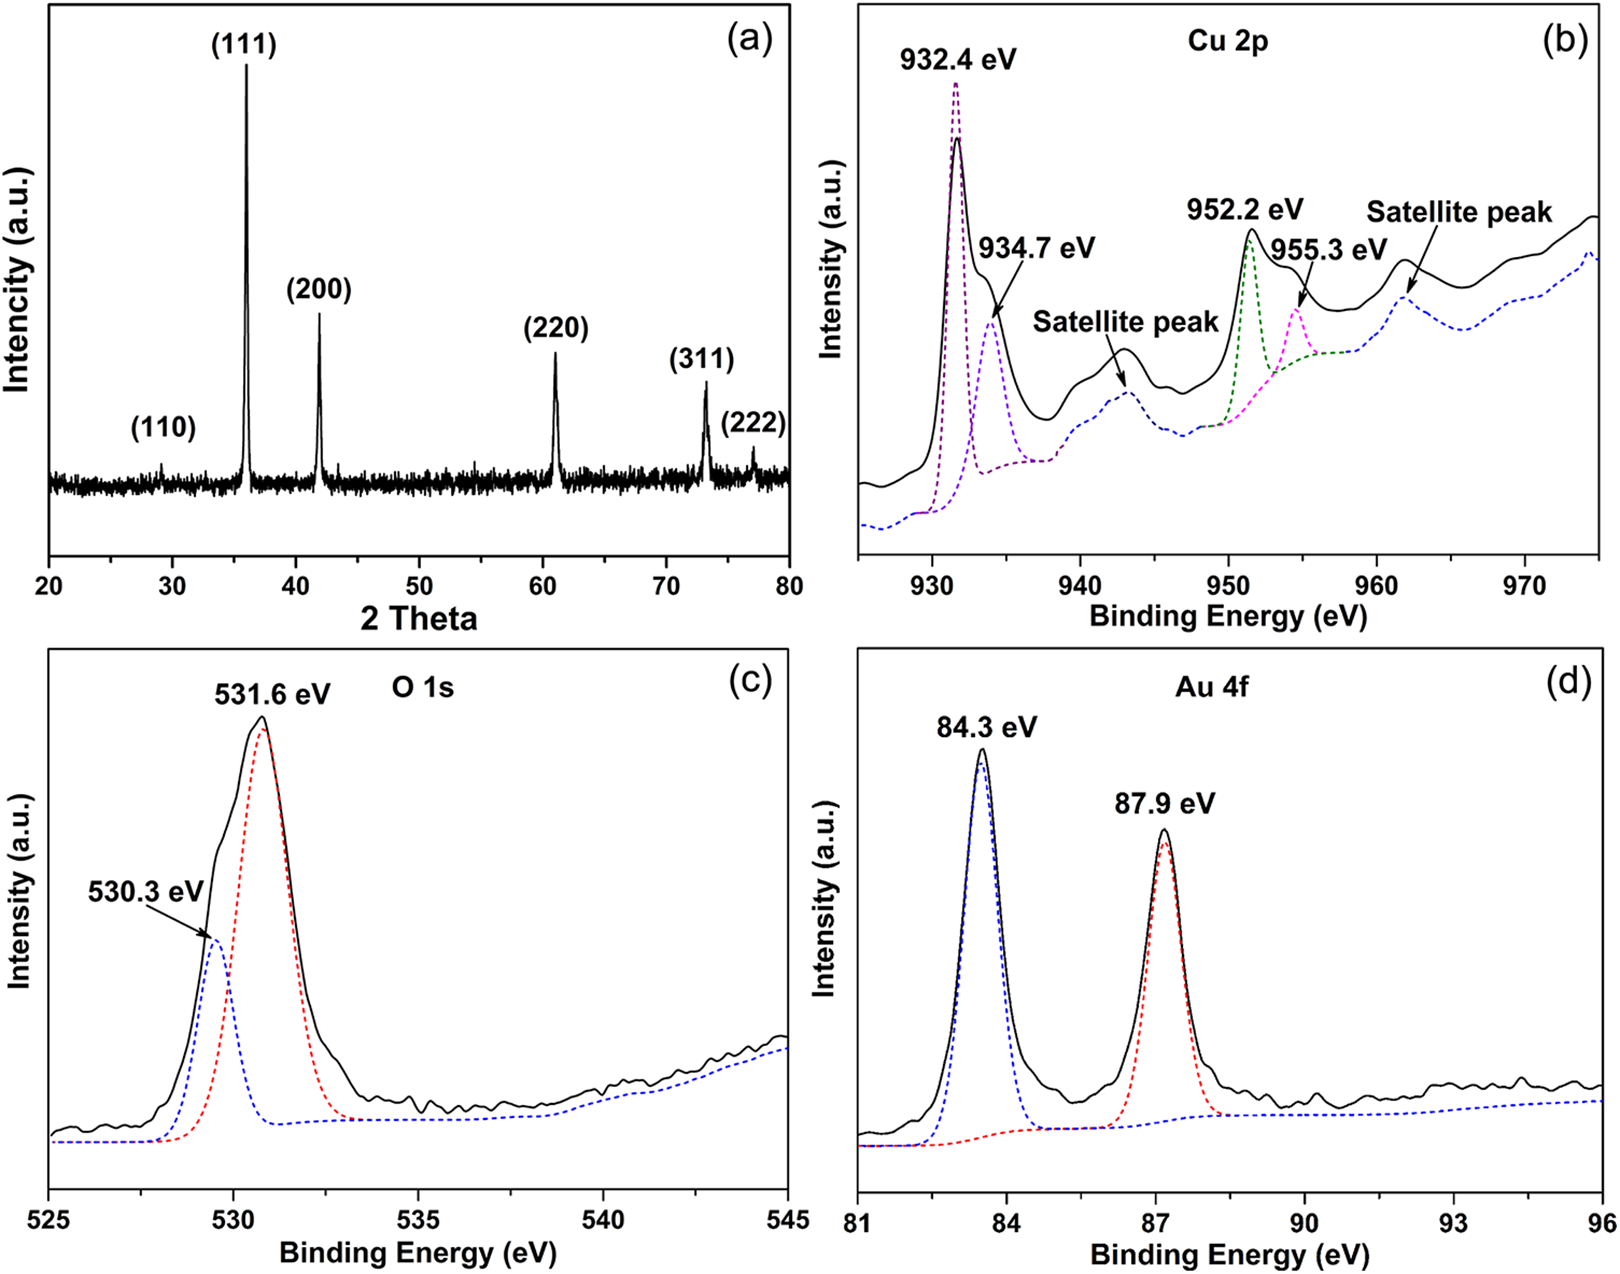
(a) XRD pattern and high-resolution, (b) Cu 2p, (c) O 1 s, and (d) Au 4f XPS spectra of Au@Cu2O nanooctahedrons. XRD: X-ray diffraction; XPS: X-ray photoelectron spectroscopy; Au@Cu2O: Au NDs decorated Cu2O.
The schematic illustration and real photo of nonenzymatic glucose printed circuit board (PCB) test strip were shown in Figure 3. For the construction of test strip, as shown in Figure 3(a), PCB substrate with interdigital electrode was prepared first. The interdigital electrode pattern consisted of seven fingers with dimensions of 1 mm width and 1 mm spacing. A layer of silver conductive paint was smeared on the interdigital electrode using an interdigital mask to improve the electric contact between sample and PCB copper foil. Then the dense Au@Cu2O nanooctahedron aqueous solution was painted onto the interdigital electrode and dried completely at atmosphere. At last, the Au@Cu2O nanooctahedron film was covered by a pervious filter membrane and assembled into the shell. To connect directly to the circuit board, the electrodes of the test strip were designed to be compatible with the universal serial bus interface, as the real photo in Figure 3(b). The response property of the test strips to glucose is characterized by CV first. It can be seen in Figure 3(c) that two pairs of oxidation peaks around 0.8 and 1.4 V on the closed CV curve. According to earlier reports, the first oxidation peak results from the oxidation of Cu2O. 28,29 Obviously, the second oxidation peak shifted right with increasing concentration of glucose (from 1 mM to 5 mM), which confirms that the oxidation peaks here are the result of the oxidation of glucose molecules. Accordingly, the bias voltage is set to 1.45 V in our chronoamperometry test to satisfy the redox potential of the glucose with the highest concentration.
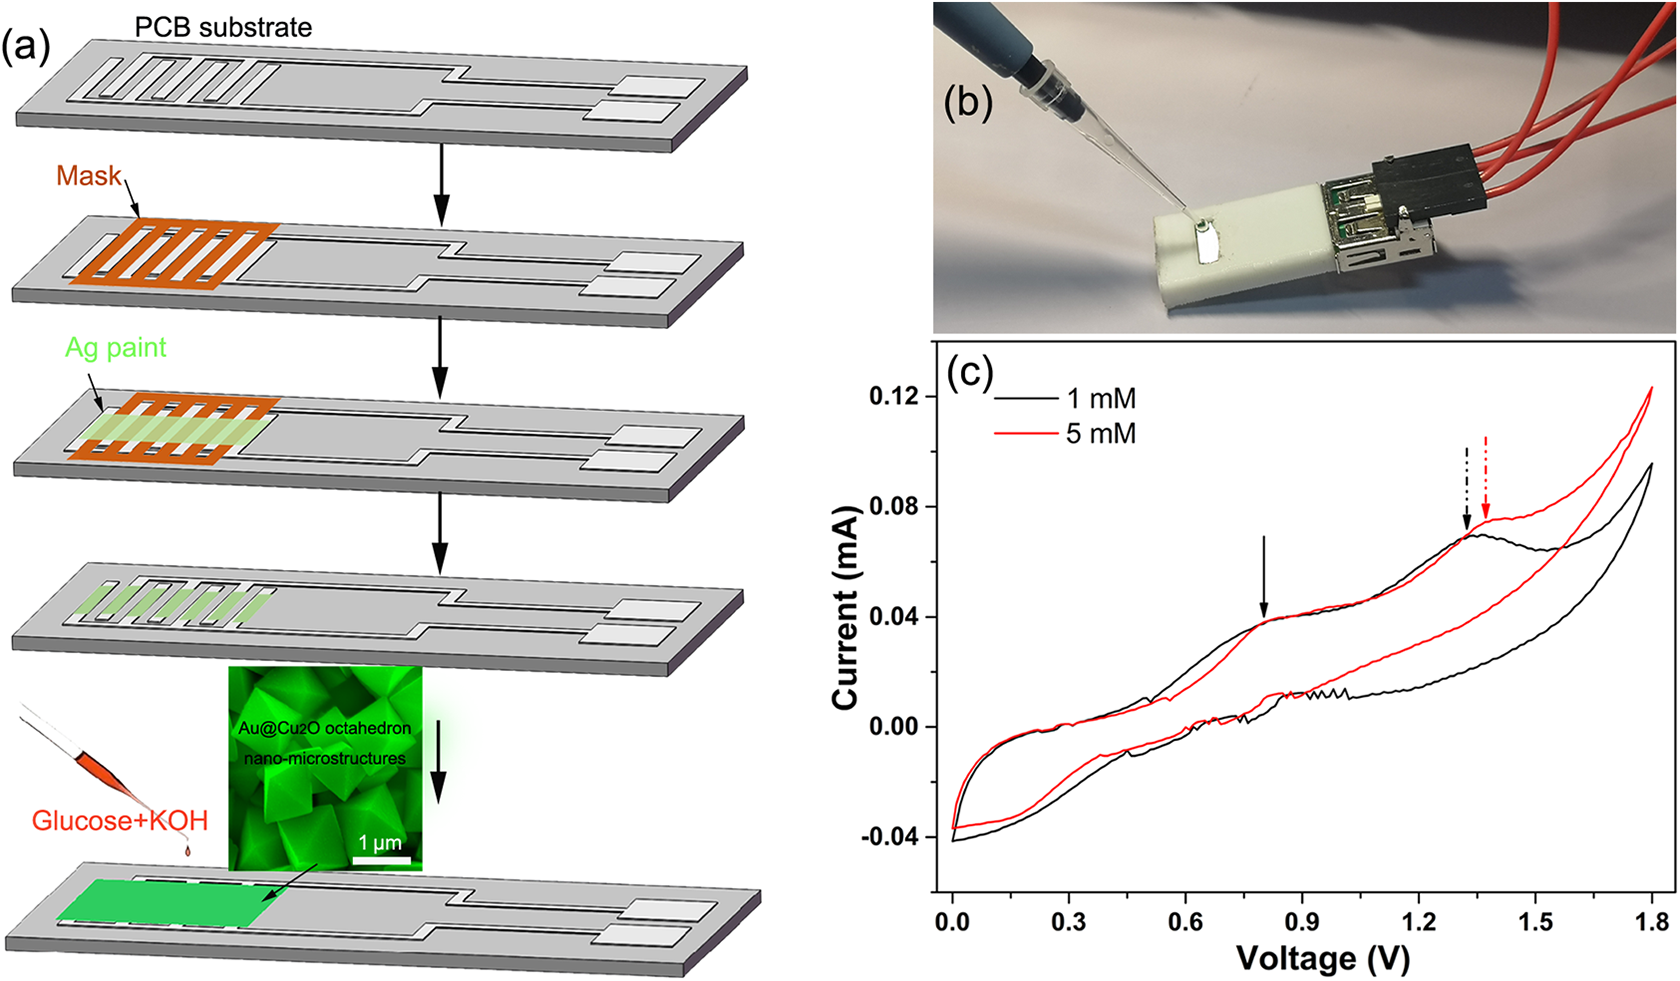
(a) Schematic illustration and (b) real photo of nonenzymatic glucose test strip. (c) The CVs of 1 and 5 mM glucose solutions based on the test strip at a scan rate of 0.01 V/s. CV: cyclic voltammetry.
The influence of processing time of NaAuCl4 solution of the Au@Cu2O nanooctahedrons for probing glucose was optimized. The response of the Au@Cu2O nanooctahedrons with NaAuCl4 processing time ranging from 1 min to 13 min was measured. As Figure 4(a) showing, the optimal processing time is 8 min. Moreover, the test strips based on Au@Cu2O nanooctahedrons were applied for practically probing glucose with various levels. As shown in Figure 4(b), the test strips show a linear response over the concentration range from 0.05 mM to 15 mM (R 2 = 0.9889), with the limit of detection of about 0.05 mM, which should be practically feasible for the human blood glucose test. As Stanciu reported that the response of the Au@Cu2O particles is linear with the glucose concentration in the range from 1 mM to 14 mM with the detection limit of 0.21 mM, while the response of Au@Cu2O nanooctahedrons is even worse. 23 It is clear that the performance of the test strips we have built is better, especially in terms of the detection limit.

(a) Influence of processing time of NaAuCl4 solution on the glucose response. (b) The plot for linear variation of response versus glucose concentration (in glucose concentration range of 0.05–15 mM). (c) Response of the test strip to potential interfering species. (d) Stability study of the test strips.
One of the important analytical factors for an amperometric biosensor is the ability to discriminate the interfering species that normally coexist with glucose in human blood serum and other samples such as UA, NaCl, and Cys. 30 As shown in Figure 4(c), there was no obvious response when adding these interfering substances onto the test strips with the same concentration of 10 mM. The long-term stability of the test strips was studied by measuring amperometric responses with 10 mM glucose for duration of 30 days, as presented in Figure 4(d). There was only a slight response reduction (∼4.5%) after 30 days; it means that the designed test strips have strong stability.
The response behavior of Au@Cu2O nanooctahedrons to 15 mM glucose was measured by chronoamperometry, the result can be found in Figure 5. After the test strip was connected to the circuit, 20 µL of KOH solution was first dropped onto the test strip. When the current has stabilized, an equal volume of glucose solution was then dropped into the KOH solution. As we can see in Figure 5, the time required for the current to increase to saturation was 4 s. However, the current then dropped immediately as the glucose was consumed. From the above, these results confirm that the Au@Cu2O nanooctahedrons have good sensitivity, selectivity, and stability for glucose detection. This result means that the proposed methods could be utilized for determining the amount of glucose in a real sample.

The response behavior of Au@Cu2O nanooctahedrons to 15 mM glucose. Au@Cu2O: Au NDs decorated Cu2O.
Conclusions
A novel nonenzymatic glucose sensor based on the Au@Cu2O nanooctahedrons was successfully prepared using a facile liquid-phase process combining galvanic replacement reaction. The studies showed that decorating the surfaces of Cu2O nanooctahedrons with Au NDs increased the glucose detection performance. The Au@Cu2O nanooctahedrons glucose test strips exhibit high sensitivity, excellent selectivity, and appropriate linear detection range. A good linear detection range of 0.05–15 mM has been established. Furthermore, the test strips exhibit a high selectivity against several tested common interfering substances in glucose detection. The glucose sensing performance indicates a strong application prospect in actual blood testing. The present work can be used to guide the commercial product design of nonenzymatic glucose rapid test strip based on metal-oxide nanomaterials.
Footnotes
Author contributions
DC and KX contributed equally to this work.
Declaration of conflicting interests
The author(s) declared no potential conflicts of interest with respect to the research, authorship, and/or publication of this article.
Funding
The author(s) received no financial support for the research, authorship, and/or publication of this article: This work was supported by the National Natural Science Foundation of China (nos 11704168, 11404158, and 11774128), the Natural Science Foundation of Shandong Province (no. ZR2018JL003), and the Special Fund of the Education Department of Shaanxi Province (no.14JK1131).