
Abstract
Low nano-SiO2 loaded nylon 6 (PA6) nanocomposites were readily produced via in situ polymerization. The effect of surface-modified functional groups of nano-SiO2 on the interfacial structure and properties of nylon 6/SiO2 nanocomposites were studied, which indicated that the surfaces of the two kinds of nano-SiO2, namely RNS-A and DNS-3, contained amino groups and alkyl chains, respectively. Furthermore, as-prepared nanocomposites were characterized by means of transmission electron microscopy (TEM), Fourier transform infrared spectroscopy (FTIR), scanning electron microscopy (SEM), thermogravimetric analysis (TGA) and differential scanning calorimetry (DSC). The results showed that the PA6 chains were attached to the surface of nano-SiO2 by the modes of physical adsorption and chemical bonding. Nano-SiO2 was found to uniformly disperse inside nanocomposites with RNS-A and DNS-3, thereby increasing the superior strength and toughness of nanocomposites in comparison to the pure PA6. Of particular interest was the enhancement of the thermal stability of nanocomposites by adding RNS-A; meanwhile, DNS-3 had little effect on thermal stability. This was the possibly explained by the enhancement of thermal stability owing to the cross-linked reaction. Moreover, the reaction system exhibited gelatine following the addition of RNS-A up to 1.5wt%.
1. Introduction
Polymer-matrix composites (denoted as PMCs) have consistently been of interest for decades, because they possess markedly improved mechanical properties (tensile modulus and strength), thermal stability, chemical resistance, flame retardancy and barrier resistance as compared with pure polymers [1-7].
It is well known that the interfacial effect between nanoparticles and the polymer matrix greatly affect the properties of nanocomposites. It is generally believed that the dispersion of fillers in the polymer matrix is an important issue for improving the properties of nanocomposites. Unfortunately, as a consequence of the high surface energy of nanoparticles, aggregation is the key factor affecting the dispersion of nanoparticles. To remove the aggregation of nanoparticles, researchers have tried to improve the dispersion of nanoscale fillers in the polymer matrix and increase the interfacial interaction between the filler and the polymer matrix by making use of a sizing agent, a surface-modifying agent and other promoters [9-12]. Of particular interest is the surface-modified method of nanoparticles owing to the simple operation involved and its remarkable effect. However, the surface functional groups of nanoparticles also affect the improved properties of nanocomposites by differing from the dispersion, comparison and interfacial effect of nanoparticles [13-16].
To research the effect of the surface functional groups of nanoparticles on the properties of nanocomposites, we especially focus on preparing nylon 6/SiO2 nanocomposites (as noted by PRA) by using the two kinds of nano-SiO2 (RNS-A and DNS-3), along with the in situ polymerization route, so that we can study the interfacial effect of nano-SiO2 on the properties of nylon 6. In other words, the amide groups of RNS-A participate in the polymerization process of nylon 6, thereby forming micro-cross net structure inside the nanocomposite and improving the mechanical properties of nylon 6; meanwhile, DNS-3 disperses in nylon 6 by depending solely on the physical adsorption effect. This paper reports on the preparation of PA6/nano-SiO2 nanocomposites, as well as the characterization of their structure and evaluation of their mechanical properties and crystallization behaviour.
2. Experimental
2.1 Material
Reagent grade ε-caprolactam was kindly provided by Yelang Chemical Co. Ltd. in Wuhan, China. Reagent grade adipic acid was supplied by Paini Chemical Reagent Factory in Zhengzhou, China. Reagent grade formic acid was supplied by Kemel Chemical Reagent Co. Ltd. in Tianjin, China. The two different kinds of surface-modified nano-SiO2 (coded as DNS-3 and RNS-A, respectively) used in this study were supplied by the Henan Nanomaterial Research Centre of Engineering and Technology, China. Their particle size ranged from 5 to 25 nm and their specific surface area was about 200 m2/g. Modified nano-SiO2 was prepared by in situ surface modification in an aqueous solution. The DNS-3 is a kind of nano-SiO2 modified with inert organic carbon chains, whereas the RNS-A product contains a reactive functional amide group, making the nanoparticles take part in organic reactions, thereby increasing the bonding strength between the nanometre particulates and the polymer matrix.
2.2 Case Preparation of PA6/nano-SiO2 composites
The two kinds of nano-SiO2 were firstly dried at 80 °C in a vacuum for 12 h. The procedure for polymerization was as follows. Proper amounts of ε-caprolactam, adipic acid and distilled water were added to a 250 mL three-neck flask. The resultant mixture was heated with a stirring constant-temperature electrothermal cover from room temperature to 190 °C and allowed to react for about 3 h thereafter. Then the nano-SiO2 was added to the reaction system and, in turn, gradually heated to 260 ºC within 1.5∼2 h; this was followed by gradually pumping to −0.08 MPa within about 1.5 h to facilitate crude nylon 6/SiO2 nanocomposites. Upon completion of the reactions, crude nylon 6/SiO2 nanocomposites were cast-moulded into final “dumb-bell-like” and “V” model specimens for testing the tensile strength and impact toughness.
Moreover, a certain amount of the extruded nylon 6/SiO2 nanocomposites was dissolved in formic acid and repeatedly dispersed/centrifuged for six cycles so as to extract nano-SiO2 (as-extracted nano-SiO2 was denoted as CD3 and CRA, respectively). Upon completion of the last cycle of dispersion/centrifuging, PA6 molecular chains could not be detected in suspension by using FTIR [16].
2.3 Characterization
FTIR spectra were recorded with an Avatar360 Fourier transform infrared spectrophotometer (FTIR, Nicolet, USA; KBr pellet). TGA and differential thermogravimetric (DTG) analysis of as-fabricated PRA were conducted with a TG/SDTA851e system (Mettler Toledo, Switzerland; up to 1,000 °C, heating rate 10°C min−1). A transmission electron microscopy (TEM, Amsterdam, Netherlands) was performed at an accelerating voltage of 30 kV to observe the state of nano-SiO2 in the PA6 matrix, from which nano-SiO2 was extracted from PRA containing 0.5% nano-SiO2 content by dissolving in formic acid. An SEM (JSM 5600LV, Japanese Electronics, Japan) was used for examining the impact fracture surface of PA6 and PRA at an accelerating voltage of 30 kV, while the fracture surface of specimens were sputter-coated with gold prior to observation. The morphology of spherulite PA6 and its nanocomposites was observed with a Leica DMLP polarizing optical microscopy equipped with a Linkam TM600 hot-stage. The crystallization and melting behaviours of PA6 and PRA were investigated by DSC (DSC822e, Mettler-Toledo, Switzerland), with about 5 mg of to-be-tested samples heated from room temperature (20 °C) to 300 °C at a rate of 10 °C min−1 and then cooled down to room temperature.
The tensile strength of PA6 and PRA was measured with a WDW-10D testing machine according to Chinese National Standard GB/T 1040–1992. The impact toughness was evaluated with a ZBC-1400-2 testing machine according to Chinese National Standard GB/T 1040–1993.
3. Results and Discussion
3.1 Dispersion performance of nano-SiO2 inside the PA6 matrix
The dispersion performance of nano-SiO2 inside the PA6 matrix is shown in Fig. 1. As expected, it was evident that nano-SiO can cause a homogeneous dispersion, while the particulates dispersed as individual particles (the size of DNS-3 was seen after about 5 nm and RNS-A was in the range of 5–20 nm) helps to increase the compatibility and interfacial strength between nano-SiO2 and PA6. This suggested that the surface modification of nano-SiO2 and in situ polymerization were beneficial in terms of increasing the properties of as-prepared PA6/SiO2 composites.

TEM photos of PA6/SiO2 nanocomposites containing 0.5wt%. DNS-3 (A) or RNS-A (B)
3.2 Interfacial analysis of nano-SiO2 isolated from PA6/SiO2 nanocomposites
The surface amino groups of RNS-A were able to chemically bond with molecular chains of PA6, thereby increasing the interfacial strength and the compatibility of nano-SiO2 with PA6, whereas the alkyl chains of DNS-3 only resulted in physical adsorption and, in turn, a poor interfacial effect. Fig. 2 shows the TGA curves for comparison with PA6, silica isolated from nanocomposites and original silica. The weight loss of CD3 was approximately the same as that for DNS-3, while the relative weigh loss of CRA was apparently higher than that for RNS-A. This clearly indicated that CRA had a higher content of grafted PA6 than CD3.

TGA curves of PA6, CD3, DNS-3, CRA and RNS-A
The FTIR spectra of PA6, CRA and CD3 are shown in Fig. 3. When compared with PA6, the spectra of CRA showed the characteristic bands of PA6 at 1,646 and 1,560 cm−1 (amide bands) and at 2,937 and 2,866 cm−1 (C-H bands), which further indicated that there was a considerable amount of PA6 chains adhered to the RNS-A surface that could not be separated by dissolving/repeated centrifuging processes. In contrast, the spectra of CD3 did not exhibit characteristic absorption peaks of PA6, suggesting that the polymer was not grafted on the surfaces of the DNS-3 particulates. The main reasons were as follow: for RNS-A, the surface reactive amide groups introduced by surface modification were able to participate in the polymerization of PA6, resulting in the PA6 polymer chain becoming chemically attached to the RNS-A surface and greatly increasing the interface strength between silica and the PA6 matrix; whereas the DNS-3, which was surface-modified by inert organic carbon chains, did not contain any reactive functional groups, resulting in no chemical bonding formed between DNS-3 nanoparticles and PA6 chains, yet interacting via hydrogen bonds [17-19]. The interfacial layer model between RNS-A and the PA6 matrix can be seen in Scheme 1.

FTIR spectra of PA6, CRA and CD3
3.3 Thermal performance analysis of as-prepared PA6/SiO2 nanocomposites
The thermal stability of PA6 and its filled composites, which contained 0.5% nano-SiO2, was characterized by TGA, as shown in Fig. 4. The derivative peaks (DTG, Fig. 4 (B)) were considered as the decomposition temperature [20]. Obviously, the decomposition temperature of nanocomposites with RNS-A of 458 °C was higher than that for PA6 composite with DNS-3. Furthermore, the enhanced thermal stability of the composites filled with RNS-A might be attributed to the strong adhesion between RNS-A and the PA6 matrix, which stabilizes the composite against thermal decomposition. In particular, it was noteworthy that the cross-linked structure might be more conductive in enhancing thermal stability.

TGA (A) and DTG (B) curves of PA6 and its nanocomposites with DNS-3 or RNS-A

The interfacial layer model between RNS-A and the PA6 matrix
Moreover, Fig. 5 also indicates an interesting phenomenon about the melting behaviours of DSC melt as well as the cooling behaviours of PA6 and its nanocomposites. Asobtained data are summarized in Table 1. In these experiments, the melting points of the composites containing nano-SiO2 were almost the same as that for pure PA6. However, low temperature endothermic peaks around 205 °C were introduced with the addition of nano-SiO2. The formation of a small shoulder prior to the endothermic peak might have arisen due to a variety of factors. Various researchers have suggested that it could be associated with the γ crystalline form of nylon 6 [6, 21].
DSC characteristic parameters of PA6 and its nanocomposites
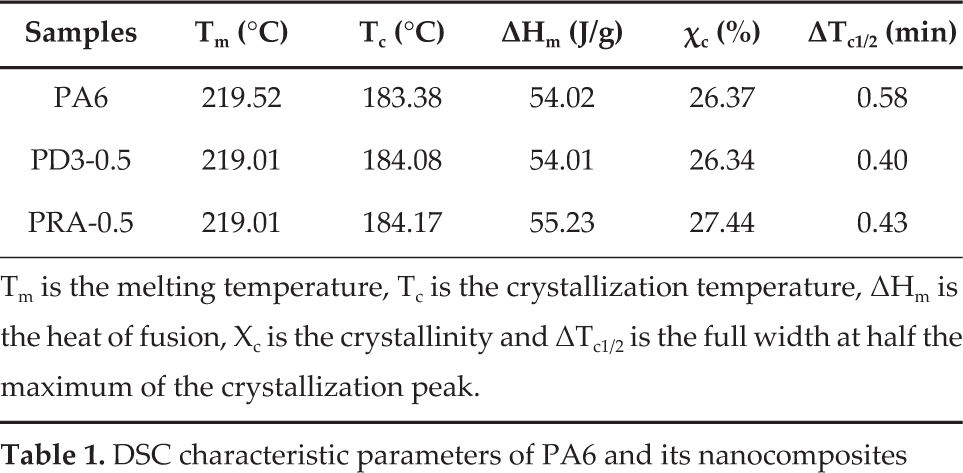
Tm is the melting temperature, Tc is the crystallization temperature, ΔHm is the heat of fusion, Xc is the crystallinity and ΔTc1/2 is the full width at half the maximum of the crystallization peak.

Melting curves (A) and cooling curves (B) of PA6 and its composites filled with DNS-3 and RNS-A
The DSC cooling traces of PA6 and its composites filled with DNS-3 or RNS-A are shown in Fig. 5 (B) and Table 1. It can be seen that one exothermic peak appeared in the DSC cooling curves of the unfilled PA6 matrix and its composites, showing the different peak temperatures; in other words, the addition of nano-SiO2 led to an increase in the crystallization temperature of PA6 while, in general, the crystallization peaks shifted towards higher temperature. The incorporation of RNS-A into PA6 led to a higher crystallization temperature than that for nanocomposite with DNS-3. This phenomenon might be due to the heterogeneous nucleation effect of nano-SiO2 and its restriction to the polymeric chains. The other important parameter ΔTc1/2 (the full width at half the maximum of the crystallization peak) was typically used to evaluate the crystallization rate during polymer crystallization, as seen in Table 1. Generally speaking, the lower ΔTc1/2 represented the narrower crystallite size distribution and faster crystallization rate during polymer crystallization. As Table 1 show, both the ΔTc1/2 of DNS-3 and RNS-A filled composites indicated an increased crystallization rate in comparison with that for PA6, such that the addition of both DNS-3 and RNS-A was conducive to the crystallization of PA6 [22].
3.4 Mechanical properties and SEM analysis
Both DNS-3 and RNS-A showed the potential to strengthen and toughen the PA6 matrix, as can be seen in Fig. 6. There were also differences, however, in the mechanical properties of the filled PA6 with the two types of surface-modified nano-SiO2 particulate. When DNS-3 was added into the matrix, the tensile strength of nanocomposite is obviously enhanced.

Impact and tensile strength of PA6 and its composites filled with (A) DNS-3 and (B) RNS-A
It could be claimed that the tensile strength had been improved markedly with just 0.1wt% of DNS-3 content and achieved the maximum when the silica content was 1wt%, compared with the pure PA6, with the tensile strength increasing by 34.5%. Meanwhile, the impact strength of the nanocomposite showed a slight increase, whereas the maximum impact strength increased by 12.5% when the silica content was 0.2wt%, with the impact strength deteriorating as the silica content further increased. When RNS-A was used, both the impact strength and tensile strength of the nanocomposite were obviously enhanced at the same time, while the maximum of the impact strength increased by 45.7% and 18.2%, respectively, when the silica content was 0.5wt%. The reason for the above phenomenon was as follows. Given that RNS-A with amino groups could form covalent bonding with PA6 molecular chains, this could have hindered the movement of PA6 molecular chains, thereby leading to difficultly in undergoing crystallization. Meanwhile, DNS-3 as a crystal nucleus was conducive to crystallization, which improved the tensile strength. Moreover, gelatine appeared in the system appeared when the addition of RNS-A reached 1.5%. Since the RNS-A was surface-modified by organic molecules containing reactive amide groups, with more of the amide groups being able to participate in the condensation polymerization of nylon 6, the cross-linked structure was formed and gelatine appeared in the system when the addition of RNS-A was more than a critical value.
It was widely believed that good dispersion of the nanoparticles and the interaction between the matrix and filler may play important roles in the effects of the nanoparticles on composite properties. As shown in Fig. 1, both DNS-3 and RNS-A were rather well dispersed inside the PA6 matrix in the present method of preparation, with good dispersion mainly related to the surface modification of nano-SiO2, while different surface modification caused a different interaction between two phases. For the PA6/RNS-A composite, PA6 chains were connected to the RNS-A surface by covalent bonding and hydrogen bonding. Meanwhile, for the PA6/DNS-3 composites, physical entanglement and hydrogen bonding formed between the PA6 chains and the DNS-3 surface. The different interaction eventually led to different effects on the mechanical properties. More detailed reasons were also indicated by the SEM analysis, as discussed in the following.
Fig. 7 shows the SEM photograph of the impact fracture surfaces of PA6 and PA6/nano-SiO2 composites. It can be seen that the pure PA6 exhibited a relatively smooth fracture surface with folds, with the edges of folds being relatively smooth. This indicated a typical fractographic feature of brittle fracture behaviour. Compared with the pure PA6, the fracture surfaces of PA6/nano-SiO2 composites showed considerably different fractographic features. Generally, much rougher fracture surfaces can be seen in Fig. 7(B) and Fig. 7(C). The presence of DNS-3 caused more rough folds in the fracture surface, the edges of which were fairly rough; meanwhile, the RNS-A made the fracture surface multilayered, with the breakpoints on the fracture surface uneven and cluttered. Clearly, the observed changes in the fracture surfaces were responsible for the increase in fracture toughness. In particular, the interface interaction between PA6 and nano-SiO2 could be partly reflected by the fracture surface of PA6/nano-SiO2 composites. Fig. 7(C) shows that the fracture surface of the PA6/RNS-A composite was faint and tight, which probably accounted for the stronger interfacial bonding (covalent bonding and hydrogen bonding) between RNS-A and the PA6 matrix; meanwhile, for the fracture surface of PA6/DNS-3 composites, shown in Fig. 7(B), the convex and intensive ridge-like structure can probably be attributed to the strong physical combination (physical entanglement) between DNS-3 and the PA6 matrix.

SEM images of fractured surfaces of (A) PA6, (B) DNS-3/PA6 and (C) RNS-A/PA6 composites
4. Conclusion
PA6/nano-SiO2 composites were prepared by in situ polymerization, in which silica nanoparticles had different surface characteristics. The TEM results showed that both the DNS-3 and RNS-A had a homogeneous dispersion in the PA6 matrix. The microstructures on the silica surface after the removal of PA6 from the nanocomposites were studied by TGA and FTIR, with the results showing that PA6 chains were chemically grafted onto the RNS-A surface, whereas DNS-3 connected with the PA6 matrix by hydrogen bonding. Although two different interfacial structures formed between the nanofillers and the matrix resulted in different mechanical properties of nanocomposites, both DNS-3 and RNS-A were able to strengthen and toughen the PA6 matrix. When the content of DNS-3 was lwt% and 0.2wt%, the tensile strength and impact strength of the composite increased by 34.5% and 12.5%, respectively, while the tensile strength and impact strength of composite increased by 18.2% and 45.7%, respectively, for the composites filled with RNS-A when the silica content was 0.5wt%. Moreover, the composites filled with RNS-A showed better thermal stability than the pure PA6 matrix, while the composites filled with DNS-3 showed no apparent change in thermal stability. In addition, DSC analysis indicated that the incorporation of both DNS-3 and RNS-A had an obvious influence on the non-isothermal crystallization behaviour of PA6. In general, the crystallization rate of the composites was dramatically increased and the crystallinity was improved at a very low filler dosage relative to pure PA6.