
Abstract
An analytical expression of diffraction line profiles of spherical hollow nanocrystals (NCs) is derived. The particular features of the profile lines, enhanced peak tail intensity, are analyzed and discussed as a function of the NC size parameters (outer and inner radius, shell thickness). The explicit formula for the integral breadth, the Fourier particle size, and the Scherrer constants are also obtained and discussed in detail. The diffraction line profiles of hollow CdS NCs of zincblende and wurtzite crystallographic structure are calculated and compared with Debye scattering profiles. The diffraction profiles of both approaches exhibit an enhanced peak tail intensity that can be considered as a fingerprint of the hollow NC structure.
Introduction
Recently, hollow NCs are attracting an increased scientific and technological interest due to their intriguing optical, electronic, electro- and photochemical, and catalytic properties that may find use in potential applications in diverse fields such as nanoscale encapsulation and drug delivery, photocatalysis and plasmon photonics, energy storage (anode material in Li-ion batteries), and nanoreactors. Different synthesis approaches for the fabrication of nanoscale hollow structures are reported: Kirkendall cavitation process, 1 –3 template-free hydrothermal method, 4 template-engaged replacement reactions, 5 galvanic replacement reaction by combining colloidal synthesis and solid state chemistry, 6 aminothermal synthesis, 7 and solvothermal method. 8
By these synthetic routes, metallic (Co, Au, Ag, Pt), 2,5,6 semiconductor compound (CoS, CoSe, CdS, SiAlPO), 2,7 metal oxide (CoO, CuO, TiO2), 2,4,8 and carbon-based 9 hollow NCs were successfully fabricated. However, the crystalline structure may depend on the process parameters yielding either polycrystalline or monocrystalline hollow nanostructures. 3 On the other hand, some synthetic routes 3,5,7 allow a high control of the NC shell thickness by tuning the process parameters properly.
In order to visualize the hollow nanostructure morphology and to determine the microstructural properties (size, shape, crystallinity, etc.), high-resolution transmission electron microscopy techniques (HRTEM, STEM) have been successfully used. 1 –9 However, as for polycrystalline materials, NCs, and colloids, X-ray diffraction methods may also be suitable for the microstructural characterization of hollow NCs.
In fact, X-ray scattering methods are experimental tools frequently used to investigate the structural properties and to determine morphological and structural parameters and to evaluate the ordering and architecture of nanoscale materials. 10 In particular, for nanocrystalline materials, X-ray diffraction is a very powerful and nondestructive evaluation tool that provides useful information for a better comprehension and understanding of the functional properties of nanocrystalline materials and that allows to optimize fabrication processes and synthesis procedures. 11,12
In most cases, the interpretation of the experimental data is achieved only by modeling of the diffraction profiles. Here it is fundamental to use the correct model for the data analysis. The line shape and width (breadth) of the diffraction peaks depend on several parameters and factors like crystallite shape and size, microdefects, strain, and so on. 13 In many cases, nanocrystalline particles exhibit a geometrical structure (shape) that reflects their crystallographic structure; the diffraction line profile and breadth are related to the size and shape of the nanocrystallites. Analytical formulae for some particle shapes (spheres, cubes, cylinders, octahedral, tetrahedra) were found and are frequently used. 14,15
Therefore, X-ray diffraction is a very powerful method in characterizing quantitatively the shape and size of crystalline nanoparticles (nanopowders, colloidal nanoparticles, nanocomposites, etc.), and the microstructural parameters can be extracted from X-ray diffraction line profiles by pattern decomposition that is still a very frequently used data analysis approach. 13,16
In this work, we derive an analytical formula that describes the diffraction (line profile) on hollow spheres, that is, spherical shell NC. In addition, the analytical expressions for integral breadth and Fourier apparent size are derived; as well known, these parameters are usually employed in the pattern decomposition method. 13,16,17 The diffraction line profile features are discussed as a function of the microstructural parameters (size), and the line profile calculated by the analytical kinematical formula is compared with calculations based on the Debye equation.
Diffraction on hollow spherical nanocrystals
Diffraction line profile
The intensity diffraction line profile of a crystallite of dimension D can be expressed as 14,15
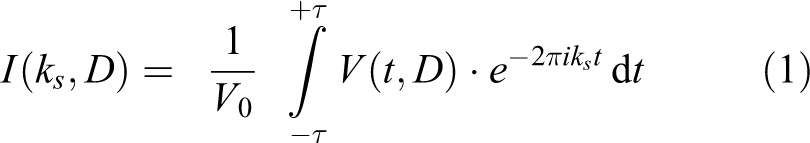
with

where V 0 is the volume of the crystallite. In order to solve equation (1), the volume function V(t, D) must be known.
For spherical shell structures, with internal radius r and outer radius R, first the solution of the volume function V(t, r, R), that is, the common volume function of the shell crystallite and the “ghost” crystallite shifted by distance t parallel to the diffraction vector, has to be found. This function has been derived and is given in Appendix 1. Figure 1 shows the function V(t, r, R) for a spherical shell with R = 15 nm and r = 3, 8, and 13 nm, respectively (for comparison, the function of a full sphere of radius R = 15 nm is also given).
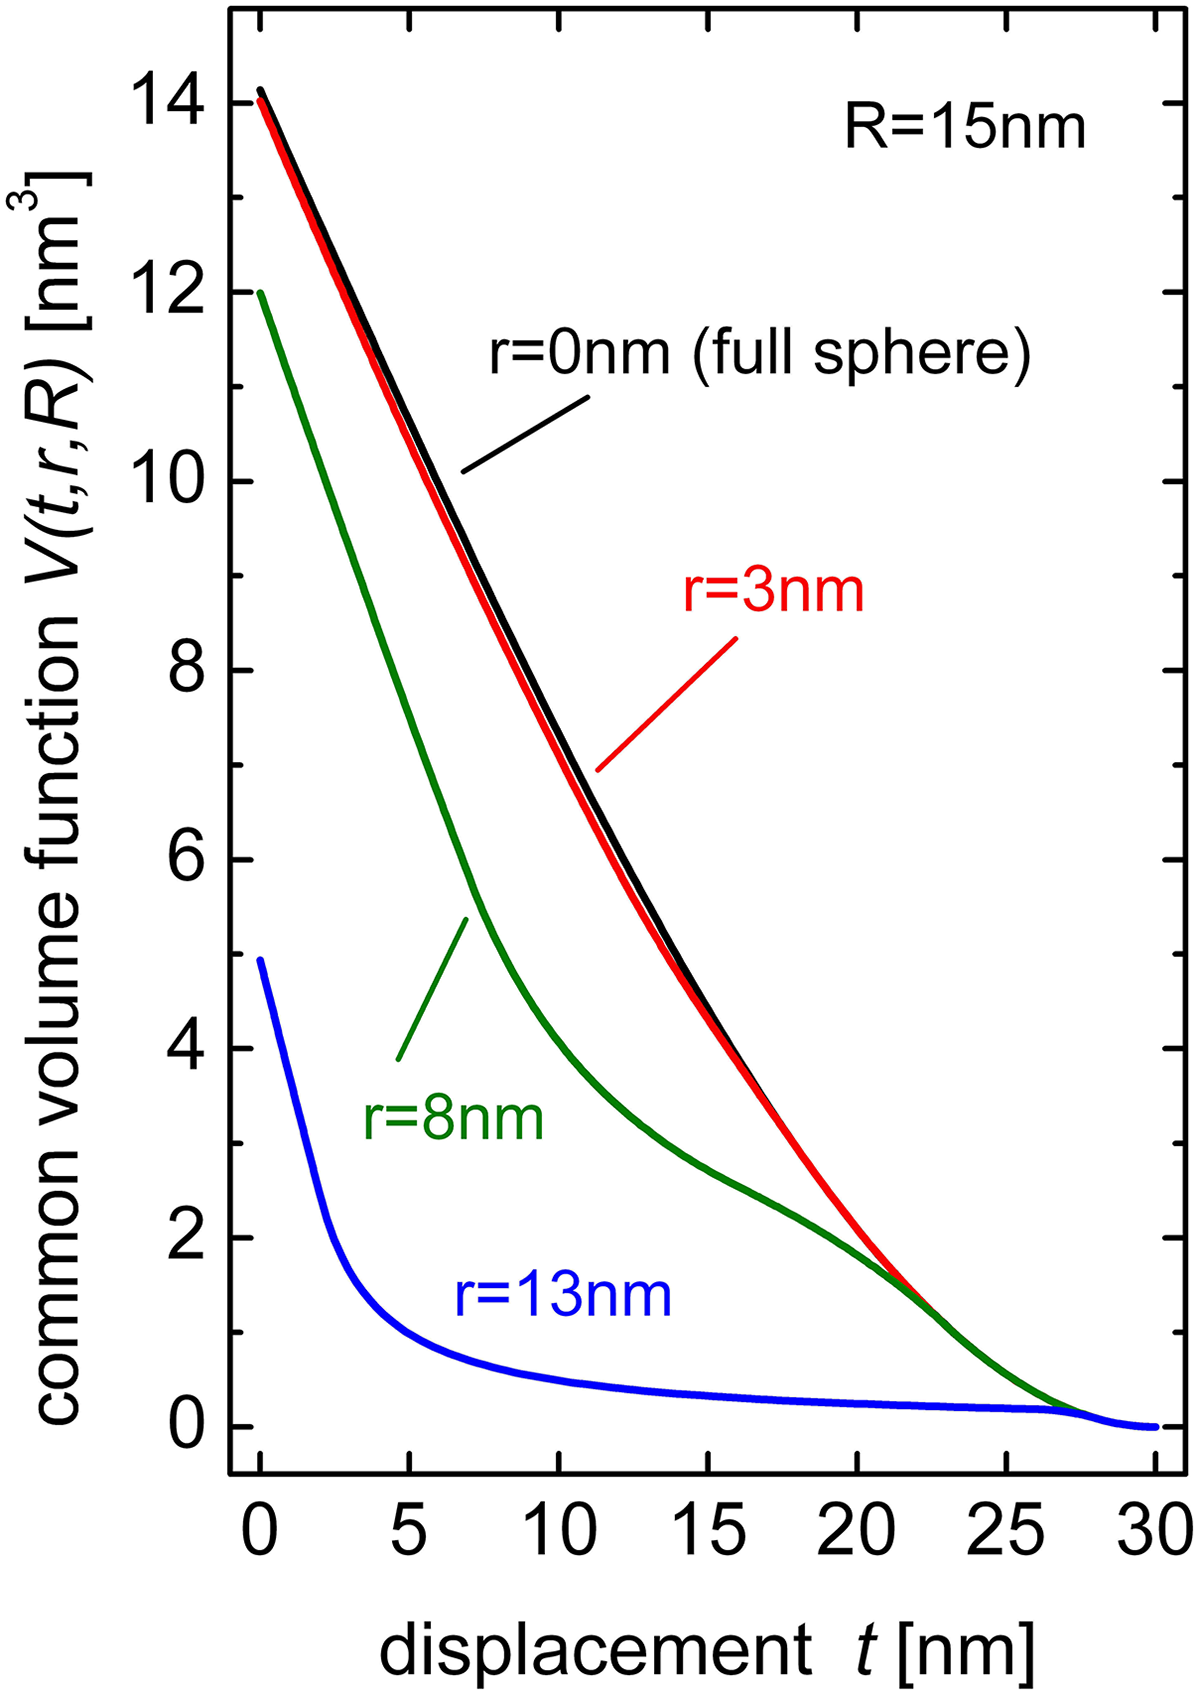
Common volume function V(t, r, R) as a function of the displacement t of a hollow sphere of outer radius R = 15 nm and of different inner radius values r. For comparison, the common volume function of a solid sphere with R = 15 nm is also shown (black line).
As a consequence of diffraction in the far-field approximation, the diffraction intensity profile corresponds to the Fourier transform of the crystallite. It follows that the Fourier transform of a crystallite, V(t, D), represents the crystallite size broadened and shape-dependent line profile.
Generally, the shape of crystalline objects is defined geometrically only by the outer surface. Of course, this is not the case of hollow structures that are geometrically defined by an inner surface too. In the case of spherical crystals, the geometrical shape is defined simply by their inner and outer radius (or diameter). Hence, solving equation (1) for spherical shell structures, with inner radius r and outer radius R, we obtain the normalized peak profile function

where the terms Tj (ks, r, R) are given by


with
The diffraction profile patterns of hollow nanospheres calculated with equation (2) exhibit peculiar features. Figure 2 shows the diffraction line profiles for a hollow nanosphere of outer radius R = 15 nm and different inner radius values r = 3, 8, and 15 nm, for both linear (Figure 2(a)) and logarithmic (Figure 2(b)) scale. For comparison, the diffraction profile of a full sphere with radius R = 15 nm (r = 0 nm) is also shown (black line). No appreciable difference is observed between the diffraction profiles of the full sphere and the hollow sphere with r = 3 nm. However, with increasing inner radius, the maximum peak intensity decreases as expected (decrease of the scattering volume), while the intensity of the tails increases with increasing hole radius. In particular, for hollow spheres of thin shells, a pronounced broadening and tail intensity enhancement is observed. The central peak width remains essentially the same for full and hollow spheres indicating that the main parameter that determines the peak width (FWHM) is the outer radius value R, while the intensity decay of the diffraction peak tails is determined by the inner radius r.

Calculated diffraction profiles of hollow spheres of outer radius R = 15 nm and inner radius r = 3 nm, 8 nm, and 13 nm, respectively (linear (a) and logarithmic scale (b)). The diffraction profile shape changes with the inner radius r. The peak intensity is reduced while the tails are increased in intensity, and in addition the profile shape exhibits characteristic features that became more pronounced for thin shells (greater inner radius). The profiles for r = 0 nm correspond to the full sphere diffraction pattern.
The high frequency intensity oscillations (labeled as “h”) close to the peak maximum are due to the whole dimension of the sphere, that is, the periodicity is related to the outer radius R. In contrast, the low frequency oscillations (labeled as “s”) and their periodicity are related to the inner radius r of the hollow sphere, more precisely the periodicity is related to the shell thickness (R − r). From the experimental point of view, in most cases, it will be difficult to observe the intensity oscillations in the diffraction profile curves. But the low frequency oscillations could be observed experimentally similarly to the oscillations of spherical crystallites.
The development of the diffraction profile pattern as a function of the inner radius r (hole) is shown in Figure 3. The outer radius of the hollow sphere is kept constant at R = 15 nm, while the inner (core) radius values r vary between 0 nm and 13 nm. The diffraction profile patterns are plotted in linear (Figure 3(a)) and logarithmic scale (Figure 3(b)) since some features are more pronounced in the low intensity range, particularly the intensity decay of the intensity tails.
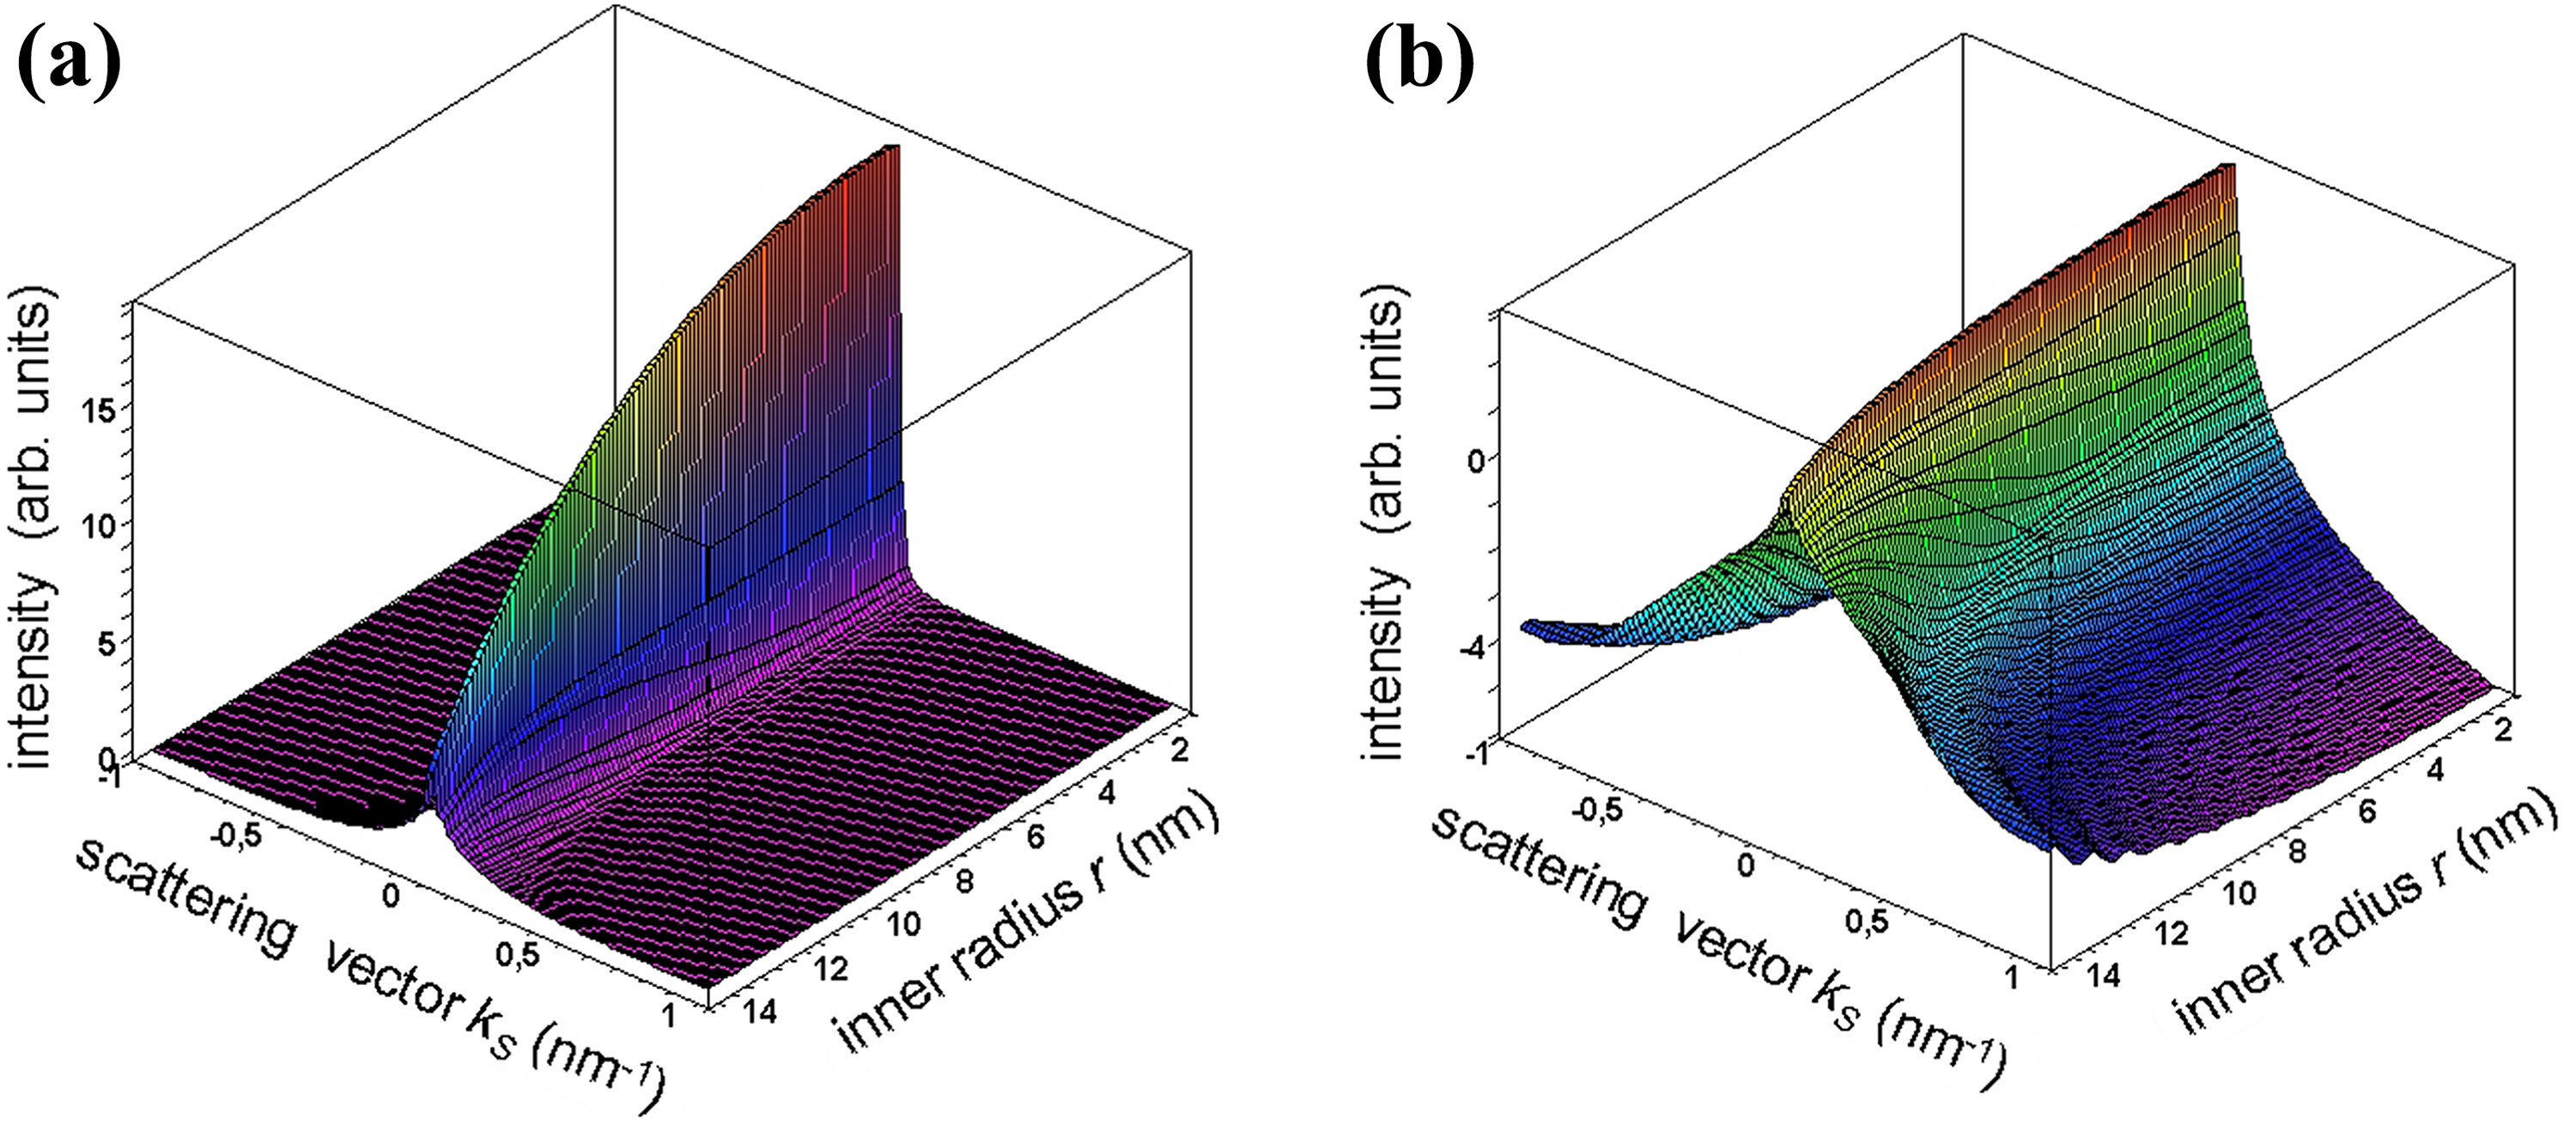
Calculated diffraction profile of a hollow sphere of outer radius R = 15 nm. The diffraction profiles are calculated, in accordance with equation (6), as a function of the inner (core) radius values r that vary between 0 nm and 13 nm. The diffraction profile patterns are plotted in linear (a) and logarithmic scale (b).
Crystallite size definitions (integral breadth and Fourier size)
General considerations
The diffraction line profile and peak width depend on the crystallite size. In general, the peak broadening increases with decreasing crystallite size. Pattern decomposition approaches usually employ the integral breadth as a measure of dispersion of the intensity diffraction profile and is defined as the width of a rectangle having the same area and height as the line profile. 15,18 The integral breadth due to size effect is given by

here, for a spherical shell structure with outer diameter D (=2 R), τ = D. The integral breadth apparent size ∊β
is defined as the reciprocal of the integral breadth, that is,

〈DV 〉 is an “apparent” thickness (volume average thickness) of the crystallite along the diffraction vector direction, that is, perpendicular to the diffraction planes.
Crystallite size broadening can also be described in terms of the Fourier coefficients, A(t) in the range t∈{0,τ}, given as
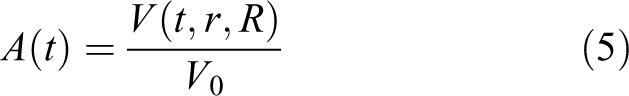
The area-weighted apparent size, or Fourier apparent size, is defined as 15,16

where V 0 /V′(0) is the reciprocal of the initial slope (t = 0) of the Fourier transform of the diffraction line profile (equation (1)). The Fourier apparent size can be interpreted as the total area of projection of unit volume of the crystallites onto the reflection planes, that is, the apparent “thickness” (area-weighted size) of the crystallite in the direction of the diffraction vector. The Fourier apparent size does not represent the physical dimension of the crystallite.
Both quantities, ∊β and ∊κ , are referred to as apparent sizes and are related to the actual physical dimension τ (thickness) of the crystallite along the diffraction vector by the Scherrer constant that must be determined. In general, ∊β and ∊κ are smaller than the actual size τ and are not equal, that is, the ratio ∊β /∊F ≠ 1, but in some cases can be as high as 2 depending on the crystallite shape. 16
It should be also recalled that the second derivative of the Fourier transform V(t, D), namely V″(t, D), is proportional to the distribution of the thickness parallel to the direction of the diffraction vector. 14
Integral breadth and Fourier apparent size of spherical hollow NCs
Considering equations (1) and (A9), the integral breadth apparent size (in reciprocal units) due to size effect of a spherical shell with inner radius r and outer radius R can be determined from equations (4) and (A10) as

From equation (6), the Fourier apparent size of a hollow spherical crystallite can be obtained

Here, it is interesting to note that the equations of the hollow spherical crystallite yield as limiting case for

and
As already mentioned, generally the values of integral breadth ∊β and Fourier apparent size ∊F of a crystallite are not equal and the differences depend also on the crystallite shape. Here, it is interesting to note that the ratio ∊ ratio = ∊β /∊κ of hollow spheres depends strongly on the ratio between inner and outer radius (r/R) and the difference between the area-weighted (∊κ ) and volume-weighted (∊β ) apparent sizes is particularly pronounced for hollow spheres of very thin shells. Figure 4 shows the ratio ∊ ratio of the integral breadth ∊β and Fourier apparent size ∊κ of the hollow sphere parameters as calculated by equations (7) and (8) and used in Figure 5(a) and (b).

Ratio ∊ ratio of the integral breadth ∊β and Fourier apparent size ∊κ of the hollow sphere with the same parameters used in Figure 5.

The integral breadth ∊β (a) and Fourier apparent size ∊κ (b) of a hollow sphere dependence on the outer radius R (range: 13–15 nm) and inner radius r (range: 0–13 nm).
Scherrer constants of spherical hollow NCs
The “true” size p, defined as the cube root of the mean crystallite volume (
Nevertheless, in the following, we report the analytical expressions for the Scherrer constants obtained by the procedure described in 15

and

These expressions are very complex if compared to the Scherrer constants of other crystallites of various shape and depend on crystallite size parameters (here, r and R), similarly to rectangular parallelepiped,
15
cylindrical,
17
and hexagonal
19
crystallites. It can be easily verified that for r = 0 (full spherical NC), the Scherrer constants Kβ
and Kκ
in equations (11) and (12) take the known expressions
Diffraction intensity profiles: A comparison with Debye diffraction
For a comparison of diffraction intensity profiles and powder patterns, we consider a CdS spherical shell NCs of both zincblende (zb) and wurtzite (w) crystallographic structure. Figure 6 shows a schematic representation of the hollow zb and w CdS NCs.
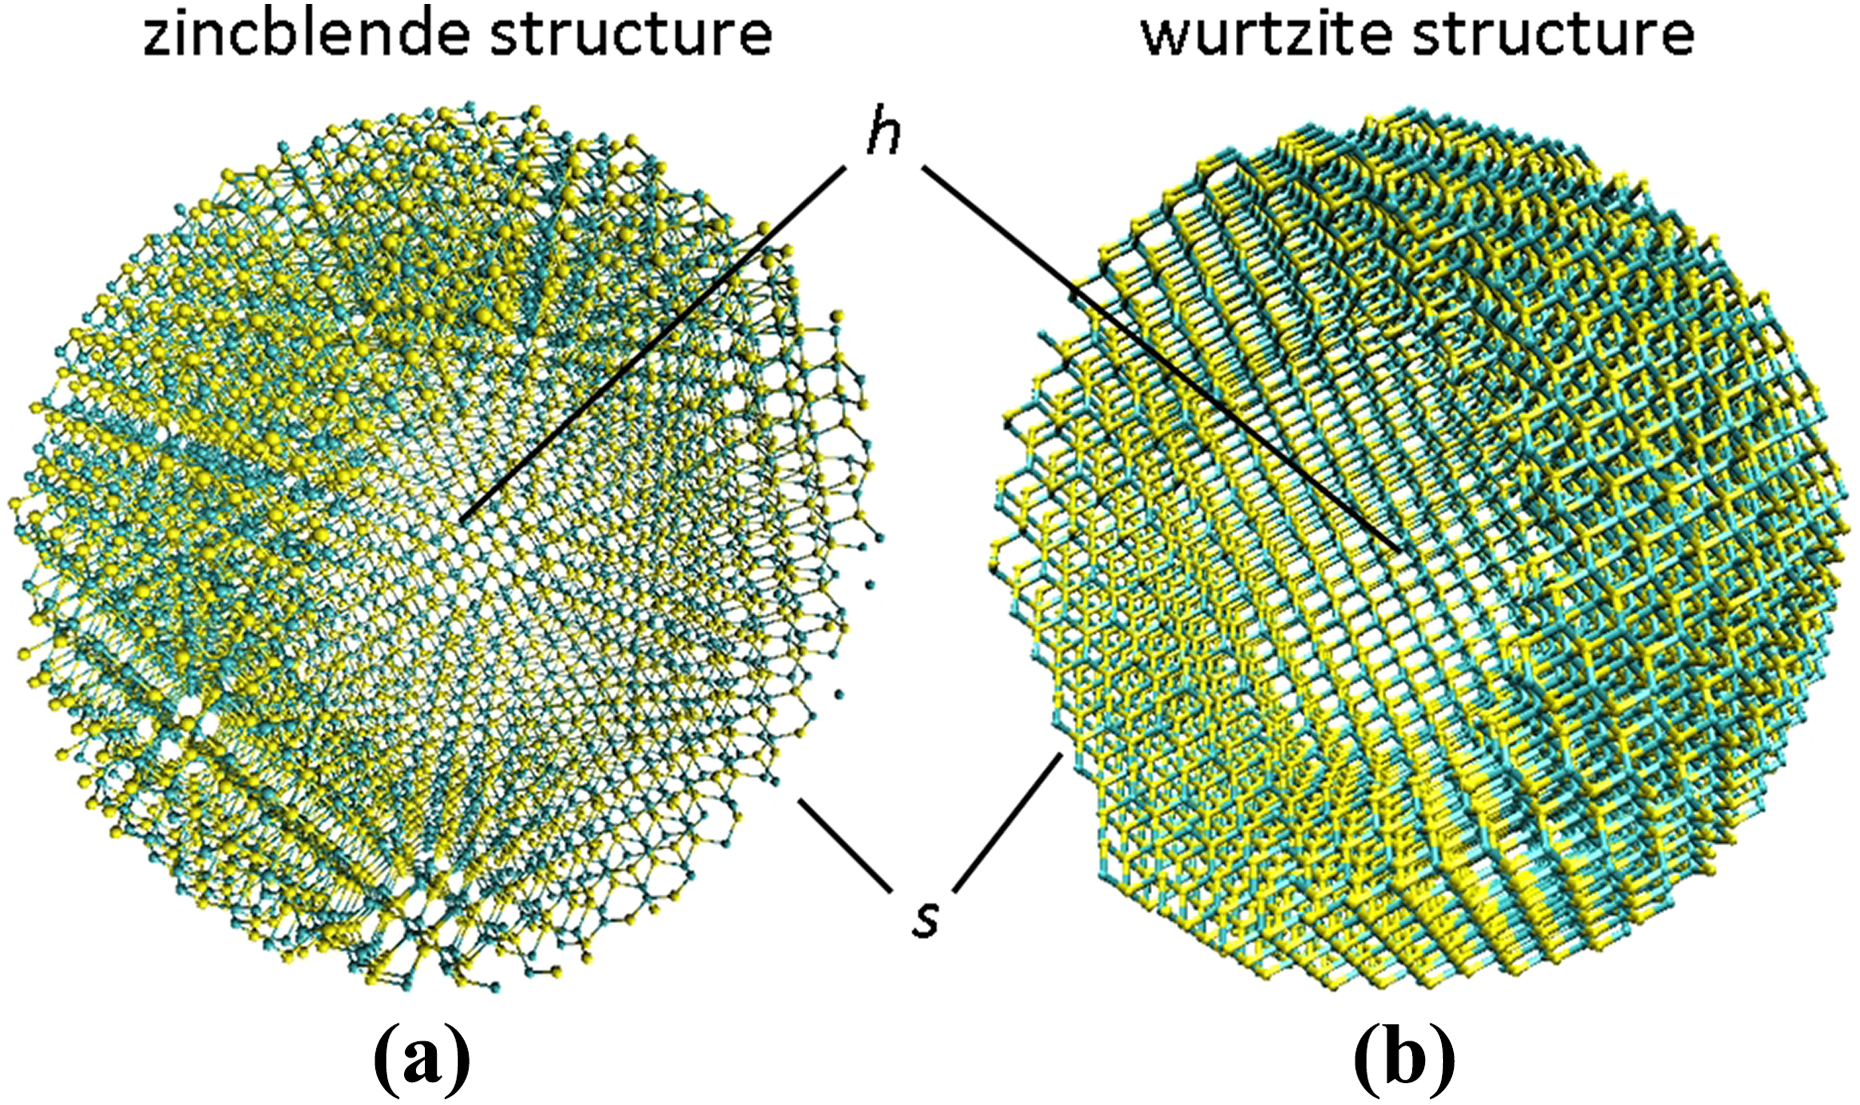
Constructed CdS hollow NC of zb (a) and w structure (b) used for the Debye diffraction calculation; Cd and S atoms are in blue and yellow color, respectively. Here, for a better visualization of the hollow structure (labeled h) of the CdS NCs, part of the shells are removed (labeled s). zb: zincblende; w: wurtzite.
The whole diffraction pattern (powder pattern) that includes all the (hkl) diffraction peaks can be written, considering equation (2), as

where Fhkl and mhkl are, respectively, the structure and multiplicity factors of the hkl reflection. L contains the Lorentz and polarization factors.
For small crystal structures, the calculation of the intensity I(s), with the scattering vector

where

with the corresponding coefficients ai , bi , and c for Cd and S atoms, respectively.
First, in order to calculate the Debye diffraction pattern (equation (14)), unrelaxed spherical CdS clusters with zb and w phase were built (Figure 6) 24 ; a first cutoff radius R from the center of the crystal defines the external size whereas a second cutoff radius r corresponds to the internal radius of the hollow cluster. For the spherical NCs of both the crystallographic structures, an outer radius R = 3.60 nm has been considered, while an inner radius of r = 2.00 nm and r = 1.95 nm for the zb and w crystallographic structure, respectively, is considered in order to fulfill the requirements to have a hollow NC constituted by an integer number of atoms.
The whole (powder) diffraction patterns in the range of k = 13 nm−1 and 52 nm−1 of a hollow w CdS NC calculated by the Debye scattering equation (curve A) and equation (13) (curve B) are shown in Figure 7 The Miller indices of the diffraction peaks are reported in correspondence of curve B. The diffraction peak positions and relative intensity ratios in curve B are in accordance with the data of ICCD n.80-0006 25 of bulk w CdS. For some diffraction peaks, particularly for (100), (110), (112), and (211), the Debye scattering pattern shows a noticeable discrepancy in the relative intensity ratios.

Whole diffraction patterns of hollow CdS NC of w structure calculated with the Debye scattering formula (A) and equation (13) of this work (B). w: wurtzite.
Similarly, the diffraction patterns of hollow zb CdS NC (Figure 8) also show a discrepancy of relative intensity ratios between Debye scattering (curve A in Figure 8) and the scattering curve calculated by equation (13) (curve B in Figure 8). Also here, the diffraction peak positions and relative intensity ratios of curve B are in good agreement with the data of ICDD n.80-0019 25 of bulk zb CdS.
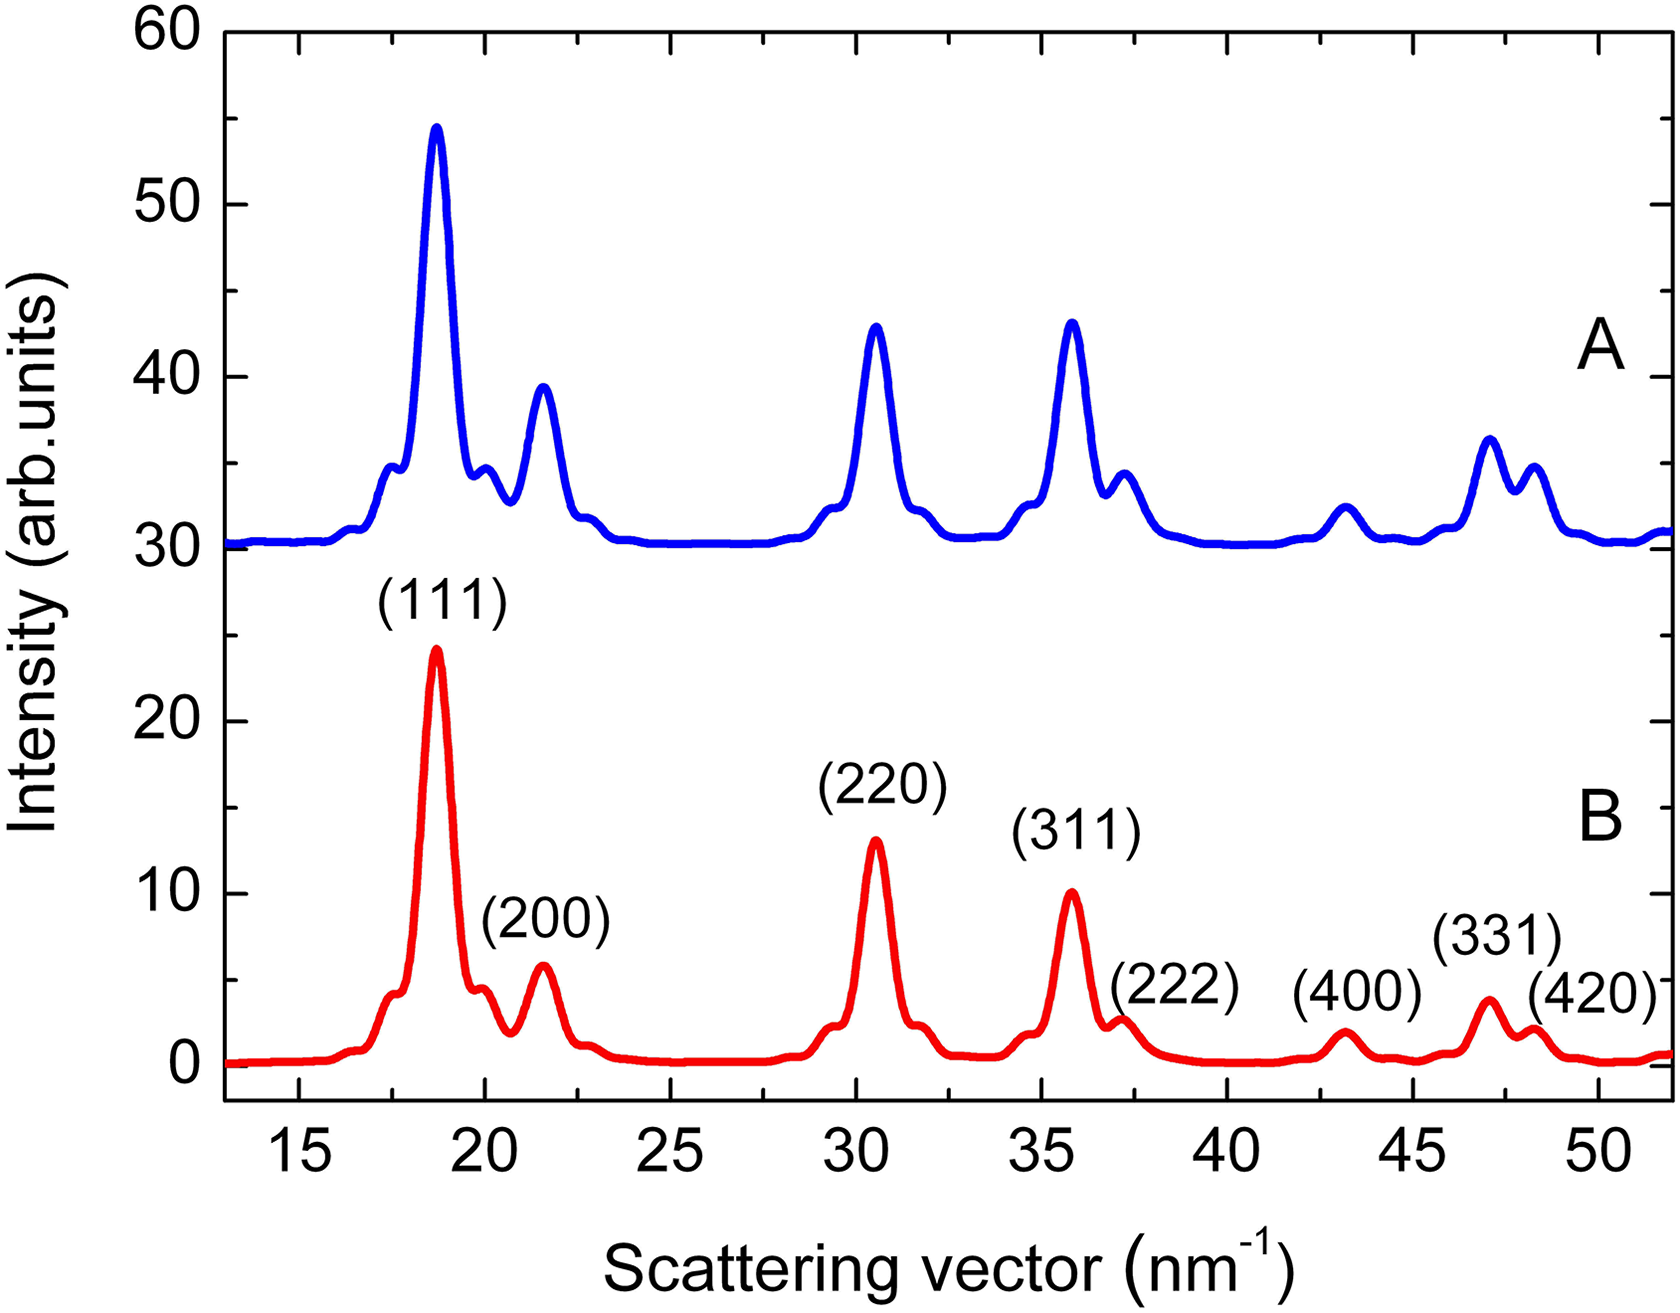
Whole diffraction patterns of hollow CdS NC of zb structure calculated with the Debye scattering formula (A) and equation (13) of this work (B). zb: zincblende.
The intensity ratio differences may be related to the fact that Debye scattering considers the real atomic ordering and configuration on the NC surface (in the case of hollow nanocrystals, also the interior surface must be taken into account). On the contrary, the approach used for deriving equation (13) considers the structure factor of the crystallographic unit cell and the specific form factor of the NC; the structure factor is “smeared out homogeneously” over the whole nanocrystal structure and surface effects cannot be taken into account. Similar observations are reported in literature also for full NCs and are particularly noticeable for small-sized NCs (<10 nm), 26 –29 for larger sized NC structures this effect may become negligible.
The most striking features in the diffraction patterns of Figures 8 and 9 are the observed intensity modulations at the peak tails (tail intensity enhancement) that are particularly observable at “isolated” diffraction peaks. The tail intensity enhancement, as discussed above and shown in Figure 2, is a fingerprint of line diffraction profiles of hollow NCs. Figure 9(a) shows the diffraction line profiles of the (220) peak in Figure 8 for the Debye scattering (blue solid line) and the model of this work, equation (13), (red circles). A perfect correspondence of the line profiles is observed. The enhanced tail intensity on both sides of the peak is well pronounced and is notably evident if compared with the diffraction line profile of full NCs (Figure 9(b)) calculated with both approaches by taking r = 0 nm.

Conclusions
An analytical expression of the diffraction line profile of spherical hollow NCs, with outer and inner radius R and r, respectively, has been derived using Wilson’s approach. In addition, formulae for the integral breadth and Fourier particle size and the Scherrer constants are derived. For r = 0, all the formulae lead to the known expressions of full spherical NCs and are discussed as a function of the geometrical (size) parameters.
The diffraction line profiles of spherical hollow NCs exhibit an enhanced intensity at the tails of the diffraction peaks that can be considered as a fingerprint of the hollow nanostructure. For comparison, the diffraction profiles of spherical hollow CdS NCs of zb and w crystallographic structure were compared with the diffraction curves calculated using the Debye scattering equation. Generally, a good correspondence and the same features of enhanced peak tail intensity were observed; differences of some peak intensity ratios (more pronounced at very small particle size <10 nm) are interpreted as a consequence of the atomic ordering and configuration at NC surface that is better and more realistically described in Debye scattering. The analytical expressions derived could be helpful for correct interpretation and quantitative analysis of diffraction data of hollow NCstructures of particle size in the range between 10 nm and 100 nm.
Footnotes
Acknowledgement
The Debye scattering computations were performed by using the CRESCO (Computational RESearch centre on COmplex systems)/ENEAGRID High Performance Computing infrastructure (G. Ponti et al. Proc.Int.Conf. on HPCS 2014, art.no. 6903807, pp. 1030-1033), funded by ENEA and by Italian and European research programmes.
Declaration of conflicting interests
The author(s) declared no potential conflicts of interest with respect to the research, authorship, and/or publication of this article.
Funding
The author(s) received no financial support for the research, authorship, and/or publication of this article.