
Abstract
Cadmium sulfur nanocrystals doped with the rare earth ion Tb3+ were synthesized using an easy aqueous method. Powder X-ray diffraction was used for the crystallography analysis of the nanocrystals. Results showed that cadmium sulfur: Tb3+ quantum dots had a cubic crystal structure. Effects of the pH of the original solution and Tb3+-dopant amount on luminescence properties of cadmium sulfur quantum dots were also systematically investigated. The luminescence properties of cadmium sulfur quantum dots were further improved using an appropriate Tb3+-dopant amount.
Introduction
Semiconductor nanocrystals (NCs), also referred as quantum dots (QDs), demonstrate a great potential for future applications, such as in biotechnology, photovoltaic devices, and solar cell devices, owing to their unique optical properties. 1 –5 Cadmium sulfur (CdS) is one of the most important groups II–VI NC semiconductors and displays a wide direct band gap (2.42 eV) and small Bohr exciton radius (about 2.5 nm). 6 Various methods were developed to prepare CdS NCs. These methods can be broadly divided into two groups: one is organic synthetic methods and the other is aqueous synthesis methods, which involve the use of different thiols as stabilizing agents in aqueous solution. Compared with the organic synthetic methods, the aqueous synthesis methods are advantageous owing to its being simple, green, and highly reproducible, and its products exhibit good water solubility, stability, and biological compatibility. 7 –9 The properties of QDs can be further adjusted, for instance, by doping impurity atoms in the NCs, the range of tunable fluorescence can be expanded, the stability of QDs can be improved, and magnetic properties can be introduced. 10 –12 Daocheng’s group synthesized Cu+- and Ag+-doped ZnxCd1−xS/ZnS QDs through an easy and green method using hydrophilic glutathione as capping agent. The as-prepared Cu+- and Ag+-doped ZnxCd1-xS/ZnS core–shell QDs exhibit tunable emission covering the entire visible light region, expanding the range of tunable fluorescence. 13 To date, a variety of transition-metal and lanthanide ions, including Mn2+, Cu2+, Ag+, Pb2+, Eu3+, Gd3+, and Er3+, have been doped into groups II–VI QDs. 14 –20
In this study, we proposed a simple method for the synthesis of CdS:Tb3+ QDs by simply mixing a Cd precursor, Tb precursor, thioglycollic acid (TGA), and an S precursor prior to refluxing. All of the synthetic procedures were conducted in the open air at 100°C. CdS:Tb3+ QDs exhibiting different compositions were obtained by tuning the Tb3+-dopant amount in the precursor solution. In addition, the effects of pH on the luminescence properties were systematically investigated.
Materials and methods
Synthesis of CdS:Tb3+ QDs
CdS QDs doped with the rare earth (RE) ion Tb3+ were synthesized through a one-step process in aqueous solution containing sodium sulfide (Na2S), Tb(NO3)3, and CdCl2·2.5H2O as precursors. TGA (0.3 mL) was added into the mixture (100 mL) of CdCl2·2.5H2O solution (0.02 M, 96–100 mL) and Tb(NO3)3 (0.02 M, 0–4 mL) under stirring. The solution was subsequently adjusted to pH 9 by dropwise addition of 1 mol/L sodium hydroxide solution. Na2S was added into the original solution, stirred, and then heated to 100°C. CdS:Tb3+ QDs of varying compositions were synthesized by controlling the Tb3+-dopant amount. The CdS QDs without RE were synthesized using the methods described earlier; however, the CdCl2·2.5H2O precursor was increased to 100 mL.
Characterization
Ultraviolet–visible absorption and photoluminescence (PL) spectra were measured using an Agilent Technologies Cary 5000 spectrophotometer (Santa Clara, California, USA) and a HORIBA JY FluoroMax-4 fluorescence spectrophotometer (France) with an xenon lamp as the excitation source, respectively. The PL quantum yield (QY) was determined using rhodamine 6G as reference. X-ray diffraction (XRD) analysis was performed using Rigaku/Dmax-2500 (Japan; Cu K α = 1.5406 Å). The morphologies of the samples were observed under a JEOL-2010 high-resolution transmission electron microscope (HRTEM; JEOL, Philips, the Netherlands).
Results and discussion
The composition of CdS:Tb3+ QDs mainly depends on Tb3+-dopant amount in the precursor solution. Hence, the effect of Tb3+-dopant amount on the optical properties of CdS:Tb3+ QDs was investigated. Figure 1(a) and (b) shows the PL emission and absorption spectra of a series of CdS:Tb3+ QDs with different doping amount and prepared in aqueous phase. Moreover, the corresponding PL QYs were determined with rhodamine 6G as reference (QYs = 0.95; Figure 1(c)). The reflux time is 3 h and the temperature of the system is maintained at 100°C. An evident blueshift was observed in the maximum emission peak as the Tb3+ ions complexed with the CdS QDs. In addition, with increased Tb3+-dopant amount from 1 mol% to 2 mol%, the PL intensity of CdS:Tb3+ QDs gradually increased. When Tb3+-dopant amount was higher than 4 mol%, PL intensity decreased. The absorption spectra indicate that CdS and CdS:Tb3+ QDs have a wide absorption range. Compared with CdS QDs, an small redshift was observed in the absorption spectra. The QYs of CdS:Tb3+ QDs initially increased and then decreased with increasing Tb ion amount. The maximum QY of 10.46% was obtained when the amount of Tb ions reached 2 mol%.

Effect of Tb3+ ion dopant amount on the PL (a) and absorption spectra (b), the corresponding QYs, and(c) of CdS:Tb3+ QDs. PL: photoluminescence; QYs: quantum yields; QDs: quantum dots; CdS: cadmium sulfur.
In the aqueous method, the formation of Cd-thiol complexes strongly depends on the pH of solution. 21 Hence, the pH of the original solution was adjusted to 8, 9, 10, and 11 in our experiment. The effect of pH of the original solution on the optical properties of CdS:Tb3+ QDs was subsequently investigated. The maximum emission peak of CdS:Tb3+ exhibited an evident redshift from 511 nm to 584 nm with the increase in pH from 8.0 to 11.0 (Figure 2(a)). Figure 2(b) shows the corresponding PL QYs. Compared with the CdS:Tb3+ QDs obtained under the aforementioned pH, the CdS:Tb3+ QDs prepared at pH 9 demonstrated a high PL QY.

Effect of pH on the PL (a) and the corresponding QYs (b) of CdS:Tb3+ QDs. PL: photoluminescence; QYs: quantum yields; QDs: quantum dots; CdS: cadmium sulfur.
The crystalline structure of CdS and a series of CdS:Tb3+ QDs was examined by XRD, as shown in Figure 3. The XRD patterns show that the position of the XRD peaks matches well with those of the cubic crystal structure of bulk CdS Joint Committee on Powder Diffraction Standards (JCPDS, No. 65-2887), and the doped Tb3+ ion have no obvious influence on the host structure. The three typical distinct peaks can be readily assigned to the (111), (220), and (311) planes, respectively. These peaks are broadened because of finite crystalline size. The particle size was estimated using the full width at half maximum (FWHM) of the characteristic peak (111) via the Debye–Scherrer formula 22

where D is the grain size, k is a constant (0.89), β is the FWHM of the respective diffraction peak, and θ is the angle of diffraction for the (111) plane, respectively. The estimated diameter of the CdS:Tb3+ QDs (Tb3+: 2 mol%) is about 2.33 nm.
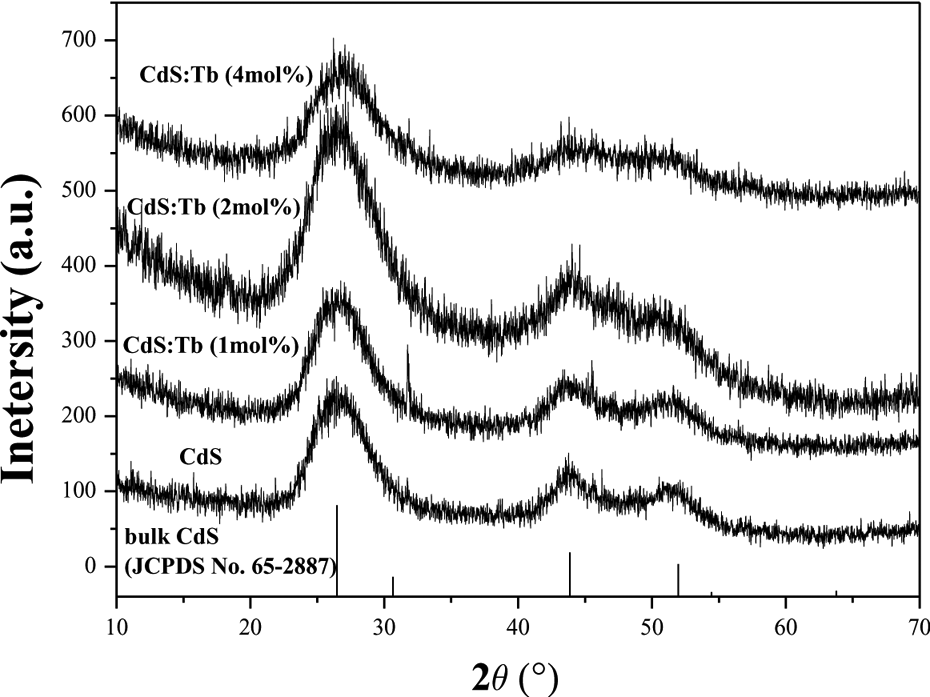
XRD pattern of CdS:Tb3+ QDs. XRD: X-ray diffraction; CdS: cadmium sulfur; QDs: quantum dots.
The HRTEM images of the as-prepared CdS:Tb3+ QDs were also measured, and the results are shown in Figure 4. It can be seen that the CdS:Tb3+ QDs appeared as spherical morphology with an average diameter of approximately 2.5 nm, which is basically in agreement with that calculated from the XRD. In addition, the lattice fringes of an individual particle indicate a well-ordered crystal structure of the CdS:Tb3+ QDs. The lattice spacing was 0.335 nm corresponding to atomic planes along the [1 1 1] lattice plane direction of the cubic CdS.
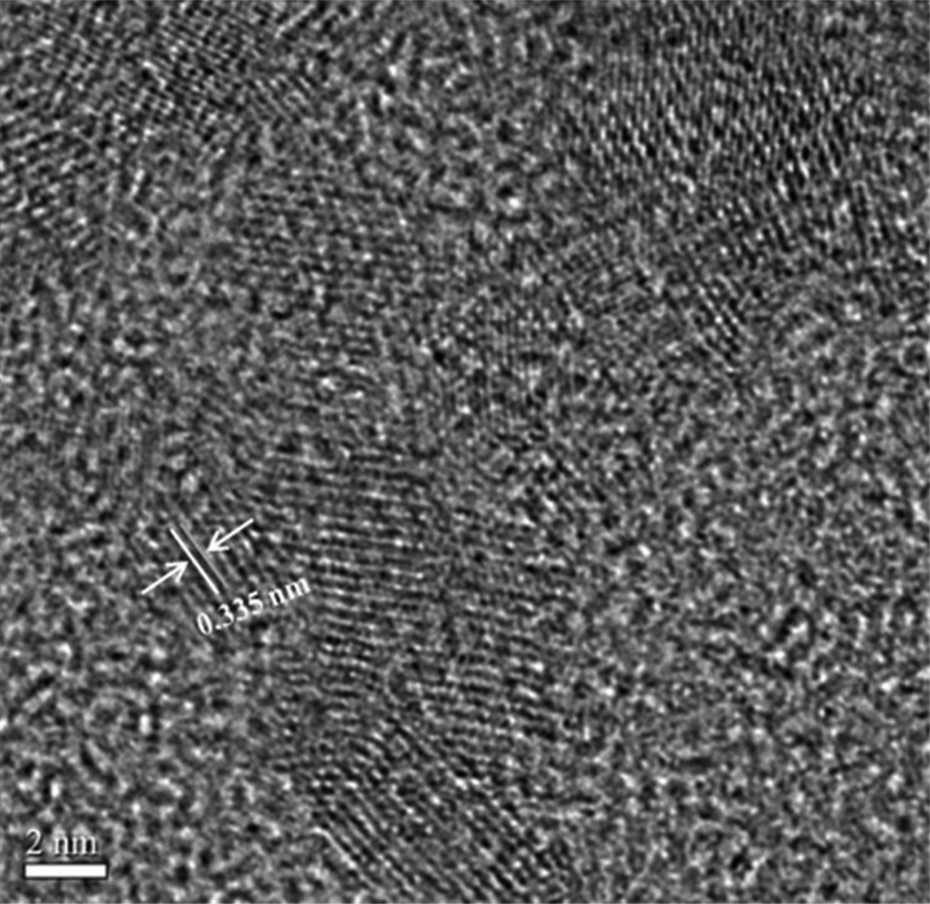
HRTEM images of CdS:Tb3+ QDs. HRTEM: high-resolution transmission electron microscope; CdS: cadmium sulfur; QDs: quantum dots.
Conclusion
We successfully doped CdS QDs with the RE ion Tb3+ through a green and easy method using TGA as capping agent. The QY of the cubic crystal structure CdS:Tb3+ QDs reached 10.46% at a Tb3+-dopant amount of 2 mol% and pH 9. The luminescence properties of CdS QDs can be improved using the appropriate Tb3+-dopant amount.
Footnotes
Declaration of conflicting interests
The author(s) declared no potential conflicts of interest with respect to the research, authorship, and/or publication of this article.
Funding
The author(s) disclosed receipt of the following financial support for the research, authorship, and/or publication of this article: This work was supported by grants from the Guangxi Natural Science Foundation (2015GXNSFBA139043); Yulin Normal University Research Grant (2016YJKY15); the PhD research startup foundation of Yulin Normal University (G20140011).