
Abstract
This research aims to explore the influential factors that promote and impede Chinese customers’ adoption intention of electric vehicles (EVs). An extended version of the Unified Theory of Acceptance and Use of Technology (UTAUT) was developed to gauge customers’ willingness to adopt EVs. 348 responses and structural equation modelling were employed for analysis. This paper contributes to this research area mainly through two aspects: First of all, it provides more robust evidence of the positive moderating effects on price value since few research studies on it. Secondly, the positive moderating effects of facilitating conditions between perceived risk and adoption intention of EVs were found for the first time, which fills the gap in this research area. Except these, the results also showed that performance expectations, social influence, and price value positively influence EV adoption intention, while perceived risk has a negative impact. Additionally, age and gender were found to significantly moderate adoption intention. These findings offer insights for policymakers to craft more effective policies, ultimately advancing sustainability and accelerating the achievement of long-term carbon neutrality goals.
Keywords
Introduction
By 2030, the transportation sector is forecasted to be using roughly a fifth of the world’s energy resources and produce over a quarter of the world’s energy-related carbon emissions. 1 This trend is due to the fact that citizens globally tend to consume fossil fuels to power their automobiles since fossil fuels are both cheap and easily accessible. 2 The excessive use of fossil fuels does, however, result in substantial greenhouse gas emissions which accelerate global climate change, which is undoubtedly one of humanity’s most serious obstacles. 2 The European Environment Agency posits that road transportation represents the largest proportional contributor to gas emissions and was responsible for 72% of the total greenhouse gas emissions of both international and domestic transportation in 2019. 3 Greenhouse gas emissions from the transportation sector are one of the main hindrances in attaining sustainable economic systems. 4 Developing transportation with low carbon emissions (e.g., automobile decarbonisation) is both pertinent and crucial to achieving sustainable development goals on a global scale. 5 In terms of transportation, electric vehicles (EVs) are an ideal substitute for internal combustion engines (ICEs) and are deemed a key technological innovation.6,7 EVs draw power from batteries and electric motors which do not generate greenhouse gases as fuel engines do. 8 EVs are also more energy efficient than ICEs. 9 Green energy sources (i.e., wind, solar, and hydroelectric energy) can be utilised to charge the batteries of EVs. 9 The widespread adoption of EVs can therefore significantly decrease greenhouse gas emissions and reduce reliance on fossil fuels.
Since EVs play a key role in reducing environmental damage, various national governments have enacted incentives to support the widespread market adoption of EVs. 3 For instance, the South Korean government has implemented incentive policies and built EV-ready infrastructure to boost the total market share of EVs to 6.13% before the year 2025. 8 Simultaneously, China and the United States have both removed taxation on EV purchases and actively encourage the purchase of EVs by offering financial subsidies to consumers.10,11 European nations including Germany, France, and the Netherlands have announced the goal of a total market shift towards EVs by the year 2040. By 2025, Norway plans to have completely transitioned to electric and plug-in hybrid vehicles. 12
Over recent years, the global demand for EVs has steadily increased. The Global EV Outlook report (see Figure 1) indicates that, by the end of 2022, 26 million EVs had been sold globally – 60% more than in 2021.
13
Also, EV sales and global stock in 2022 have a similar annual growth rate as in 2021 and 2015-2018 period, demonstrating the robust recovery to the pre-pandemic pace of EV market expansion.
13
Many companies are presently entering the EV market and developing their own proprietary EV technologies. For example, the Ford Fusion Energy, Renault Zoe, and the Tesla Model S are currently the top products in the global EV market.
14
With a particular emphasis on light-duty vehicles (LDVs), most producers of EVs are planning to broaden their model ranges in the coming decades.
13
Projections suggest that the total number of LDVs manufactured will exceed 20 million by 2025 and 40 million by 2030.
13
Global EV stock, 2010-2022 (Source: IEA, 2023).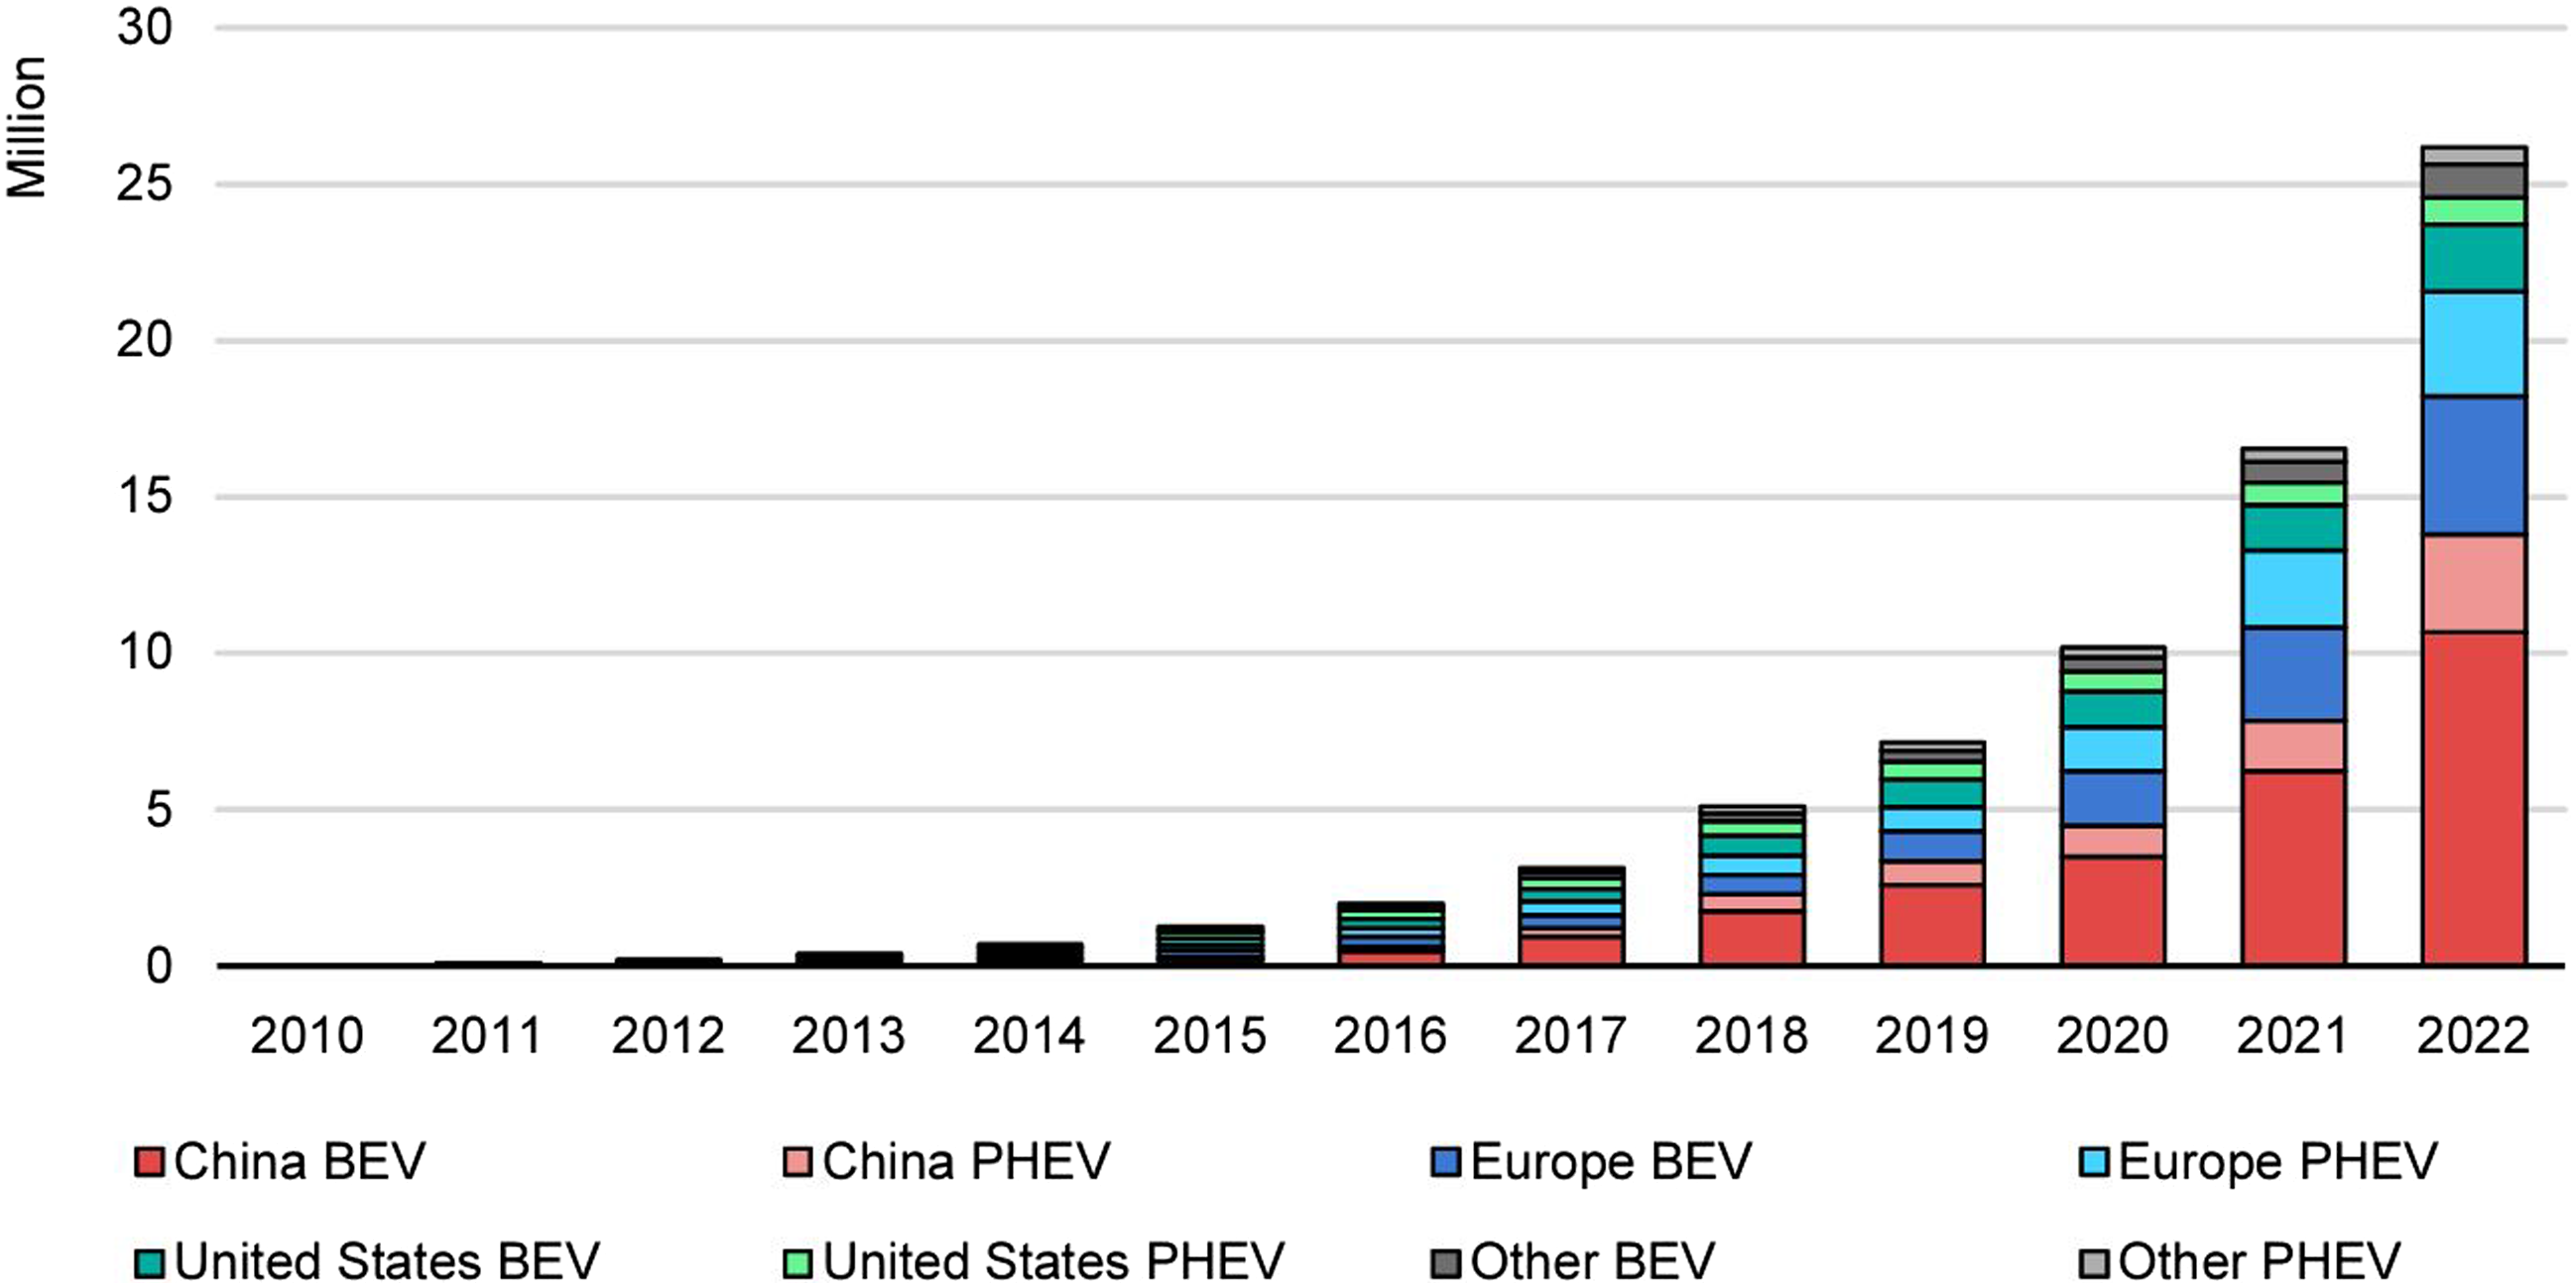
China has the largest EV market in the world, particularly in the public transportation industry, where electric buses have mostly replaced oil-fired buses. 15 The number of new EV registrations in China reached 6.9 million in 2022, ranking it first globally for 8 years in a row. 16 In the future of 2030, China plans to achieve about 45% sales shares of EVs across all road transport segments, which to support China’s long-term carbon neutrality target. 3 However, Chinese customers still have many concerns since EV sales only account for 16% of domestic sales in 2021, which is still quite low. 13 The reason may include the worse performance of ICVs, such as speed and travel range. 17 Meanwhile, the convenience of charging for EVs is also always doubted for customers. 18 Robust charging conditions can positively and directly increase the perception of buying EVs. 19 Other factors, including government policy, and reasonable price, can also benefit the adoption intention of EVs. 19 Therefore, this study aims to investigate the effects of UTAUT factors with perceived risk, price value and policy incentives on the adoption intention of EVs in China. The quantitative online survey is used to collect the perception of EVs among Chinese customers. After that, 348 responses are analysed by structural equation modelling. In this study, the positive moderating effect of facilitating conditions between perceived risk and adoption intention of EVs is found for the first time and fills the gap in this research field. The rest of the study is structured as follows: literature review and hypothesis development, research design, results, discussion and implications, and conclusion and future research.
Literature review and hypothesis development
The Unified Theory of Acceptance and Use of Technology (UTAUT) model was developed by Venkatesh et al to evaluate the acceptance of newly-introduced innovations or technologies. 20 They integrated eight theories and models, including the Theory of Reason Action (TRA), the Technology acceptance model (TAM), the Motivational model (MM), the Theory of planned behaviour, combined TAM and TPB (C-TAM-TPB), the Model of PC Utilization (MPCU), Innovation Diffusion Theory (IDT) and Social Cognitive Theory (SCT), and finally refined four determinants which directly influence behaviour and behavioural intention, named social influence, effort expectancy, facilitating conditions, and performance expectancy. 20 This paper chose to establish the research model based on the UTAUT model rather than the Technology Acceptance Model (TAM) which was created by Davis and Bagozzi 21 and also broadly used due to the following reasons: (i) In the aspect of validity, the UTAUT performed significantly better than each of the eight individual models with a 70% variance toward the intention, but the TAM typically accounts for about 40%.20–22 (ii) The TAM neglects the effects of group, culture and society since a person acting individually is not the best way to describe most human behaviour.23,24 This point of view is also supported by Zhang et al., who extended TAM to investigate the acceptance of automation vehicles for 647 Chinese drivers and found social influence contributed the most compared to other constructs. 25 However, the UTAUT model compensates for the lack of social influencing factors in the TAM. (iii) Many articles also have proved the advantages of the UTAUT compared with the TAM. For example, Ling et al chose to apply the UTAUT model to find the determinants of computer usage after comparing these two models through reliability, model, measures, validity and focus. 26 Rejali et al applied the TAM, UTAUT and TAM to assess a priori acceptance of fully automated vehicles. 27 They found the UTAUT may be the best-performing model for practical purposes (i.e. focusing on function, efficiency and usefulness) although the model is relatively complex.27,28
Furthermore, other researchers have studied customers’ behavioural intentions regarding EVs using this theory, concluding that the model’s predictive accuracy can be greatly enhanced by including more contextual variables.29,30 For instance, Khazaei 31 studied intentions around EV adoption by expanding the UTAUT model to include the variables of price value and personal innovation. Abbasi et al extended the UTAUT model using an additional variable, namely, perceived environmental knowledge, to evaluate EV purchasing intention. 32 Jain, Bhaskar and Jain investigated the moderating effects of the UTAUT model on various governments’ levels of environmental awareness. 33 Khazaei and Tareq also studied the moderating effect of the UTAUT model of driving experience for personal innovation in the acceptance of EVs. 34 Based on these previous studies, this paper proposes a research model based on the UTAUT model expanded with three added variables, namely, price value, perceived risk, and policy incentives, to evaluate the way that consumers currently perceive EVs.
Perceived risk
Dunn et al defined perceived risk as consumers’ expected negative utility with purchasing a particular product or service. 35 In this paper, ‘perceived risk’ constitutes consumers’ expectations regarding the negative utility of using EVs. 35 Wang et al posited that perceived risk associated with EVs is categorizable according to five criteria, namely, time risk, economic risk, performance risk, psychological risk, and physical risk. Doubts around the effective functioning of EVs constitute ‘performance risk’. 36 The performance metrics of EVs (i.e., acceleration speed, travel range, and charging methods) are lower overall compared to ICVs.2,17 Consumers may need to spend more time and effort locating charging stations and charging their vehicles since EV charging stations are still moderately scarce.11,37 Time risk is therefore a significant factor to be taken into consideration. Safety and reliability problems (including physical risk) may exist due to the relative immaturity of EV technology.38,39 Financial risk results from the high prices of purchasing EVs and replacing their batteries which increases consumers’ total expenses.40,41
Based on the above discussion, this paper’s first hypothesis is as follows:
Perceived risk negatively affects customers’ adoption intention of EVs.
Effort expectancy
‘Expectation of effort’ is constituted by the level of difficulty or ease related to the utilisation of a given product or system. 20 This explanation aligns with ‘perceived ease of use,’ i.e., the extent to which people can utilise a given technology without an excessive amount of effort (Davis, 1989). In this paper, ‘expectation of effort’ refers to ‘the perceived amount of effort people need to exert when using an EV’. 42 The operation of EVs is different compared to that of ICVs (e.g., maintenance and battery replacements). The expectation of effort is assumed to positively influence consumers’ intention to use EVs. 43 A study conducted by Abbasi et al showed that EV purchasing intention is significantly influenced by consumers’ expectation of effort and that using EVs requires less effort than using ICVs. 32 This notion is reinforced by a study from Gunawan et al which suggests that people who believe that it is easy to acquire the skill of driving an EV tend to perceive EVs in a more positive light. 44 Zhou et al showed that Chinese taxi drivers are concerned about the degree of ease or difficulty of using EVs and whether they would need to acquire new driving skills to be able to operate EV taxis. 43 On the other hand, a study conducted by Jain, Bhaskar and Jain suggested that, among Indian people, the expectation of effort did not affect their EV purchasing intention. 33
Therefore, it is proposed that:
Effort expectancy positively affects customers’ adoption intention of EVs.
Social influence
Social influence is defined as “the degree to which an individual perceives that it is important for others to believe he or she should use the new system”. 20 This phenomenon has also been called ‘the neighbourhood effect’. 45 Numerous studies have shown that other people, (i.e., friends, work colleagues, and relatives) affect a person’s decision-making process. In this paper, ‘social influence’ refers to ‘the extent to which other people believe that a given consumer should adopt EVs’. 46 The beliefs of other people have been shown to positively influence consumers’ intention to adopt EVs. Zhang et al showed, for instance, that the cost of an EV which an individual finds agreeable is influenced by the views of their friends. 47 Research conducted by Abbasi et al indicated that Malaysian consumers’ EV adoption intentions are significantly influenced by various social factors. 32
Based on the above discussion, we propose the following hypothesis:
Social influence positively affects customers’ adoption intention of EVs.
Performance expectancy
The definition of ‘expectation of performance’ is ‘the degree to which a person believes that using a certain product would help them to realize performance gains’. 20 People who believe that technology benefits them tend to be more positively predisposed toward using new technological products. 1 In this paper, ‘expectation of performance’ refers to ‘an individual’s perceived benefit in terms of the performance of EVs.7,20 Jain, Baskar and Jain showed that expectation of performance has a significant influence on the adoption intention of EVs, whereas limited travelling range is commonly seen as its primary drawback. 33 These findings were supported by a study conducted by Zhang et al which demonstrated that performance metrics more significantly influence consumers’ confidence and value perception of EVs than any other factor. 7 Bhat, Verma and Verma researched the correlation between the expectation of performance and anxiety about EV technology among consumers. 48 They showed consumers’ anxiety and apprehensions around EVs tend to be lower when they have a more positive opinion about the performance of EVs. 48
Therefore, the following hypothesis is presented:
Performance expectancy positively affects customers’ adoption intention of EVs.
Price value
Price value refers to consumers’ expectations around cost management. 49 It can also be defined as the cost-benefit relationship that broadly affects people’s adoption intention of a novel technology. 42 If the cumulative benefits of a service or product outweigh a consumer’s expectations, it is deemed to have a high price value. 50 In this paper, ‘value’ refers to the cumulative benefit that EVs deliver to consumers. EVs are charged using electricity which is more cost-effective than purchasing fuel for ICVs. 51 Another key benefit of EVs is lower maintenance costs compared to ICVs. 51 Gunawan et al suggested that consumers who perceive a correlation between the price and quality of EVs are more inclined to accept EVs and show a greater interest in using them. 44 Similarly, Han et al reported the majority of Chinese consumers in Hefei province would be more likely to purchase EVs if they were competitively priced compared to conventional ICVs. 52 If the advantages of a service or product surpass a consumer’s expectations, it is deemed to have a high price value. 50
Based on the above point of view, the following hypothesis is presented:
Price value positively affects customers’ adoption intention of EVs.
Policy incentives
Multiple papers have reported that consumers’ willingness to adopt EVs is enhanced by policy incentives. As an example, Li et al showed that people are more likely to buy EVs when tax reductions and subsidies are offered to them. 2 Similarly, Wang et al reported that consumers’ intentions to purchase EVs are greatly increased as a result of preferential tax policies. 11 Nonetheless, few studies have investigated policy incentives’ moderating effect. Jain, Bhaskar and Jain showed that the correlation between perceived risk and consumers’ intention to adopt EVs is moderated by government support. 33 Kim et al reported that financial incentives only exhibit a moderating effect between adoption intention and the perceived value of EVs. 53 This paper aims to investigate the moderating effect of policy incentives on the adoption intention and price value of EVs.
The following hypothesis is therefore put forward:
The relationship between adoption intention and price value of EVs is moderated by policy incentives.
Facilitating conditions
‘Facilitating conditions’ can be defined as ‘the degree to which a person perceives that an underlying technical or organisational infrastructure exists to facilitate the utilisation of a given product or system’. 20 In this paper, ‘facilitating conditions’ will refer to consumers’ beliefs regarding the available support and resources to facilitate the utilisation of EVs, including the infrastructural distribution, charging conditions and the total amount of operational charging stations.8,20,54–56 Limited travelling range is commonly seen as the primary drawback of EVs. 33 Also, Chinese consumers are relatively concerned about the availability of charging stations, they may need to put more effort to find charging stations due to the scarce amount.11,18 Since performance and time risk of perceived risk are caused mainly due to the fact of charging concerns, the moderating effect of facilitating conditions is worth studying. However, no study has investigated the moderating role of facilitating conditions between perceived risk and consumers’ EV adoption intention.
Therefore, this study presents the hypothesis as follows:
Facilitating conditions moderate the relationship between perceived risk and adoption intention of EVs.
Demographic characteristics
Gross monthly income, education level, age, and gender are the control variables that moderate the model used in this study. Previous studies have shown that different age and gender groups perceive EVs differently. For example, She et al demonstrated that people’s willingness to adopt EVs increases with age and that middle-aged and elderly people tend to be more inclined to purchase EVs. 18 Lashari, KO and Jang showed that, compared to females, males tend to be more attracted to EVs. 57 They also showed that, due to its high cost, younger age groups tended to hold a more negative view in terms of their intention to adopt EVs. In terms of education and income level, one study reported that individuals with higher education and income levels are more likely to adopt and purchase EVs. 58
Based on the above discussion, this paper hypothesises the following:
Participants’ age moderates the relationship among the variables in the research model.
Participants’ gender moderates the relationship among the variables in the research model.
Participants’ monthly income moderates the relationship among the variables in the research model.
Participants’ educational level moderates the relationship among the variables in the research model.
The research model resulting from these hypotheses is developed in Figure 2

Research model.
Research design
Study measures
Chinese consumers’ intention to adopt EVs was studied using a quantitative online survey. The questionnaire consisted of a consent form and two main sections. The participants’ demographic criteria, including age, gender, monthly income, and education level were established in the first section. The demographic criteria were determined based on the existing research literature on the perception of EVs among Chinese customers. The second section of the questionnaire collected data on the constructs by way of adapting pre-existing measurement methods using the seven-point Likert scale. The questionnaire participants responded with levels 1 (‘strongly disagree’) through 7 (‘strongly agree’) to indicate their level of agreement or disagreement (see Appendix A). The questions were presented to the participants in a random order. An ‘attention check’ question was also included, requiring the participants to choose a specific answer. Questionnaires with incorrect ‘attention check’ answers were excluded from the dataset.
Research population and sample
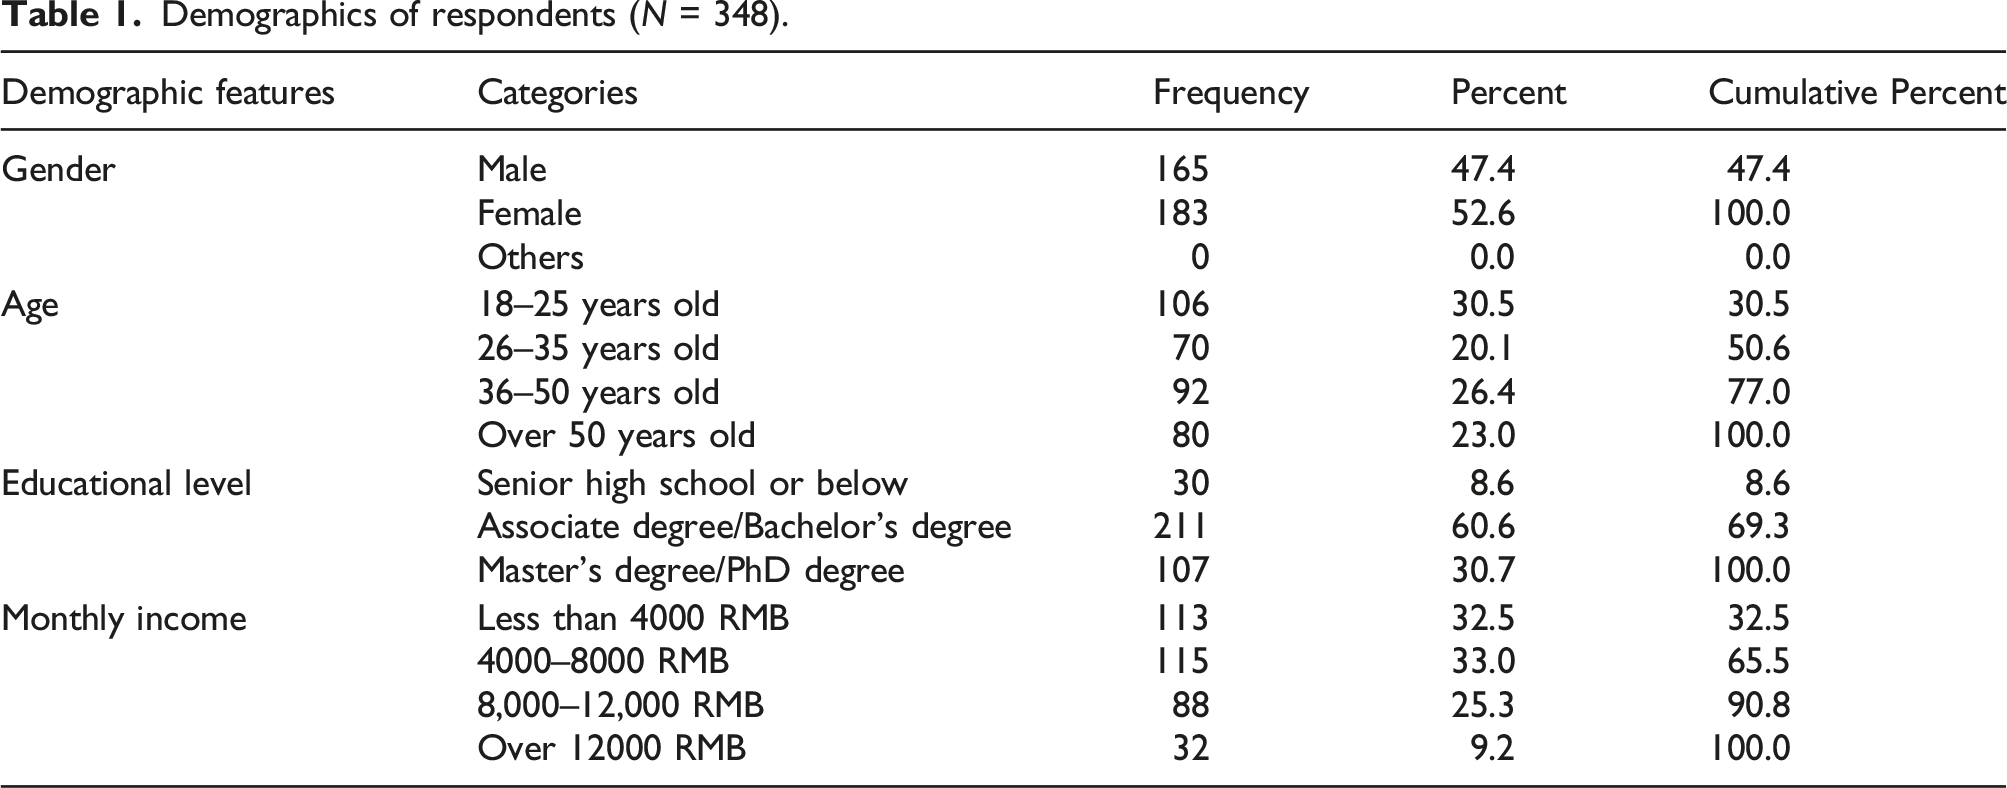
Four hundred and seventy-six (476) cases were taken in total to satisfy this condition. It took 15 days to collect the response, starting from 6th June to 21st June 2022. After removing cases which clearly showed false answers (e.g., excessive repetitiveness) or which were completed with a response time of fewer than 150 s, 348 authentic responses remained to be statistically analysed. The authentic rate of response for the questionnaire is therefore 73.1%. The sample size met the following prerequisites of conducting SEM techniques: (i) Using the SEM technique, the study’s sample size should exceed fivefold the total number of questions. 59 Eight constructs were considered in this study, each of which had four observed variables to measure. The sample size should therefore 160 or greater (5*32 questions = 160 respondents). (ii) The sample size should fall within the range of 200 – 400.60,61 (iii) 10 to 15 cases per item are suggested to run the multivariate analyses such as structural equation modelling (SEM) (10 cases*32 items = 320).62,63 The quantity of 348 valid responses is also in this range. In addition, the gender-based frequency distribution is quite balanced, with 52.6% female and 47.4% male participants.
Pretesting
Before the questionnaires were officially distributed, preliminary surveys were carried out with 20 participants to confirm that the questions were easily comprehensible and representative of the variables we sought to measure. 3 questions were slightly altered to improve their comprehensibility according to the feedback we received. First of all, numbers and service radius of public charging spots and stations were added as notes to better explain the availability of public infrastructure for EVs. Office building was added as well as the example of the workplace to test the convenience of public infrastructure. And then, the example of financial losses, including repair and battery costs, was also shown on the survey to remind participants. The pretest participants’ duration to complete the questionnaire was recorded during the pretesting phase, with the fastest time being 150 s. Questionnaires that were completed faster than 150 s were therefore regarded as invalid, to help ensure the collection of quality data.
Data analysis
Using Amos 27, confirmatory factor analysis (CFA) was carried out to evaluate the data’s validity, reliability, and goodness of fit. Cronbach’s alpha, composite reliability and average value were tested to promise the construct reliability. After that, factor loadings and the square root of AVE were calculated to determine the convergent and discriminant validity. Based on the above value of data and its criteria, the measurement model was analysed to validate whether the hypotheses could be tested with an adequate degree of reliability. To minimize multicollinearity between the variables, the variance inflation factors (VIFs) were calculated. Finally, regarding the structural model, the hypotheses testing was conducted.
Results
Demographic data
Demographics of respondents (N = 348).
Measurement model testing
Reliability and convergent validity.

Discriminant validity.
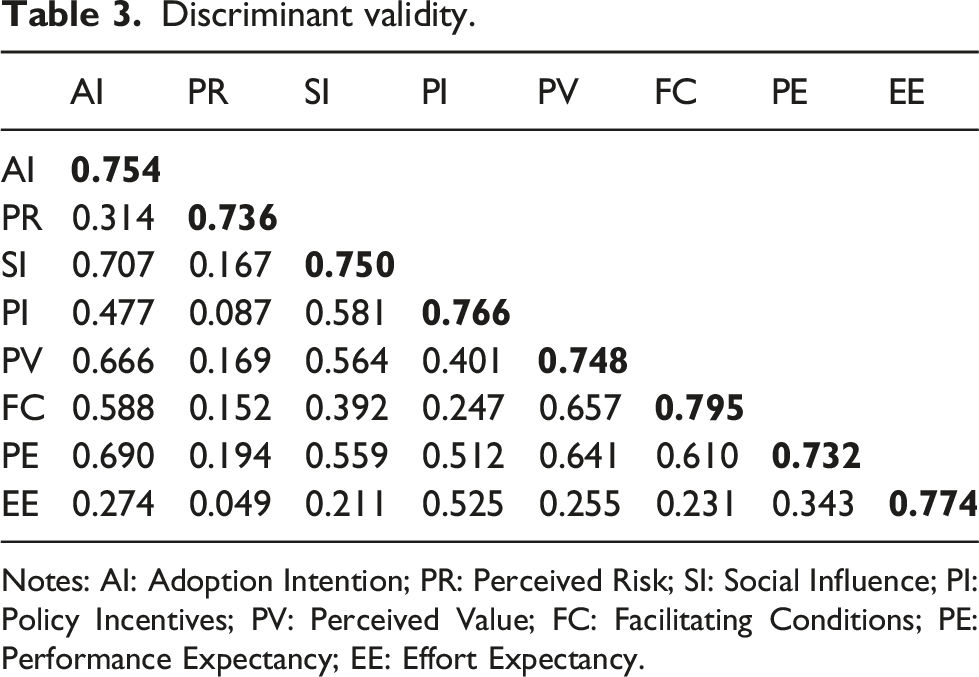
Notes: AI: Adoption Intention; PR: Perceived Risk; SI: Social Influence; PI: Policy Incentives; PV: Perceived Value; FC: Facilitating Conditions; PE: Performance Expectancy; EE: Effort Expectancy.
Structural model and hypotheses testing
Results of model fit.

Summary of hypotheses results.

The moderating roles of facilitating conditions and policy incentives were respectively proven. The relationship between consumers’ EV adoption intention and price value was greatly influenced by policy incentives (H6; β = 0.099, p = .038), as demonstrated in Figure 3. Based on this result, it can be concluded that reasonable prices combined with governmental policy support could improve consumers’ view of EVs, thus confirming hypothesis 6. Moderating effect of policy incentives.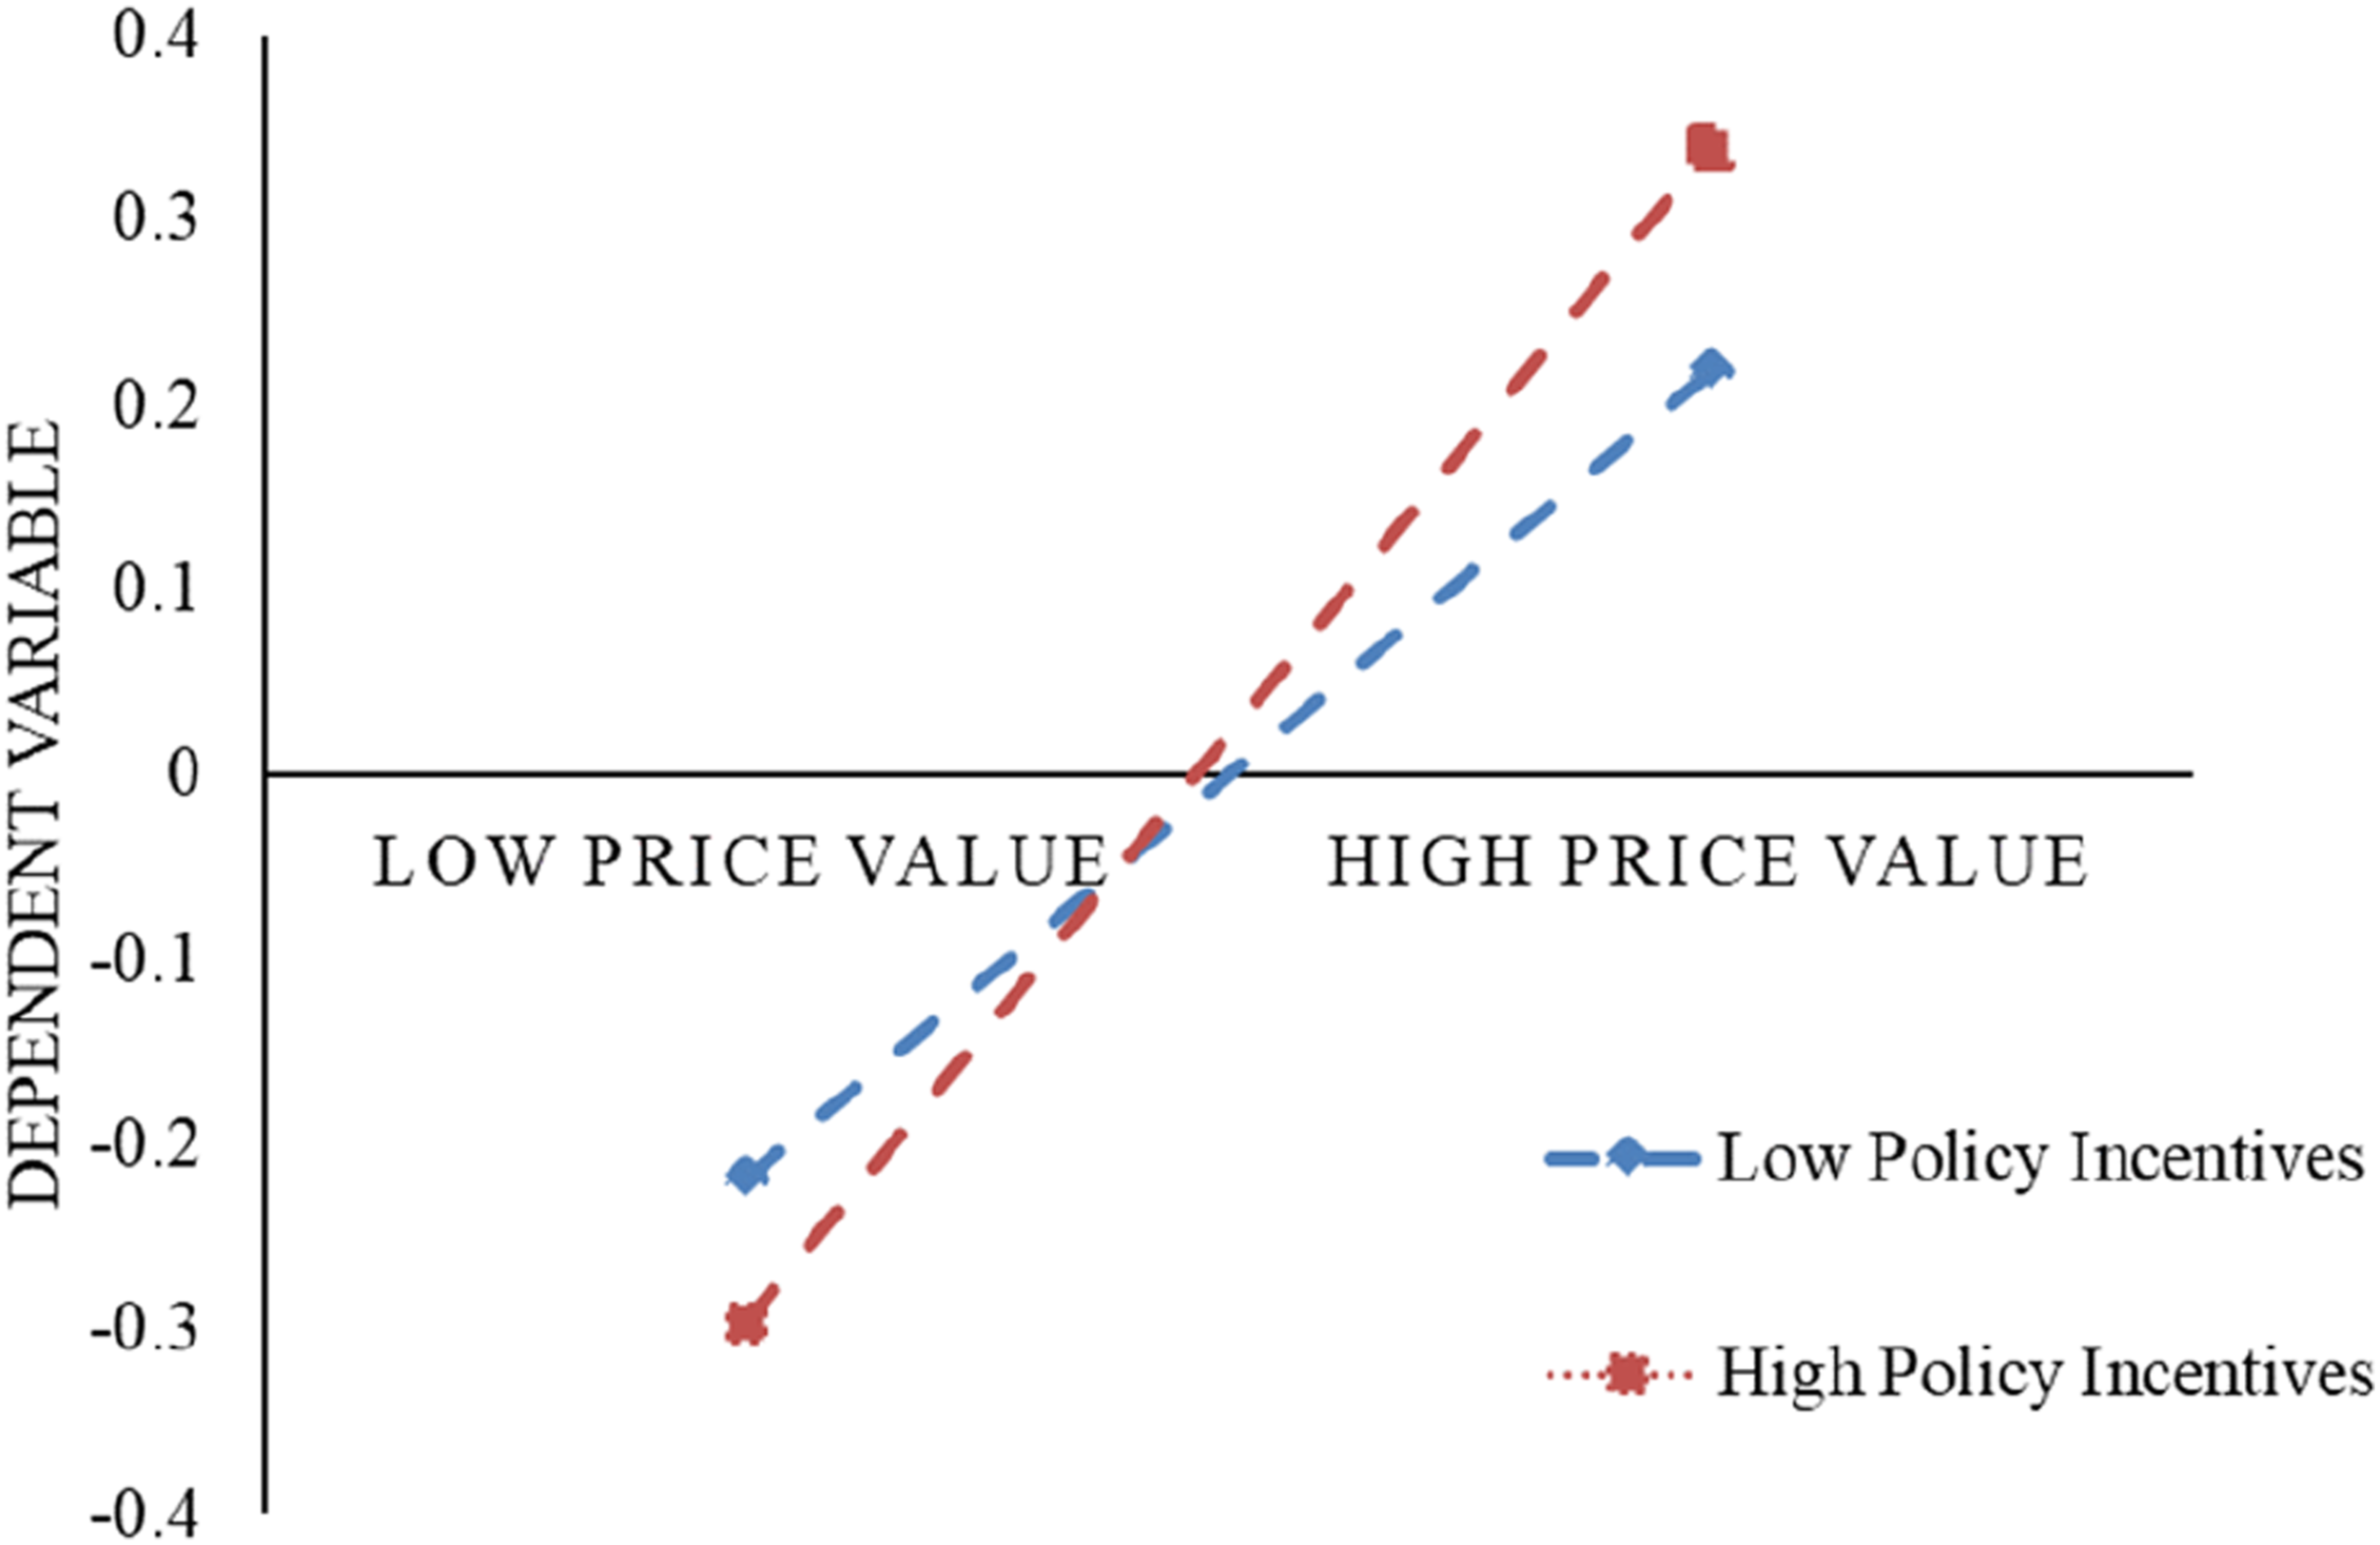
The relationship between consumers’ EV adoption intention and perceived risk was positively influenced by the moderating effects of facilitating conditions (H7; β = 0.221, p = .003), thus confirming hypothesis 7. The negative effect of perceived risk on adoption intention is reduced by facilitating conditions, as shown in Figure 4. In conclusion, the expected negative utility that consumers associate with EVs is reduced by facilitating conditions. Moderating effect of policy incentives.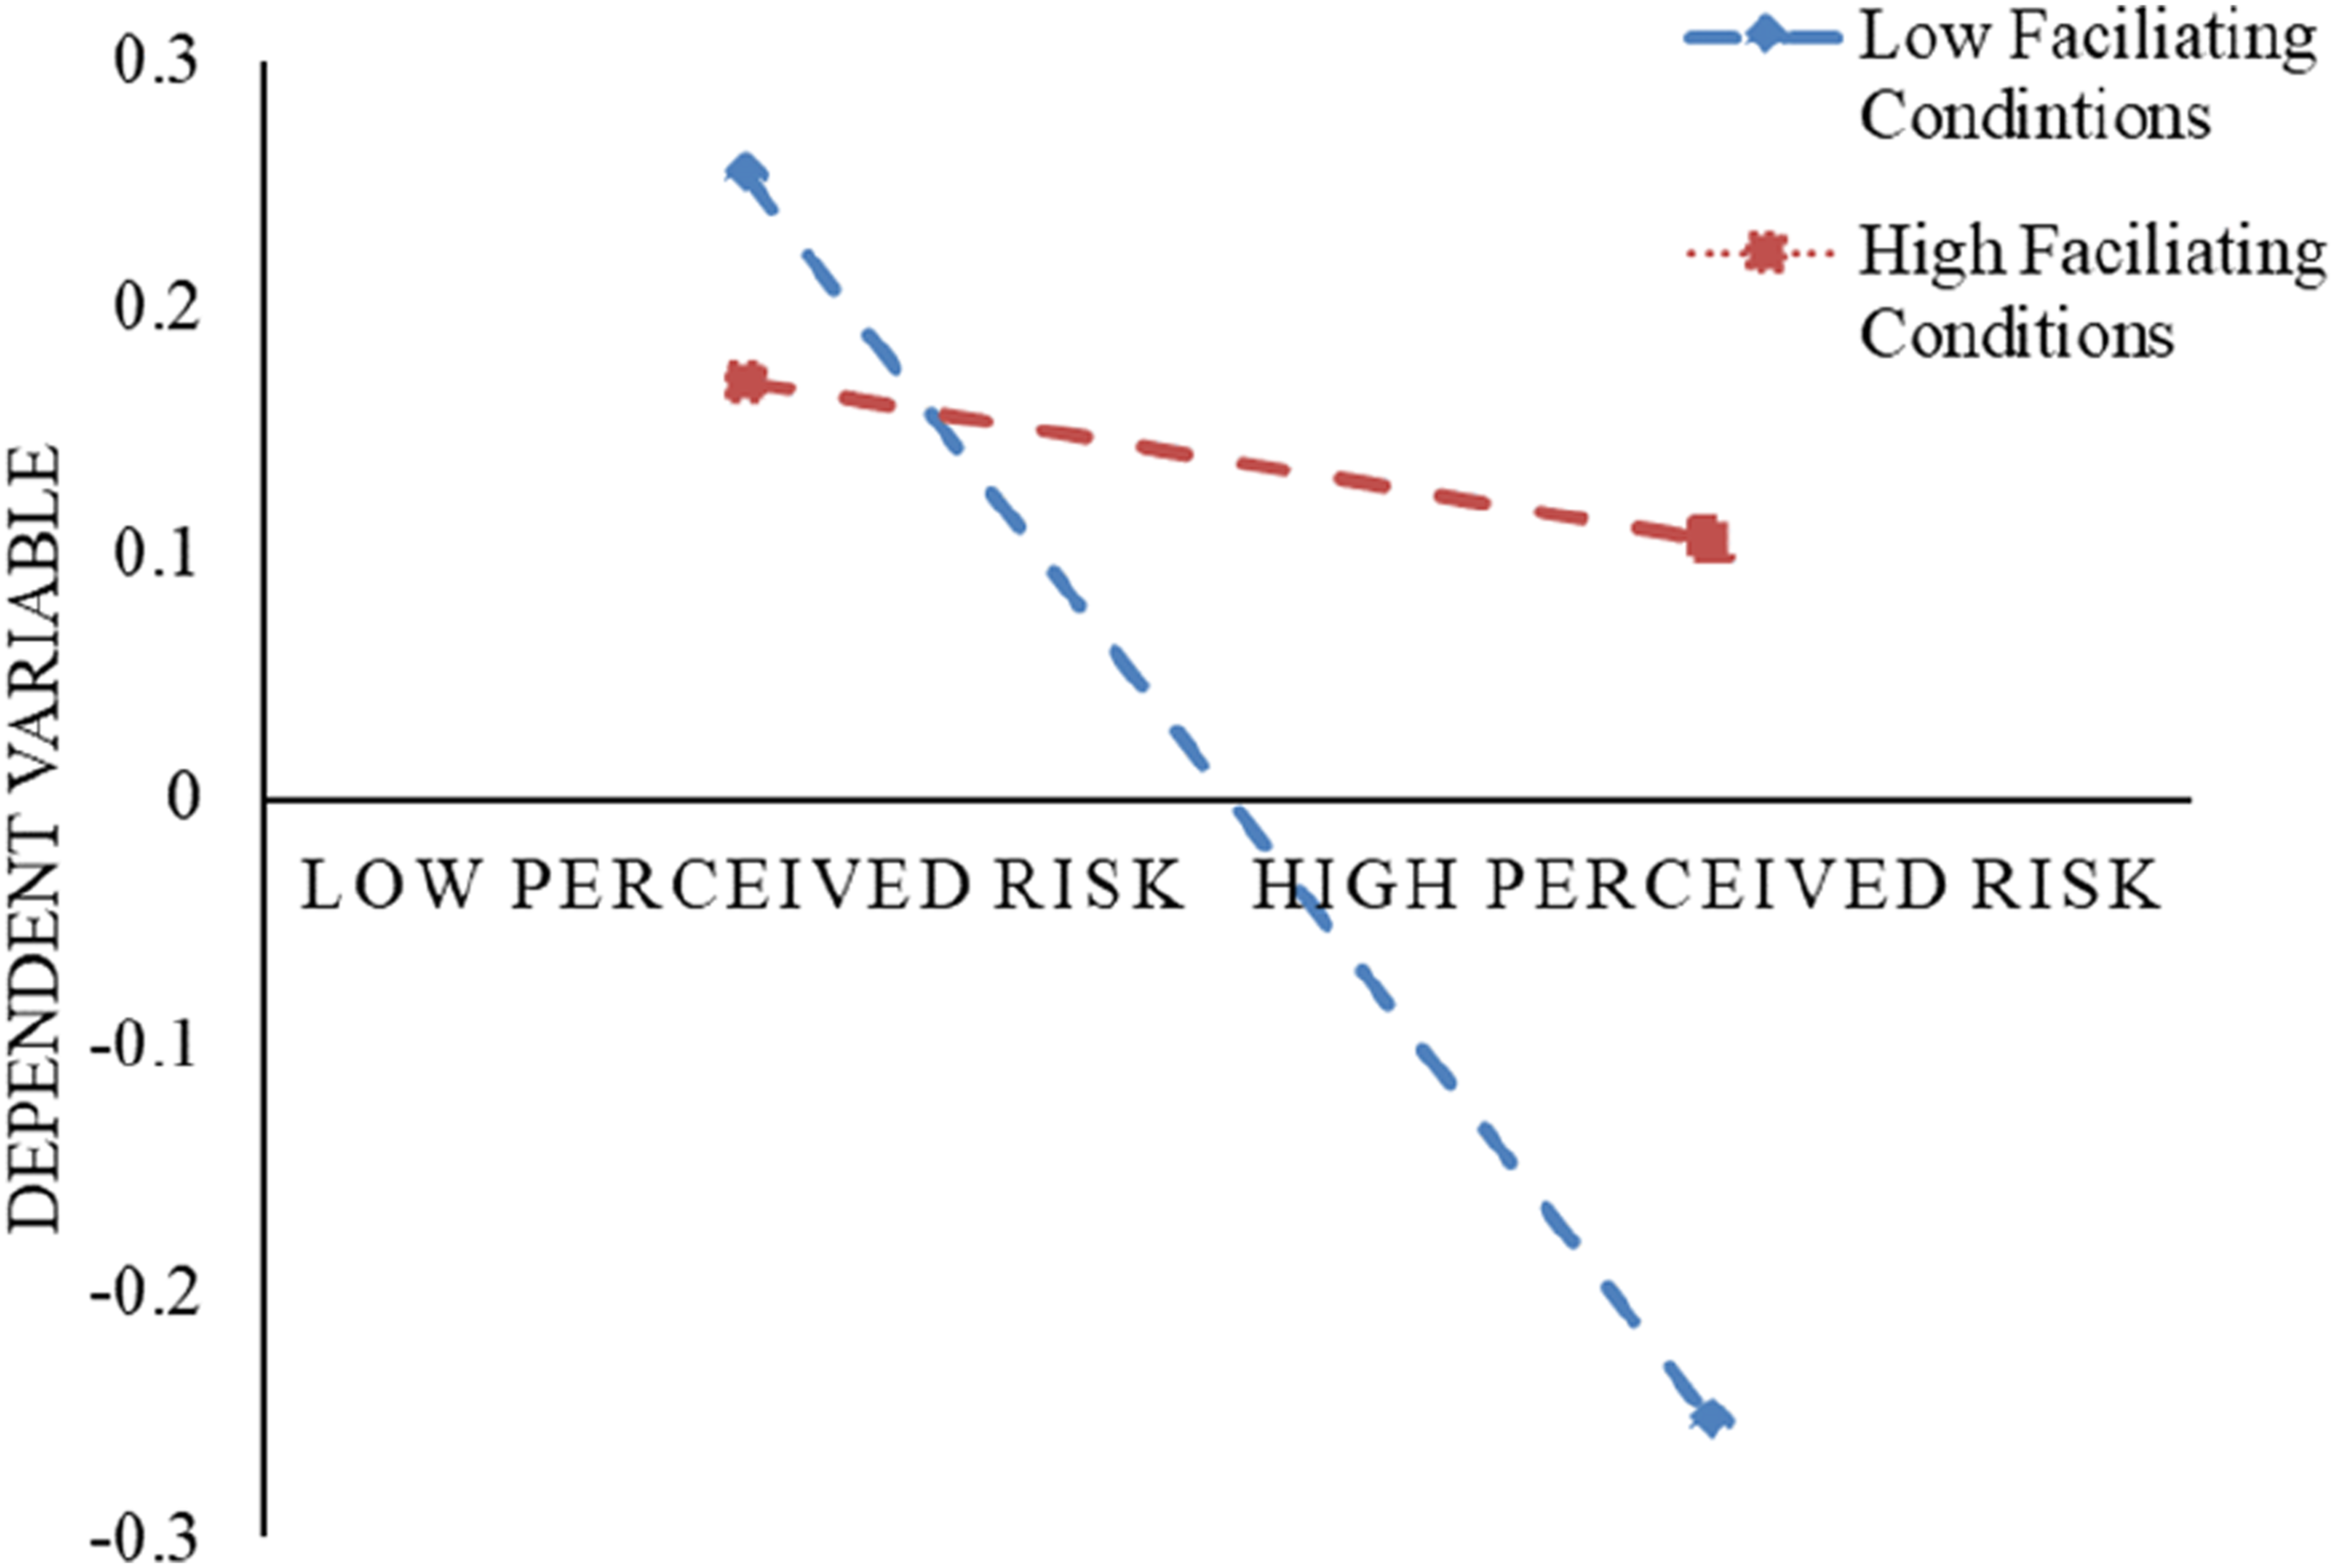
Summary of hypotheses results for control variables.
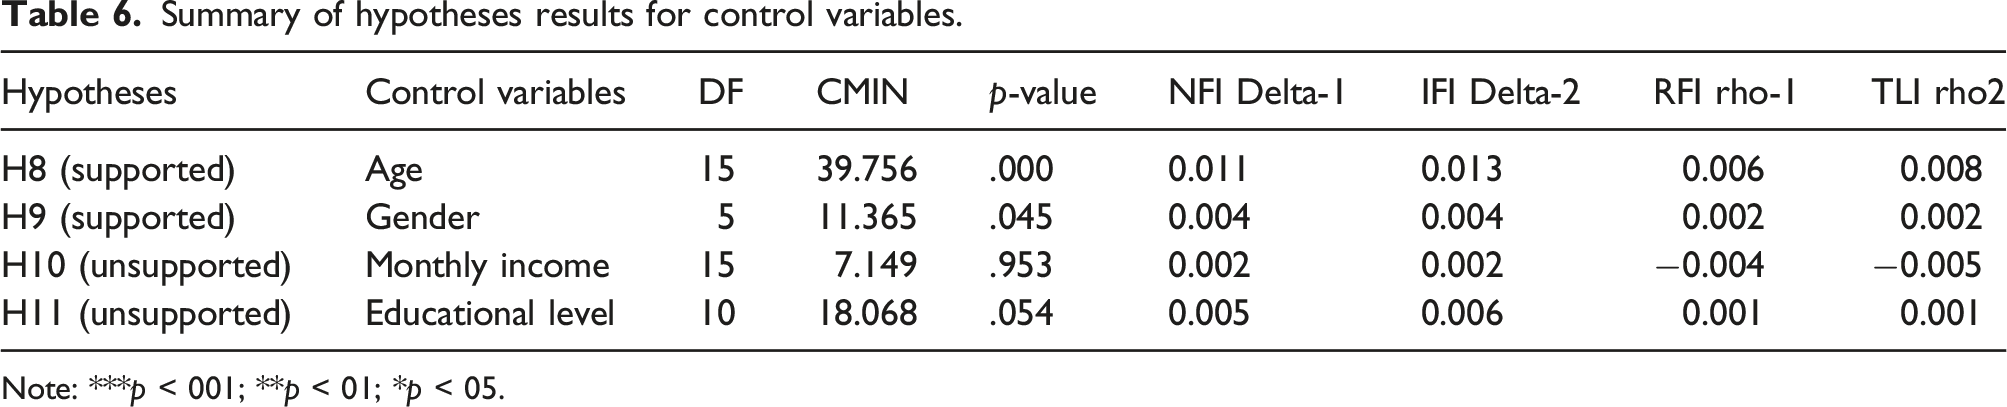
Note: ***p < 001; **p < 01; *p < 05.
The Multigroup SEM results of gender.

Note: ***p < .001; **p < .01; *p < .05.
The Multigroup SEM results of age.

Note: ***p < .001; **p < .01; *p < .05.
Discussion and implications
Theoretical implications
This paper investigates the adoption intention of EVs based on the extended UTAUT model with policy incentives, perceived risk and price value in the Chinese context. The results found social influence, performance expectancy and price value all have positive effects on adoption intention, which is in line with the existing research.7,33,44,52,67,68 At the same time, perceived risk is proven to have negative effects which is also consistent with studies written by Schuitema et al, Wang et al and Vafaei-Zadeh et al.36,37,50 Furthermore, this study also contributes to the moderation effects on the relationship between price value and adoption intention towards EVs, which was studied little by previous researchers. 41 Lastly, since no paper suggests the moderating role of facilitating conditions between perceived risk and adoption intention, this study tries to fill this gap. Therefore, this study enriches the current study by reconfirming the proven factors and proposing the moderation effects of policy incentives and facilitating conditions.
Practical implications
Construction of charging infrastructures
As a main priority, obstacles to charging infrastructure must be overcome. The Chinese government should therefore undertake the extensive construction of new charging stations, making considerations for the total amount of charging stations, as well as their locations and distribution patterns. This would enable citizens to recharge their EVs in a timely manner, regardless of whether they are travelling in rural or urban regions, or on highways. The government could also incentivise different types of merchants and businesses (i.e., gas stations, stores, hotels, and restaurants) to invest in building new charging stations on or near their business premises. This would ensure adequate availability of charging infrastructure for EVs. To guarantee the correct operation of these new charging stations, new managerial policies are also necessary.
Increasing public awareness of electric vehicles
It is also necessary to improve potential buyers’ understanding of EVs. To this end, several important features should be taken into account. EV producers must educate consumers about the advantages of EVs since potential buyers will evaluate whether the potential value offered to them by EVs would justify their price. For instance, EVs have lower long-term operating costs than ICVs as a result of factors such as lower fuel costs and maintenance costs. Nonetheless, consumers tend to ignore this fact and are overly concerned that the cost of purchasing an EV is comparatively high. To improve consumers’ perceived value of EVs, their long-term cost-saving benefits should therefore be more actively promoted. On the other hand, consumers should also be more informed about the performance of EVs. To this end, EV producers could offer costless test drives to the general public which would help to alleviate consumers’ concerns about the performance of EVs. Once consumers are more informed about the advantages of EVs, their levels of perceived risk and other misconceptions will be greatly reduced. At the same time, this would enhance consumers’ confidence and positive views on the value of EVs.
Focusing more on financial incentives
This paper has demonstrated that the effect of price value on consumers’ intention to adopt EVs is positively enhanced by policy incentives. Policy implications can thus be deemed to be pivotal in this discussion. Governments should develop broader incentive policies with a specific emphasis on economic incentives for end consumers (e.g., loan limits, subsidies on EV purchases, and tax exemption policies) should be appropriately designed, enacted, and revised. The government could also collaborate with EV producers to develop effective economic incentive policies and contribute towards innovative new cooperative business models.
Improving LIBs’ capacity and end-of-life management
Producers of EVs should fund research and development in enhancing EV technology to improve their performance metrics. For instance, developing LIBs with higher capacities would alleviate consumers’ concerns about EVs’ limited travel range and long charging duration. This type of innovation would improve the expectation of performance and perceived risk among consumers. In terms of reverse logistics, LIB producers should introduce incentive programmes to urge consumers to promptly return their end-of-life LIBs and consider offering a free battery collection service to customers. 69 Governments should also actively increase environmental issues awareness among the public and promote the importance of recycling end-of-life batteries among EV purchasers. This would help curb the high demand for LIBs, and effectively reduce costs to EV producers through recycling, reusing, and/or remanufacturing processes.
Taking priority in targeting groups
This paper showed that women are generally more interested in EVs than men. The significance of women’s adoption intention towards EVs should not be disregarded. Consumers in younger age groups are also more interested in EVs than any other age group. 70 Hence, EV producers should develop targeted strategies to appeal to these target groups in particular. Young people’s and women’s views regarding EVs should constantly be analysed to help guide innovation in the EV market.
Conclusion and future research
This paper aims to evaluate consumers’ perceptions of EVs to identify ways in which EV supply chains may be improved. An extended UTAUT model which integrates policy incentives, price value, and perceived risk was quantitatively analysed using the SEM approach. The analysis results indicate that social influences, perceived risks, price value, and expectation of performance all greatly influence consumers’ EV adoption intention. However, the expectation of effort had no significant influence on EV perception among consumers. In particular, the positive moderating effects of policy incentives on price value were reconfirmed to provide more robust evidence since few research studies on it. In addition, the positive moderating effects of facilitating conditions between perceived risk and adoption intention of EVs were found for the first time in this study, which fills the gap in this area. Consumers’ demographic profiles were also taken into consideration, including age, gender, educational level, and gross monthly income, as control variables. Gender and age were proven to have significant moderating effects on EVs’ adoption intention. This paper has therefore added to the existing research literature on the subject of optimising EV supply chains and research involving the use of the UTAUT model extended with added variables. The paper also holds significance for both policymakers and producers of EVs and may help them to optimise the EV supply chain by designing financial incentive policies, building sufficient charging infrastructure, improving the management of end-of-life LIBs, and creating more awareness of EVs among consumers.
This paper has certain limitations. First, since many other variables may influence consumers’ perception of EVs, the empirical model used in the analysis should be further extended. For instance, future studies could investigate additional factors such as consumers’ knowledge of EVs and environmental awareness. Second, since this paper also included a relatively small number of participants from higher-income groups and lower-education groups, the EV adoption intention of these two groups may have been disregarded. To compensate for this limitation, future studies should explore the influences of monthly income and educational level more comprehensively by including more participants. Other demographic variables (e.g., geographical location, occupation, driving experience) could also be included. With a sufficiently large amount of sampling data, consumers who have previously purchased and used EVs and consumers who are still contemplating purchasing an EV could be separated into two distinct groups for further research.
Furthermore, consumers’ understanding and views of EVs may vary based on different brands of EVs since they have different performance metrics, features, and prices. As a result of this, this paper may not comprehensively represent the influences of price value and performance expectancy on consumers’ EV adoption intention. Future researchers should therefore attempt to minimise potential bias among study participants by detailing the specific price points and performance metrics of EVs when designing questionnaires.
Finally, local municipalities have different policies for promoting EVs which may differ from the central Chinese government’s overarching policies. The influence of the enactment of different policies may differ based on geographical locations and local market conditions. Future research should gather more conclusive evidence from various Chinese provinces and cities since local policies and consumers’ perceptions regarding EVs may vary across different regions.
Footnotes
Declaration of conflicting interests
The author(s) declared no potential conflicts of interest with respect to the research, authorship, and/or publication of this article.
Funding
The author(s) received no financial support for the research, authorship, and/or publication of this article.
Appendix
Variables description reference
Description
Reference
Social Influence
SI1: People who are important to me would think that I should use EV
(Jain, Bhaskar and Jain, 2022); (Kapser and Abdelrahman, 2020)
SI2: People who influence my behaviour would think that I should use EV
SI3: People whose opinion I value would prefer that I use EV
SI4: Driving EV would make a good impression about me on the other people
Effort Expectancy
EE1: I would find EV easy to use
(Jain, Bhaskar and Jain, 2022); (Kapser and Abdelrahman, 2020)
EE2: It would be easy for me to become skilful at using EV
EE3: My utility for EV would be clear and understandable
EE4: Learning how to drive EV would be easy for me
Performance Expectacy
PE1: I would find EV useful in my daily life
(Jain, Bhaskar and Jain, 2022); (Kapser and Abdelrahman, 2020)
PE2: Using EV would help me travel quickly
PE3: Using EV would increase my productivity
PE4: Using an electric vehicle for daily activities may be helpful in my work
Facilitating Conditions
FC1: The public infrastructure for electric car is available
(Vafaei-Zadeh et al., 2022); (She et al., 2017)
FC2: The electric car infrastructure at work is available
FC3: The electric car infrastructure at home is available
FC4: The electric car infrastructure on highway is available
Price Value
PV1: EVs offers value for money
(Vafaei-Zadeh et al., 2022); (Zhang et al., 2020)
PV2: Electric car is reasonably priced
PV3: Electric car is economical in the long run
PV4:The price paid may be in accordance with the electric vehicle that I will get
Policy Incentives
PI1: Purchase subsidies help me adopt EVs
(Kim et al., 2018); (Zhang et al., 2013)
PI2: Reducing purchase-related taxes helps me adopt EVs
PI3: Preferential measures such as access bus lanes helps me adopt EVs
PI4: The government's charging infrastructure expansion policy helps me adopt EVs
Perceived Risk
PR1 I am afraid of suffering financial losses when using EVs
(Wang et al., 2018); (Junquera, Moreno and Álvarez, 2016)
PR2 I would not feel totally safe when I drive an EV on the road
PR3 Considering the disadvantages of EVs (e.g., limited driving range and long time recharging), I think using EVs could involve important time losses
PR4 I am worried about whether EVs will really perform as well as traditional gasoline vehicles
Adoption Intention
AI1 I am willing to adopt an EV in the near future
(Zhang et al., 2022); (Han et al., 2017)
AI2 I plan to adopt an EV in the near future
AI3 If I need to buy a new car in the near future, I would prefer an EV
AI4 If my friends want to buy a new car, I would suggest to buy an EV