
Abstract
Background:
Cartilage damage in rheumatoid arthritis (RA) is commonly evaluated by joint space narrowing (JSN) on conventional radiograph (CR). Cross-sectional studies suggest that ultrasound (US) can directly assess finger-joint cartilage damage; however, whether it can sufficiently evaluate cartilage changes over time remains unclear.
Objectives:
This study aimed to investigate temporal changes in cartilage damage in patients with RA using US.
Design:
A single-center, retrospective observational study.
Methods:
Fifty-three patients with RA underwent US scans of finger joints and CR of both hands at baseline and 1 year later. Cartilage thickness was measured at the bilateral second to fifth metacarpophalangeal and proximal interphalangeal joints, and cartilage damage was semiquantitatively scored using recorded US images. JSN was scored on CR using the van der Heijde-modified Sharp method. Patients were grouped by disease activity over 1 year, assessed by Disease Activity Score of 28 joints with C-reactive protein. Continuous variables were analyzed using the Mann–Whitney U or Wilcoxon signed-rank test. Correlations were assessed using Spearman’s rank correlation coefficients.
Results:
Median patient age and disease duration were 68 and 6.3 years, respectively. Baseline total cartilage thicknesses of 16 joints ranged from 3.1 to 9.1 mm (median, 6.5 mm). Total semiquantitative scores were 0–22 (median, 5). Cartilage thickness (rho, −0.63; p < 0.001) and semiquantitative (rho, 0.67; p < 0.001) scores were significantly correlated with JSN scores. Patients with sustained moderate-to-high disease activity showed greater cartilage thickness reduction (median, −6.2%) than others (median, −1.2%; p = 0.004), although semiquantitative (21.6% vs 16.7%, p = 0.74) and JSN (0% vs 0%, p = 0.68) scores remained unchanged. The two groups differed significantly in the amount of change (−0.4 vs −0.1 mm, p = 0.006).
Conclusion:
US detected cartilage damage progression in RA over 1 year, supporting its usefulness for longitudinal assessment.
Introduction
Rheumatoid arthritis (RA) is a systemic inflammatory disease characterized by progressive joint destruction and deformity. Imaging evaluation of joint destruction plays a crucial role in the diagnosis and management of RA, and conventional radiography (CR) is regarded as the gold standard. 1 Joint destruction is evaluated on CR by features such as erosion, cartilage destruction, and joint space narrowing (JSN). 2 Although CR remains the most accessible and commonly used imaging modality in routine clinical practice, its sensitivity is limited, especially for detecting early and subtle changes.3,4 Moreover, recent progress in RA treatment has reduced the number of cases with pronounced radiographic changes. Clinical trials are expected to provide detailed imaging evaluations for the sensitive assessment of combination changes while adhering to ethical considerations.5 –7 High-sensitivity modalities such as ultrasound (US) and magnetic resonance imaging (MRI) have been adopted to evaluate joint inflammation and destruction, including cartilage damage.8 –11 US is advantageous because it is noninvasive and easy to perform, and it has been used for cartilage assessment in patients with RA. It allows both quantitative assessment of cartilage thickness and semiquantitative grading based on visual scoring. 12 Although previous cross-sectional studies have suggested that US examination is useful for evaluating cartilage damage, it remains unclear whether it can sufficiently evaluate cartilage changes over time.
This study aimed to evaluate the sensitivity of US in detecting longitudinal changes in cartilage damage in patients with RA. The study’s findings could help formulate strategies for improving RA treatment.
Methods
Patients
This study was an observational, retrospective study that included patients with RA who visited Toho University Ohashi Medical Center between September 2011 and November 2015. Patients were eligible if they met the 2010 American College of Rheumatology (ACR)/European League Against Rheumatism criteria or 1987 ACR classification criteria for RA13,14 and had completed US examinations of bilateral finger joint cartilage and CR of both hands and wrists in the standard posteroanterior projection at baseline and 1 year later. Patients who did not have both US and CR images available at the two required time points (baseline and 1 year later) were excluded from the analysis.
The reporting of this study follows the Strengthening the Reporting of Observational Studies in Epidemiology (STROBE) statement (Supplemental material). 15
Clinical assessments
We obtained the following medical information retrospectively from medical records and recorded images: age, sex, height, weight, disease duration from the onset of symptoms to US examination, global assessment of disease activity as measured by a 100-mm visual analog scale, Health Assessment Questionnaire-Disability Index (HAQ-DI), physician-based assessment of tenderness and swelling in 28 joints, serum levels of C-reactive protein (CRP), rheumatoid factor (RF), anticyclic citrullinated peptide (anti-CCP) antibody, matrix metalloproteinase-3 (MMP-3), and details of RA treatment. The US-examined joints’ JSN was scored in a blinded manner using the van der Heijde-modified Sharp method (mTSS), 16 with the CR of each hand and wrist in the standard posteroanterior projection.
Furthermore, the enrolled patients were divided into two groups: those with sustained disease activity and the others. The sustained disease activity group was defined as patients with a Disease Activity Score of 28 joints with CRP (DAS28-CRP) ⩾2.7 (moderate-to-high disease activity) both at baseline and 1 year. 17
Ultrasound examination
A Xario US machine (Canon Medical Systems, Tochigi, Japan) equipped with a multifrequency linear array probe (7–14 MHz) was used, and a rheumatologist (T.O.) performed the scans, following a protocol similar to that of a previous study. 18 Specifically, cartilage layers of the bilateral second to fifth metacarpophalangeal (MCP) and proximal interphalangeal (PIP) joints were visualized in a median longitudinal view from the dorsal side, with the joints in approximately 90° flexion. 19 The US beam was adjusted to be perpendicular to the cartilage surface in order to delineate cartilage boundary artifacts at the upper edge of the cartilage (Figure 1(a)).
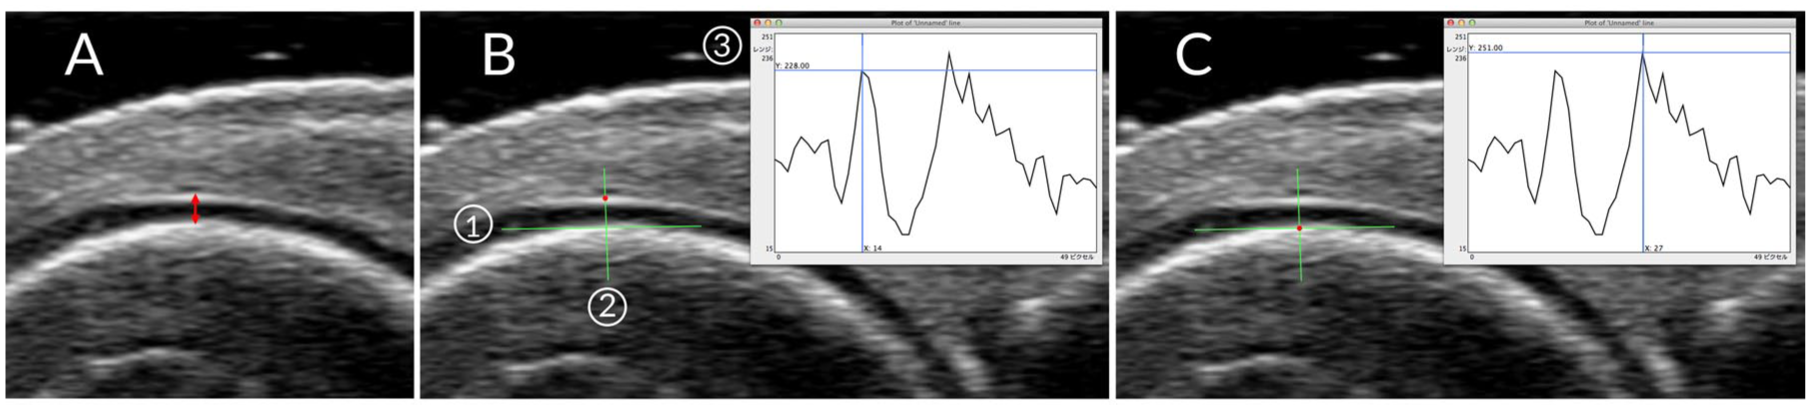
Ultrasound imaging and measurement of joint cartilage. (a) Longitudinal dorsal view of the MCP joint. Red double-headed arrow, cartilage thickness. (b, c) A tangent line was placed along the subchondral bone (1), and a linear ROI was positioned perpendicular to this line (2). The gray-scale luminance profile from this ROI was displayed as a two-dimensional graph of luminance and pixel distance (3). While reviewing both the graph and the ultrasound image, the number of pixels between the upper margin of the interface artifact at the cartilage surface (b) and the cartilage base (c) were identified and converted to cartilage thickness.
Cartilage thickness was measured using OsiriX software (Pixmeo, Bernex, Switzerland) on an Apple OS X operating system. 20 It was measured by setting a linear region of interest on a Digital Imaging and Communication in Medicine image stored on a hard disk and calculating the number of pixels while reviewing a two-dimensional graph displaying gray-scale luminance and pixel-based distance. Cartilage thickness was measured from the cartilage base to the interface artifact at the cartilage surface (Figure 1(b) and (c)). In this study, cartilage thickness measurements were not corrected for sound velocity because the objective was to evaluate relative changes over time.
Furthermore, semiquantitative scores were obtained on a scale of 0–2 (0 = normal, 1 = minimal, and 2 = severe) using the Outcome Measures in Rheumatology (OMERACT) criteria from recorded static images. 21 Images were evaluated side by side at baseline and 1 year later.
Cartilage thickness measurement and semiquantitative evaluations were conducted independently at different time points. Although the US examiner (T.O.), blinded to other medical information, evaluated the US images, the examiner was aware of the imaging time point during the semiquantitative assessment.
Statistical analysis
Statistical analysis was performed using EZR software (version 1.55; Saitama Medical Center, Jichi Medical University, Saitama, Japan), 22 a graphical user interface for R (version 4.1.2; The R Foundation for Statistical Computing, Vienna, Austria). Continuous variables were summarized as medians and interquartile ranges (IQRs) and analyzed using the Mann–Whitney U test for independent comparisons. Between-group differences in imaging changes according to disease activity were estimated using the Hodges–Lehmann median difference and its 95% confidence interval (CI). The 95% CIs for these differences were obtained using a nonparametric bootstrap method. The Wilcoxon signed-rank test was applied to paired data, while binomial data from both groups were examined using Fisher’s exact test. Relationships between continuous variables were assessed using Spearman’s rank correlation coefficient. The p-values representing the relationships between patient characteristics and each method were adjusted for multiple comparisons using an adaptive Benjamini–Hochberg procedure to control the false discovery rate.
Cartilage thickness intraobserver reliability was assessed using the intraclass correlation coefficient (ICC) based on a single measurement, absolute agreement, and a two-way mixed-effects model. ICC results were interpreted as follows: <0.5 = poor, 0.5–<0.75 = moderate, 0.75–<0.9 = good, and >0.9 = excellent agreement. 23 Moreover, for assessing systematic errors, limits of agreement (LOA) were calculated using the Bland–Altman method, and a plot was constructed for visual judgment. Fixed errors were evaluated based on the difference between the first and second measurements using a paired t test, while proportional errors were evaluated using regression analysis. The smallest detectable change (SDC) was based on the standard error of measurement (SEM), estimated by calculating the square root of within-subject variance. 24 The sample size was assumed to be 33 patients, based on an expected ICC of 0.90 from previous studies, a minimum acceptable ICC of 0.75, 2 measurements, 80% power, and significance level (α) = 0.05. 25 Statistical significance was set at p < 0.05.
Results
Patient characteristics
This study enrolled 53 patients with RA. Table 1 shows their demographic, clinical, and laboratory characteristics at baseline, including 43 females (81%), a median age of 68 years, and a median disease duration of 6.3 years. Six patients were treatment-naïve. The median DAS28-CRP at baseline was 2.65, and 26 patients (49%) had moderate-to-high disease activity (DAS28-CRP ⩾2.7). The proportions of patients positive for RF and anti-CCP were 81% and 91%, respectively. CR-assessed total JSN scores for 16 joints varied between 4 and 52 (median, 15).
Patient characteristics and ultrasound findings at baseline and after 1 yr.

Values are expressed as medians (IQR) or numbers (%). Fisher’s exact test or the Mann–Whitney U test for independent data and the Wilcoxon signed-rank test for paired data were used for group comparisons.
p-Value in the comparison between patient groups at baseline.
HAQ-DI data were not obtained for one patient in the sustained disease activity group at baseline (n = 9) and for one patient in the Other patients group at 1 year (n = 42); these patients were excluded from HAQ-DI analyses.
RF positive, >15 IU/mL.
Anti-CCP positive, ⩾4.5 U/mL.
MMP-3 positive, female >59.7 ng/mL, male >121.0 ng/mL.
Sum of 16 joints.
anti-CCP, anticyclic citrullinated peptide; bDMARDs, biological disease-modifying antirheumatic drugs; CRP, C-reactive protein; CT, cartilage thickness; DAS28, Disease Activity Score of 28 joints; HAQ-DI, Health Assessment Questionnaire-Disability Index; IQR, interquartile range; JSN, joint space narrowing; MMP-3, matrix metalloproteinase-3; MTX, methotrexate; RF, rheumatoid factor; yr., years.
Baseline ultrasound evaluation
We evaluated 848 joints, with MCP and PIP evaluated in 424 joints each. The summed cartilage thickness measured by US across the 16 joints varied between 3.1 and 9.1 mm (median, 6.5 mm). In contrast, the total semiquantitative US scores (scale 0–2 per joint) across the 16 joints varied between 0 and 22 (median, 5; Table 1).
We compared the total cartilage thickness, semiquantitative scores, and JSN scores for the 16 joints evaluated. Significant correlations were found between cartilage thickness and semiquantitative score (rho = −0.54, p < 0.001), cartilage thickness and JSN score (rho = −0.63, p < 0.001), and semiquantitative score and JSN score (rho = 0.67, p < 0.001; Figure 2(a)–(c)).

Relationship among semiquantitative scores, cartilage thickness, and JSN scores at baseline. (a) Relationship between total semiquantitative score and cartilage thickness in patients with RA. (b) Relationship between total semiquantitative and JSN scores in patients with RA. (c) Relationship between cartilage thickness and JSN score in patients with RA. Correlations were assessed using Spearman’s rank correlation coefficient (rho), and p-values were adjusted using the Benjamini–Hochberg procedure.
In addition, we examined the relationships between patient characteristics and each of the three imaging measures: semiquantitative scores, cartilage thickness, and JSN scores. Of the three, only cartilage thickness significantly correlated with disease duration (Table 2). Baseline MMP-3 was not significantly correlated with any of the three imaging measures (data not shown).
Correlation between patient characteristics and imaging findings at baseline.

Correlations were assessed using Spearman’s rank correlation coefficient (rho), and p-values were adjusted using the Benjamini–Hochberg procedure.
HAQ-DI data were not obtained for one patient; correlations involving HAQ-DI were based on n = 52.
CRP, C-reactive protein; DAS28, Disease Activity score of 28 joints; HAQ-DI, Health Assessment Questionnaire-Disability Index; JSN, joint space narrowing.
Comparison between the two groups at baseline
The sustained disease activity group and the other group included 10 and 43 patients, respectively (Table 1). Among the 43 patients in the other group, 16 showed improvement from DAS28-CRP ⩾2.7 at baseline to DAS28-CRP <2.7 after 1 year of treatment. No significant differences were observed between the two groups in terms of sex, age, or disease duration, although the sustained disease activity group tended to be older. Indicators of disease activity such as DAS28-CRP, CRP, and MMP-3 were significantly higher in the sustained disease activity group. However, there was no significant difference in seropositivity.
There were no significant differences in the use of methotrexate (MTX), other conventional synthetic disease-modifying antirheumatic drugs (DMARDs), and biologic DMARDs (bDMARDs) between the two groups, although glucocorticoid use was more common in the sustained disease activity group.
The summed cartilage thickness of the 16 joints ranged from 4.4 to 7.1 mm (median, 5.8 mm) in the sustained disease activity group and from 3.1 to 9.1 mm (median, 6.8 mm) in the other group. The sustained disease activity group had significantly lower cartilage thickness than the other group (p = 0.030). In contrast, semiquantitative and JSN scores were numerically higher in the sustained disease activity group compared to the other group (median 8.5 vs 5, p = 0.054; 17 vs 13, p = 0.12, respectively).
Changes after 1 year
The median DAS28-CRP decreased significantly from 2.65 to 1.83 after 1 year (p < 0.001) among all the patients. It improved from 2.28 to 1.65 (p < 0.001) in patients without sustained disease activity, whereas it remained high (from 4.36 to 3.78) in the sustained disease activity group (Table 1). The total JSN scores by CR for the 16 joints remained at a median of 15 at both baseline (IQR 9–19) and after 1 year (IQR 9–20), but there was a significant difference (p = 0.002). No significant correlations were observed between changes in DAS28-CRP and cartilage thickness (rho = −0.06, p = 0.69) or between DAS28-CRP and semiquantitative assessment by US (rho = 0.04, p = 0.77). During the observation period, MTX was continued in 32 patients, initiated in 6, and not used in 15. bDMARDs were continued in 10 patients, newly introduced in 7, discontinued in 2, and not used in 34. Glucocorticoids were continued in six patients, newly started in three, and discontinued in one.
Cartilage changes by ultrasound
Changes in cartilage thickness from baseline to 1 year showed significantly greater thinning in the sustained disease activity group compared to the other group. The median change in the sustained activity group was −6.2% (IQR: −9.1 to −3.2), while it was −1.2% in the other group (IQR: −2.8 to 2.8) (p = 0.004; Figure 3(a)). The Hodges–Lehmann estimated median between-group difference in the rate of change was −5.3% (95% CI, −8.6% to −1.8%). The two groups also differed significantly in the amount of change: −0.4 mm (range: −0.7 to 0.2, IQR: −0.5 to −0.2) and −0.1 mm (−1.0 to 0.5, IQR: −0.2 to 0.2), respectively (p = 0.006; Figure 3(b)). The estimated median between-group difference in the amount of change was −0.3 mm (95% CI, −0.5 to −0.1). However, no significant difference was observed between the two groups in the rate and amount of changes while using a semiquantitative score (21.6% vs 16.7%, p = 0.74; 1 vs 1, p = 0.79, respectively), with estimated median differences of 0% (95% CI, −14.9% to 20.8%) and 0 (95% CI, −1 to 2), respectively (Figure 3(c) and (d)). Similarly, JSN scores did not differ significantly between the two groups (0% vs 0%, p = 0.68; 0 vs 0, p = 0.61, respectively), with estimated median differences of 0% (95% CI, 0%–3.3%) and 0 (95% CI, 0–1), respectively (Figure 3(e) and (f)).

A comparison of changes in imaging findings over 1 year. Changes in the rates of (a, c, e) and amounts (b, d, f) of the sum of cartilage thickness (a, b), the total semiquantitative score (c, d) assessed by ultrasound, and the total joint space narrowing score (e, f) assessed by conventional radiography. Boxes represent the IQR; the line within the box represents the median. Whiskers extend to Q1 (first quartile) − 1.5 IQR and Q3 (third quartile) + 1.5 IQR values.
Intraobserver reliability and SDC
Finally, the validity of changes in cartilage thickness was examined. The intraobserver ICC was 0.993 (95% CI: 0.987–0.997), and the LOA by Bland–Altman analysis was −0.21 to 0.18, with no significant fixed or proportional bias (Figure 4). The SEM and SDC were 0.10 and 0.28, respectively.

Bland–Altman plots for intraobserver agreement. The y-axis shows the difference between the first and second measurements. The x-axis shows the average of the two measurements. The solid line represents the mean difference. The dotted lines represent the limits of agreement (mean ± 1.96 SD).
Discussion
This study is the first to perform a longitudinal evaluation of cartilage destruction using US in patients with RA. Our findings reveal that cartilage loss progressed over 1 year in patients with sustained disease activity. Although radiographic finger JSN did not show significant changes, US measurements revealed a significant reduction in cartilage thickness, suggesting that quantitative US assessment may detect short-term cartilage changes not captured by radiography. However, the semiquantitative score by US was not sufficiently sensitive to detect the progression of cartilage destruction within 1 year.
To date, most studies on cartilage evaluation using US in patients with RA have been cross-sectional, and several studies, including our previous work, 18 have shown a correlation between disease duration and cartilage damage, suggesting the feasibility of assessing cartilage damage over time.26 –28 However, no study has directly examined the progression of cartilage damage longitudinally.
In a 52-week prospective study investigating the predictive factors for response to certolizumab pegol (CZP) treatment, changes in the MCP cartilage at six sites were evaluated using semi-quantitative US. 29 In that study, bDMARD-naïve patients with moderate-to-high disease activity were treated with CZP. Over 52 weeks, the mTSS remained nearly constant, and US assessment showed no significant cartilage changes despite ongoing treatment. Another study aimed to develop a comprehensive US scoring system that included cartilage assessment in four MCP joints and validated US scores by examining their correlation with various clinical parameters over 12 months in untreated patients with early RA. 30 The semiquantitative score of cartilage damage (0–4) showed a numerical increase, whereas the binary (present or absent) assessment showed a significant worsening of cartilage damage. However, these changes did not correlate with changes in DAS28 or HAQ-DI scores. Similarly, our study found no significant correlations between changes in DAS28-CRP and either changes in ultrasonographic cartilage thickness or semiquantitative assessments over 1 year, except for the decrease in cartilage thickness by 0.4 mm in patients with sustained disease activity, which was significantly different from the other group (Table 1 and Figure 3).
The OMERACT semi-quantitative score system used in this study is valid and reliable; however, it employs a 3-graded scale from 0 to 2, which may lack the sensitivity needed to detect subtle changes in cartilage over time. By comparison, the mTSS for JSN is a 5-graded scale from 0 to 4, and the MRI score is a 5- or 9-graded scale. 6 In fact, a study by the OMERACT Task Force evaluating the reliability of semiquantitative methods for cartilage assessment in osteoarthritis using a 4-point scale showed poor agreement, particularly for intermediate scores. 31 Therefore, a more finely graded rating is expected to improve the sensitivity by capturing smaller changes over a similar range of cartilage damage. However, a multistep evaluation requires a more detailed evaluation, which may not be feasible.
There have been only three reliability evaluations of quantitative assessments of cartilage thickness in MCP joints.8,26,32 Although both inter- and intraobserver reliabilities have been shown to be high, these are single-center studies involving up to three examiners. In our study, we assessed the intra-observer reliability as a single examiner performed the measurements and found a high-reliability coefficient of 0.993 for 16 joints, with an SDC of 0.28 mm. This was higher than the previously reported intraobserver SDC of 0.06 mm for the 16-joint total, 26 but the change in the sustained disease activity group exceeded the threshold. Per joint, minimum detectable differences between and within the examiners have been reported to be 0.09 mm, 32 highlighting the need for further examination of its reliability.
Additionally, the evaluation time is important for feasibility, yet quantitative methods are time-consuming. 28 In this study, the time required to visualize cartilage images of 16 joints with US, from patient positioning through image acquisition, had a median of 5.3 min (range, 2.9–12.8 min). This duration is comparable to that reported in previous studies and is sufficiently brief for incorporation into routine clinical assessments. 12 However, in our study, the images were analyzed with imaging software to minimize measurement errors. Although we did not measure the actual time, it takes longer than semiquantitative evaluation, posing a challenge for actual clinical implementation. New technologies, including automated measurements, may therefore become necessary in the future. 33
Furthermore, there are individual differences in cartilage thickness, which depends on age and other factors. 34 However, this variability may not be as important when examining longitudinal changes compared to the degree of cartilage damage in cross-sectional evaluations.
Limitations
This study has limitations. First, this retrospective study used observational data from a single center, and the sample size was limited by the number of eligible cases in our institutional database. In addition, because prior studies on ultrasound-based cartilage changes are scarce, it was difficult to estimate an appropriate effect size in advance, and a theoretical sample size calculation could not be performed. Reliability assessments were also performed based solely on images stored by the same examiner. Therefore, these limitations may affect the generalizability of our findings. Second, because the data (images and measurement data using a 14-MHz probe) were previously used, a more detailed evaluation may be possible with current high-end instruments. However, this also suggests that conventional ultrasound systems can evaluate cartilage changes over time without using high-end instruments. Third, cartilage changes were not evaluated for each joint individually but for all 16 joints collectively. Therefore, the presence or the absence of joint-level synovitis and localized cartilage destruction in each joint could not be evaluated and will be the subject of future studies.
Conclusion
In conclusion, sustained disease activity in RA is associated with progressive cartilage damage. In addition, US assessment of articular cartilage thickness in patients with RA supports its validity and usefulness in evaluating cartilage damage and merits further investigation as a tool to assess joint destruction.
Supplemental Material
sj-docx-1-tab-10.1177_1759720X251414604 – Supplemental material for Ultrasound evaluation of finger joint cartilage damage progression in patients with rheumatoid arthritis
Supplemental material, sj-docx-1-tab-10.1177_1759720X251414604 for Ultrasound evaluation of finger joint cartilage damage progression in patients with rheumatoid arthritis by Takehisa Ogura, Chihiro Imaizumi, Ayako Hirata, Yasuto Minegishi, Hideki Ito, Sayaka Takenaka, Takaharu Katagiri, Yuto Takakura, Reina Maezawa and Hideto Kameda in Therapeutic Advances in Musculoskeletal Disease
Footnotes
References
Supplementary Material
Please find the following supplemental material available below.
For Open Access articles published under a Creative Commons License, all supplemental material carries the same license as the article it is associated with.
For non-Open Access articles published, all supplemental material carries a non-exclusive license, and permission requests for re-use of supplemental material or any part of supplemental material shall be sent directly to the copyright owner as specified in the copyright notice associated with the article.