
Abstract
Background:
Since dual-energy x-ray absorptiometry (DXA) is currently the most commonly used reference standard, most previous studies using computed tomography (CT) attenuation values to predict osteoporosis have chosen abdominal CT images. A few studies have investigated whether the thoracic vertebrae can be independently used for the identification of osteoporosis compared to the lumbar vertebrae.
Objective:
To investigate whether the attenuation values of thoracic vertebrae measured using artificial intelligence (AI) on chest CT would independently predict osteoporosis identification, considering central DXA as a reference standard.
Design:
This was a cross-sectional study.
Methods:
A total of 553 participants (353 men and 200 women) who underwent chest CT and DXA within 1 day were included. The attenuation values (HU) of the T7–12 vertebrae and L1 vertebra were obtained by AI. The effects of the clinical baseline data and attenuation values among the normal, osteopenia, and osteoporosis groups were compared. The correlation between attenuation and bone mineral density (BMD) values was analyzed, and the diagnostic performance of thoracic and first lumbar vertebrae attenuation values for diagnosing osteopenia or osteoporosis was further explored.
Results:
The CT attenuation values of T7–12 and L1 vertebrae showed positive correlation with T-score (R = 0.58–0.61, p < 0.01). T12 attenuation >184.8 HU was 84.1% sensitive and 70.6% specific for distinguishing normal BMD, while T12 attenuation <146.2 HU was 61.4% specific and 75.6% sensitive for distinguishing osteoporosis from osteopenia. There were no significant differences between the T10–12 and L1 groups in distinguishing the normal, osteopenia, and osteoporosis groups. Moreover, the diagnostic efficacy among the T10, T11, T12, and L1 vertebral bodies was not statistically significantly different among the three groups.
Conclusion:
Opportunistic screening is a valid method for predicting osteopenia or osteoporosis. As a rapid and effective tool, T10–12 vertebral attenuation measures can be incorporated to predict osteoporosis and identify patients who may benefit from further investigations using DXA based on routine clinical chest CT examinations.
Keywords
Introduction
Osteoporosis, which is characterized by low bone mass and microarchitectural deterioration of bone tissue, is a prevalent and latent metabolic bone disease with a consequent increase in bone fragility and susceptibility to fractures. 1 Osteoporotic fractures are a major contributor to late-life morbidity and mortality and impose a substantial societal cost; however, in global clinical practice, osteoporosis remains substantially underdiagnosed and undertreated. 2 With the progressively aging population, the number of patients in China with osteoporosis or osteoporotic fractures by 2050 is projected to reach approximately 212 million and 5.99 million, respectively. 3
According to the World Health Organization, the most commonly used reference standard currently for the diagnosis of osteoporosis is dual-energy x-ray absorptiometry (DXA) scanning. 4 Studies have demonstrated that approximately 80%–90% of adults do not receive appropriate osteoporosis treatment even in the secondary prevention setting. 5 There are multifactorial barriers, including knowledge deficits, a lack of referral to metabolic bone specialists, and declining financial support for screening. 6 Osteoporosis should be diagnosed at an early stage, and anti-osteoporotic therapy should be initiated in patients at risk to prevent osteoporotic fractures.
Alternative screening techniques such as computed tomography (CT) are increasingly considered for opportunistic osteoporosis screening.7,8 Chest CT is popularly used for the screening of early lung cancer and has been demonstrated to reduce mortality from lung cancer significantly. Compared with DXA, bone attenuation measured from chest CT circumvents degenerative changes in the spine and can better reflect trabecular bone microstructure. 9 The integration of artificial intelligence (AI) in opportunistic screening automates the manual tasks required to detect patients at risk of osteoporosis and osteopenia, thus presenting a transformative opportunity and further offering a cost-effective, efficient, and non-intrusive detection modality. 10 This is an important basis for implementing an opportunistic osteoporosis screening that can measure spinal bone attenuation from CT in a fully automated manner.
Since the widely accepted World Health Organization definition of osteoporosis is based on the DXA T-score, this measure must serve as the reference standard to compare and validate other bone mineral density (BMD) modalities. 11 Since most of the previous studies measured BMD and bone attenuation at the lumbar spine, data testing whether osteoporosis and osteopenia can also be well predicted using measured data at the thoracic vertebrae are limited.
The first purpose of this study was to examine whether BMD from the thoracic vertebrae independently predicts osteoporosis and to further demonstrate that, in screening for osteoporosis, the thoracic vertebrae are not inferior to the lumbar vertebrae. The secondary aim of this study was to establish osteoporosis diagnostic thresholds for the thoracic spine on chest CT using DXA as the reference standard. To our knowledge, few studies have investigated whether the thoracic vertebrae can be independently used for the identification of osteoporosis.
Materials and methods
Study design and patient population
Participants
Digital medical records were retrospectively searched to identify consecutive patients who underwent both DXA and chest CT plain scans on the same day as part of a physical examination at the Fudan University Affiliated Zhongshan Hospital (Xiamen) from August 2020 to November 2023. Vertebral body with Genant score ⩾1 at T7-L1 were excluded to prevent distortion of the attenuation values. 12 All patients with oncologic, hematologic, known metabolic bone, or chronic kidney diseases were excluded. All the image data had a craniocaudal resolution of 1 mm, which was a prerequisite for AI (uAI-Discover PLBMD; United Imaging Intelligence, Shanghai, China) used in this study. The reporting of this study conforms to the Strengthening the Reporting of Observational Studies in Epidemiology (STROBE) statement. 13
Data collection
In this study, unenhanced chest CT and DXA data from radiological information systems were screened to identify eligible participants. A total of 678 patients who underwent health examinations at the physical examination center of Fudan University Affiliated Zhongshan Hospital (Xiamen) were included. Following this, 125 patients were excluded due to the following conditions: (1) patients whose clinical baseline data were unavailable (n = 84), (2) interval between chest CT and DXA >1 day (n = 41). Finally, 553 participants’ data were included in this study, among whom 412 patients underwent chest CT of the L1 vertebra (Figure 1). The attenuation values (HU) of the T7–12 and L1 vertebral bodies were measured using AI.

Flowchart of patient inclusion and grouping.
Diagnostic criteria for osteoporosis
DXA is considered the gold standard for the assessment of BMD. Based on the lowest DXA T-score of the lumbar spine, total hip, or femoral neck, postmenopausal women and men aged above 50 years were stratified into osteoporosis, osteopenia, or normal BMD groups. 14 T value >−1.0 standard deviation (SD), −1.0 ⩾ T value ⩾ −2.5 SD, and <−2.5 SD were considered normal, osteopenia, and osteoporosis, respectively. For premenopausal women and men aged under 50 years, a Z value below −2.0 indicates osteopenia, while that above −2.0 indicates normal bone mass. 15
Image acquisition
DXA and CT scan technique
The BMD was examined using a GE Lunar Prodigy scanner. Areal BMD of the lumbar spine (L1–L4 vertebrae, AP position) and the left proximal femur (femoral neck and total hip regions) were utilized on a DXA scanner (Horizon™, Hologic, USA). The scans were performed by trained technologists, and the DXA images were reviewed by experienced physicians to ensure the reliability of the results.
Unenhanced chest CT scans were performed at our institute using three different scanners (United Imaging Healthcare, Toshiba, GE). Scanning parameters for chest CT were as follows: tube current: automatic adjustment; tube voltage, 120 kVp; effective tube current, 30–40 mAs; layer thickness: 5-mm section collimation; and a standard reconstruction interval of 1 mm. To ensure accurate CT attenuation numbers for the vertebrae, the CT scanners used in this study underwent routine daily quality assurance calibration.
Post-processing of CT images
The musculoskeletal module of AI performed the automated computation of the spinal location and corresponding CT values. The content of automated AI software is mainly divided into two parts. Firstly, the algorithm recognizes the spine and labels each vertebral body. Secondly, the representative HU within the region of interest (ROI) in the corresponding vertebra was computed (Figure 2). The vertebral body ROI was defined as a cylinder, placed in the anterior trabecular region, posteriorly avoiding the basivertebral venous plexus, the surrounding cortical bone, and any focal lytic or sclerotic lesion. Factors leading to changes in vertebral BMD measurements, such as fractures, hemangiomas, and focal sclerotic or lytic lesions, were excluded from the study.

Schematic diagram of attenuation value measured by AI. (a, b) Show AI recognized the spine, and labels each vertebral body in sagittal and coronal reformatted images. In (c), a three-dimensional schematic of the thoracic vertebral body segmented by AI was displayed. (d) Shows the cylindrical ROI as a green oval from the transverse view. (e, f) Shows the cylindrical ROI as green rectangles from the sagittal and coronal views.
Statistical methods
To test whether continuous variables follow a normal distribution, Shapiro–Wilk’s test was used. Continuous variables are presented as mean ± standard deviation or median (interquartile range), depending on the normality of the distribution. The differences of continuous variables among multiple groups were tested by the ANOVA test (normal distribution) and Kruskal–Wallis test (non-normal distribution), and Tukey’s HSD test was used for pairwise comparison between groups. The difference in classification data was tested by the Chi-square test. This study divided the T7–12 vertebrae into two groups, T7–9 and T10–12, 16 and the diagnostic efficacy of T7–9, T10–12, T7–12, and L1 for identifying osteopenia or osteoporosis was compared. Except for the excluded vertebrae, all available vertebral values in the four groups were expressed as averages.
The correlations among age, body mass index (BMI), DXA T-scores (lowest DXA T-score of the femoral neck, total hip, and first to fourth lumbar vertebrae), and CT values (of T7–T12 thoracic vertebrae and first lumbar vertebrae) were analyzed. The Spearman correlation coefficient was calculated. To evaluate the diagnostic efficacy of CT values in identifying osteopenia or osteoporosis, receiver operating characteristic (ROC) curves were used, and the AUCs were further compared with the DeLong method. p < 0.05 was considered significant. SPSS 22.0 software (IBM, Armonk, NY, USA) and MedCalc 20.022 (Mariakerke, Belgium) were used to conduct the statistical analyses.
Results
Clinical characteristics
The study included 553 participants, comprising 353 men and 200 women. The mean ages of the male and female participants were 50.11 ± 10.70 and 49.53 ± 10.07 years, respectively. There were 411 (74.3%) participants whose chest CT scans covered the L1 vertebra, and 142 (25.7%) participants whose chest CT scans did not cover the L1 vertebra. The demographic and clinical characteristics of the participants are presented in Table 1, including age, BMI, and CT values among the normal, osteopenia, and osteoporosis groups, respectively. Age increased in the normal, osteopenia, and osteoporosis groups, and differences in age among the three groups were statistically significant. No significant difference in BMI was observed among the three groups (Table 1).
The distribution and differences of clinical baseline data and CT values among the normal group, osteopenia group, and osteoporosis group.
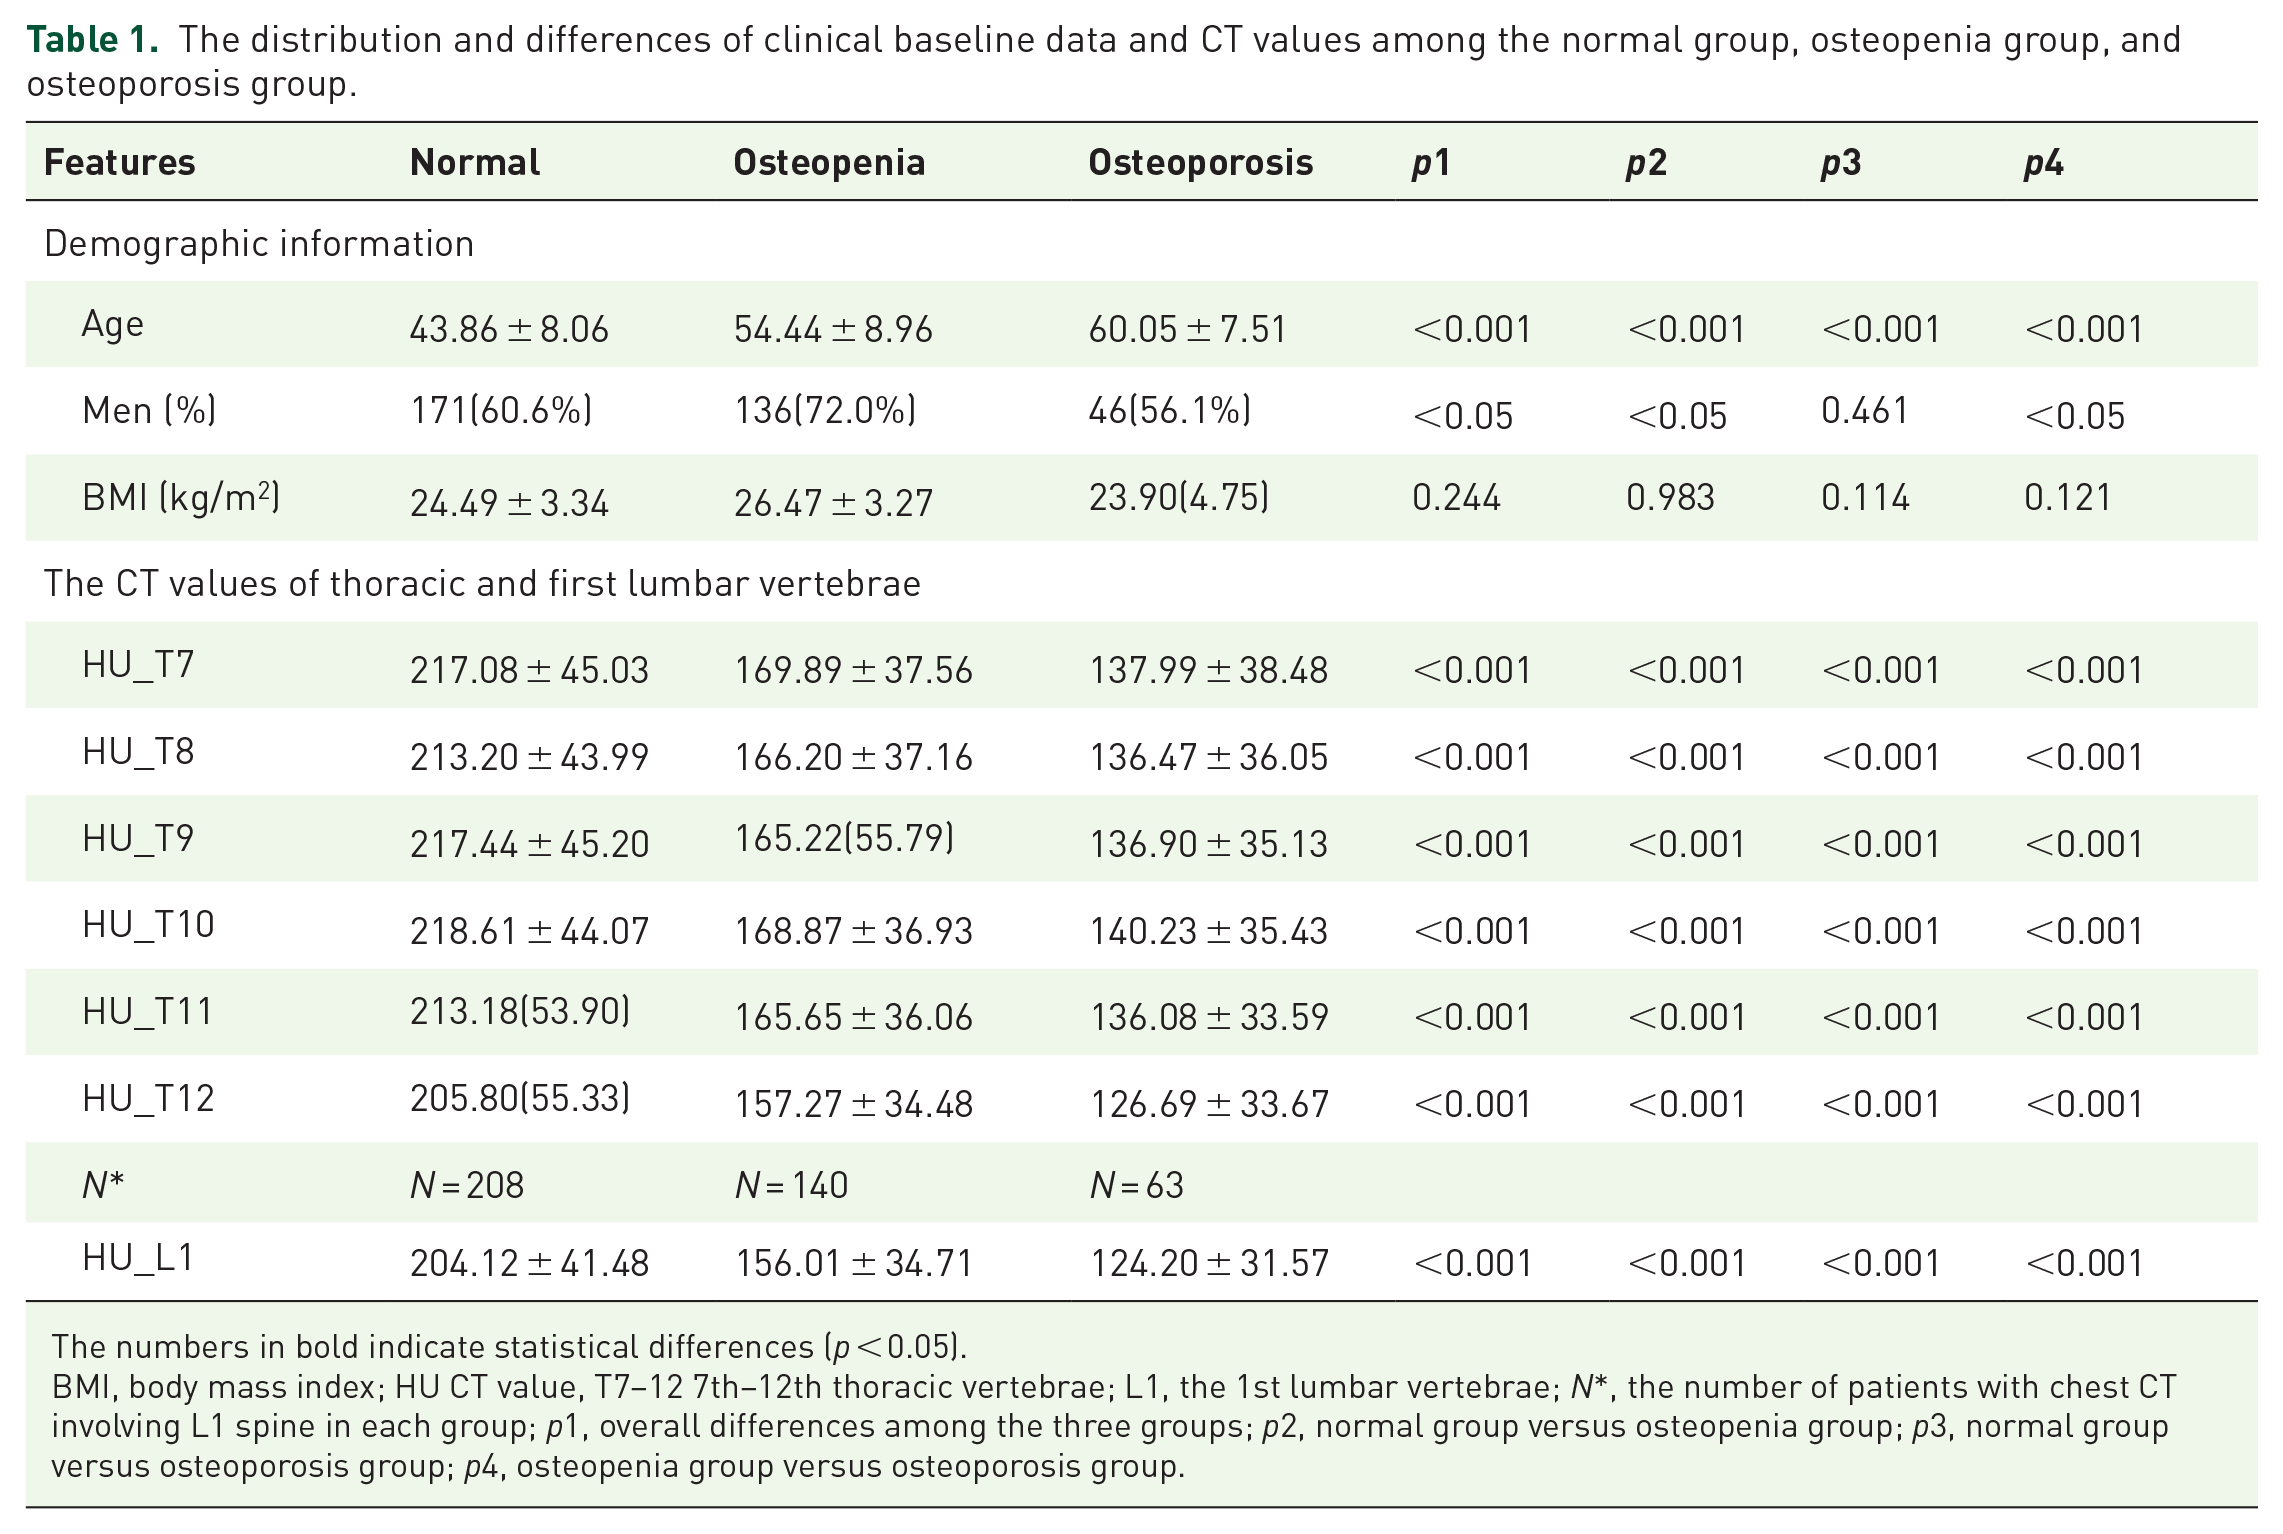
The numbers in bold indicate statistical differences (p < 0.05).
BMI, body mass index; HU CT value, T7–12 7th–12th thoracic vertebrae; L1, the 1st lumbar vertebrae; N*, the number of patients with chest CT involving L1 spine in each group; p1, overall differences among the three groups; p2, normal group versus osteopenia group; p3, normal group versus osteoporosis group; p4, osteopenia group versus osteoporosis group.
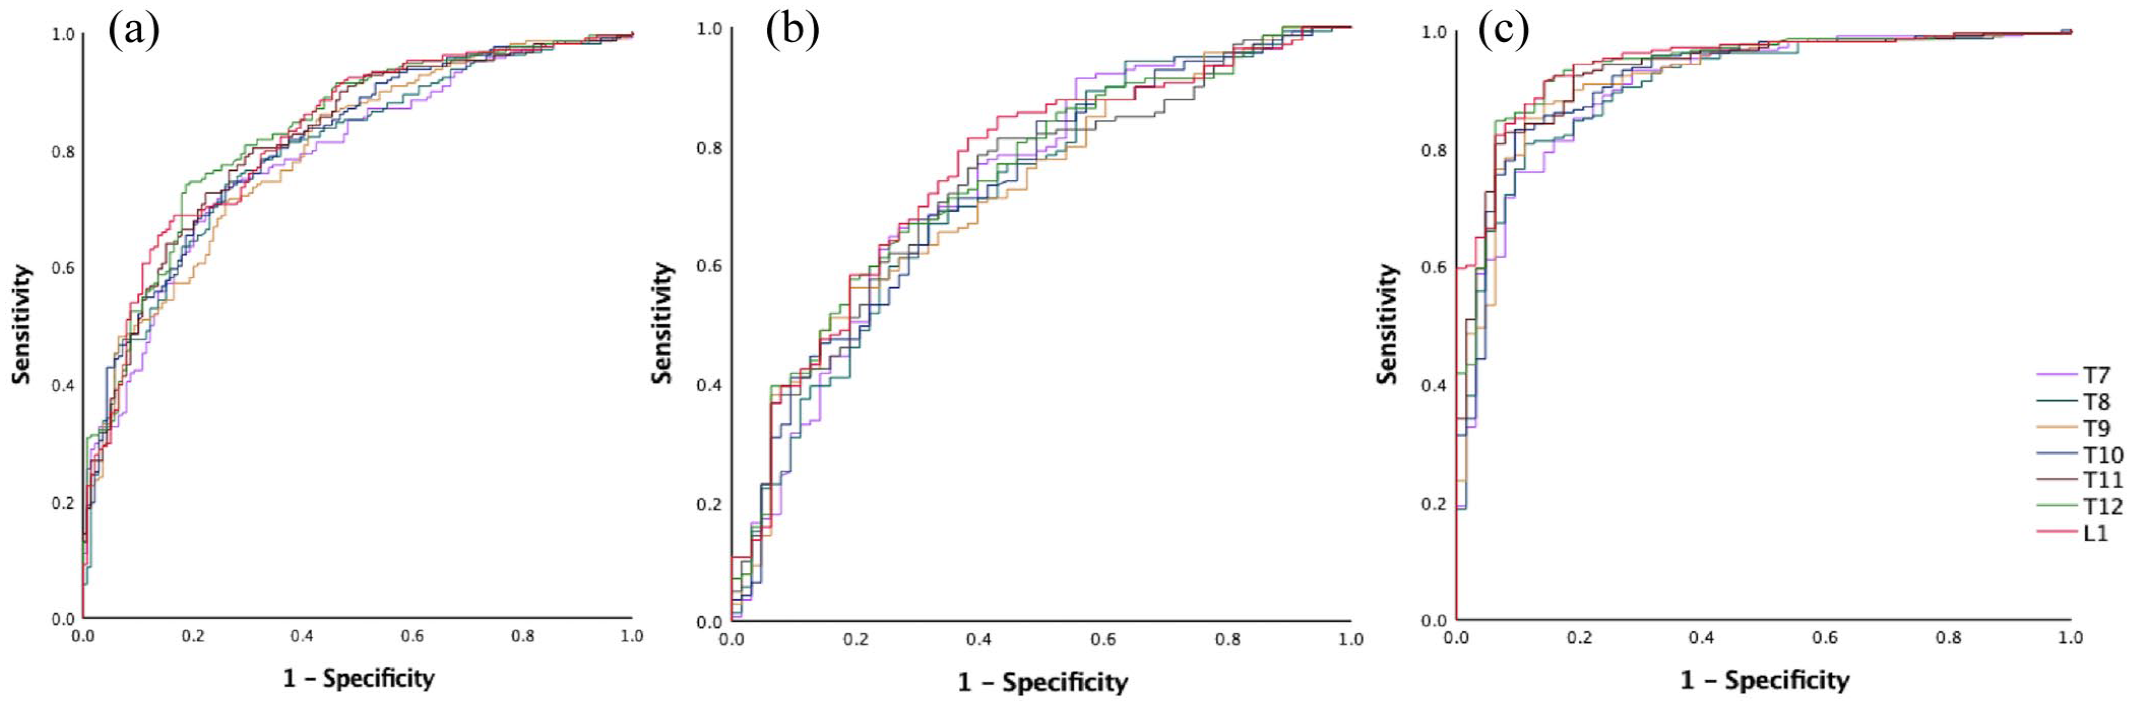
The CT values of six thoracic vertebrae (T7–T12) and L1 vertebra among the three groups or between any two groups were significantly different (p < 0.01). The CT values were decreased successively in the normal, osteopenia, and osteoporosis groups (Table 1, Figure 3).

The distribution differences of CT values of T7–12 thoracic vertebrae and first lumbar vertebra among the normal group, osteopenia group, and osteoporosis group. (a) Normal group. (b) Osteopenia group. (c) Osteoporosis group.
Correlation among age, T-scores, and CT values
Age was negatively correlated with the T-scores of the lumbar spine and total hip (R = −0.23 to −0.55, p < 0.01). Similarly, age was negatively correlated with CT values of thoracic (T7–T12) and L1 vertebra (R = −0.46 to −0.60, p < 0.01). Moreover, the highest correlation value with age was noted in the L1 vertebra (R = −0.60). The CT values of vertebrae were positively correlated with the T-score (R = 0.58–0.64, p < 0.01). The average attenuation of the thoracic vertebrae exhibited a strong correlation with the T-score of the total hip (R = 0.60–0.64, p < 0.01). A relatively strong correlation between the CT values at T12 and the T-scores of the total hip was observed (R = 0.64, p < 0.01). Moreover, the correlation coefficient between the CT value and the T-score of L1 vertebra was 0.63 (p < 0.01; Figure 4).

Correlation of age, T-score, and CT values. (a, b) Showing the scatter plots of CT values and BMD with age as the independent variable. (c, d) Showing the scatter plots, CT values of thoracic vertebrae, and the first lumbar vertebra as the independent variable, with BMD at different positions as the dependent variable.
Diagnostic performance of CT values in distinguishing osteopenia and osteoporosis
ROC curves were created to assess the discrimination of thoracic (T7–T12) and L1 vertebrae in predicting osteopenia and osteoporosis. The CT values of each thoracic vertebra and the L1 vertebra effectively identified osteopenia or osteoporosis. The AUC of the CT values for distinguishing osteopenia from the normal group was 0.791–0.833, the specificity was 70.6%–83.5%, and the sensitivity was 65.1%–84.1%. Moreover, the AUC of the CT values for distinguishing osteoporosis from the normal group was 0.911–0.944, and the AUC of the CT values for distinguishing osteoporosis from the osteopenia group was 0.716–0.755. The specificity was 80.1%–91.4% and 51.9%–85.2%, while the sensitivity was 85.7%–95.1% and 48.8%–82.9%, respectively. A threshold of 129.7 HU at L1 was 61.9% specific and 81.3% sensitive for distinguishing osteoporosis from osteopenia (Table 2, Figure 5).
Evaluation of the predictive effect of the CT values on risk of osteopenia and osteoporosis by ROC.

CI, confidence interval; CT, computed tomography; ROC, receiver operating characteristic.
The receiver operating curve for predicting DXA-defined osteopenia and osteoporosis using CT attenuation values. (a) Normal versus osteopenia. (b) Osteopenia versus osteoporosis. (c) Normal versus osteoporosis.
For pairwise comparisons of the ROC curves, the AUCs of the CT values for identifying osteoporosis from the osteopenia group were not significantly different between the T7–9 and T10–12 groups. For differentiating the osteopenia and osteoporosis groups from the normal group, the T10–12 group was better than the T7–9 group. When T7–12 and L1 were compared, the diagnostic efficiency of L1 was better than that of the T7–12 group for differentiating osteoporosis from the normal groups, and no statistically significant difference in AUC values was observed between the normal and osteopenia groups, or between the osteopenia and osteoporosis groups. There were no significant differences between the T10–12 and L1 groups in distinguishing between the normal, osteopenia, and osteoporosis groups.
Discussion
Key findings of this study
Osteoporosis represents a major public health issue, with a high incidence but low detection rate. It can cause osteoporotic fractures and other serious consequences if not detected in time. The present findings have validated the use of opportunistic screening for osteopenia or osteoporosis with chest CT. This will be conducive to improving the detection rate of osteoporosis and reducing the occurrence of adverse events such as osteoporotic fractures. To the best of our knowledge, few studies have demonstrated that thoracic vertebrae are not inferior to lumbar vertebrae in osteoporosis screening.
Osteoporosis is generally asymptomatic; therefore, most patients are less likely to undergo DXA, leading to the underdiagnosis and undertreatment of osteoporosis. 17 Lung cancer is the leading cause of cancer-related death globally. Clinical trials have demonstrated lower lung cancer-related mortality in patients screened with low-dose CT. 18 Therefore, a large number of people undergo chest CT examinations for lung cancer screening every year in China. 19 Since the ages of the high-risk group of osteoporosis are close to lung cancer screening populations, and the chest CT scan parameters are relatively fixed, it makes it an economical and safe method for osteoporosis screening. Opportunistic assessment of osteoporosis is of high interest in the clinical setting, considering that it can be used to screen for osteoporosis simultaneously with no extra equipment, patient time, costs, or radiation exposure. 7 Furthermore, vBMD data can be acquired retrospectively from the CT data. Consequently, particularly in countries or localities with limited access to DXA, this method could be applied to a wider range of osteoporosis screening, including those who are not usually part of the targeted screening programs. This approach is of particular relevance in China because of the greater access to CT than DXA. 19
Several studies have been conducted previously to determine the threshold of HU on lumbar vertebral CT for the diagnosis of osteoporosis. Pickhardt et al. 20 used DXA as the gold standard among a large cohort and established an optimal threshold of 135 HU at L1 for osteoporosis with an ROC of 0.83. Other similar studies reported that the optimal thresholds for diagnosing osteoporosis were 99,21,22 90, 23 and 112.4 HU. 24 Lee et al. 25 reported that the threshold for the mean value of L1–L4 was 60 HU. Therefore, the HU threshold for predicting osteoporosis in the aforementioned studies varies, with thresholds ranging from 60 to 135 HU. Similar to the threshold range obtained in previous studies, this study provided an optimal cut-off for CT attenuation <129.7 HU at L1 for the detection of osteoporosis. The differences in equipment, reconstruction parameters, and population differences, such as race, sex, and age, could partly explain the difference in thresholds.
Most previous studies that used CT attenuation values to predict BMD had selected abdominal CT images because the use of DXA to assess spinal BMD is recommended for lumbar spine implementation.26–28 The official positions of the International Society for Clinical Densitometry recommend that L1–L2 should be scanned for three-dimensional quantitative CT (QCT). 29 Data assessing whether osteoporosis is well identified using measurements recorded at the thoracic vertebrae are limited.
The chest CT scan range is from the thoracic inlet to the costophrenic angle level. During the chest CT examination, participants needed to hold their breath after inhaling. Because of the degree of inhalation and individual differences, conventional chest CT scans do not necessarily include L1. In this study, 142 scans of 553 (25.7%) participants did not cover L1. Since thoracic and thoracolumbar vertebral bodies are common sites of osteoporosis complicated with compression fractures, 30 vertebral HU measurements should be performed on routine thoracic CT images in high-risk groups.
Recent studies have investigated the risk of incident vertebral fracture via thoracic QCT. The potential use of opportunistic QCT was expanded to the thoracic region using cardiac CT scans.31,32 Several studies have shown that CT bone measurements of a single thoracic or lumbar spine, such as T10 and L3, T8 and L2, have the same predictive ability for incident fractures, regardless of the location of the fracture.33–35 Wang et al. found no statistically significant differences between the CT attenuation values of T12 versus L1 and L1 versus L2. Therefore, they recommend evaluating the BMD using CT bone measurements of the T12 or L1 vertebral body in a routine thoracic CT scan. 30 This finding is consistent with the results of the present study, which demonstrated that the CT attenuation values of both the thoracic and lumbar vertebrae can predict osteoporosis and the risk of fractures equally well.
Wasnich et al. 36 observed that most osteoporotic vertebral fractures occurred in the thoracolumbar spine, such as T8 or between T11 and L1. As prior reported, fractures at levels T6–T10 and T11–L4 were classified as “thoracic” fractures and “thoracolumbar” fractures, respectively, which were defined on the basis of epidemiology and biomechanical factors. 33 First, compared with the thoracic levels above, the T11 and T12 vertebral levels have floating ribs that do not assist in supporting loads at these levels, causing these levels to be more mobile. Therefore, T11 and T12 biomechanically behave more similarly to the lumbar levels than to the thoracic levels above from a mechanical point of view. 34 Second, the occurrence of vertebral fracture has a bimodal distribution along the spine,33,37,38 and this division separates the two peaks in the incidence of fractures.
This study demonstrated that the combined diagnostic efficacy of the T10–12 vertebra, which is a type of thoracolumbar, for the diagnosis of osteopenia or osteoporosis was superior to that of T7–9 vertebra. Moreover, for differentiating the osteoporosis group from the normal group, the T10–12 vertebral attenuation was better than T7–12. The lower the thoracic vertebra is, the better the diagnostic effect of osteoporosis. The ROC curves of thoracic and lumbar vertebral attenuation were further compared, and no significant differences were found between the T10–12 and L1 vertebral attenuation in distinguishing between the normal, osteopenia, and osteoporosis groups. Moreover, the diagnostic efficacies of the T10, T11, T12, and L1 vertebral bodies were compared separately, and no statistically significant differences were detected among the three groups. These results suggest that equivalent to L1, T10–12 vertebral attenuation can also be used to predict osteoporosis.
In summary, this study has several advantages. First, our AI system can achieve fully automated vertebral body labeling, segmentation, and CT attenuation value measurement without manual operation. Second, this study was restricted to participants who underwent CT and DXA examinations within only 1 day, which makes differences between CT and DXA less likely. Third, since the scanning parameters used were consistent with the diagnostic imaging parameters, our results further demonstrated the practical significance of using conventional CT scans for osteoporosis screening.
This study has a few limitations. First, this was a retrospective, single-center study, and the generalizability of our results may have been somewhat limited. Future prospective multicenter studies with considerably larger datasets should be conducted. Second, chest CTs were performed on multiple CT scanners, which may impact CT values and need to be calibrated in subsequent studies to provide accurate thresholds. Third, because this study included only people who had a health checkup, the cohort may not be completely representative due to the lack of a low-income population.
Conclusion
Opportunistic screening on the basis of clinical routine chest CT examinations is a valid method for predicting osteopenia or osteoporosis and identifying patients who may benefit from further investigation via DXA. This study demonstrated that thoracic attenuation measurements can serve as a quick reference for bone health in patients. Moreover, T10–12 vertebral attenuation measurements are not inferior to those of the lumbar vertebrae in osteoporosis screening.
Supplemental Material
sj-docx-1-tab-10.1177_1759720X251374134 – Supplemental material for Comparison of thoracic vertebrae and L1 CT attenuation in predicting osteoporosis using opportunistic chest CT
Supplemental material, sj-docx-1-tab-10.1177_1759720X251374134 for Comparison of thoracic vertebrae and L1 CT attenuation in predicting osteoporosis using opportunistic chest CT by Lilan Wu, Shunfa Huang, Liling Xu, Shengxiang Rao, Zhen Qian, Mengze Zhang, Ying Yuan and Jianjun Zhou in Therapeutic Advances in Musculoskeletal Disease
Footnotes
References
Supplementary Material
Please find the following supplemental material available below.
For Open Access articles published under a Creative Commons License, all supplemental material carries the same license as the article it is associated with.
For non-Open Access articles published, all supplemental material carries a non-exclusive license, and permission requests for re-use of supplemental material or any part of supplemental material shall be sent directly to the copyright owner as specified in the copyright notice associated with the article.