
Abstract
Background:
The spleen, the largest secondary lymphoid organ, plays an essential role in systemic immune regulation. Its function in tumor progression and treatment response has gained increasing attention.
Objectives:
This study aimed to evaluate the prognostic value of spleen volume (SV) change in patients with extensive-stage small-cell lung cancer (ES-SCLC) receiving first-line chemo-immunotherapy (CIT) and to explore its associations with tumor-infiltrating lymphocytes (TILs) and peripheral immune parameters.
Design:
A single-center retrospective cohort study.
Methods:
A total of 292 ES-SCLC patients who received first-line CIT were retrospectively analyzed. SV was measured on baseline and post-treatment CT scans, and the relative change was used to classify patients into increased or decreased SV groups. Cox proportional hazards regression models were used to assess the effects of SV metrics, immune-related indices, and clinicodemographic factors on overall survival (OS) and progression-free survival (PFS). Objective response rate (ORR) differences were tested using the chi-square test, and immune parameters were compared using Wilcoxon rank-sum tests and correlation analyses.
Results:
Multivariate analysis identified increased SV after CIT as an independent adverse prognostic factor for both OS (hazard ratio (HR) = 1.561, 95% confidence interval (CI), 1.193–2.041, p = 0.001) and PFS (HR = 1.411, 95% CI, 1.106–1.800, p = 0.006). Patients with increased SV exhibited significantly shorter OS and PFS and a lower ORR (all p < 0.005). Increased SV was also associated with markedly lower total, CD4+, and CD8+ TIL densities and, at the systemic level, lower absolute lymphocyte count (ALC), and higher neutrophil-to-lymphocyte ratio (NLR) and platelet-to-lymphocyte ratio (PLR) (all p < 0.0001), indicating both local and systemic immune suppression.
Conclusion:
SV change reflects both local and systemic immune remodeling during CIT in ES-SCLC. As a noninvasive and measurable imaging biomarker, SV change holds translational potential for immune monitoring and treatment response assessment.
Plain language summary
The spleen is an important organ that helps regulate the immune system in the body. In people with cancer, changes in spleen size may reflect how the immune system responds to treatment. In this study, we investigated whether changes in spleen volume could predict treatment outcomes in patients with extensive-stage small-cell lung cancer (ES-SCLC) receiving first-line chemotherapy combined with immunotherapy. We reviewed the medical records and CT scans of 292 patients treated at our hospital. Spleen volume was measured on CT scans before treatment and after treatment. Patients were divided into two groups: those whose spleen volume increased and those whose spleen volume decreased. We then analyzed the relationships between spleen volume change, treatment response, survival, and immune-related indicators measured in blood and tumor tissue. We found that patients whose spleen volume increased after treatment had shorter survival and poorer treatment responses. These patients also showed signs of weaker anti-tumor immunity, including fewer immune cells within tumors and lower lymphocyte levels in the blood, along with higher levels of inflammation-related markers. These results suggest that changes in spleen size may provide a simple sign of how the immune system is functioning during treatment. Measuring spleen volume on routine CT scans could help clinicians monitor immune status and estimate treatment effectiveness in patients with ES-SCLC.
Keywords
Introduction
Small-cell lung cancer (SCLC) is a highly aggressive malignancy accounting for approximately 15% of all lung cancers. Nearly 70% of patients present with extensive-stage SCLC (ES-SCLC) at diagnosis, and the 5-year survival rate remains below 1%.1,2 In recent years, the addition of immune checkpoint inhibitors (ICIs), such as programmed death-ligand 1 (PD-L1) or programmed death-1 inhibitors, to standard chemotherapy has significantly improved overall survival (OS) and progression-free survival (PFS), establishing chemo-immunotherapy (CIT) as the standard first-line treatment for ES-SCLC. 2 However, therapeutic responses to immunotherapy vary substantially among patients, and reliable biomarkers to evaluate efficacy and prognosis are still lacking. Although PD-L1 expression and tumor mutational burden are commonly used biomarkers, several studies have shown that neither effectively stratifies SCLC patients receiving CIT.3,4
The spleen is a key immunologic hub shaping systemic immune regulation and hematopoietic activity. It is also a major site of extramedullary hematopoiesis (EMH), generating myeloid-derived suppressor cells (MDSCs) and other immune components that can enter the circulation and influence the tumor microenvironment.5,6 Accordingly, tumor-associated myeloid expansion may be accompanied by splenic enlargement measurable on routine CT, 7 and spleen volume (SV) changes may reflect systemic immune-cell remodeling relevant to tumor progression and immune escape.6,8 In addition, chronic tumor-associated inflammation can induce tertiary lymphoid structures (TLSs), which share key architectural and functional features with secondary lymphoid organs9,10 and have been linked to antitumor immunity and ICI response.11,12 TLS-associated immune priming may influence the balance and trafficking of regulatory versus effector T cells between tumors and the peripheral circulation, potentially shaping peripheral immune parameters. 13 Our previous studies demonstrated that splenic radiomic features and SV dynamics have prognostic significance in locally advanced esophageal and cervical cancers,14,15 prompting us to investigate whether SV dynamics during first-line CIT are linked to immune remodeling and clinical outcomes in ES-SCLC.
Tumor-infiltrating lymphocytes (TILs), primarily composed of CD4+ and CD8+ T cells, reflect local immune activity. CD4+ T cells drive immune activation by recognizing MHC class II molecules and providing helper signals, whereas CD8+ cytotoxic T cells mediate direct tumor cell killing.16–19 Higher TIL density has been consistently associated with improved prognosis and treatment response across SCLC and other malignancies.20,21
In addition to intratumoral immunity, peripheral blood immune parameters may reflect systemic immune function. Several hematologic indices, including absolute lymphocyte count (ALC), neutrophil-to-lymphocyte ratio (NLR), and platelet-to-lymphocyte ratio (PLR), have been associated with tumor aggressiveness and patient outcomes. 22 In SCLC, particularly, elevated NLR has been consistently linked to poor prognosis.23,24
CT-based SV provides a noninvasive and readily available means of linking routine imaging with host immune status. Therefore, we conducted a retrospective study to evaluate the prognostic value of SV change during first-line CIT in ES-SCLC and to examine its associations with intratumoral immunity (total, CD4+, and CD8+ TIL densities) and systemic immune indices (ALC, NLR, and PLR). We prespecified the hypothesis that post-treatment SV increase would be associated with inferior outcomes and an immunosuppressive profile.
Materials and methods
The reporting of this study conforms to the STROBE statement 25 (Table S1).
Study population
This was a single-center retrospective cohort study conducted at Shandong Cancer Hospital. All study procedures were conducted in accordance with the Declaration of Helsinki (October 2024 revision). The study was approved by the Institutional Review Board of Shandong Cancer Hospital (ethical number: SDTHEC202411032). Inclusion criteria were as follows: (1) newly diagnosed ES-SCLC according to the Veterans Administration Lung Study Group staging system between January 2020 and May 2023; (2) received standard CIT; (3) completion of enhanced chest CT (with full spleen visualization), complete blood counts (including neutrophil, lymphocyte, and platelet counts), and comprehensive clinical evaluation within 2 weeks before treatment and within 1 month after completing four cycles of treatment. Patients were excluded if they met any of the following criteria: (1) suffering from other tumors; (2) patients with splenic metastasis, a history of splenectomy, or baseline non-tumor-related causes of splenomegaly (such as cirrhosis and portal hypertension); (3) patients who had an immunodeficiency diagnosis or were receiving long-term systemic steroid therapy (in dosing exceeding 10 mg daily of prednisone equivalent); (4) with an active infection requiring systemic therapy; (5) had received hematopoietic growth factors within 2 weeks before hematologic assessment; and (6) lost to follow-up. The follow-up was updated through April 1, 2025.
Clinical data were retrospectively collected from the electronic medical record system. Pretreatment tumor specimens were available for 94 patients and were subjected to immunohistochemistry (IHC).
Treatment
First-line standard treatment consisted of CIT with platinum-etoposide plus an ICI. In line with the National Comprehensive Cancer Network 26 Category 1 guidance, atezolizumab, serplulimab, adebrelimab, or durvalumab was administered in combination with cisplatin or carboplatin plus etoposide. Patients typically received four 21-day cycles (up to six cycles when clinically appropriate), followed by maintenance therapy with the same ICI until unacceptable toxicity or disease progression. Treatment beyond disease progression was allowed if patients experienced clinical benefit.
Image acquisition and SV estimation
Baseline SV was measured from contrast-enhanced CT scans obtained within 2 weeks before treatment initiation, and post-treatment SV was measured within 1 month after completing four treatment cycles. DICOM images were exported using MRIcroGL software (version 1.2.20220720; Chris Rorden, University of South Carolina, Columbia, SC, USA) and imported into 3D Slicer (version 5.4.0; Slicer Community, Boston, MA, USA) for analysis (Figure 1). Portal venous phase contrast-enhanced CT images were used because the spleen demonstrates homogeneous enhancement in this phase. Spleen segmentation was performed on a slice-by-slice basis by a radiation oncologist blinded to clinical outcomes. A radiologist with >5 years of experience independently reviewed each case, and discrepancies were resolved by a senior radiologist (>10 years of experience).
27
SV was normalized to body surface area (BSA) to yield the spleen volume index (SVI). BSA was calculated using Mosteller’s formula,
28
and SVI was divided only by absolute value, excluding units of BSA for ease of calculation.
29

Outlining of the spleen.
Follow-up data
In the first 2 years after treatment, follow-up visits were scheduled approximately every 3 months. For the subsequent 3–5 years, these visits occurred every 6 months, and after that, they are scheduled on an annual basis. Evaluation consisted mainly of hematological analysis and enhanced CT scans. All CT scans were independently reviewed according to the Response Evaluation Criteria in Solid Tumors, version1.1 (RECIST v1.1) 30 by two board-certified radiologists specializing in oncologic imaging, with adjudication by a third reviewer in case of disagreement. 31 The objective response rate (ORR) was defined as the proportion of patients who achieve a complete response (CR) or a partial response (PR) within 1 month after completing four cycles of treatment based on the RECIST, v1.1. OS was defined as the time from pathological diagnosis to all-cause death or to final outpatient review. PFS was defined as the time from pathological diagnosis to disease progression, death, or final outpatient review. Patients alive without an event were censored at the date of last follow-up.
IHC and quantification of CD4+ and CD8+ T cells
Human tumor specimens were fixed in 4% paraformaldehyde for 24 h at 4°C, dehydrated through a graded ethanol series, and embedded in paraffin. Tissue sections (5 µm thick) were cut using a microtome, deparaffinized in xylene, and rehydrated through graded ethanol. Antigen retrieval was performed in citrate buffer at 95°C for 20 min, followed by cooling to room temperature. Sections were blocked with 5% normal goat serum for 1 h at room temperature to prevent nonspecific binding, and then incubated overnight at 4°C with primary antibodies against CD4 (1:200; ab288724; Abcam, Cambridge, UK) and CD8 (1:200; ab237709; Abcam, Cambridge, UK). After PBS washing, sections were incubated with biotinylated secondary antibodies for 1 h at room temperature and subsequently treated with streptavidin-horseradish peroxidase for 30 min.
All slides were scanned using a Pannoramic 250 FLASH scanner (3DHISTECH, Budapest, Hungary), and image analysis was performed with ImageJ software (version 1.53; Wayne Rasband, Bethesda, USA). CD4+ and CD8+ staining was quantified independently in each case at the same magnification (20×) and field selection criteria. Expression levels were assessed by two independent researchers, with discrepancies resolved through discussion with the senior author. The densities of CD4+ and CD8+ T cells were calculated as the percentage of tumor area occupied by positively stained immune cells. 32 Because single IHC was performed on adjacent sections, the combined CD4+% and CD8+% values were used as an approximate indicator of total TIL%. All analyses were performed under blinded conditions to ensure consistency and minimize observer bias.
Hematological parameters
Peripheral blood parameters, including lymphocyte, neutrophil, and platelet counts, were collected within 2 weeks before treatment initiation and within 1 month after completing four cycles of CIT. The following indices were calculated:
Statistical analysis
Categorical variables were expressed as frequencies and percentages. Continuous variables, such as baseline SVI, were dichotomized using the median value as the cutoff. To reduce the impact of segmentation variability and physiologic fluctuation on volumetric measurements, SV change was dichotomized using 10% as the threshold. Univariate and multivariate Cox proportional hazards models were used to evaluate the prognostic effects of baseline SVI, SV change, and clinical characteristics on OS and PFS. Variables with p-values of <0.10 from the univariate analysis were incorporated into the multivariate model to determine independent prognostic factors. Hazard ratios (HRs) and 95% confidence intervals (CIs) were calculated. Survival curves were estimated using the Kaplan–Meier method and compared by the log-rank test. Categorical variables were compared using the Chi-square test or Fisher’s exact test. To assess potential selection bias in immunologic analyses, baseline clinical characteristics and SV metrics were compared between patients with available IHC data and those without. Correlations between SV metrics and hematological parameters or TIL densities were assessed using Spearman’s rank correlation test. The Wilcoxon rank-sum test was applied to compare hematological and TIL indices between different SVI and SV change groups. All statistical analyses were performed using SPSS (version 27.0.1; IBM Corp, Armonk, USA), R software (version 4.3.2; R Core Team, Vienna, Austria), and GraphPad Prism (version 10.1.2; GraphPad Software, San Diego, USA). A two-sided p value < 0.05 was considered statistically significant.
Results
Patient cohort
A total of 292 patients with ES-SCLC who received first-line CIT were retrospectively included (Figure 2). Among them, 263 (90.1%) were male, and the median age was 62 years (range, 40–75 years). Overall, 109 patients (37.3%) had T1–2 disease and 183 (62.7%) had T3–4; 117 (40.1%) had N0–2 disease, and 175 (59.9%) had N3 disease. At baseline, the proportions of patients with brain, liver, and bone metastases were 21.6%, 32.2%, and 27.7%, respectively. After four cycles of CIT, 4 patients achieved CR, 204 achieved PR, 71 achieved stable disease (SD), and 13 developed progressive disease (PD), resulting in an ORR of 71.2% (208/292). The clinicopathologic characteristics of all patients are summarized in Table 1. The median follow-up duration was 33.1 months. At the data cutoff, 219 deaths had occurred, and 267 PFS events (progression or death) were recorded. The median OS was 15.7 months (range, 2.3–55.1 months), and the median PFS was 7.6 months (range, 0.3–46.9 months).

The flowchart for patient recruitment.
Clinicodemographic characteristics of all patients.

ALC, absolute lymphocyte counts; ECOG, Eastern Cooperative Oncology Group; N, node; NLR, neutrophil-to-lymphocyte ratio; PLR, platelet-to-lymphocyte ratio; T, tumor.
SV change and survival
Baseline SVI was categorized as high (⩾113.07 cm3) or low (<113.07 cm3), and a change of at least 10% in SV was defined as an increase or decrease. The median baseline SVI was 113.07 cm3 (range, 53.05–298.69 cm3), and the median SV change across all patients was +11.3% (range, −34.0% to +88.1%). Overall, 136 patients (46.6%) experienced a decrease in SV (median, −14.6%), whereas 156 patients (53.4%) exhibited an increase (median, +16.8%).
In univariate Cox analyses for OS, SV change, ECOG performance status, pre-N stage, pre-NLR, and liver metastasis (LM) at baseline were associated with OS (all p < 0.10). Variables with p < 0.10 in univariable analyses were entered into the multivariable model. In multivariate analysis, increased SV (HR = 1.561, 95% CI, 1.193–2.041; p = 0.001), ECOG ⩾2 (HR = 1.817, 95% CI, 1.011–3.266; p = 0.046), N3 stage (HR = 1.347, 95% CI, 1.022–1.775; p = 0.034), and baseline LM (HR = 1.525, 95% CI, 1.149–2.024; p = 0.003) remained independently associated with shorter OS (Table 2), whereas pre-NLR was not significant after adjustment. Similarly, in univariate analyses for PFS, SV change, ECOG performance status, pre-N stage, pre-NLR, and LM at baseline showed associations (all p < 0.10). Multivariate Cox analysis identified increased SV (HR = 1.411, 95% CI, 1.106–1.800; p = 0.006), ECOG ⩾2 (HR = 2.424, 95% CI, 1.401–4.192, p = 0.002), and LM at baseline (HR = 1.572, 95% CI, 1.211–2.041; p = 0.001) as independent prognostic factors for shorter PFS (Table 3). Although baseline SVI (<113.07 vs ⩾113.07 cm3) showed no significant association with OS (p = 0.770; Figure 3(a)) or PFS (p = 0.202; Figure 3(b)), patients with decreased SV during treatment had significantly longer OS (median, 20.1 vs 12.5 months, p < 0.001; Figure 3(c)) and PFS (median, 8.9 vs 7.0 months, p = 0.004; Figure 3(d)).
Univariate and multivariate Cox analyses of the prognostic factors of overall survival.

Bold values indicate variables with p < 0.10 in the univariable analysis and variables that remained statistically significant (p < 0.05) in the multivariable Cox regression analysis.
ALC, absolute lymphocyte counts; CI, confidence interval; ECOG, Eastern Cooperative Oncology Group; HR, hazard ratio for death; N, node; NLR, neutrophil-to-lymphocyte ratio; PLR, platelet-to-lymphocyte ratio; SVI, spleen volume index; T, tumor.
Univariate and multivariate Cox analyses of the prognostic factors of progression-free survival.

Bold values indicate variables with p < 0.10 in the univariable analysis and variables that remained statistically significant (p < 0.05) in the multivariable Cox regression analysis.
ALC, absolute lymphocyte counts; CI, confidence interval; ECOG, Eastern Cooperative Oncology Group; HR, hazard ratio for disease progression or death; N, node; NLR, neutrophil-to-lymphocyte ratio; PLR, platelet-to-lymphocyte ratio. SVI, spleen volume index; T, tumor.

Kaplan–Meier curves analysis to compare OS and PFS. Kaplan–Meier survival curves of OS (a) and PFS (b) of different baseline SVI groups before treatment; Kaplan–Meier survival curves of OS (c) and PFS (d) of different SV change groups after treatment.
Overall, these findings demonstrate that an increase in SV following CIT is independently associated with inferior survival outcomes.
SV change and ORR
Baseline SVI showed no association with ORR (p = 0.700; Figure 4(a)). By contrast, the ORR was 79.4% in patients with decreased SV after CIT, compared with 64.1% in those with increased SV. The Chi-square test indicated a significant difference between the two groups (p = 0.004; Figure 4(b)). These findings indicate that an increase in SV after CIT is associated with a lower likelihood of achieving an objective response.

Comparison of treatment response in different SV groups. (a) Comparison of treatment response in different baseline SVI groups. (b) Comparison of treatment response in different SV change groups.
SV change and TILs
Baseline clinical characteristics and SV metrics were comparable between patients with available IHC data (n = 94) and those without IHC data (n = 198; Table S2). No significant differences were observed between the two groups, supporting the representativeness of the IHC subset and minimizing concern for selection bias. No significant differences were observed in total TIL (p = 0.2786; Figure 5(a)), CD4+ TIL (p = 0.0818; Figure 6(a)), or CD8+ TIL (p = 0.9553; Figure 6(c)) densities between different baseline SVI groups. By contrast, patients with increased SV after CIT exhibited significantly lower total TIL (p < 0.0001; Figure 5(c)), CD4+ TIL, and CD8+ TIL (both p < 0.0001; Figure 6(e) and (g)) densities compared with those whose SV decreased. Spearman’s correlation analysis revealed a weak but significant negative correlation between baseline SVI and CD4+ TIL density (r = −0.25, p = 0.0162; Figure 6(b)), while no correlation was found with total TIL (r = −0.17, p = 0.0960; Figure 5(b)) or CD8+ TIL (r = −0.03, p = 0.7885; Figure 6(d)). Conversely, SV change after CIT showed a strong inverse correlation with total TIL (r = −0.61, p < 0.0001; Figure 5(d)), CD4+ TIL (r = −0.45, p < 0.0001; Figure 6(f)), and CD8+ TIL (r = −0.67, p < 0.0001; Figure 6(h)). Immunohistochemical staining further supported these quantitative findings: patients with increased SV (Figure 7(A), (a), (B), and (b)) exhibited visibly lower infiltration of CD4+ and CD8+ T cells, whereas those with decreased SV (Figure 7(C), (c), (D), and (d)) demonstrated denser TIL infiltration.
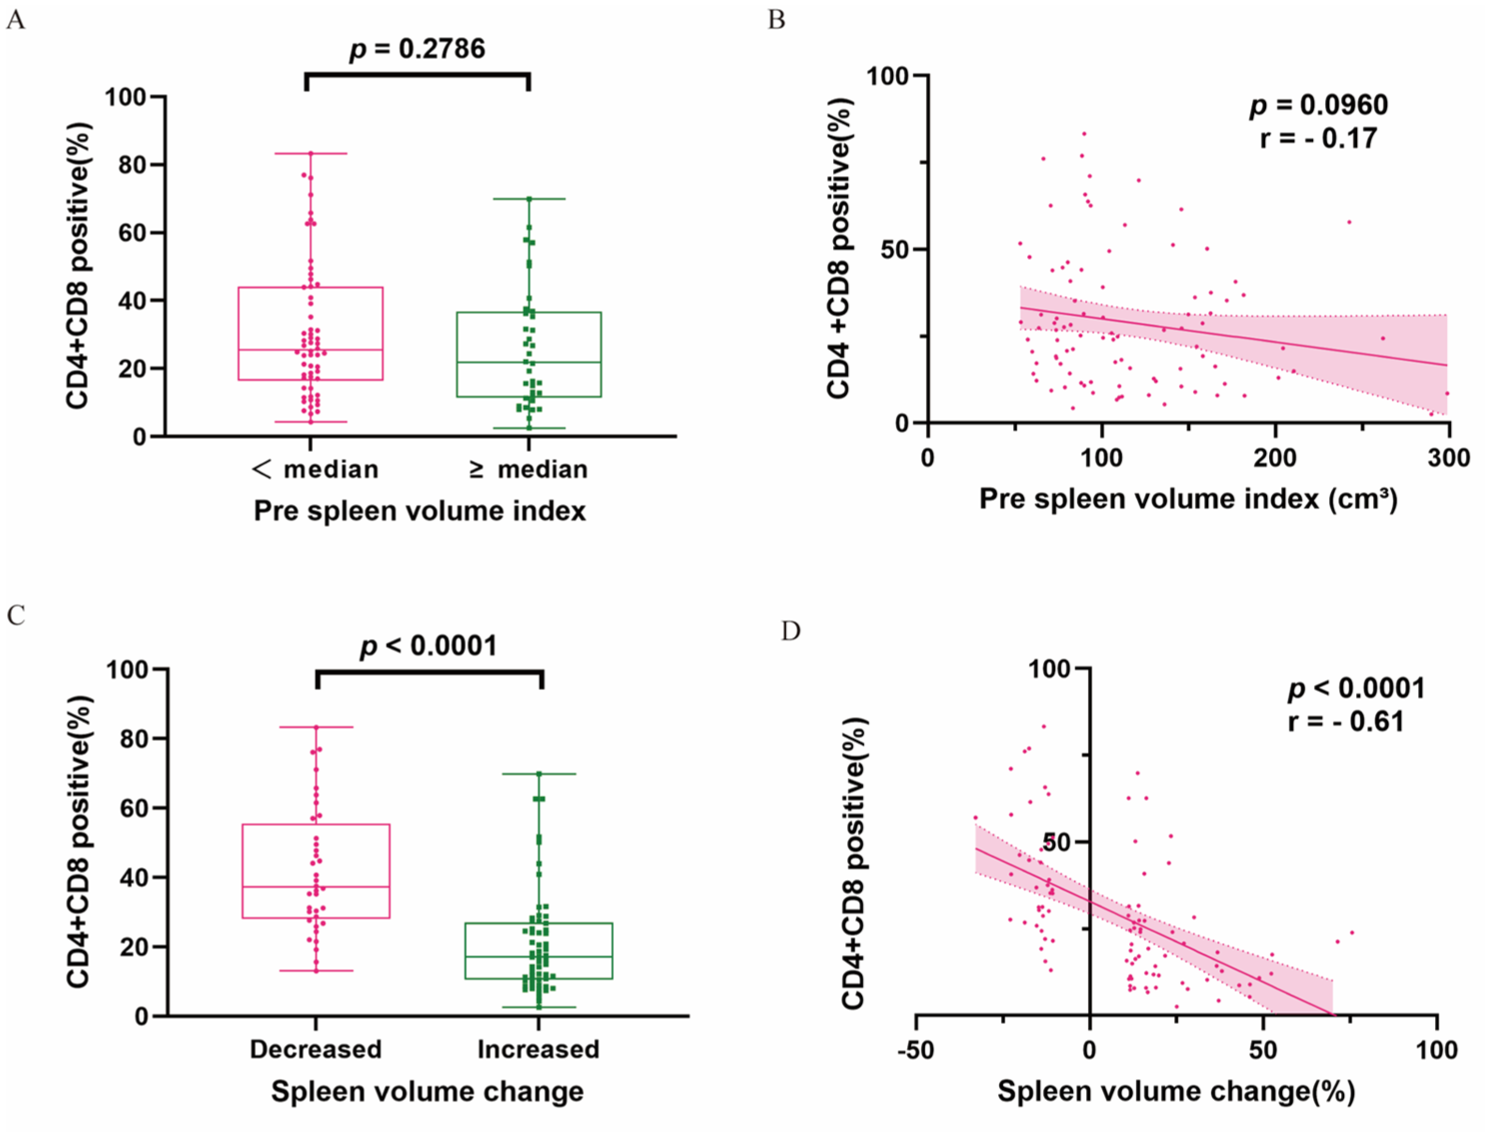
Comparison and correlation analyses of total TIL levels with different SV. Comparison of total TIL levels in different baseline SVI groups before treatment (a) and in different changes of SV groups after treatment (c). Correlation between the total TIL levels and baseline SVI (b) and SV change (d).
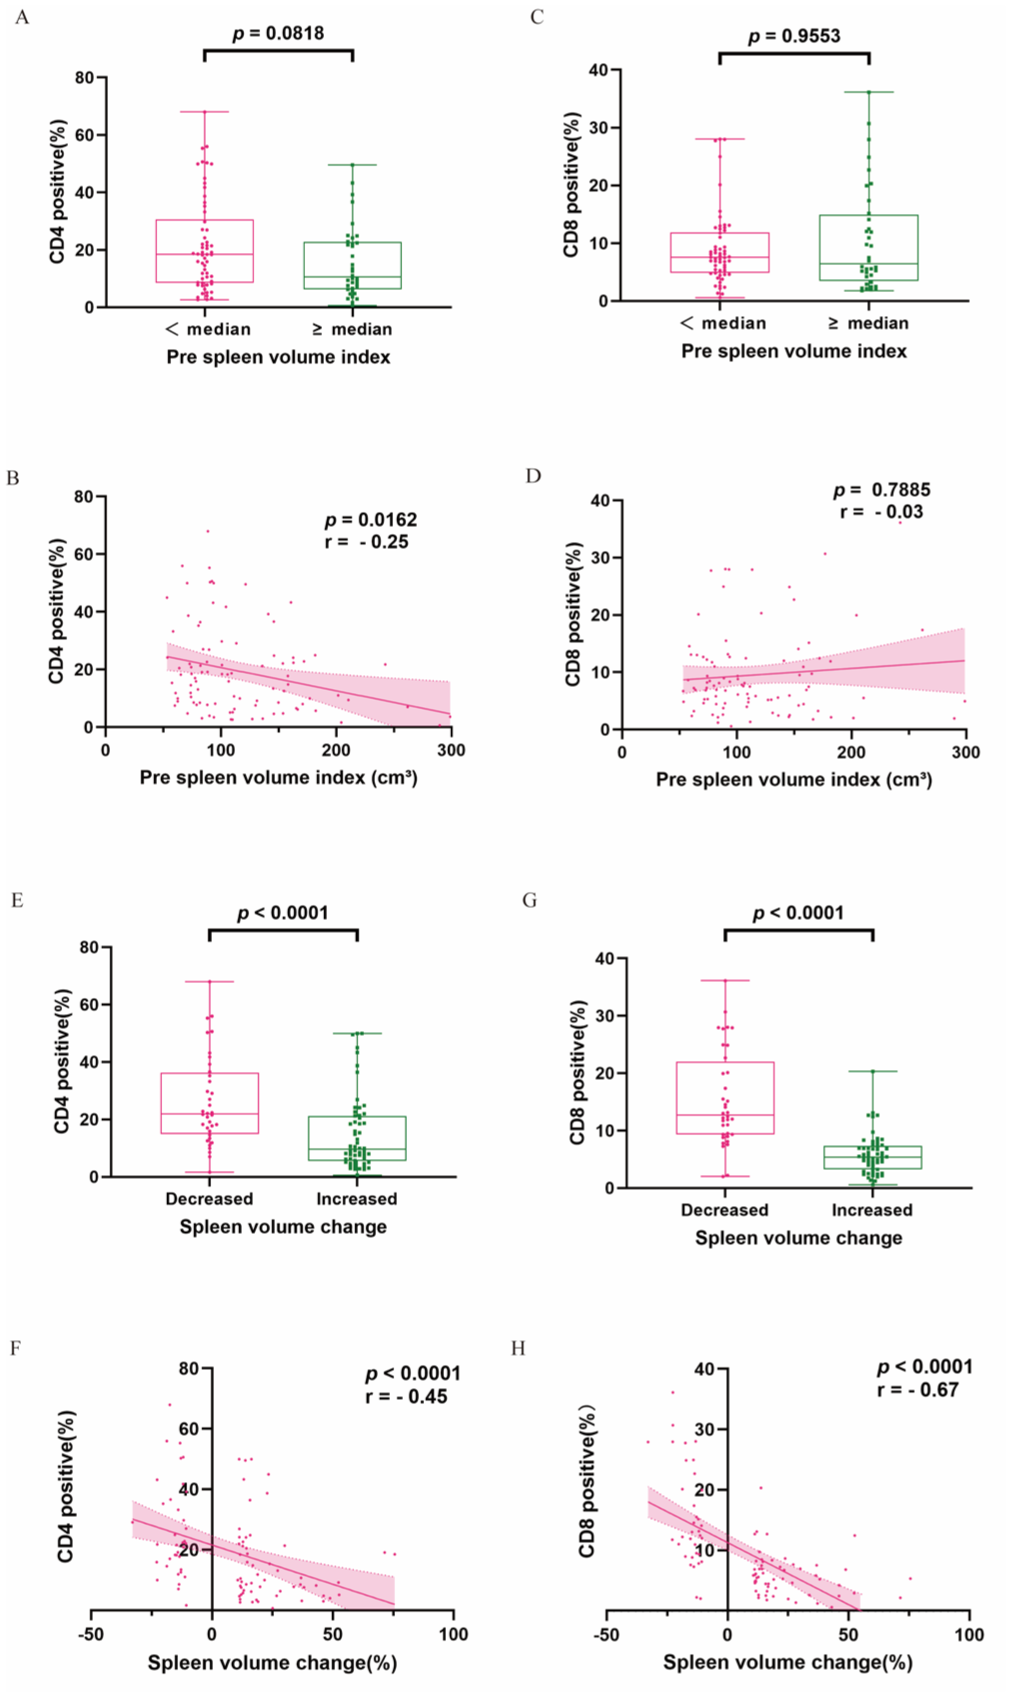
Comparison and correlation analyses of CD4+ and CD8+ TIL levels with different SV. Comparison of CD4+ (a) and CD8+ (c) TIL levels in different baseline SVI groups. Correlation between baseline SVI and CD4+ (b) and CD8+ (d) TIL levels. Comparison of CD4+ (e) and CD8+ (g) TIL levels in different changes of SV groups. Correlation between SV change and CD4+ (f) and CD8+ (h) TIL levels.

Representative CD 4 and CD 8 immunohistochemical staining results in two patients with a significant increase or decrease in SV after CIT. The represented 10× and 40× images of CD4 (A, a) and CD8 (B, b) expression in naïve tumor specimens of increased SV. The represented 10× and 40× images of CD4 (C, c) and CD8 (D, d) expression in naïve tumor specimens of decreased SV.
Taken together, these results suggest that enlargement of the spleen following CIT is associated with reduced intratumoral immune infiltration, including both CD4+ and CD8+ subsets.
SV change and hematological parameters
Higher baseline SVI was associated with lower pre-treatment ALC and higher pre-treatment NLR and PLR (all p < 0.05; Figure 8(a), (c), and (e)). Among patients with increased SV after CIT, ΔNLR and ΔPLR were significantly higher (both p < 0.0001; Figure 9(c) and (e)), whereas ΔALC was significantly lower (p < 0.0001; Figure 9(a)). Correlation analyses revealed that baseline SVI was negatively correlated with pre-ALC (r = −0.25, p < 0.0001; Figure 8(b)) and positively correlated with pre-NLR (r = 0.19, p < 0.001; Figure 8(d)), whereas its association with pre-PLR was weaker (r = 0.14, p = 0.0172; Figure 8(f)). Similarly, SV change was inversely correlated with ΔALC (r = −0.35, p < 0.0001; Figure 9(b)) and positively correlated with ΔNLR (r = 0.47, p < 0.0001; Figure 9(d)), while showing a mild positive correlation with ΔPLR (r = 0.27, p < 0.0001; Figure 9(f)).

Comparison and correlation analyses of immune-related parameters before treatment with different SVIs. Comparison of initial ALC (a), NLR (c), and PLR (e) levels in different baseline SVI groups. Correlation between baseline SVI and initial ALC (b), NLR (d), and PLR (f) levels.

Comparison and correlation analyses of immune-related parameters after treatment with different SV change. Comparison of delta-ALC (a), delta-NLR (c), and delta-PLR (e) levels in different changes of SV groups. Correlation between SV change and delta-ALC (b), delta-NLR (d), and delta-PLR (f) levels.
Collectively, these results demonstrate that increased SV is linked to reduced peripheral lymphocyte levels and elevated inflammatory indices, consistent with a shift toward a more immunosuppressive systemic milieu.
Discussion
The IMpower133 trial, a landmark study in ES-SCLC, introduced ICIs into first-line therapy, establishing CIT as the standard treatment in this setting. 33 Nevertheless, the clinical response to CIT remains heterogeneous, and robust, accessible biomarkers for identifying patients most likely to benefit are lacking. To our knowledge, this is the first study to demonstrate that early SV change on routine CT is independently prognostic in ES-SCLC treated with first-line CIT. We further show that SV change correlates with both intratumoral TIL densities and peripheral immune indices, supporting that SV dynamics may reflect therapy-related systemic immune remodeling relevant to ICI efficacy.
Our analysis identified increased SV after CIT as an independent adverse prognostic factor for both OS and PFS, whereas baseline SVI showed no significant prognostic associations. Patients with increased SV exhibited shorter OS and PFS, and lower ORR, suggesting that early SV expansion may mark an unfavorable immune state under CIT and potentially limited benefit from ICIs. Several studies support the notion that SV change may reflect disease and immune dynamics, with reduced SV correlating with decreased tumor burden in metastatic renal cell carcinoma and advanced non-SCLC.8,34 Consistent with our prior work in esophageal and cervical cancers,14,15 these findings extend the prognostic utility of splenic imaging to CIT-treated ES-SCLC.
Established clinical predictors also remained informative. Consistent with prior real-world cohorts of ES-SCLC treated with first-line CIT,35,36 poorer baseline ECOG performance status was associated with inferior OS and PFS in our analyses. In our multivariable models, LM remained an independent adverse prognostic factor in line with prior studies.37,38 Collectively, these findings support SV change as a complementary imaging biomarker alongside conventional clinical predictors.
We found that SV change was negatively correlated with total, CD4+, and CD8+ TILs, indicating that SV increase after CIT was associated with diminished intratumoral immune infiltration. CD4+ and CD8+ T lymphocytes, as the principal components of TILs, play complementary roles in antitumor immunity. 16 CD4+ cells perform a central function to initiate and sustain anti-tumor immune responses, whereas CD8+ cells mediate direct cytotoxicity and long-term immune surveillance.18,19 Prior studies have consistently shown that higher TIL densities, particularly of CD4+ and CD8+ subsets, correlate with improved survival across multiple tumor types.39,40 These results suggest that SV change mirrors local immune suppression, where increased SV after treatment accompanies reduced TIL density and inferior prognosis. Because intratumoral immune infiltration generally requires tissue sampling, early SV dynamics on routine CT may serve as a noninvasive surrogate of intratumoral immune status to some extent, facilitating immune monitoring during CIT. Although TLSs were not assessed, our observations are consistent with altered lymphocyte trafficking between tumor-local immune niches and the peripheral compartment.
Beyond intratumoral immunity, SV dynamics were closely associated with peripheral immune parameters. We observed weak correlations between baseline SVI and pre-ALC, pre-NLR, and pre-PLR. However, SV increase after CIT showed a significant positive correlation with ΔNLR and ΔPLR and an inverse correlation with ΔALC. The NLR, a systemic immunoinflammatory marker, is an established prognostic indicator across multiple cancers.22,41 A higher NLR reflects lymphopenia and neutrophil predominance, both markers of systemic immune suppression. Taken together, the concurrent increase in NLR and PLR and decrease in ALC suggest that SV increase may track a systemic immune state characterized by neutrophilia-dominant inflammation and lymphopenia.
Mechanistically, during tumor progression, persistent inflammatory and tumor-derived growth factor signals can mobilize hematopoietic stem and progenitor cells and promote their expansion in the spleen, contributing to splenic EMH. 42 This process favors the production and expansion of immature myeloid populations, which can enter the circulation and accumulate within tumors, thereby contributing to myeloid-driven antitumor immune suppression.43–45 In this context, early SV increase on routine CT may represent a macroscopic surrogate of systemic myeloid skewing, consistent with our observations in the SV-increase group—namely, concurrent lymphopenia with increased NLR/PLR and reduced intratumoral CD4+/CD8+ TIL densities. Because effective ICI activity depends on an adequate circulating lymphocyte pool and sustained effector T-cell responses, such remodeling could plausibly attenuate the clinical benefit of ICI therapy; nevertheless, these mechanistic links remain hypothesis-generating and warrant prospective and experimental validation.
From a translational perspective, SV dynamics could be incorporated into routine imaging workflows for immune monitoring during CIT. In parallel, the immune-linked nature of SV enlargement supports exploration of spleen-targeted strategies (such as pharmacologic inhibition of MDSCs, low-dose radiotherapy, or selective embolization) as potential approaches to alleviate systemic immunosuppression and augment CIT efficacy; prospective studies are required.46–48
This study has several limitations. First, the retrospective nature of the study led to inherent selection biases. Second, SV change was assessed at a post-treatment landmark after four CIT cycles; patients without post-treatment CT or who did not complete four cycles were not evaluable. This landmark design may introduce selection bias. Third, the limited availability of post-treatment tissue specimens precluded detailed assessment of TIL phenotypic changes. These findings require external validation in multicenter and prospective cohorts to confirm generalizability and clinical utility. Future radiomics work could extend beyond volume to incorporate splenic texture, shape, attenuation, and perfusion-related features, including imaging-derived spatial signatures linked to immune-cell distribution, with validation against circulating and intratumoral immune profiles.
Conclusion
In summary, early SV change on routine CT is a simple, noninvasive imaging biomarker associated with clinical outcomes and immune remodeling in ES-SCLC receiving first-line CIT. Prospective multicenter validation and mechanistic studies are warranted before clinical implementation.
Supplemental Material
sj-docx-1-tam-10.1177_17588359261417776 – Supplemental material for Spleen volume change as a prognostic and immunologic imaging biomarker in extensive-stage small-cell lung cancer receiving chemo-immunotherapy
Supplemental material, sj-docx-1-tam-10.1177_17588359261417776 for Spleen volume change as a prognostic and immunologic imaging biomarker in extensive-stage small-cell lung cancer receiving chemo-immunotherapy by Xiuli Liu, Ao Liu, Defeng Liu, Yi Li, Yuanlin Li, Jiazhong Ren, Zhichao Li, Shuqing Duan, Jinming Yu and Minghuan Li in Therapeutic Advances in Medical Oncology
Supplemental Material
sj-docx-2-tam-10.1177_17588359261417776 – Supplemental material for Spleen volume change as a prognostic and immunologic imaging biomarker in extensive-stage small-cell lung cancer receiving chemo-immunotherapy
Supplemental material, sj-docx-2-tam-10.1177_17588359261417776 for Spleen volume change as a prognostic and immunologic imaging biomarker in extensive-stage small-cell lung cancer receiving chemo-immunotherapy by Xiuli Liu, Ao Liu, Defeng Liu, Yi Li, Yuanlin Li, Jiazhong Ren, Zhichao Li, Shuqing Duan, Jinming Yu and Minghuan Li in Therapeutic Advances in Medical Oncology
Footnotes
References
Supplementary Material
Please find the following supplemental material available below.
For Open Access articles published under a Creative Commons License, all supplemental material carries the same license as the article it is associated with.
For non-Open Access articles published, all supplemental material carries a non-exclusive license, and permission requests for re-use of supplemental material or any part of supplemental material shall be sent directly to the copyright owner as specified in the copyright notice associated with the article.