
Abstract
Background:
Immune checkpoint inhibitors (ICIs) have improved outcomes in non-small cell lung cancer (NSCLC), yet reliable biomarkers for predicting response remain limited. Neutrophil extracellular traps (NETs) may influence tumor immunity, but their clinical significance in NSCLC is unclear.
Objectives:
To evaluate the predictive and prognostic value of NETs in advanced NSCLC patients treated with chemo-immunotherapy.
Design:
A retrospective cohort study.
Methods:
Pretreatment formalin-fixed paraffin-embedded biopsies from 46 stage IV NSCLC patients receiving first-line chemo-immunotherapy were analyzed by multiplex immunofluorescence to quantify NETs, CD8+ T cells, and cancer-associated fibroblasts (CAFs). Survival and correlation analyses were performed.
Results:
High NETs’ density was associated with shorter progression-free survival (PFS: 8 vs 20 months, p = 0.028) and overall survival (OS: 14.7 vs 29.8 months, p = 0.0046). NETs’ levels inversely correlated with CD8+ T-cell density (R = –0.33, p = 0.025) and showed a trend toward positive correlation with CAFs (R = 0.27, p = 0.07). Poorer survival was observed when a high density of CAFs and CD8+ T cells was present within 30 µm of NETs. Multivariate Cox analysis confirmed high NETs as an independent prognostic factor.
Conclusion:
NETs predict poor immunotherapy response and survival in advanced NSCLC and interact with CD8+ T cells and CAFs to potentially mediate resistance. NETs represent a promising biomarker and potential therapeutic target for enhancing immunotherapy efficacy in NSCLC.
Plain language summary
This study explored how structures called neutrophil extracellular traps (NETs)—web-like formations released by immune cells—affect outcomes for advanced non-small cell lung cancer (NSCLC) patients treated with immunotherapy. Researchers analyzed tumor tissue from 46 patients who received anti-PD-1/PD-L1 therapy, a common immunotherapy. They found that patients with higher NETs levels in their tumors had worse responses to treatment, shorter survival times (14.7 vs. 29.8 months), and faster cancer progression (8 vs. 20 months) compared to those with lower NETs. NETs were also linked to fewer cancer-fighting CD8+ T cells in the tumor area and more cancer-associated fibroblasts (CAFs), cells that support tumor growth and suppress immunity. Patients with many CD8+ T cells or CAFs clustered near NETs had particularly poor outcomes, suggesting NETs may block immune cells or collaborate with CAFs to weaken treatment effects. These findings highlight NETs as a potential biomarker to predict which patients might benefit less from immunotherapy. Targeting NETs, either alone or combined with therapies that counteract CAFs, could improve treatment success. This study provides new insights into how the tumor environment influences immunotherapy resistance and offers strategies to enhance patient outcomes.
Keywords
Introduction
Non-small cell lung cancer (NSCLC) remains the leading cause of cancer-related deaths worldwide, with generally poor prognosis. 1 Recent advancements in immunotherapy, particularly the application of programmed cell death protein 1/programmed cell death 1 ligand 1 (PD-1/PD-L1) antibodies, have provided new hope for NSCLC patients.2–4 Clinically, PD-L1 expression is often assessed to select appropriate immunotherapeutic agents, as PD-L1 is a key immune checkpoint. Blocking the PD-1/PD-L1 pathway can reinvigorate exhausted CD8+ T cells and restore their function.5,6 However, PD-L1 is not an ideal predictive biomarker, as some patients with low PD-L1 expression can still benefit from immunotherapy. 7 Although immunotherapy has achieved promising 5-year survival rates in advanced NSCLC patients, a subset still experiences recurrence or distant metastasis. 8 Therefore, identifying more effective predictive biomarkers for immunotherapy is essential.
In addition to tumor cells, immune cells and stromal cells such as CD8+ T cells and cancer-associated fibroblasts (CAFs) within the tumor microenvironment (TME) also play a crucial role in influencing the efficacy of immunotherapy. 9 CD8+ T cells are key effector cells in the antitumor immune response, and their infiltration level is closely associated with prognosis in multiple cancers. However, the inefficacy of partial CD8+ T cells in eliminating tumors hinders their application as biomarkers for predicting the efficacy of immunotherapies.10,11 CAFs support tumor growth, invasion, and immune evasion through the secretion of various cytokines and remodeling of the extracellular matrix. 12 CAFs are one of the main components of the immune microenvironment, and they are receiving increasing attention due to the continuous discovery of their immunosuppressive effects. α-SMA is well known for its role in wound healing and is one of the main causes of myofibroblast contraction through microfilament bundling and stress fiber regulation. 13 Since the number of myofibroblasts is much higher in the tumor microenvironment, α-SMA has become one of the preferred markers for identifying CAF populations.14,15 The high expression of FAP in the tumor stroma has led many studies to use FAP as a marker for activated cancer-associated fibroblasts.16–18 Thus, α-SMA- and FAP-labeled CAFs are often regarded as activated CAFs, and such activated CAFs can hinder or eliminate the cytotoxic effects of T cells and NK cells, thereby suppressing immunity.19,20
Neutrophil extracellular traps (NETs) are web-like structures released by neutrophils in response to infection and inflammation, composed of deoxyribonucleic acid (DNA), histones, and antimicrobial proteins. 21 Recent studies have shown that NETs play a significant role not only in combating infections but also in the development and progression of various cancers. 22 NETs can promote tumor cell invasion, metastasis, and stimulate tumor angiogenesis, potentially influencing tumor progression and patient outcomes. 23 NETs can interact with CD8+ T cells and CAFs to promote cancer growth and metastasis.24–26 Moreover, NETs form a physical barrier around cancer cells, protecting them from CD8+ T cells and impairing the immunotherapy effects of immunotherapy. 27 However, the proximity of NETs to CD8+ T cells has not been further validated, and it has not been confirmed whether the interaction of NETs with CAFs affects the efficacy of immunotherapy.
This study aims to investigate the role of NETs in predicting prognosis and immunotherapy response in NSCLC patients. We employed multiplex immunofluorescence (mIF) to analyze the infiltration of NETs, activated CAFs, and CD8+ T cells in tumor samples from advanced NSCLC patients treated with first-line PD-1/PD-L1 antibodies. The goal is to evaluate the impact of this cell subpopulation on the immunotherapy response and prognosis of patients with NSCLC.
Material and methods
Patients and specimens
Formalin-fixed, paraffin-embedded (FFPE) samples were obtained from the pathology department’s sample repository at Shandong Cancer Hospital. This study was designed as a retrospective cohort study and included 46 histologically confirmed stage IV cases of NSCLC collected between February 2020 and December 2022. Gene testing confirmed that no significant driver mutations were present in the lung adenocarcinoma patients. These included EGFR, ALK, ROS1, BRAF V600E, MET exon14 skipping, RET, NTRK, KRAS G12C, HER2, and other recognized alterations. All patients underwent first-line chemotherapy combined with immunotherapy following multidisciplinary consultation. None of the patients had an autoimmune disease or venous thrombosis. The tissue samples were pretreatment core biopsy specimens.
NSCLC patients who were assessed as having a complete response or partial response lasting more than 6 months were classified as responders, while those with stable disease or progressive disease were classified as nonresponders. Progression-free survival (PFS) was defined as the time from the start of immunotherapy to disease progression, death, or the end of follow-up. Overall survival (OS) was defined as the time from the initiation of immunotherapy to death or the end of follow-up.
Multiplex immunofluorescence
mIF was performed as previously described. 28 Briefly, after dewaxing, hydration, antigen retrieval, and blocking, the tissue sections were incubated with primary antibodies either overnight at 4° or for 1 h at room temperature. Following three washes with Tris-buffered saline with Tween-20 (TBST), sections were incubated with Horseradish Peroxidase (HRP)-conjugated secondary antibodies, followed by incubation with Opal-labeled tyramide. After another three washes with TBST, microwave antigen retrieval was performed to remove unconjugated Opal. This process was repeated for seven sequential cycles, after which the sections were stained with DAPI for nuclear visualization. We show the antibody and reagent information in Supplemental Table 1.
Imaging data acquisition and analysis
Multichannel images were acquired at 200x magnification using Vectra Polaris Imaging System (Vectra Polaris 1.0.10, Akoya Biosciences, Marlborough, MA, USA). Image analysis was conducted in QuPath V.0.4.3. Cell segmentation was performed using an algorithm based on nuclear DAPI staining parameters. Cells were categorized into distinct groups according to positivity thresholds for each marker set, determined by staining intensity. The expression levels of each group were quantified by measuring cell density, calculated as the number of cells divided by the tissue area (μm2). The classification of high and low expression levels of NETs, CD8+ T cells, and CAFs was determined using the optimal cutoff values based on survival analysis (surv_cutpoint function in R).28–31
To further explore the relationship between NETs and both immune and stromal cells, we measured the proportion of CD8+ T cells and CAFs at distances of 10, 20, 30, 40, and 50 µm from the surrounding NETs. All the single-plex images, multiplex images, and processed data were supervised by an experienced pathologist for quality control. Staining with nonspecific signals and inappropriate analysis were excluded. The cells were classified into the following subsets: PanCK+ tumor cells, α-SMA+FAP+-activated CAFs, CD15+MPO+H3Cit+ NETs, 27 and CD8+ cytotoxic T cells.
Statistical analysis
All statistical analyses were performed using SPSS (IBM Corporation, NY, USA), GraphPad Prism 7 (GraphPad Software, La Jolla, California, USA) and R software (version 4.2.1; R Foundation for Statistical Computing, Vienna, Austria). The survival package (version 3.5-5) in R was used for survival analysis, and the ggplot2 package (version 3.4.4) was used for graphing. A p-value of less than 0.05 was considered statistically significant. The correlation between marker expression and clinicopathological characteristics was assessed using the chi-square test. PFS and OS rates were evaluated using the Kaplan–Meier method, and differences between groups were compared using the log-rank test. Cox proportional hazards regression models, along with univariate and multivariate analyses, were employed to identify independent prognostic factors. Variables with a p-value of less than 0.1 in the univariate analysis were included in the multivariate analysis.
The reporting of this study conforms to the STROBE (Strengthening the Reporting of Observational Studies in Epidemiology) guidelines for cohort studies, and the completed checklist is provided as a Supplemental File.
Results
Patient characteristics
Multiplex measurements of the subcellular expression of seven proteins were performed, and the workflow, along with representative fluorescence images, is presented in Figure 1(a)–(c). A total of 46 patients with histologically confirmed stage IV NSCLC were included in the study. Their baseline clinical and pathological characteristics are summarized in Table 1. Responders and nonresponders were well balanced in terms of gender, age, smoking and alcohol history, cerebrovascular disease (CVD), pulmonary history, Karnofsky performance status (KPS), tumor location, and histologic type. Of the 46 patients, 45 were on anti-PD-1 therapy, and 1 was on anti-PD-L1 therapy (Supplemental Table 2). All patients received chemotherapy (Supplemental Table 3).

Identification and characterization of tumor-infiltrating immune cells in tissues from NSCLC patients (a) Schematic of the experimental design and analytical methods used in this study. (b) Representative composite and single-stained images of the multiplex immunofluorescence panel used in the study. Scale bar: 25 μm. (c) Summary of each defined cell phenotype and associated markers from the panel.
Demographic and clinical characteristics in 46 non-small cell carcinoma patients.
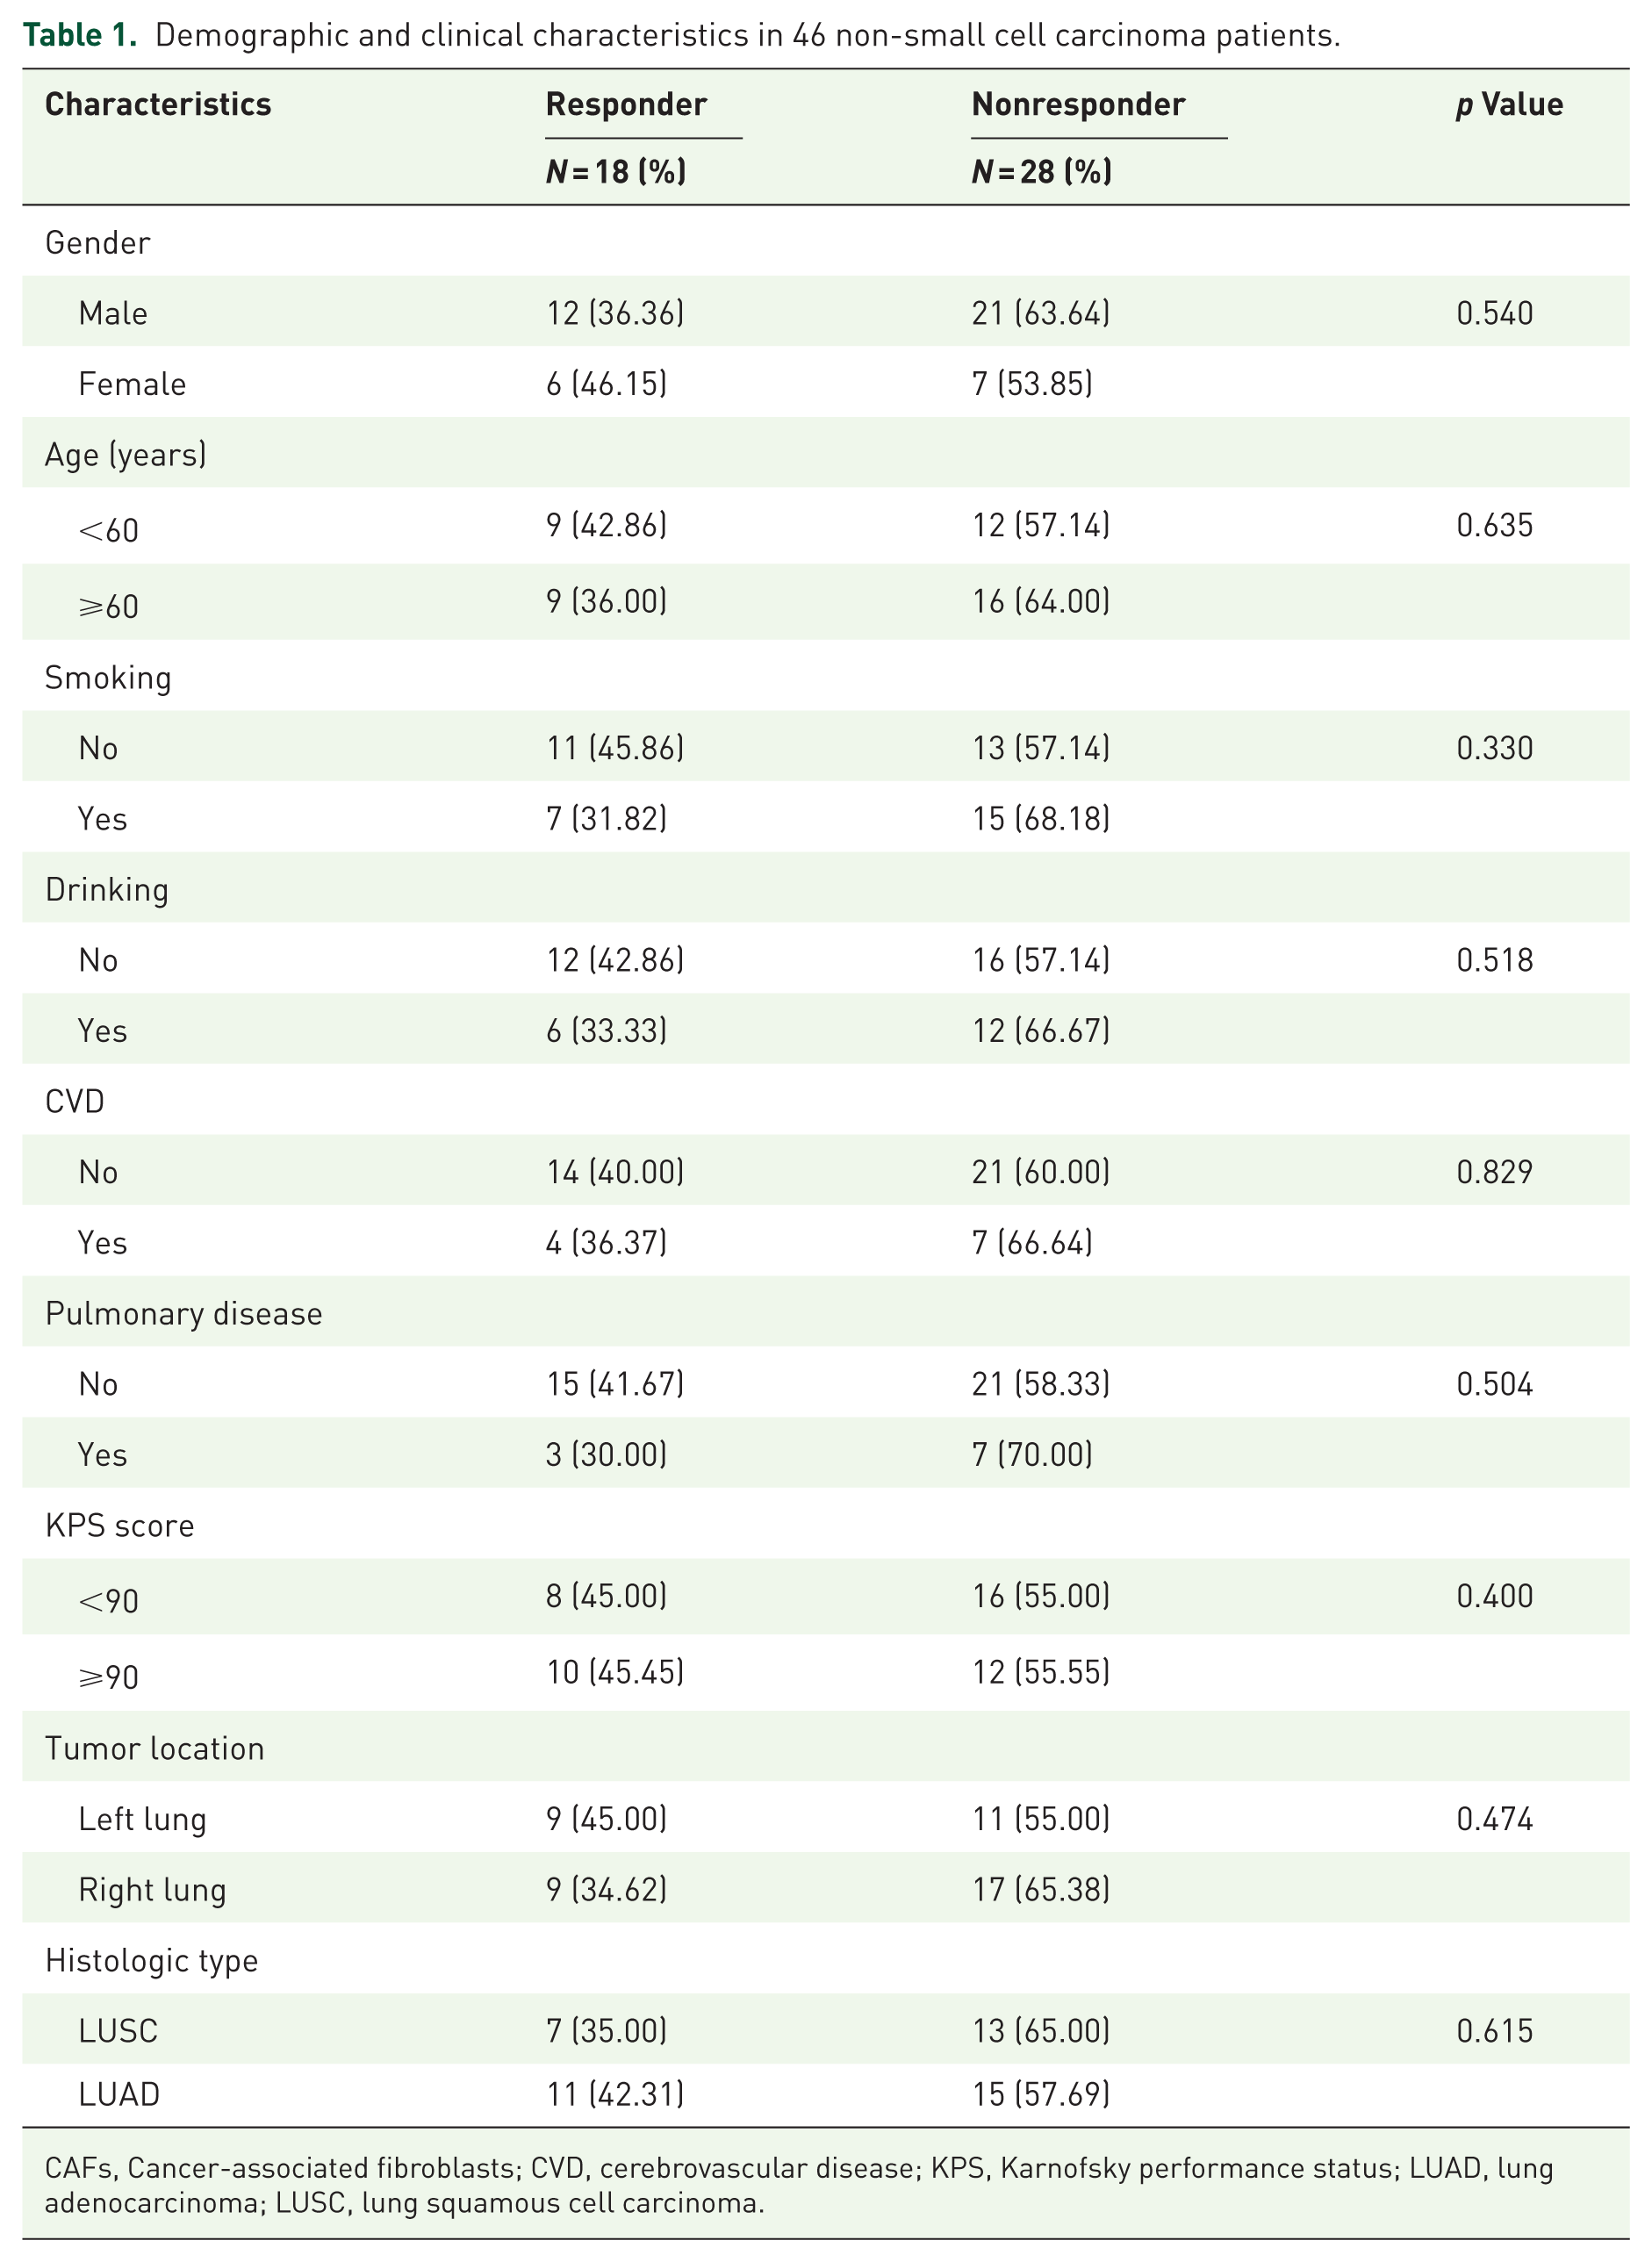
CAFs, Cancer-associated fibroblasts; CVD, cerebrovascular disease; KPS, Karnofsky performance status; LUAD, lung adenocarcinoma; LUSC, lung squamous cell carcinoma.
NETs are associated with poor immunotherapy response and poor prognosis
Kaplan–Meier curve analysis revealed that patients with high NETs levels had significantly worse PFS (median PFS (mPFS): 8 vs 20 months, p = 0.028) and OS (median OS (mOS): 14.7 vs 29.8 months, p = 0.0046) compared to those with low NETs levels. The proportion of responders to immunotherapy was significantly higher in the low-NETs group (p = 0.0078) (Figure 2(a)). Among patients with high and low CD8+ T-cell expression, there was no significant difference in progression-free survival (mPFS: 19 vs 10.9 months, p = 0.59). In contrast, overall survival differed markedly between the two groups: the median OS was not reached in the high-expression group, whereas it was 20.5 months in the low-expression group, indicating poorer prognosis (p = 0.022). Additionally, there was no statistically significant difference in CD8+ T-cell counts between responders and nonresponders (p = 0.21) (Figure 2(b)). Similarly, no significant difference in PFS was observed between patients with high and low CAFs expression (mPFS: 10.9 vs 22 months, p = 0.10). The median OS in patients with high CAFs expression was not reached, while it was 23 months in those with low CAFs expression, with no significant difference between the two groups (p = 0.24). Additionally, there was no statistically significant difference between the level of CAFs expression and immunotherapy efficacy (p = 0.059) (Figure 2(c)).

Kaplan–Meier survival curves of overall survival and progression-free survival and immunotherapy response categories for NETs (a), CD8+T cells (b), and CAFs (c) expression.
Subgroup survival analyses were further performed in responders and nonresponders. In the nonresponder subgroup, the survival results were consistent with those observed in the overall cohort (Figure 2). Patients with low NETs expression had significantly longer survival compared with those with high NETs expression (mOS: NR vs 14 months, p = 0.011), and patients with high CD8+ T-cell expression also showed significantly prolonged survival (mOS: NR vs 14 months, p = 0.022). In contrast, CAFs’ expression levels were not significantly associated with survival. In the responder subgroup, owing to the limited number of events during follow-up, no statistically significant survival differences were observed among the NETs, CD8+ T-cell, or CAF expression groups. Detailed results of the subgroup analyses are provided in the Supplemental Figure 1.
NETs are negatively correlated with CD8+ T cells
The relationship between NETs and CD8+ T cells was further analyzed, revealing an inverse correlation between NETs density and CD8+ T-cell density (R = −0.33, p = 0.025; Figure 3(a) and (b)). To explore this relationship in more detail, we quantified the proportion of CD8+ T cells within 10, 20, 30, 40, and 50 µm of the surrounding NETs and divided them into high CD8+ T-cell expression and low-expression groups (Figure 3(c)). Seven patients were excluded due to the absence of NETs in their tissue samples. Survival analysis between the two groups showed the largest difference in the range of 30 µm compared to the other ranges. The high CD8+ T-cell expression group showed a trend toward shorter PFS (mPFS: 8 vs 22 months, p = 0.59), although this difference was not statistically significant. In contrast, OS was significantly worse in the high CD8+ T-cell expression group (mOS: 15 vs 29.8 months, p = 0.0085) compared with the low-expression group (Figure 3(d) and (e)). In immunotherapy responders, the proportion of CD8+ T cells within 30 µm of NETs was significantly lower (p = 0.036; Figure 3(f)).

NETs are negatively correlated with CD8+ T cells. CD8+ T cells was negatively correlated with NET expression (a); representative fluorescence plots of CD8+ T cells negatively correlated with NETs expression (b); representative fluorescence plots of CD8+ T cells in the range of 30 μm of NETs (c); PFS (d) and OS (e) were worse in the group with high CD8+ T-cell expression within 30 μm of NETs; CD8+ T-cell expression within 30 μm of NETs in the immune-responsive and nonresponsive groups (f).
NETs showed a trend toward a positive correlation with CAFs
Further analysis of the relationship between NETs and CAFs cells revealed a trend of positive correlation between their densities, though this did not reach statistical significance (R = 0.27, p = 0.07; Figure 4(a) and (b)). Within 30 µm of the NETs, the group with high CAF expression had significantly lower PFS (mPFS: 10.9 vs 22 months, p = 0.034; Figure 4(c) and (d)). Similarly, the high CAF expression group had a median OS of only 16 months, whereas the median OS for the low-expression group was not reached, showing a statistically significant difference between the two groups (p = 0.048; Figure 4(e)). In immunotherapy responders, the proportion of CAF cells within 30 µm of the NETs was significantly lower (p = 0.025) (Figure 4(f)).

NET was positively correlated with CAFs. Trend of positive correlation between CAFs and NETs expression (a); representative fluorescence plots of CAFs negatively correlated with NETs expression (b); representative fluorescence plots of CAFs in the range of 30 μm of NETs representative fluorescence plots of CAFs within the NET 30 μm range (c). PFS (d) and OS (e) were worse in the group with high CD8+ T-cell expression within 30 μm of NETs; CAFs expression within 30 μm of NETs in the immune-responsive and nonresponsive groups (f).
Univariate and multivariate analyses of prognostic factors
We performed Cox regression analysis to assess the factors influencing PFS and OS in NSCLC patients. In the univariate analysis for PFS, high NETs expression was associated with poor prognosis (HR = 2.42, 95% CI: 1.07–5.46, p = 0.033). Multivariate analysis further confirmed that high NETs expression was an independent prognostic risk factor for PFS (HR = 2.51, 95% CI: 1.11–5.68, p = 0.027) (Table 2). For OS, univariate analysis revealed that high CD8+ T-cell expression was linked to better prognosis (HR = 0.29, 95% CI: 0.1–0.89, p = 0.031), whereas high NETs expression emerged as a negative prognostic factor for OS (HR = 3.48, 95% CI: 1.4–8.66, p = 0.007). Multivariate analysis confirmed that high NETs expression remained an independent prognostic risk factor for OS (HR = 2.89, 95% CI: 1.14–7.32, p = 0.025) (Table 3).
Univariate and multivariate analyses of clinical variables on progression-free survival.

CAFs, Cancer-associated fibroblasts; CVD, cerebrovascular disease; HR, Hazard ratio; KPS, Karnofsky performance status; LUAD, lung adenocarcinoma; LUSC, lung squamous cell carcinoma; NETs, neutrophil extracellular traps.
Univariate and multivariate analyses of clinical variables on overall survival.
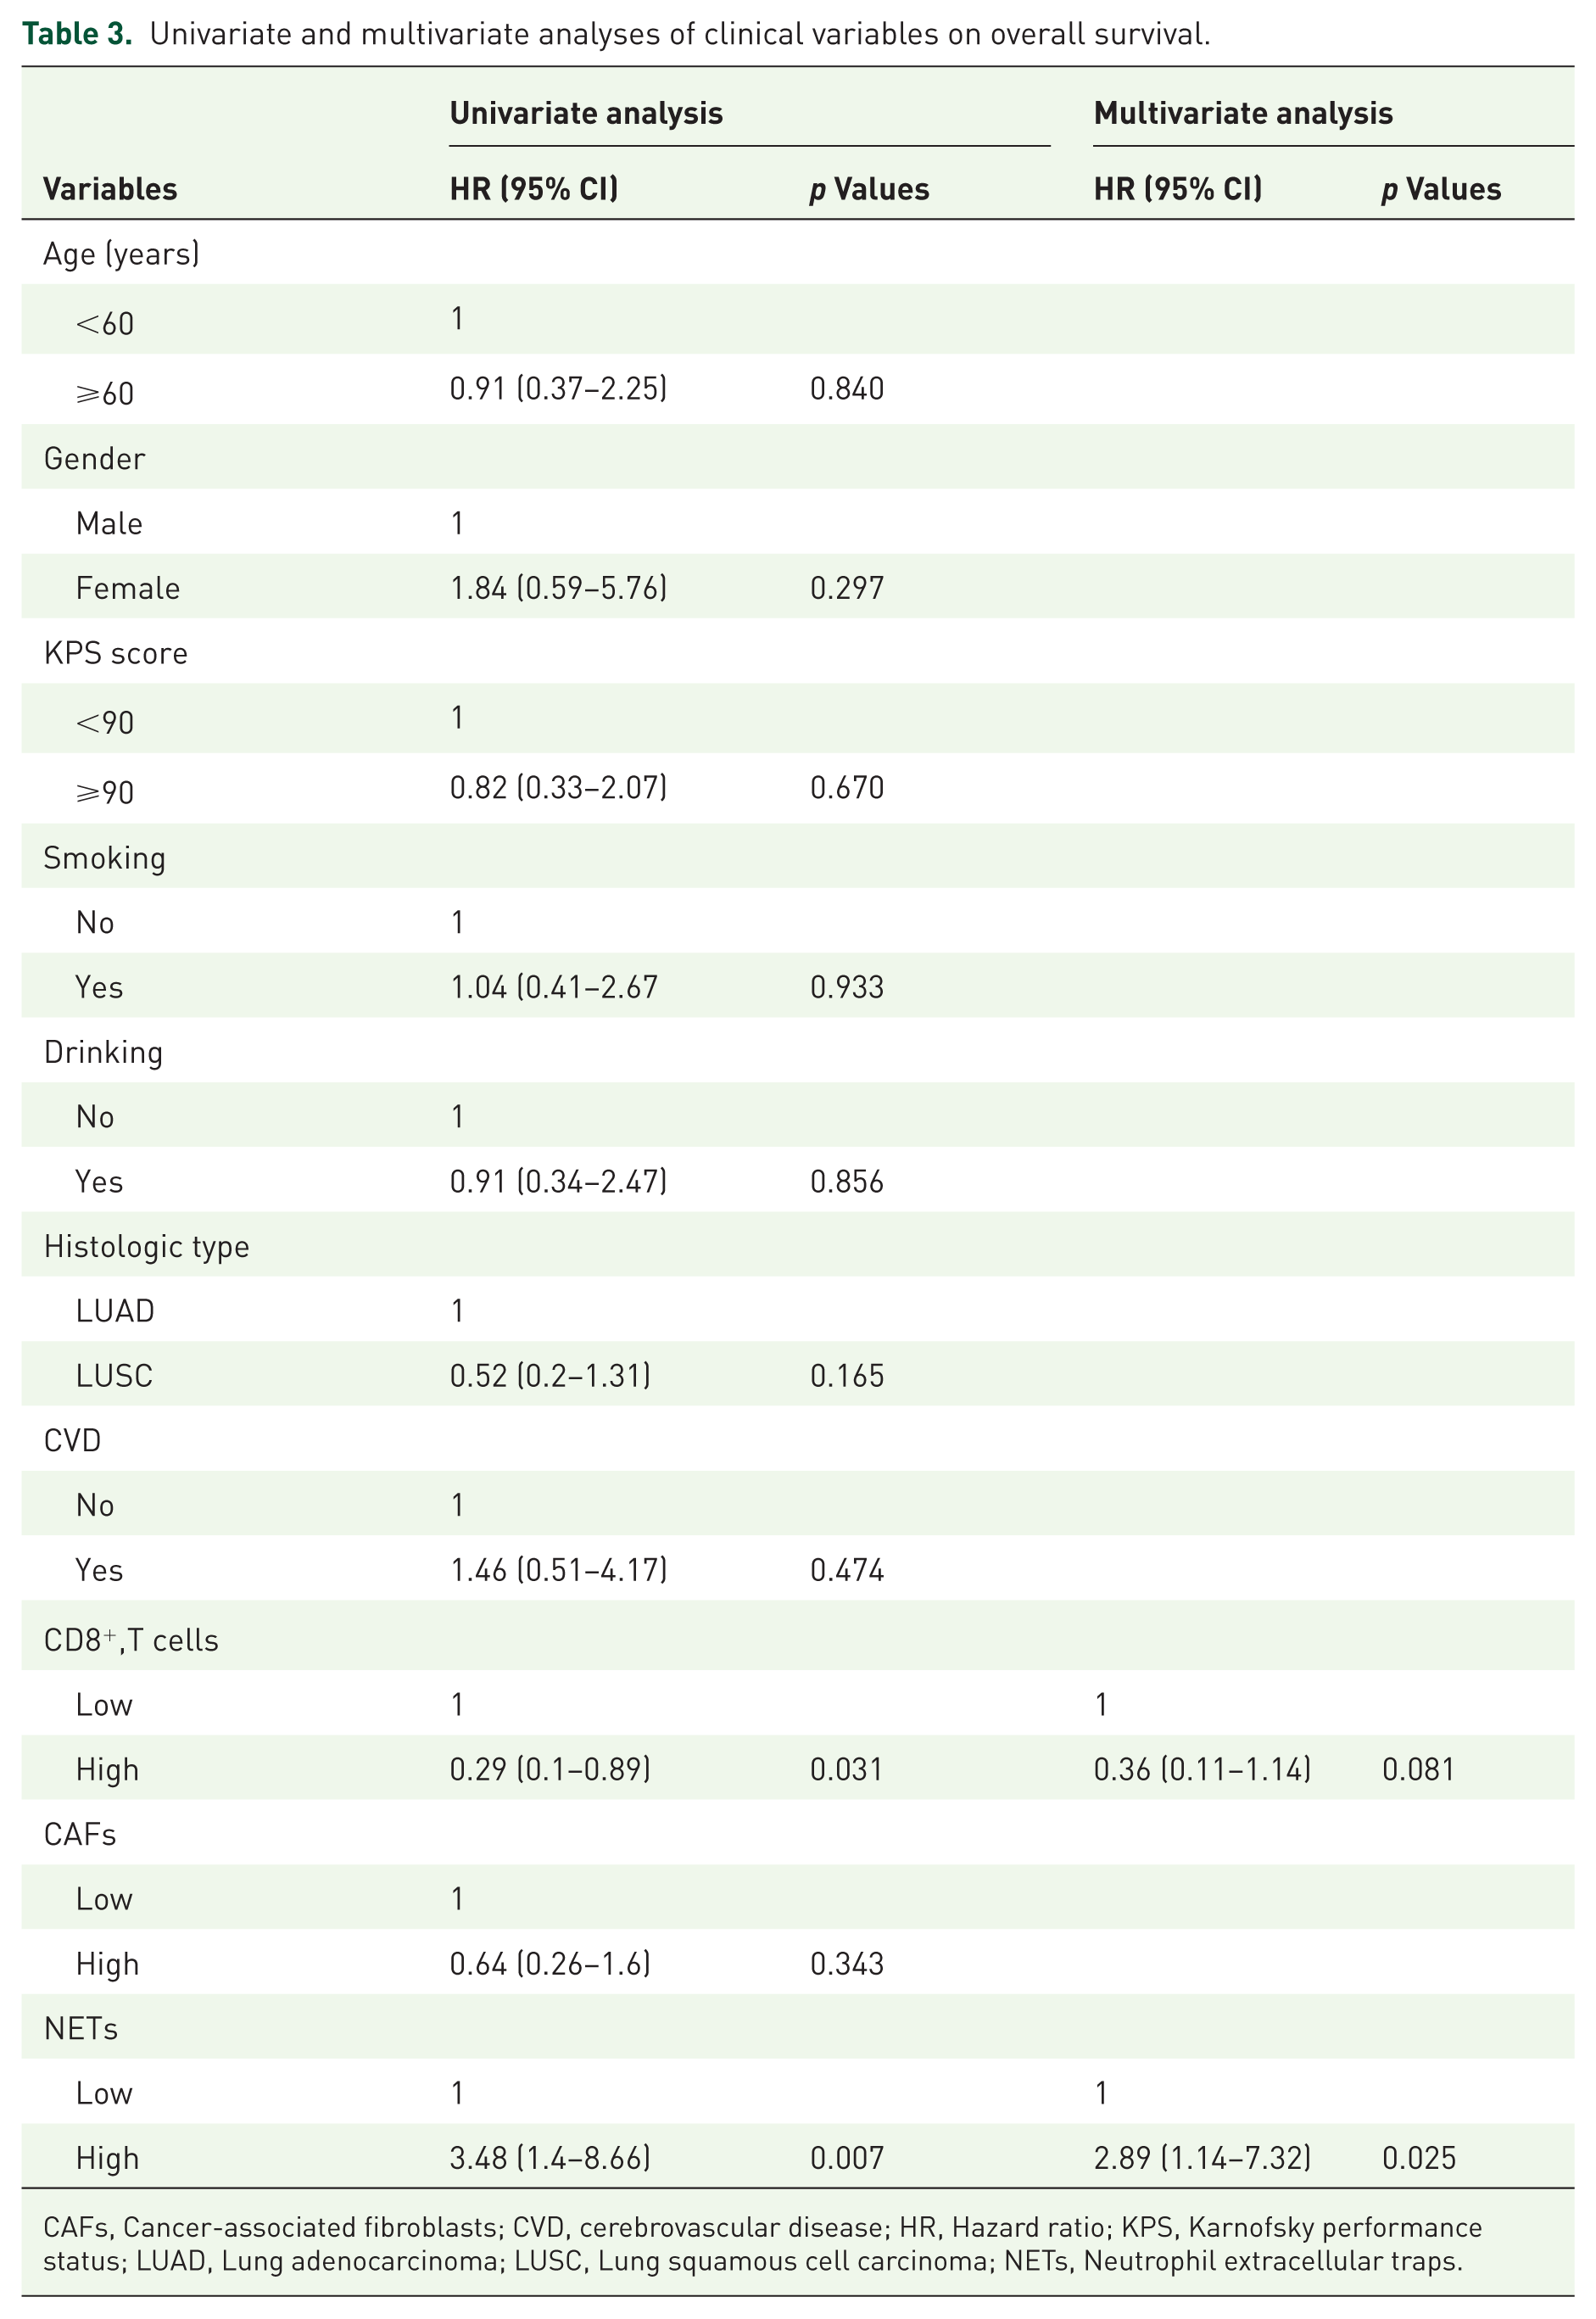
CAFs, Cancer-associated fibroblasts; CVD, cerebrovascular disease; HR, Hazard ratio; KPS, Karnofsky performance status; LUAD, Lung adenocarcinoma; LUSC, Lung squamous cell carcinoma; NETs, Neutrophil extracellular traps.
Discussion
Currently, prognostic predictors for tumor immunotherapy primarily focus on tumor-specific factors such as PD-1 expression, high microsatellite instability (MSI-H), and tumor mutational burden (TMB). 32 However, the complex communication between various factors in the immune microenvironment suggests that we should also consider the broader context beyond the tumor cells. NETs are widely present in tumors and have been shown to play a significant role in tumor progression and metastasis. 22 Increasing evidence suggests that NETs influence not only tumor development but also the immune response. 33 Recent studies have proposed serum NETs as potential biomarkers for cancer immunotherapy. 32 For instance, Guo et al. 34 developed a combined model incorporating serum NETs, CD8+ T cells, and the tumor proportion score, which successfully predicted the efficacy of PD-1 antibody in NSCLC patients. Despite these advancements, the prognostic value of NETs within NSCLC tumor tissues remains largely unexplored. In this study, we assessed the predictive role of NETs for immunotherapy outcomes and analyzed their potential relationships with immune and stromal cells. To the best of our knowledge, this is the first study demonstrating that NETs in tumor tissues can predict NSCLC immunotherapy response and investigating their spatial relationship with CD8+ T cells and CAF cells.
NETs have been shown to influence the tumor microenvironment across various cancers, either directly or indirectly, through interactions with tumor cells. For example, neutrophils can enhance tumor cell retention in blood vessels, facilitating cancer metastasis.35,36 Our analysis of NSCLC immunotherapy cohorts using mIF revealed a negative correlation between NET density and CD8+ T-cell density. Previous studies have reported that an increase in NETs promotes immune evasion and suppresses T cell-mediated antitumor responses. 37 Taifour et al. 24 recently reported that in triple-negative breast cancer, Chi3L1 promotes neutrophil recruitment and NET formation, which in turn inhibits T-cell infiltration, findings consistent with our own. The relationship between NETs and CD8+ T cells is complex. Prior research has shown that CD8+ T cells exposed to NETs exhibit upregulation of exhaustion-related pathways and downregulation of effector genes, which may explain the poorer prognosis observed when CD8+ T cells are in close proximity to NETs. 38 Additionally, NETs can bind to CD8+ T-cell membrane proteins via their DNA components, increasing apoptosis and inhibiting tumor immunity. 39
A positive correlation between NETs and CAFs was also identified. Previous research has shown that CAFs promote NET formation in colorectal cancer liver metastasis. 25 CAFs play a crucial role in preventing the entry of immune cells into tumor tissues and exhibit unique characteristics with high adherence. 40 These studies are consistent with our findings, in which we observed that patients in cases with large numbers of CAFs in the vicinity of the NET had a poorer response to immunotherapy. Additionally, the inflammatory factors released by NETs can activate CAFs, which in turn secrete cytokines and remodel the extracellular matrix, further promoting the formation of NETs.25,26 This interaction can enhance the pro-tumor properties of the TME and accelerate tumor progression. CAFs themselves are known to have immunosuppressive and pro-tumorigenic effects,41,42 such as driving T cell deletion and exhaustion via FASL- and PD-L2-mediated interactions, and producing CXCL12 to exclude T cells from the tumor environment.35,43,44 However, in our study, CAFs expression alone did not significantly correlate with immunotherapy outcomes. These findings suggest that more complex interactions between NETs and CAFs may exist, warranting further investigation.
In summary, our study suggests that NET levels are closely related to prognosis and response to immunotherapy in NSCLC patients, and that NETs may serve as potential biomarkers. The relationships between NETs, CD8+ T cells, and CAFs are intricate, with these cells and substances directly or indirectly influencing immune responses, immunotherapy efficacy, and patient outcomes. The subgroup analyses further support our main findings. In nonresponders, low NETs expression and high CD8+ T-cell density were both associated with significantly improved overall survival, whereas CAFs’ density was not prognostic. These results were consistent with those from the overall cohort. However, in responders, no statistically significant survival differences were observed, likely due to the limited number of events during follow-up. Taken together, these subgroup results highlight the need for validation and deeper exploration in larger, prospective cohorts.
Despite these findings, our study is subject to several limitations. First, the relatively small sample size from a single institution may limit the generalizability of our findings. Second, the distribution of histological subtypes was not balanced between groups: 13 patients with squamous cell carcinoma were included in the nonresponder group compared with seven in the responder group. As the histological subtype may influence immunotherapy response, this imbalance could have affected the outcomes. Third, multiple immune checkpoint inhibitors were used across patients, introducing heterogeneity and limiting the consistency of treatment response evaluation. Although all patients received first-line chemotherapy combined with immunotherapy, the diversity of regimens should be considered when interpreting the results. Finally, the retrospective design inherently carries the risk of selection bias, and future prospective, multicenter studies with larger, histologically balanced cohorts are warranted to validate our conclusions.
Conclusion
This study demonstrates that NETs can predict poor prognosis and response to immunotherapy in NSCLC patients. NETs have a negative impact on both CD8+ T cells and CAFs, and there may be complex interactions between NETs and these components that contribute to reduced immunotherapy efficacy and poorer patient outcomes. Therefore, NETs could serve as a potential biomarker for predicting the efficacy of PD-1/PD-L1 antibodies in NSCLC patients. Importantly, our findings lay the theoretical foundation for combining immunotherapy with anti-NETs and anti-CAFs strategies as an enhanced immunotherapeutic approach.
Supplemental Material
sj-docx-1-tam-10.1177_17588359251387551 – Supplemental material for Neutrophil extracellular traps predict poor response and prognosis in non-small cell lung cancer immunotherapy
Supplemental material, sj-docx-1-tam-10.1177_17588359251387551 for Neutrophil extracellular traps predict poor response and prognosis in non-small cell lung cancer immunotherapy by Juncai Lv, Xi Chen, Ran Zhang, Chen Wang, Jinming Yu, Weiwei Yan and Dawei Chen in Therapeutic Advances in Medical Oncology
Footnotes
References
Supplementary Material
Please find the following supplemental material available below.
For Open Access articles published under a Creative Commons License, all supplemental material carries the same license as the article it is associated with.
For non-Open Access articles published, all supplemental material carries a non-exclusive license, and permission requests for re-use of supplemental material or any part of supplemental material shall be sent directly to the copyright owner as specified in the copyright notice associated with the article.