
Abstract
Objective
The predictive accuracy of the efficacy of immunotherapy remains poor. Therefore, we aimed to develop a predictive model based on gene mutations to assess the immunotherapeutic efficacy in non–small-cell lung cancer.
Methods
Three hundred and thirty-five non–small-cell lung cancer patients treated with immune checkpoint inhibitors were included in our study. The least absolute shrinkage and selection operator Cox regression model, multivariable analysis, and Kaplan–Meier test were used in this study.
Results
We constructed a predictive model based on a 42-gene signature. Patients were classified into low-risk and high-risk groups based on risk scores generated from this model. Compared with patients in the high-risk group, those in the low-risk group showed better survival (median survival time: 36.0 vs. 6.0 months, p < 0.0001, unadjusted hazard ratio: 0.32, 95% confidence interval, 0.24–0.42). The results were confirmed in an external validation cohort. Moreover, patients with high tumor mutation burden in the high-risk group could not benefit from immune checkpoint inhibitors.
Conclusions
A predictive model for evaluating the efficacy of immunotherapy was developed and validated. The model is based on multiple genetic information and has clinical translational value.
Introduction
Lung cancer is still the leading cause of mortality among all malignancies worldwide. 1 It includes two histological types, non–small-cell lung cancer (NSCLC) and small-cell lung cancer.2,3 NSCLC accounts for 80%–85% of all lung cancers, and its overall survival (OS) remains poor.4,5 The OS of NSCLC is only approximately 20% according to a previous report. 6 Several factors impact the OS of NSCLC, such as treatment approach, age, level of lactate dehydrogenase, and time of treatment.3,7–10 Importantly, changes in treatment modalities have profoundly altered the prognostic characteristics of NSCLC patients. Recently, with the development of targeted therapies and immunotherapy, the prognoses of NSCLC patients have improved.5,11,12 In addition, immune checkpoint inhibitors (ICIs) increase the OS of NSCLC patients; however, only a small number of patients may acquire durable survival benefits from ICIs. 13 Therefore, it is critical to identify patients who can benefit from ICIs accurately.
In the guidelines and clinical practice, the protein expression of programmed cell death ligand-1 (PD-L1) and tumor mutation burden (TMB) are used to evaluate the treatment effect of ICIs. 14 In addition, NSCLC patients with high PD-L1 expression or high TMB generally exhibit an effective response to ICIs. However, there are still some patients who show no response to ICIs, even with high PD-L1 expression or high TMB. 15 Accordingly, it is important to identify precise and reliable predictors to assess the effect of ICIs. Previous studies have demonstrated that some gene mutations are likely to be related to the assessment of the response rate of ICI treatment. For example, NSCLC patients harboring epidermal growth factor receptor (EGFR) gene mutations showed poor responses to ICIs; however, those with FAT1 mutations tended to exhibit improved response rates.14,16 Recently, a study by Pan et al. 17 suggested that a gene pool related to ICI therapy can predict the tumor response to immunotherapy. Thus, analyzing extensive genetic information could more accurately predict the efficacy of immunotherapy for NSCLC patients. Accordingly, we constructed a predictive model based on a multi-gene mutation to assess the efficacy of ICIs and evaluate the OS of NSCLC using the least absolute shrinkage and selection operator (LASSO) Cox regression. The preprint of the study has been published. 18
Materials and methods
Patients and data sources
The patient data were obtained from an online data repository (https://www.cbioportal.org, accessed on 16 January 2022). The flow diagram of this study is shown in Figure 1. First, the data from 335 NSCLC patients treated with ICIs in the Memorial Sloan Kettering Cancer Center (MSKCC) Dataset (MSKCC-ICI) were used to construct a predictive model. 19 Next, the analysis of another independent cohort was conducted to validate the model. Another database analyzed in this study was from the Rizvi cohort, which contained 240 advanced NSCLC patients treated with ICIs. 20 There was a difference between the two cohorts; the Rizvi cohort presented progression-free survival (PFS) data, while the MSKCC-ICI cohort showed OS data. Regarding missing data, we considered removing patients with missing data. We have de-identified all patient details in the present study. We conducted our study in accordance with the Helsinki Declaration of 1975, as revised in 2024. The reporting of this study conforms to the Strengthening the Reporting of Observational Studies in Epidemiology (STROBE) guidelines. 21

Selection criteria for patients in this study.
Study assessment
In this study, we used some standards to assess the effect of ICIs. The standard of the Response Evaluation Criteria in Solid Tumors version 1.1 was employed to evaluate the objective response to ICIs. 22 PFS was defined as the time from the diagnosis of NSCLC or the beginning of ICI treatment to the date of progression of disease from any cause. OS was defined as the time from the diagnosis of NSCLC or the start of ICI treatment to death or the date of the last follow-up. 23
Statistical analyses
Kaplan–Meier analysis was used to evaluate the correlation between gene mutations and OS, and the significance of the correlation was assessed using the log-rank test. Gene mutations correlated with OS (p ≤ 0.10) were selected as candidate genes, and the LASSO Cox regression was conducted to construct a multi-gene mutation–based model.24–27 Time-dependent receiver operating characteristic (ROC) curves and areas under the curves (AUCs) were generated to calculate predictive accuracy. Univariable and multivariable Cox regression were also used to calculate the hazard ratio (HR) and 95% confidence intervals (CIs). Schoenfeld residuals test was used to assess the proportional hazards assumption. Differences between continuous variables were compared using the Mann–Whitney U test. The relationship between categorical variables was assessed using Pearson’s chi-square test. Statistical tests were performed via R software (version 4.0, accessed on 1 February 2021) and GraphPad Prism (version 8.4.3, accessed on 11 February 2022). A two-sided p-value <0.05 was considered statistically significant. The primary endpoint of the study was OS. Concordance index (C-index) was used to compare the predictive ability among the 42-gene model, PD-L1, and TMB.
Results
Construction of the gene mutation–based model
In the primary cohort of 350 patients, there were 271 adenocarcinomas (77.4%) and 45 squamous cell carcinomas (12.9%). The five genes with the highest frequency of mutations in the population were TP53 (n = 217, 62.0%), KRAS (n = 124, 35.4%), STK11 (n = 70, 20.0%), KEAP1 (n = 70, 20.0%), and PTPRD (n = 43, 12.3%). Moreover, the five structural variant genes with the highest frequency in the cohort were TAP1, ROS1, CD74, BRAF, and ALK, accounting for 0.9%–2.0%. In addition, 170 patients had no metastatic disease, while 53 had metastatic lymph nodes (Figure 2). The distribution of TMB is shown in Figure 3(a). There were 219 death events in this cohort. Moreover, the TMB (p = 0.0199) and mutation count (p = 0.0271) were higher in living patients than in dead patients (Figure 3(b) and (c)).

Metastatic status of patients.
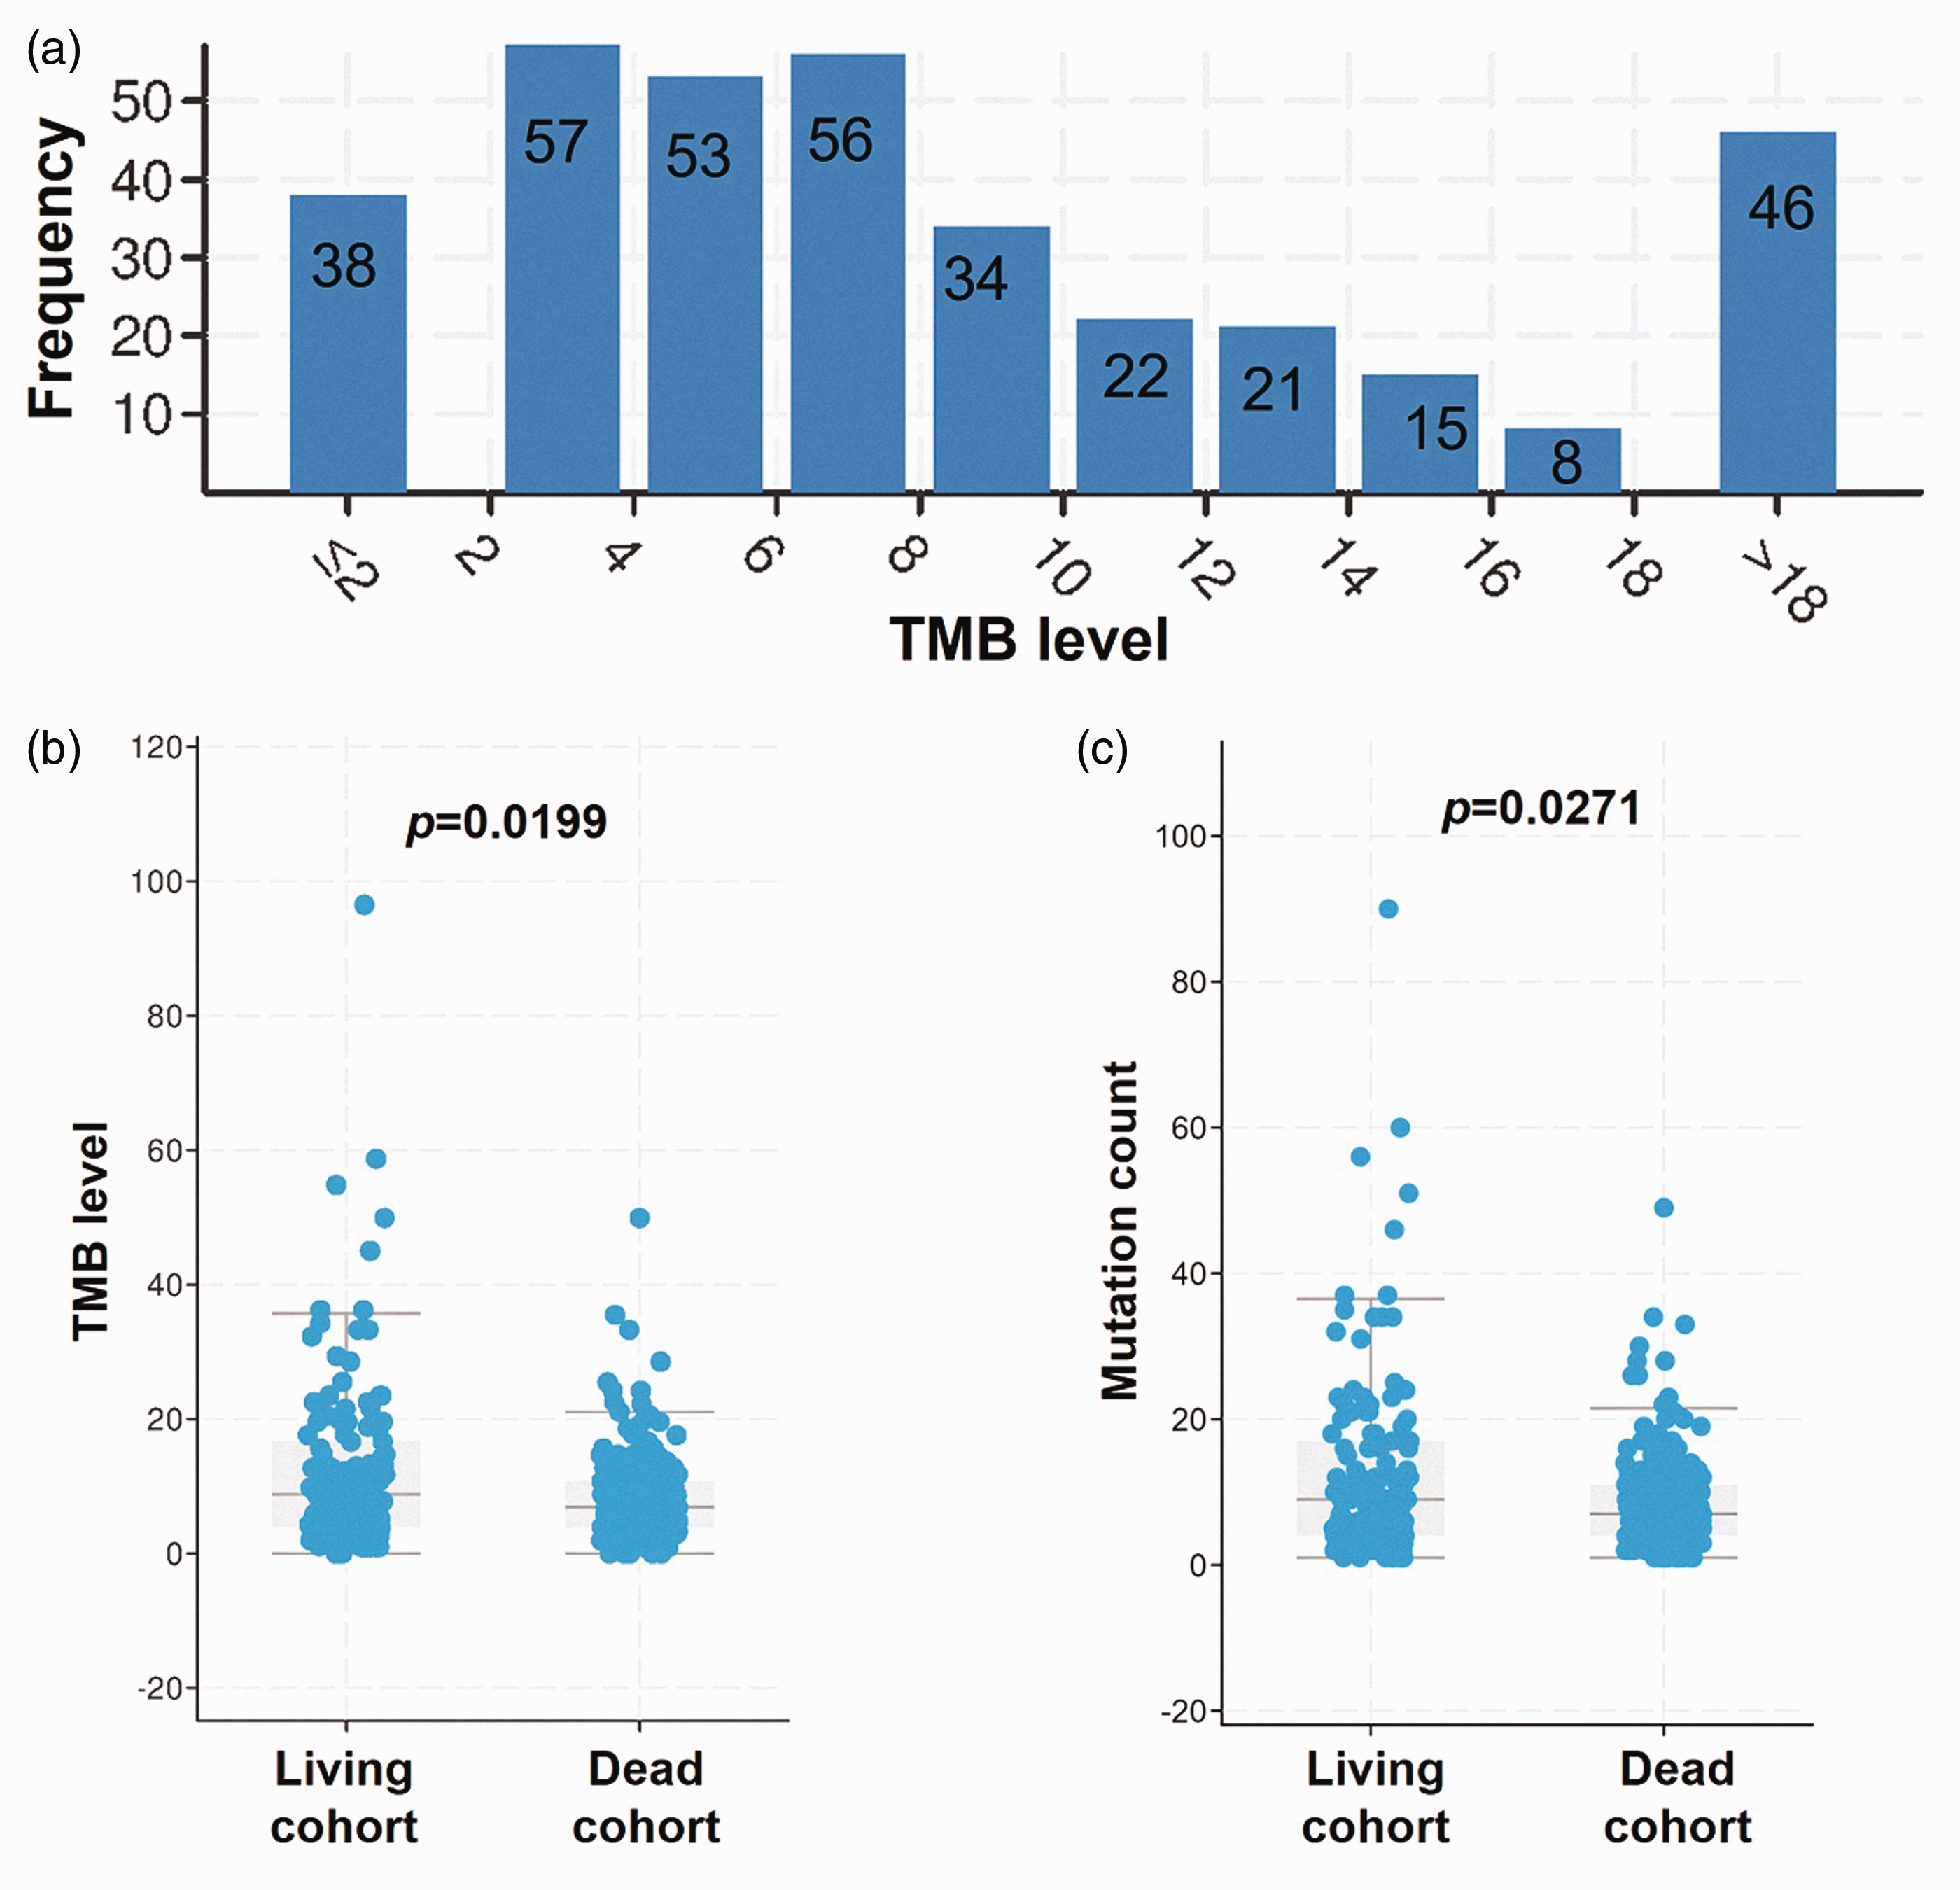
Distribution of tumor mutation burden in all patients (a). Comparison of tumor mutation burden (b) and mutation count (c) in different cohorts.
After selection, the clinical and genetic characteristics of the included patients are shown in Table 1. Then, the LASSO Cox regression was performed to screen the most useful prognostic marker and develop a multi-gene mutation–based model. Consequently, a 42-gene–based model was constructed based on the selection of primary 400-gene data (Figure 4). Finally, each patient’s risk score was calculated based on the mutation status of these 42 genes, weighted by their regression coefficient (Supplementary Table 1). These genes were mainly enriched in the pathway in cancer (Figure 5).
Clinical and genetic characteristics of the included patients.

ICI: immune checkpoint inhibitor; MSKCC: Memorial Sloan Kettering Cancer Center; PD-L1: programmed cell death ligand-1; TMB: tumor mutation burden; LUAD: lung adenocarcinoma.

Construction of the gene mutation–based model via the least absolute shrinkage and selection operator Cox regression.
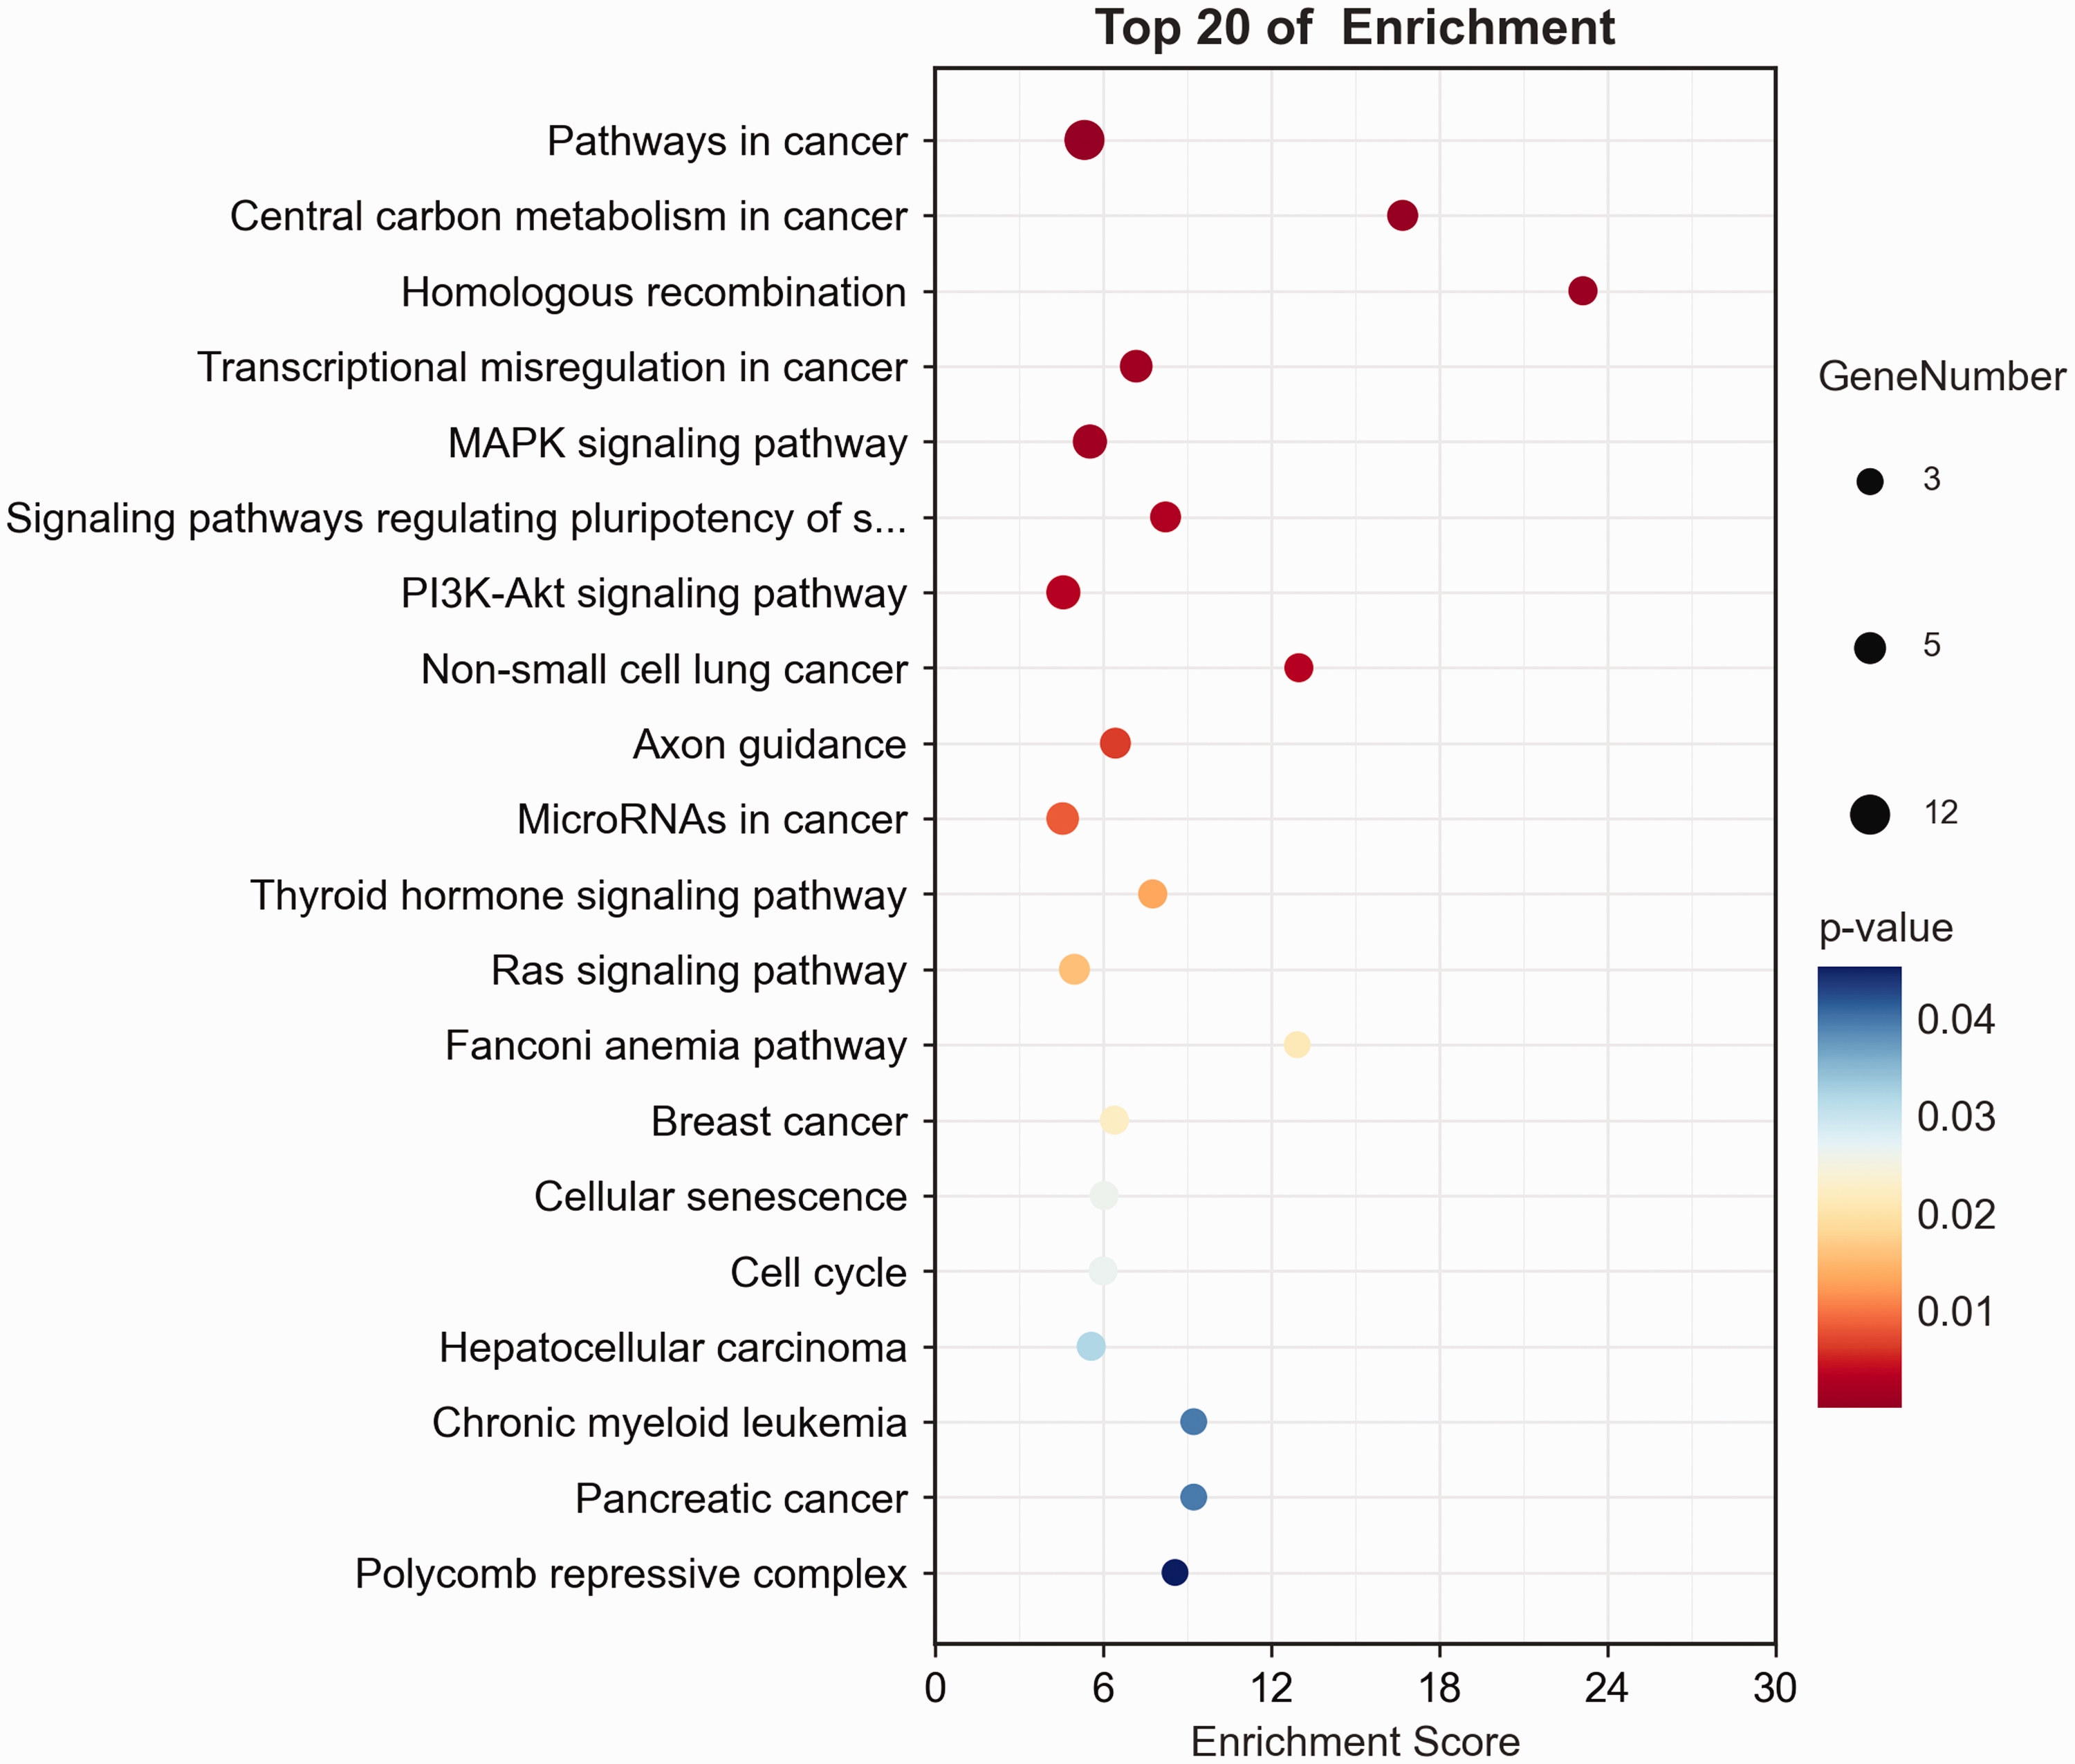
Kyoto Encyclopedia of Genes and Genomes (KEGG) analysis of 42 genes.
Risk score = (ABL1 × −0.78967 + ASXL1× −0.45289 + ATM × −0.26545 + BRCA2 × −0.31982 + BRCA2 × −0.29294 + CRLF2 × −1.63983 + EPHA3 × − 0.25894 + EPHA5 × −0.18095 + EPHA7 × −0.68611 + FAM46C × −0.93176 + FGFR4 × −0.48967 + FLT3 × − 0.47936 + HIST1H3I × 2.06715 + INHBA × − 0.03913 + JAK3 × 0.12284 + MAP2K1 × 0.71984 + MAX × −0.88646 + MED12 × − 0.97528 + MET × −0.59535 + MGA × − 0.39238 + MYOD1 × 0.46599 + NF2 × − 0.94475 + NOTCH1 × −0.81536 + NOTCH2 × −0.30962 + NTRK3 × − 0.25712 + NUF2 × −1.36764 + PAX5 × −1.30888 + PBRM1 × 1.11437 + PIK3C3 × −0.36023 + PMS2 × 1.35689 + PPP2R1A × −0.03692 + PRDM14 × 0.91605 + PTPRD × −0.14296 + RAD21 × 1.68561 + RAD50 × −1.62618 + RET × −0.20603 +SDHB × 0.83744 + STK40 × 2.0244 + TET1 × − 0.27632 + TGFBR2 × 0.77316 + VTCN1 × 1.3383 + ZFHX3 × −0.77807). Each gene had two statuses, mutation and nonmutation. Mutated status scored 1, and nonmutation status scored 0.
The cutoff value for risk score was its median value (risk score = 0). Patients in the MSKCC-ICI cohort were classified into low-risk (n = 168) and high-risk (n = 167) groups based on the cutoff value for risk score. Compared with patients in the high-risk group, those in the low-risk group had more improved OS (36.0 vs. 6.0 months, p < 0.0001, unadjusted HR: 0.32, 95% CI: 0.24–0.42; Figure 6(a)). The AUC value for 3-year OS was 0.84 (95% CI: 0.79–0.88). Multivariable Cox regression showed that the risk score was an independent factor for OS in the training cohort (adjusted HR: 3.55, p < 0.001; Table 2).

Survival curves based on risk score in the Memorial Sloan Kettering Cancer Center database (a) and Rizvi cohort (b).
Univariable and multivariable analyses of overall survival in the Memorial Sloan Kettering Cancer Center database and those of progression-free survival in the Rizvi cohort.
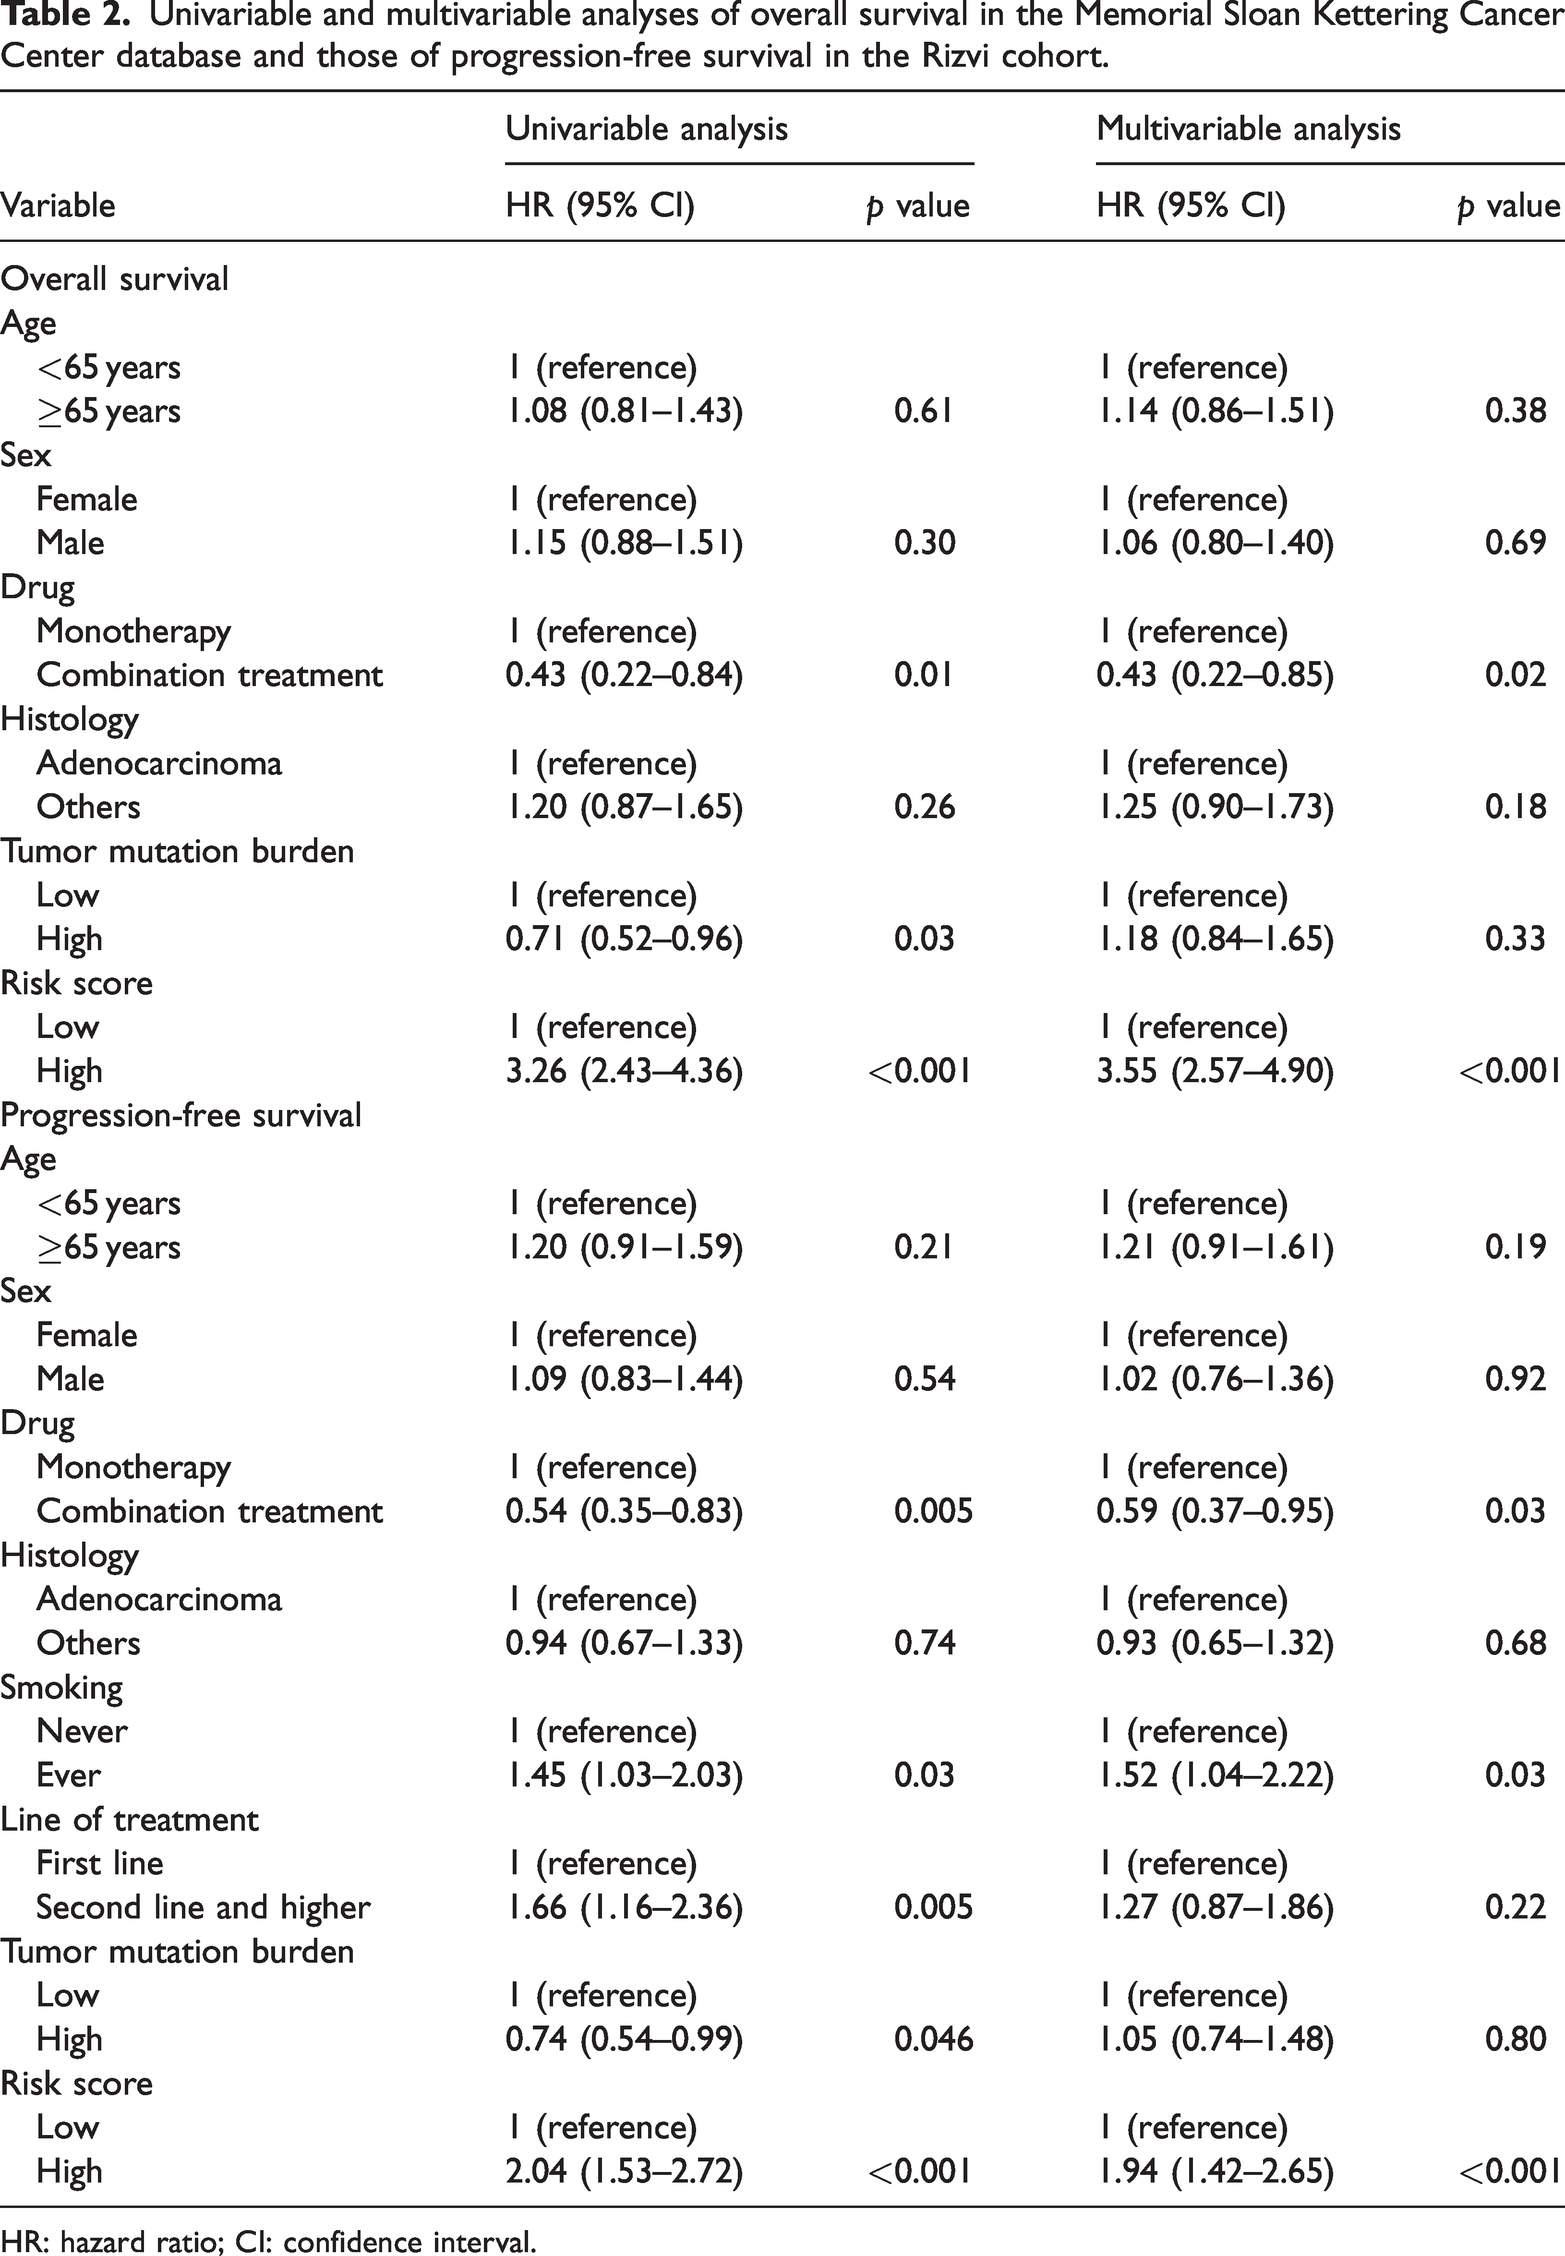
HR: hazard ratio; CI: confidence interval.
External validation of the gene mutation signature
Patients in the Rizvi cohort were also classified into low-risk (n = 131) and high-risk (n = 109) groups using the same cutoff value. Similarly, patients in the low-risk group had better PFS than those in the high-risk group (5.37 vs. 2.37 months, p < 0.0001, unadjusted HR: 0.51, 95% CI: 0.38–0.68; Figure 6(b)). The AUC value for 1-year PFS was 0.74 (95% CI: 0.71–0.78). TMB ≥10 mutations/Mb was considered high. 17 Thus, the cutoff value for TMB was determined as 10 mutations/Mb. Multivariable cox regression also showed that the risk score was an independent factor for PFS in the external validation cohort (adjusted HR: 1.94, p < 0.001; Table 2).
Relationship among the risk score, TMB, and PD-L1
We investigated the relationship between the mutation signature, TMB, and PD-L1 expression. In the low-risk group of the MSKCC-ICI cohort, 82 patients (48.8%) were TMB-high (TMB ≥ 10 mutations/Mb), and 86 (51.2%) were TMB-low. Moreover, 30 patients (18.0%) were TMB-high, and 137 (82.0%) were TMB-low in the high-risk group (p < 0.001). Furthermore, the median TMB in the low-risk group was significantly higher than that in the high-risk group (9.84 vs. 5.58 mutations/Mb). The results were consistent in the Rizvi cohort (Table 1).
In addition, we performed subgroup analysis. Patients with high TMB in the high-risk group had significantly worse OS (4.0 vs. 24.0 months, all p < 0.001, HR: 12.88, 95% CI: 6.37–26.05; Figure 7(a)) and PFS (1.98 vs. 4.33 months, all p < 0.01, HR: 2.81, 95% CI, 1.48–5.34; Figure 7(b)) compared with those with low TMB in the low-risk group. The C-indexes of risk score, TMB, and PD-L1 are presented in Table 3. The risk score had the best prognostic predictive ability among those tools.

Survival curves based on risk score and tumor mutation burden in the Memorial Sloan Kettering Cancer Center database (a) and Rizvi cohort (b).
The C-index of each indicator in the two cohorts.

ICI: immune checkpoint inhibitor; MSKCC: Memorial Sloan Kettering Cancer Center; PD-L1: programmed cell death ligand-1; TMB: tumor mutation burden.
Discussion
Immunotherapy is receiving substantial attention worldwide. A report stated that the number of clinical trials on immunotherapy has increased every year from 2017 to 2021. 28 The scope of immunotherapy has broadened from advanced stage tumors to more early-stage tumors. In the case of lung cancer, the use of immunotherapy already extends to advanced lung cancer, preoperative neoadjuvant therapy, and postoperative adjuvant therapy. 14 Therefore, the applicable population of immunotherapy is gradually increasing.
The use of ICIs improves the survival of NSCLC patients significantly, and ICIs have been the first-line treatment drug in clinical practice. 14 The guidelines suggest treatment options according to the level of PD-L1 expression and TMB. However, some patients with high PD-L1 expression or high TMB do not respond to ICIs. 15 Approximately 20% of lung cancer cases constitute the beneficiary population of immunotherapy. A previous study stratified the prognosis of immunotherapy patients by calculating the proportion score, and the median survival time of patients with a proportion score <1% was only approximately 10 months; however, patients with a proportion score >50% did not relapse even during the observation period. 29 This indicates that the prognosis of patients who also undergo immunotherapy varies greatly. Accordingly, there is an urgent need to identify predictive factors with more accuracy. In the present study, we developed and validated a multi-gene mutation signature which could predict immunotherapeutic efficacy in NSCLC patients. By using this model, patients could be identified as low-risk or high-risk individuals. We found a median OS of 36 months in the low-risk group versus only 6 months in the high-risk group. Moreover, the model uncovered that patients in the high-risk group could not benefit from ICIs even with high TMB. To prevent data overfitting, we used L1 regularization to increase λ, which made the screened data more stable. Therefore, this model has a better predictive ability and clinical translation value.
TMB, as a predictive factor for immunotherapy, still needs to be supplemented by other valid prediction information. The rate of response to immunotherapy in patients with high TMB is still low. 14 In addition, the results of multivariable Cox regression analysis showed that TMB was not an independent predictor. Furthermore, patients with high TMB in the high-risk group could not benefit from ICI treatment based on the subgroup analysis. Thus, the multi-gene mutation model could provide important supplementary information on TMB while predicting the efficacy of immunotherapy.
Information about gene mutations should be noticed. For example, the statuses of driver gene mutations play important roles in predicting the efficacy of immunotherapy. A previous study showed that patients with EGFR mutations had a less durable effect of immunotherapy than those with KRAS or MET mutations. 15 In this study, we also found that patients with MET mutation had low risk scores, indicating longer survival. In addition, we focused on other gene mutations, such as ATM, EPHA, and NOTCH mutations. A previous report uncovered that ATM was associated with regulating cellular innate immunity, which might have an effect on immunotherapy. 30 Thus, we screened the ATM gene as a candidate factor for constructing the model in the present study. Notch signaling is crucial for the differentiation and homeostasis of immune cells, which contributes to the modulation of organ-specific immune responses.31,32 Another study confirmed that the status of NOTCH could be considered a potential predictor of ICI response. 33 Therefore, for predicting the efficacy of immunotherapy, the genetic landscape plays a significant role. It is advisable for patients to perform genetic testing before undergoing immunotherapy.
This study still has some limitations. First, the data used in this study are part of a prospective clinical trial; our study is still retrospective in nature. Some selection bias is inevitable. For example, the two databases contain an uneven distribution of ethnicity. Second, although our prediction model was demonstrated on both databases and the AUC values performed well, a careful review is needed when applying our conclusions because the two databases present different endpoint events. Third, the sample size of our study is too small and lacks samples from Asian populations. The Asian populations showed great differences in driver mutation frequencies compared with the European and American populations. We need to further classify Asian patients based on their responses to targeted therapy and immunotherapy. Therefore, we still need to construct a database of Asian populations that show adequate responses to immunotherapy to validate our model. Fourth, the model can only be used as a differentiator of treatment efficacy in the immunotherapy population and is not a substitute for treatment. For example, patients in the low-risk group still need to receive the appropriate treatment.
Conclusions
A predictive model for evaluating the efficacy of immunotherapy was developed and validated. The model is based on multiple genetic information and has clinical translational value.
Supplemental Material
sj-pdf-1-imr-10.1177_03000605251371278 - Supplemental material for A predictive model for evaluating the efficacy of immunotherapy in non–small-cell lung cancer patients: A real-world study
Supplemental material, sj-pdf-1-imr-10.1177_03000605251371278 for A predictive model for evaluating the efficacy of immunotherapy in non–small-cell lung cancer patients: A real-world study by Hai-Hong Yu, Jun-Quan Zeng, Jin-Hua Yuan and Bin Liu in Journal of International Medical Research
Footnotes
Acknowledgments
None.
Author contributions
Conceptualization, Hai-Hong Yu; Data curation, Bin Liu; Formal analysis, Bin Liu; Funding acquisition, Bin Liu, Jun-Quan Zeng, and Jin-Hua Yuan; Methodology, Hai-Hong Yu, Jin-Hua Yuan, and Bin Liu; Resources, Hai-Hong Yu and Bin Liu; Supervision, Bin Liu; Validation, Bin Liu; Writing–original draft, Bin Liu; Writing–review & editing, Hai-Hong Yu.
Consent to publication
Not applicable.
Data availability statement
The data used are publicly available. Researchers interested in this study can submit data requests to our corresponding authors.
Declaration of conflicting interests
The authors declare no conflict of interest.
Funding
This research was funded by the Science and Technology Plan Project of Jiangxi Provincial Health Commission (grant number 202310053 & 202310853), Scientific and Technological Research Project of Jiangxi Provincial Department of Education (grant number GJJ170648 & GJJ2201628), Jiangxi Province Natural Science Foundation for Youths (grant number 20232BAB216093), and Key Science and Technology Plan of Ji’an City Science and Technology Bureau (Ji Cai Jiao Zhi [2024] No. 52 Youth-13).
Institutional review board statement
The study was conducted in accordance with the Declaration of Helsinki and approved by the Institutional Review Board of The Affiliated Hospital of Jinggangshan University (No. 2022-009).
Informed consent statement
Not applicable.
Supplemental material
Supplemental material for this article is available online.
References
Supplementary Material
Please find the following supplemental material available below.
For Open Access articles published under a Creative Commons License, all supplemental material carries the same license as the article it is associated with.
For non-Open Access articles published, all supplemental material carries a non-exclusive license, and permission requests for re-use of supplemental material or any part of supplemental material shall be sent directly to the copyright owner as specified in the copyright notice associated with the article.