
Abstract
Background:
Glioblastoma (GBM) is the most aggressive and lethal central nervous system (CNS) tumor. The treatment strategy is mainly surgery and/or radiation therapy, both combined with adjuvant temozolomide (TMZ) chemotherapy. Historically, methylation of MGMT gene promoter is used as the major biomarker predicting individual tumor response to TMZ.
Objectives:
This research aimed to analyze genes and molecular pathways of DNA repair as biomarkers for sensitivity to TMZ treatment in GBM using updated The Cancer Genome Atlas (TCGA) data and validate the results on experimental datasets.
Methods:
Survival analysis of GBM patients under TMZ therapy and hazard ratio (HR) calculation were used to assess all putative biomarkers on World Health Organization CNS5 reclassified TCGA project collection of molecular profiles and experimental multicenter GBM patient cohort. Pathway activation levels were calculated for 38 DNA repair pathways. TMZ sensitivity pathway was reconstructed using a human interactome model built using pairwise interactions extracted from 51,672 human molecular pathways.
Results:
We found that expression/activation levels of seven and six emerging gene/pathway biomarkers served as high-quality positive (HR < 0.61) and negative (HR > 1.63), respectively, patient survival biomarkers performing better than MGMT methylation. Positive survival biomarkers were enriched in the processes of ATM-dependent checkpoint activation and cell cycle arrest whereas negative—in excision DNA repair. We also built and characterized gene pathways which were informative for GBM patient survival following TMZ administration (HR 0.18–0.44, p < 0.0009; area under the curve 0.68–0.9).
Conclusion:
In this study, a comprehensive analysis of the expression of 361 DNA repair genes and activation levels of 38 DNA repair pathways revealed 13 potential survival biomarkers with increased prognostic potential compared to MGMT methylation. We algorithmically reconstructed the TMZ sensitivity pathway with strong predictive capacity in GBM.
Introduction
Gliomas are the most lethal tumors of the central nervous system (CNS) arising from glial or glial progenitor cells.1,2 Depending on the degree of malignancy according to the World Health Organization (WHO) classification, gliomas can be divided into high-grade and low-grade gliomas (LGG), with the latter accounting for approximately 15% of primary brain tumors. 3 Glioblastoma (GBM) is the most frequently diagnosed malignant brain tumor and the most aggressive form of glioma that is also characterized by outstanding histomorphological diversity.4,5 While high-grade malignant gliomas have a median survival of 1–2 years, the median survival for patients with different forms of LGG varies between 5 and 10 years.6,7 Overall, the 5-year survival rate for all patients with CNS tumors is nearly 35%, whereas for the GBM this rate is as low as about 5%.7–9 Furthermore, this estimate of 5-year survival is even lower for patients over 40 years old.8–11
Current standards of GBM treatment include maximum surgical resection followed by radiation therapy and adjuvant therapy with temozolomide (TMZ).12,13 TMZ is a DNA methylating agent prodrug that adds methyl groups to purine bases at the positions of N3-adenine, and N7- and O6-guanine. This results in the accumulation of cytotoxic lesion O6-methylguanine that can be directly removed by DNA repair enzyme methylguanine methyltransferase (MGMT) in tumors expressing this protein. Alternatively, it can be tolerated in mismatch repair-deficient tumors. 14 TMZ demonstrates reduced side effects15,16 and it was shown to be effective in other tumors as well including melanoma, lung, colon, and ovarian cancers. 15 Nevertheless, tumor recurrence is observed in most if not all of the GBM patients. 17
Historically, gliomas were considered to originate from differentiated astrocytic and/or oligodendrocytic components of the CNS. 18 According to the WHO glioma classification criteria accepted in 2007, the classification of diffuse gliomas was based on tumor histology. 19
Recent developments in genetic and transcriptional profiling led to the identification of specific molecular signatures of GBM that provide a better understanding of the molecular pathogenesis of this disease. 20 Consequently, a number of potential prognostic and diagnostic biomarkers have been proposed, including MGMT promoter methylation status, EGFR amplification, TERT promoter mutations, CDKN2A deletion, IDH1/2 mutations, 1p/19q codeletion, ATRX mutations, mutations in histone H3 subgroup (H3F3A, HIST1H3B, HIST1H3C), gain of chromosome 7, and loss of chromosome 10.5,21–23 For example, the methylation of MGMT promoter was reported to be strongly associated with decreased expression of this gene and is considered as a favorable prognostic biomarker for GBM patients receiving TMZ. 24
Over the past decade, molecular tumor research provided more reliable information about the complex genetic, chromosomal, and epigenetic changes in gliomas that accompany glioma formation and maintenance. As a result, the most recent WHO guidelines adopted in 2021 fundamentally changed the principles of classification of gliomas by introducing a number of molecular biomarkers that have to be mandatory considered when diagnosing GBM and other CNS tumors. 25
However, most of the currently available molecular genetic studies of GBM including those dealing with biomarkers discovery were developed or validated using the tumor molecular profiles obtained and annotated within the framework of The Cancer Genome Atlas (TCGA) project 26 with outdated diagnoses available for roughly 1047 tumor cases. 23 However, our more recent analysis showed that ~59.3% of them were misdiagnosed, and the actual number of GBM cases in the TCGA collection is 426 according to the latest WHO CNS5 tumor classification. 23 Thus, the majority of GBM molecular biomarkers must be reinvestigated using updated TCGA sampling.
Methylated promoter is connected with reduced expression of MGMT which makes cancer cells more sensitive to alkylating agents; thus, methylation of the MGMT promoter is considered as a positive prognostic biomarker for TMZ therapy of GBM. However, the performance of this currently accepted biomarker seems to be not ideal and is frequently debated. 27 At the same time, emerging biomarkers dealing with the expression levels of relevant analytes such as DNA repair genes and activation levels of the molecular pathways were recently proposed as the diagnostic alternative.28–30 For example, this includes the Oncobox TMZ drug score that is calculated for an individual patient as the logarithm of a ratio of MGMT expression levels in tumors to normal tissues.17,31
Materials and methods
Design of the study
This study was designed to investigate whether the metrics connected to TMZ-related DNA alkylation repair and alternative to MGMT promoter methylation may be related to response on TMZ and survival of GBM patients. To this end, we considered as the potential molecular biomarkers RNA sequencing expression levels of 361 genes included in 38 DNA repair molecular pathways, 32 and the activation levels of the respective 38 molecular pathways. The pathway activation level (PAL) metric used here reflects the extent of up/downregulation of a pathway in tumor samples under analysis compared to the corresponding healthy norms. 33 Positive PAL indicates upregulation of a pathway, zero PAL means no changes in pathway activation, and negative PAL means downregulation. In recent studies, PALs were shown to be promising tumor biomarkers outperforming expression levels of individual genes. 34 These were compared here with the widely used in clinical routine GBM predictive biomarker: MGMT gene promoter methylation status.
In this study, we used a combinatorial approach encompassing analysis of the (i) experimentally established RNA sequencing profiles for GBM sampling of patients with clinical annotations of progression-free survival (PFS) and available MGMT promoter methylation data, and (ii) with publicly available clinically annotated GBM molecular datasets: TCGA and Chinese Glioma Genome Atlas (CGGA) databases.
Literature biosamples
Literature GBM RNA sequencing gene expression profiles annotated by patient overall survival (OS) and PFS data were extracted from TCGA 35 and CGGA36–39 databases (Table 1).
Statistics of literature and experimental GBM datasets investigated.

CGGA, Chinese Glioma Genome Atlas; GBM, glioblastoma; OS, overall survival; PFS, progression-free survival; TCGA, The Cancer Genome Atlas; WHO, World Health Organization.
The “GBM” diagnoses for TCGA-GBM and CGGA-GBM cases were reclassified in accordance with the fifth edition updated WHO recommendations on CNS tumors. 23 RNA sequencing data (HTseq counts) and DNA methylation array data (SeSAMe methylation beta estimations) were downloaded from the GDC Data Portal (https://portal.gdc.cancer.gov/). In total, 368 methylation data files and 219 RNA expression files were downloaded for the reclassified TCGA-GBM dataset. OS data were extracted from clinical annotations on the GDC Data Portal for 434 reclassified GBM samples.
Methylation and gene expression data were obtained from CGGA for two groups of tumor samples (CGGA_325, batch 1, and CGGA_693, batch 2).36–39 A fraction of biosamples where sufficient molecular marker information was available could be reclassified according to WHO CNS5 recommendations 23 : 71 RNA expression files, 70 methylation files, and 71 patient OS and PFS data records for the “CGGA_325” batch, and 154 RNA expression files, 125 methylation files, and 153 patient OS and PFS data records, respectively, for the “CGGA_693” batch.
Experimental biosamples
Experimental clinically annotated GBM tissue biosamples were obtained from three different clinical sites: (i) Clinic for Neurosurgery at Johannes Gutenberg University Medical Centre, Mainz (Germany), (ii) Institute of Pathology, Faculty of Medicine, University of Ljubljana (Slovenia), and (iii) Vitamed Clinical Center, Moscow (Russia) (Table 1).
The study design and the use of biological tissue samples in the investigation were approved by local ethical committees: the UMM Institutional Review Board and ethics committee approval No. 837.178.17(11012) granted to the UMM Clinic for Neurosurgery by the Rhineland Palatinate Chamber of Physicians (Landesäzrtekammer Rheinland-Pfalz), National Medical Ethics Committee of the Republic of Slovenia approval numbers 0120-196/2017/7, 0120-190/2018/4, and 0120-190/2018/11 and by the ethical committee of Vitamed Clinic, Moscow, protocol date 16.10.17, respectively. All patients or their legal representatives signed written informed consents to participate in this study and to publish the results of RNA sequencing analysis and MGMT gene promoter methylation analysis without disclosure of personal genetic data. The materials were confirmed by a certified pathologist for diagnosis and content of cancer cells, where no less than 50% of cancer cells in a biosample were acceptable.
In total, 30, 16, and 4 experimental GBM tissue biosamples were obtained for analysis from the Clinic for Neurosurgery at Johannes Gutenberg University Medical Centre, University of Ljubljana, and Vitamed Clinical Center, respectively. For these biosamples, MGMT gene promoter methylation was assessed using the MGMT Promoter Methylation assay (Mayo Clinic Laboratories, USA). Clinical annotation of the experimental biosamples is given in Supplemental Table S1.
RNA sequencing and gene expression analysis
Total RNA preps extracted from the tumor biomaterial were subjected to RNA sequencing as described previously.17,40 RNAseq FASTQ files were processed with STAR aligner in “GeneCounts” mode with the Ensembl human transcriptome annotation. 41 Ensembl gene IDs were converted to HUGO Gene Nomenclature Committee (HGNC) gene symbols using the Complete HGNC dataset (https://www.genenames.org/, database version from July 13, 2017). In total, expression levels were established for 35,126 annotated genes with the corresponding HGNC identifiers. For further assessments, only the samples with high-quality experimental RNA sequencing profiles reaching the threshold of 3.5 × 10⁶ gene-mapped reads were selected 40 (Table 1). By comparing the tumor and normal expression profiles, the case-to-normal ratios for the expression of individual genes were calculated, as well as the extent of differential activation of 38 intracellular molecular pathways 42 using the OncoboxPD tool. 43 For these comparisons, the RNA sequencing profiles of healthy brain tissues previously obtained by us for human donors killed in road accidents using the same protocols, equipment, and reagents were used as the norms. 44 Gene expression data were quantile normalized, and batch effects removal procedure was performed using the “sva” package in R. Oncobox TMZ drug score calculation was performed as described previously.33,45–47
PAL is an integral quantitative and qualitative characteristic of changes in the expression levels of genes participating in a molecular pathway.32,33,42,48
PAL values were calculated as follows:
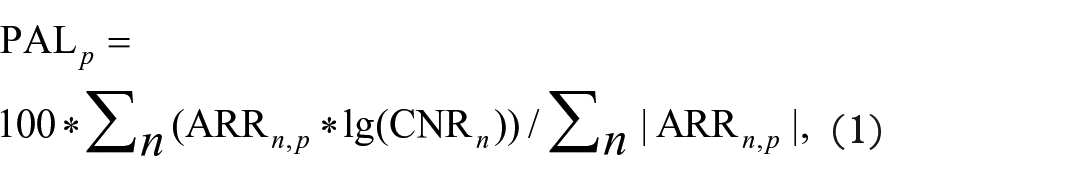
where PAL p is PAL for a pathway p, CNR n is the case-to-normal ratio for a gene n; ARR (activator/repressor role in the pathway p) is a Boolean value that depends on the function of this gene product in the pathway p. 32 ARR n,p is a Boolean value defined as follows: −1 when the product of the gene n inhibits the pathway p; 1 when the product of n activates p; 0 when the product of n has an ambiguous role in p. The CNR n value is calculated as the ratio of a quantitative metric level for the gene n in a biosample under study to an average level for n in the control group.
Statistical analysis and visualization
Survival analysis and hazard ratio (HR) calculation were used to study the influence of all biomarkers under study (gene expression levels, MGMT promoter methylation status, DNA repair PAL, Oncobox TMZ drug score) on OS and PFS of GBM patients under TMZ therapy. The statistical significance was assessed by log-rank test p-value, statistical threshold for p-value was 0.05. Efficacy of survival biomarkers was visualized using the Kaplan–Meier plots built with R packages “survival,” “survminer,” “pheatmap,” and “ggplot2.” Area under the curve (AUC) values were calculated using “pROC” package.
For permutation test of intersecting gene sets, 10,000 random intersections were performed in every case as described in Sorokin et al., 45 p-value of intersection significance was calculated as a fraction of random sets with equal or higher number of intersected genes compared to the experimental observations. Permutation results visualization and Venn diagram plotting were performed using R packages “ggVennDiagram” and “RVenn.”
A human interactome model was built using a collection of pathways as the knowledgebase of molecular interactions. This is the directed graph, where nodes are genes, and edges are known pairwise molecular interactions present in the OncoboxPD. 43 The model was visualized using Gephi software and ForceAtlas2 algorithm. 49
Visualization of molecular pathway activation patterns was done using OncoboxPD tool.43,50
Reporting guideline
The reporting of this study conforms to the Strengthening the Reporting of Observational Studies in Epidemiology statement (Supplemental Table S2). 51
Results
Biosample classification
In order to follow the most recent CNS tumor classification guidelines (WHO CNS5), the samples from the literature datasets were reclassified according to Zakharova et al., 23 and a total of 434, 71, and 154 biosamples were classified as GBM and taken into the analysis from TCGA, CGGA batch 1 (CGGA_325), and CGGA batch 2 (CGGA_693) datasets (Table 1). Furthermore, the group of 50 experimental clinically annotated GBM biosamples and the respective RNA sequencing profiles was obtained from the University of Mainz (Germany), the University of Ljubljana (Slovenia), and the Vitamed Clinic (Russia) for patients undergoing Oncobox molecular testing (Table 1). The experimental biosamples were annotated with the PFS data, the TCGA profiles—with both PFS and OS data, and the CGGA profiles—with OS data only (Table 1).
The use of TMZ in the treatment of GBM became clinical standard in 2005. 52 All the experimental cohort GBM patients were treated after this date and received TMZ. The CGGA patients were also treated after 2005. However, in most of the TCGA and CGGA samplings the treatment with TMZ was not specifically annotated; however, the TCGA patients were annotated as those receiving GBM standard-of-care treatment. Thus, the patients treated after 2005 can be considered as those who received TMZ, and the patients who were treated before—as those most likely not receiving TMZ as it was not included in the standards of care. Thus, we divided the TCGA sampling into two groups of the patients treated before 2005, and those treated after 2005 while excluding those sampled and treated in 2005 itself.
For the final cohorts of GBM patients (Experimental, TCGA before 2005, TCGA after 2005, CGGA batch 1, and CGGA batch 2 totally encompassing 709 profiles we performed the survival biomarker analysis.
MGMT promoter methylation as GBM survival biomarker
MGMT promoter methylation is widely used in clinical routine as the predictive biomarker of GBM survival and responsiveness to TMZ treatment, where methylated status means a better prognosis for a patient. In this study, we intended to use it as the gold standard in the field to compare the effectiveness of other putative biomarkers.
In the experimental cohort, MGMT promoter methylation was found to be an informative biomarker (p = 0.0084) of PFS with HR of 0.34 (Figure 1(a)). In TCGA-GBM samples obtained after 2005, it was statistically significantly associated with the OS (HR 0.73, p = 0.041), but not with the PFS (HR 0.79, p = 0.091) (Figure 1(b) and (c)). In TCGA-GBM samples obtained before 2005, prior to the date when TMZ became the standard of care, no statistically significant associations could be found for MGMT promoter methylation with both OS and PFS (Figure 1(d) and (e)). Similar figure was observed also for both batches of another database—CGGA, where no significant associations with OS could be detected (Figure 1(f) and (g)).

Survival analysis of the MGMT promoter methylation level as GBM patient survival biomarker. The Kaplan–Meier plots are given for (a) Experimental-PFS dataset, (b) TCGA-OS dataset for the profiles obtained after 2005, (c) TCGA-PFS dataset for the profiles obtained after 2005, (d) TCGA-OS dataset for the profiles obtained before 2005, (e) TCGA-PFS dataset for the profiles obtained before 2005, (f) CGGA_693 OS dataset, and (g) CGGA_325 OS dataset.
This means that TCGA biosamples obtained before 2005, as well as biosamples from both batches of CGGA database, are unlikely to represent TMZ-treated GBM cases and, therefore, had to be removed from further analyses. Thus, TCGA cohort obtained after 2005 will be referred to as “TCGA cohort” in further text.
On the other hand, MGMT methylation showed a significant association with the experimental cohort PFS and TCGA OS, but not with the TCGA-PFS where a similar survival trend was observed but no statistical significance could be reached (Figure 1).
MGMT expression and Oncobox TMZ drug score
Interestingly, the expression level of MGMT showed significantly better prognostic value compared to the methylation of this gene promoter (Figure 2(a)–(c)), with the HR 2.48 (p = 0.00435) for the experimental PFS, HR 1.69 (p = 0.006) for the TCGA-PFS, and HR 1.96 (p = 0.0038) for the TCGA-OS datasets. We also assessed MGMT expression as the biomarker for differentiation of the top-20% best and top-20% worst TMZ responders according to the experimental PFS and TCGA-OS data. To this end, we calculated the area under the receiver-operating characteristic curve (ROC AUC) metric that is frequently used for assessing biomarker quality in cancer research.53,54 The AUC value correlates with the robustness of a biomarker and varies depending on its sensitivity and specificity in a range between 0.5 and 1, 55 where AUC values greater than 0.7 indicate high-quality biomarkers, and vice versa. 56 In this study, for the calculations of ROC AUC in every dataset under analysis we took the samples corresponding to 20% of the patients in the cohort with the longest OS or PFS as the “responders,” and 20% with the shortest OS or PFS as the “non-responders.” For the experimental PFS and TCGA-OS datasets, we detected AUC values of 0.6 and 0.61, respectively (Figure 2(d) and (e)), which was comparable with what was found for the MGMT promoter methylation (AUC values of 0.73 and 0.57, respectively).

Survival analysis of the MGMT gene expression level as GBM patient survival biomarker. The Kaplan–Meier plots are given for (a) Experimental-PFS, (b) TCGA-PFS, and (c) TCGA-OS datasets. The ROC curves are given for (d) Experimental-PFS and (e) TCGA-OS datasets.
Oncobox drug score for TMZ is an alternative metric that is calculated as the negative logarithm of the MGMT gene expression level ratio in the GBM sample under analysis to the geometric mean for the group of healthy brain tissue norms 17 and was shown to be strongly associated with the survival of GBM patients in our previous research. 17 Here we found that it showed exactly the same characteristics as the MGMT expression level (Figure 2).
Thus, our findings suggest that the expression level of MGMT and the related TMZ drug score (Oncobox TMZ drug score) are significantly stronger GBM survival biomarkers compared to the “gold standard” MGMT promoter methylation level in terms of HR calculations, but comparable in terms of AUC values (Figure 1). This figure is in line with the current understanding of the TMZ mechanism of action which depends on the activity of the MGMT protein. The MGMT transcriptional level measured in tumor biosamples by RNA sequencing relates to the concentration of MGMT protein more directly than the methylation level of the corresponding gene promoter sequence. This is also reflected by the high (Pearson 0.66 and Spearman 0.80) correlation between the levels of RNA and protein MGMT gene products in GBM according to the data from the NCI Clinical Proteomic Tumor Analysis Consortium project database. 57
Other DNA repair gene expression biomarkers
In a similar way, we assessed the GBM TMZ-related survival biomarker potential of all 361 genes involved in 38 DNA repair pathways (Supplemental Table S3). For the potentially high-quality biomarkers, we set a threshold of HR greater than 1.63 (as in the case of the least significant HR value for MGMT gene expression) or less than 0.61 (which reflects 1/1.63), and p < 0.05. These values were calculated for the Experimental-PFS, TCGA-PFS, and TCGA-OS assays. Intersection of the results for all three assays gave a non-random figure of six negative GBM survival gene expression biomarkers (Figure 3(a)) and six positive survival biomarkers (Figure 3(b)), statistical characteristics for the triple intersected items shown on Table 2.

Intersection of DNA repair genes associated with survival of GBM patients in TCGA-OS, TCGA-PFS, and Experimental-PFS data. Intersection analysis results of genes with (a) HR > 1.63 and (b) HR < 0.61.
Survival and AUC analysis of prognostic biomarkers for GBM response on TMZ.

AP, apurinic/apyrimidinic; AUC, area under the curve; BER, base excision repair; DNA-PK, DNA-dependent protein kinase; GBM, glioblastoma; HR, hazard ratio; OS, overall survival; PFS, progression-free survival; RPA, Replication Protein A; ssDNA, single-stranded DNA; TCGA, The Cancer Genome Atlas; TMZ, temozolomide.
Thus, in such a way we were able to identify 12 new high-quality potential GBM survival gene expression biomarkers significantly outperforming the capacity of MGMT gene promoter methylation. Among them, six genes were previously reported as related to TMZ treatment outcomes. Besides the well-studied MGMT gene, targeting CREB1 by microRNA MiR-433-3p 58 and of gene EP300 by shRNA in a GBM patient-derived tumor tissue xenograft could enhance responsiveness to TMZ. 59 This finding is not directly in line with the results of the present study where EP300 expression was a positive survival biomarker following TMZ treatment (Table 2). Similarly, in the previous tests, GBM patient-derived primary cells showed increased sensitivity to TMZ in response to miR-146a which blocks transcriptional factors POU3F2 and SMARCA5, 60 the latter of which is a strong positive GBM patient survival biomarker in this study.
In MGMT-deficient GBM cell line U87, 1-week treatment by TMZ led to accumulation of DNA lesions and enhanced expression of RPA1 gene product, 61 another positive survival biomarker in our study (Table 2). Expression of PRKDC gene, a positive survival biomarker in this study, was previously associated with mesenchymal molecular subtype of GBM with better survival characteristics. 62
In addition, six (50%) captured biomarker genes were never associated with TMZ in the previous literature: APEX2, POLD4, POLE4, POLR2K, PSMC2, and SMC1A.
Interestingly, APEX2 expression was previously connected with GBM clinical outcome following treatment by irradiation plus capecitabine 63 ; POLD4 connection with poor clinical outcome in GBM (not in relation to TMZ) was recently reported 64 ; concordant reports for gene SMC1A: MiR-9 promotes apoptosis in GBM cell lines by targeting SMC1A expression 65 and siRNA mediated knockdown of this gene suppresses the proliferation of GBM cells. 66 Finally, genes POLR2K and PSMC2 were not previously associated with GBM in the literature, as of March 2024.
Thus, out of a total of 12 robust putative TMZ-related survival gene expression biomarkers identified is this study 6 were previously mentioned for their connection with TMZ, and 6 (50%) were new. Six were positive, and six were negative TMZ-related GBM survival biomarkers (Table 2). For 10 of these genes (~83%) an association with GBM was reported in the previous literature.
Mean ROC AUC values calculated for these biomarkers taken one by one using Experimental-PFS, TCGA-PFS, and TCGA-OS settings did not exceed the standard high-quality biomarker threshold of 0.7 except for the POLE gene where it reached the value of 0.754 (Table 2).
Molecular pathway activation biomarkers
We then assessed the biomarker potential of the PALs of 38 DNA repair molecular pathways (Supplemental Table S4). Intersection of the results obtained for the Experimental-PFS, TCGA-PFS, and TCGA-OS datasets with the same settings of HR threshold less than 0.61 or greater than 1.63, and p < 0.05 as for the above single gene expression assay resulted in one common pathway “Biocarta Cell Cycle G2/M Checkpoint Main Pathway” (Figure 4(a)). Activation of this pathway was connected with better response to TMZ in GBM patients under investigation (Figure 4). For this pathway, detected HR values were 0.48 (p = 0.0285), 0.55 (p = 0.0068), and 0.43 (p = 0.00024) in the Experimental-PFS, TCGA-PFS, and TCGA-OS settings, respectively (Figure 4(b)).
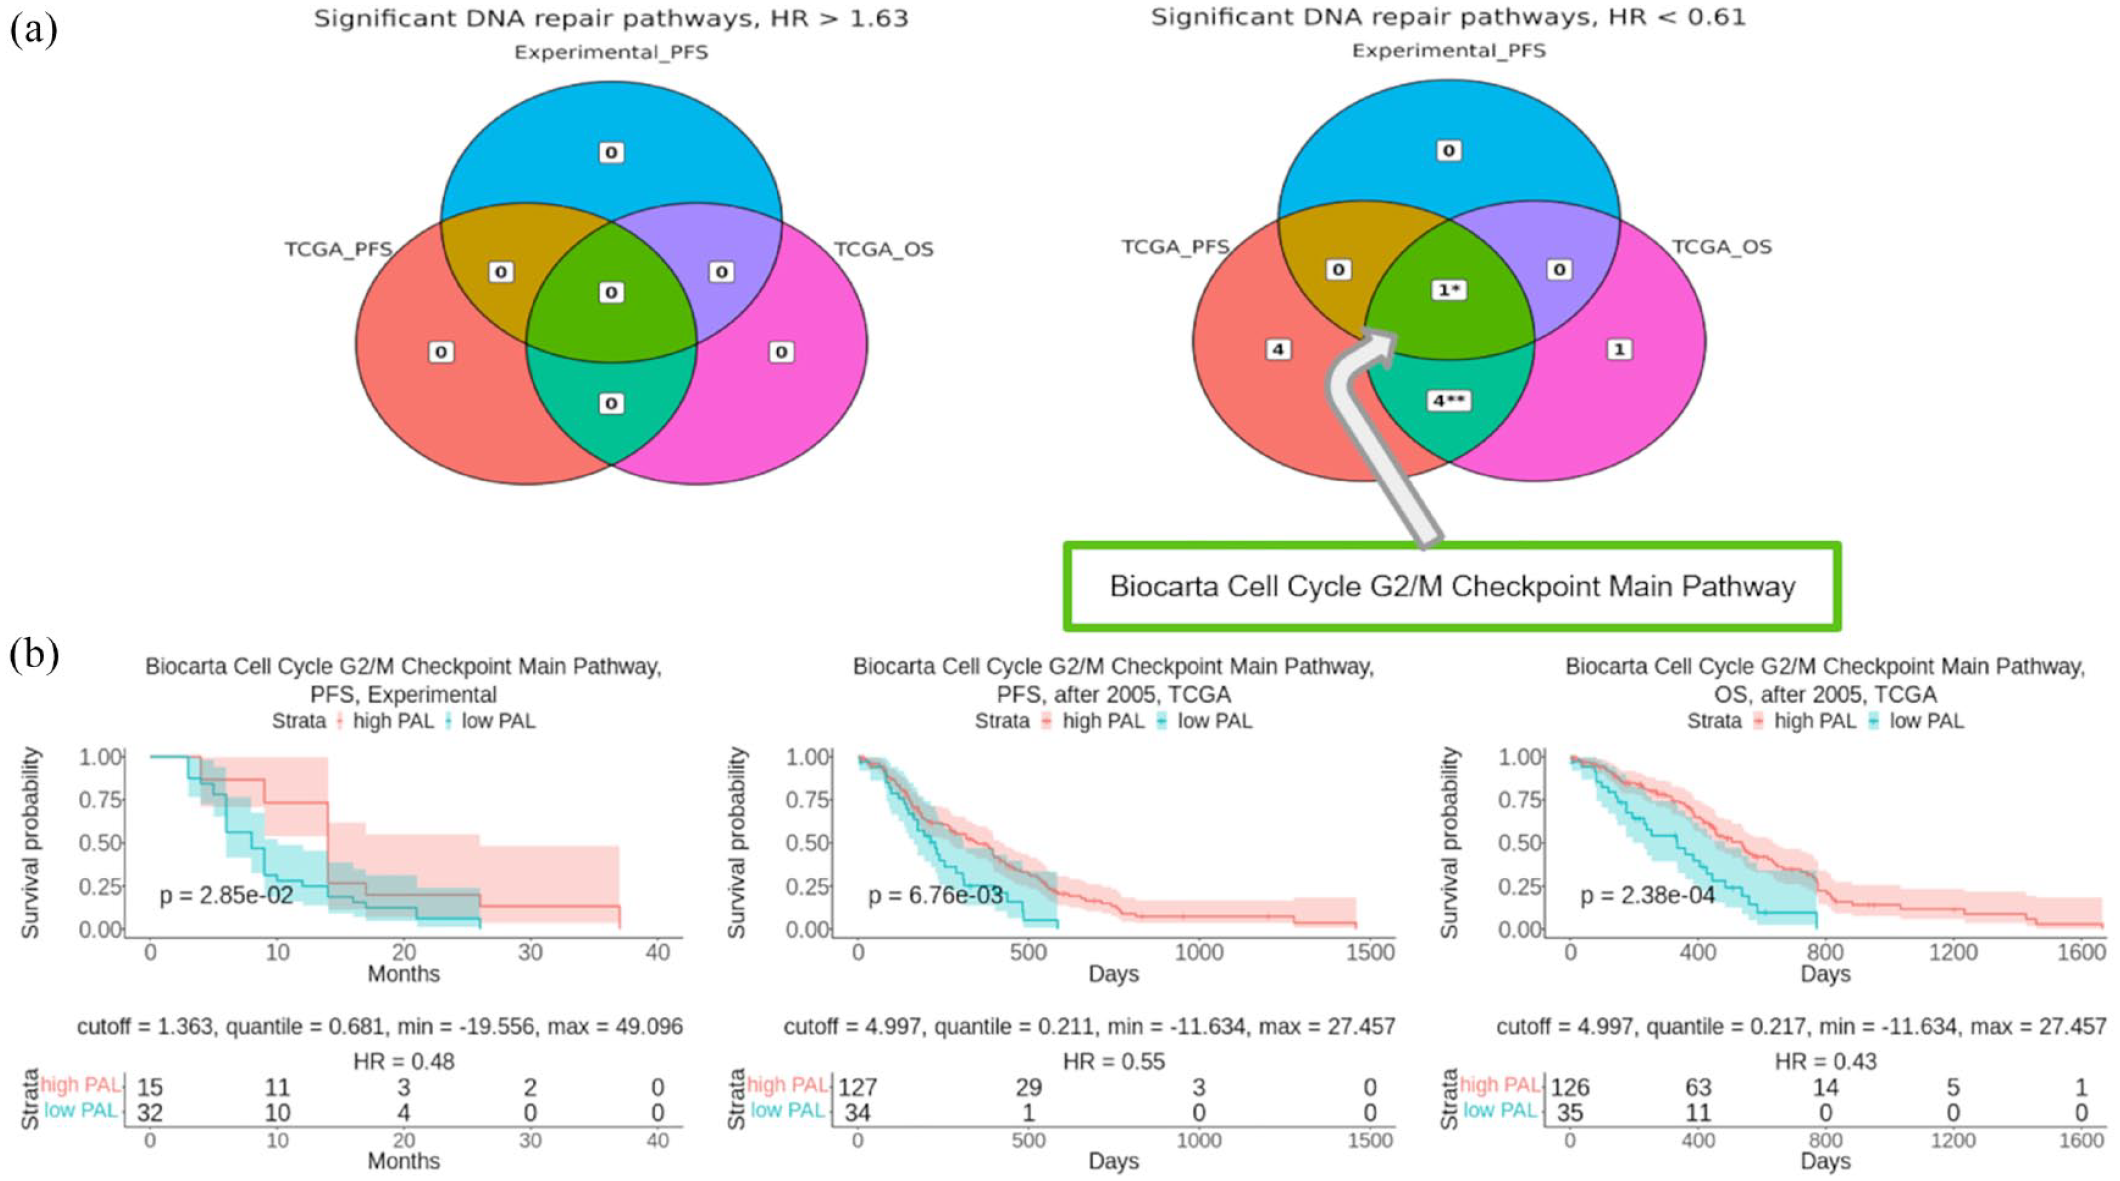
Intersection of DNA repair pathways associated with survival of GBM patients in TCGA-OS, TCGA-PFS, and Experimental-PFS datasets. (a) Intersection analysis results of DNA repair pathways with HR > 1.63 (left) and HR < 0.61 (right). (b) Survival analysis of “Biocarta Cell Cycle G2/M Checkpoint Main Pathway” PAL as GBM patient survival biomarker. The Kaplan–Meier plots are given for Experimental-PFS (left panel), TCGA-PFS (center), and TCGA-OS (right panel) data.
However, ROC AUC values calculated for discriminating top-20% best and worst responders for this PAL did not reach the quality threshold of 0.7 and were 0.62, 0.58, and 0.53 for the Experimental-PFS, TCGA-PFS, and TCGA-OS settings.
Interestingly, the ATM-dependent G2/M checkpoint was recently proposed as the target for therapeutic intervention when sensitizing GBM for TMZ chemotherapy. 67 Both in vitro and on mice model, Lang et al. found that drug inhibiting MYT1 kinase and forcing transition of TMZ-treated cells through the G2/M checkpoint results in severe mitotic abnormalities and subsequent mitotic exit with inevitable apoptosis. In addition, depletion of the MYT1 gene in cancer cells led to increased TMZ-induced cytotoxicity 67 which agrees with our findings where this gene expression was negatively associated with GBM survival with borderline significance (Supplemental Table S3).
Reconstruction of molecular pathway of TMZ sensitivity in GBM
For the reconstruction of the TMZ sensitivity molecular pathway, a model of the human interactome was built using a set of pairwise molecular interactions extracted from the annotations of 51,672 human molecular pathways.34,43 Based on the obtained human interactome model, we built a connected molecular pathway encompassing the identified 12 TMZ treatment-related survival biomarker genes (Table 2) and genes found during interactome graph reconstruction. Additional genes were added to the TMZ sensitivity pathway to provide connectivity of the previously deduced survival biomarker genes by adding minimal number of new elements. In the case of several alternative possible intermediate genes, those showing the most statistically significant associations with survival were selected. Thus, the resulting pathway termed “Temozolomide sensitivity in glioblastoma” (GBM TMZ pathway) contained 12 TMZ sensitivity genes and the intermediate nodes corresponding to TP53, TREX1, BRCA1, XRCC1, and NTHL1 gene products (Figure 5).

The TMZ sensitivity pathway genes shown in the context of an overall human interactome model. Red dots indicate genes of the TMZ sensitivity pathway. Red arrows show interactions between TMZ sensitivity pathway genes. Other human interactome nodes and connections are shadowed.
To calculate the activation level for the GBM TMZ pathway, we used the following formula:

where PALTMZ is the activation level for the “Temozolomide sensitivity in glioblastoma” pathway, CNR
n
(case-to-normal ratio) is the ratio of gene n expression level in the sample under investigation to the mean geometrical gene n expression level in the group of control samples; ARRn,TMZ (activator/repressor role of gene n in the “Temozolomide sensitivity in glioblastoma” pathway) is the discrete value that equals to −1 when gene product
We assigned activator/repressor molecular roles for the gene products included in the reconstructed TMZ sensitivity pathway using the recursive algorithm based on the pathway molecular architecture that we developed and published in a previous study. 34 Of note, the genes associated with favorable survival and genes promoting cell cycle arrest (CREB1, EP300, PRKDC, RPA1, SMARCA5, SMC1A, TP53, TREX1, and BRCA1) algorithmically obtained ARR = 1 values, that is, were considered as the pathway activators. In contrast, genes associated with unfavorable survival and involved in DNA repair and cell cycle progression (APEX2, MGMT, POLD4, POLE4, POLR2K, PSMC2, XRCC1, and NTHL1) obtained ARR characteristics for the pathway inhibitors (ARR = −1). The TMZ sensitivity pathway PAL values were then calculated for TCGA and experimental datasets (Figure 6(a) and (b)). In the TCGA cohort (161 profiles), the PAL of the GBM TMZ pathway was 7.09, while for the experimental cohort (49 profiles) it was 1.31.

Activation profile of the TMZ sensitivity pathway for (a) TCGA and (b) experimental datasets. Color reflects the logarithm of the CNR of the pathway nodes, color scale is given (green—upregulated, red—downregulated, white—intact). The “Temozolomide” and “Cell cycle arrest” nodes are indicated by blue color and hexagonal shape. Arrows show molecular interactions within a pathway: green stands for activation, red for inhibition.
We found that the GBM TMZ pathway was strongly associated (p < 0.0009) with a better chance for longer survival and had HR of 0.18, 0.44, and 0.39 for the Experimental-PFS, TCGA-PFS, and TCGA-OS settings (Figure 7(a)). The GBM TMZ pathway also had high AUC scores of 0.9, 0.68, and 0.73 for the Experimental-PFS, TCGA-PFS, and TCGA-OS settings, respectively (mean 0.77), thus suggesting its very strong biomarker potential for discriminating top best and worst TMZ treatment responders (Figure 7(b)).

Survival analysis of TMZ pathway PAL as GBM patient survival biomarker. (a) The Kaplan–Meier plots are given for Experimental-PFS (left panel), TCGA-PFS (center), and TCGA-OS (right panel) data. (b) The ROC curves are given for Experimental-PFS (left panel), TCGA-PFS (center), and TCGA-OS (right panel) data.
Thus, we conclude that our combinatorial approach to the discovery and validation of TMZ response biomarkers in GBM based on the analysis of human DNA repair pathways could identify diagnostic gene signatures strongly associated with survival and response to TMZ. This GBM TMZ pathway had superior performance compared to any of the enclosing new individual biomarkers, and also in comparison with the routinely used MGMT gene methylation level biomarker.
Discussion
Gliomas, particularly GBM, are the most common and aggressive CNS tumors that are difficult to treat. Gliomas can be categorized depending on the molecular profile of an individual patient which may help improving patient outcomes. It is currently accepted that MGMT methylation along with mutations of genes IDH1/2, and H3, with +7/−10 chromosomal aberrations, EGFR amplification or mutation, and TERT promoter mutation are widespread biomarkers in clinical oncology. They possess prognostic and diagnostic value by allowing determining the molecular subtype of glioma and personalizing therapy. Here we identified a set of novel 12 GBM TMZ response biomarkers based on expression of genes included in DNA repair pathways which outperformed routinely used MGMT methylation biomarkers in terms of association with survival.
Furthermore, the molecular pathway reconstructed with these 12 expression biomarkers and 5 additional genes deduced from the interactome model showed superior performance in terms of association with survival, both OS and PFS, and HR p-value < 0.0009, as well as discrimination between the patients with best and worst treatment response records (mean AUC 0.77).
Interestingly, the above 12 genes which were selected based on statistics of clinical response to TMZ in the literature and experimental GBM cohorts appeared to be tightly associated in terms of their molecular function (Figure 8). We found that among them, positive survival biomarkers were enriched in the pathways connected with ATM-dependent G2M checkpoint (for genes CREB1, SMC1A), and cell cycle arrest (genes EP300, PRKDC) (Table 3). Here the cyclic AMP-response element-binding protein 1 (CREB1) is a transcriptional factor protein that directly regulates the expression of multiple genes participating in DNA repair, including those governing cell cycle checkpoints. 68 Alternatively, CREB1 controls roughly a quarter of the human transcriptome by binding the specific consensus sequence TGACGTCA termed CRE. It was shown to compete in vivo with DNA glycosylase enzymes for binding with damaged CRE sites, thus blocking DNA repair. 69

Schematic representation of TMZ sensitivity pathway genes impact in DNA repair and integrity. Red color denotes negative, green—positive survival biomarker genes.
DNA repair pathways enriched with positive and negative survival biomarker genes participating in TMZ sensitivity pathway sorted by the number of participants.

HR, hazard ratio; TMZ, temozolomide.
Interestingly, another positive survival biomarker identified here, EP300 lysine-acetyltransferase protein, functions in a complex with another lysine-acetyltransferase CREB binding protein CBP and contributes to chromatin remodeling, DNA damage response, DNA strand breaks repair, 70 cell cycle arrest, and apoptosis. 71 SMC1A protein is part of a multi-subunit cohesin complex that controls faithful chromosome segregation by pairing sister chromatids after DNA replication in both mitosis and meiosis. 72 It is also a component of the Recombination protein complex involved in DNA repair by recombination. 73 In turn, Replication Protein A 1 (RPA1) protein is a component of RPA, a heterotrimeric single-stranded DNA-binding protein involved in all processes that involve single-stranded DNA with crucial roles in DNA replication, repair, and recombination. 74 PRKDC is DNA breaks dependent protein kinase that is necessary to sense DNA lesions and to initiate DNA damage repair. 75 Finally, SMARCA5 is a component of the ATPase subunit SMARCA5/SNF2H of the chromatin remodeler complex ACF that accumulates at DNA lesions in an ADP-ribosylation-dependent manner. 76
In turn, the negative survival biomarkers were mostly enriched in the pathways dealing with the excision DNA repair (genes APEX2, MGMT, POLD4, POLE4, PSMC2, POLR2K) (Table 3). This list reflects two canonical mechanisms of repairing DNA lesions induced by alkylating agents such as TMZ: a single-step reaction of alkyl-group removal by MGMT enzyme, and base excision repair dependent on poly(ADP) ribose polymerase 1 (PARP1). 77 Apurinic/apyrimidinic endonuclease 2 (APEX2) has a major role in rescuing homology recombination deficient cancer cells through microhomology-mediated end joining repair mechanism and other PARP1-dependent repair mechanisms. 78 POLD4 and POLE4 are catalytic DNA polymerase subunits that are directly involved in DNA damage repair. 79 POLR2K is one of the subunits of RNA polymerase complex, 80 and PSMC2 protein is 1 of the 19 essential subunits of 19S proteasome complex 81 and it can regulate DNA repair, cell cycle attenuation, or apoptosis through proteolytic degradation of ubiquitinated target proteins. 82
Thus, we conclude that the GBM TMZ pathway discovered here is tightly connected with the molecular function of either amplifying (positive survival biomarkers) or decreasing (negative biomarkers) apoptotic response to DNA lesions introduced by TMZ. Our results demonstrate that the new TMZ response pathway proposed here is a strong predictive GBM molecular biomarker that could be introduced to clinical practice following additional independent clinical validation. We also hypothesize that the gene products identified here as the TMZ response biomarkers could serve as the molecular targets of future therapeutic agents, for example, activators of positive survival biomarkers and blockers of negative biomarkers.
Conclusion
In this study, a comprehensive analysis of the expression of 361 DNA repair genes and activation levels of 38 DNA repair pathways revealed 13 potential survival biomarkers with increased prognostic potential compared to MGMT methylation on updated TCGA and other samplings and validated the results of our experimental multicenter GBM patient cohort (n = 50). We found that expression/activation levels of seven and six emerging gene/pathway biomarkers served as high-quality positive (HR < 0.61) and negative (HR > 1.63), respectively, patient survival biomarkers, all performed significantly better than MGMT methylation. Positive survival biomarkers were enriched in the processes of ATM-dependent checkpoint activation and cell cycle arrest whereas negative—in excision DNA repair. We also built a human interactome model and reconstructed a TMZ response molecular pathway which was informative for the prediction of GBM patient survival following TMZ administration (HR 0.18–0.44, p < 0.0009; AUC 0.68–0.9).
Supplemental Material
sj-docx-1-tam-10.1177_17588359241292269 – Supplemental material for Bioinformatic and clinical experimental assay uncovers resistance and susceptibility mechanisms of human glioblastomas to temozolomide and identifies new combined and individual survival biomarkers outperforming MGMT promoter methylation
Supplemental material, sj-docx-1-tam-10.1177_17588359241292269 for Bioinformatic and clinical experimental assay uncovers resistance and susceptibility mechanisms of human glioblastomas to temozolomide and identifies new combined and individual survival biomarkers outperforming MGMT promoter methylation by Alexander Modestov, Marianna Zolotovskaia, Maria Suntsova, Galina Zakharova, Aleksander Seryakov, Ivana Jovcevska, Jernej Mlakar, Elena Poddubskaya, Aleksey Moisseev, Grigory Vykhodtsev, Sergey Roumiantsev, Maksim Sorokin, Victor Tkachev, Aleksander Simonov and Anton Buzdin in Therapeutic Advances in Medical Oncology
Supplemental Material
sj-docx-2-tam-10.1177_17588359241292269 – Supplemental material for Bioinformatic and clinical experimental assay uncovers resistance and susceptibility mechanisms of human glioblastomas to temozolomide and identifies new combined and individual survival biomarkers outperforming MGMT promoter methylation
Supplemental material, sj-docx-2-tam-10.1177_17588359241292269 for Bioinformatic and clinical experimental assay uncovers resistance and susceptibility mechanisms of human glioblastomas to temozolomide and identifies new combined and individual survival biomarkers outperforming MGMT promoter methylation by Alexander Modestov, Marianna Zolotovskaia, Maria Suntsova, Galina Zakharova, Aleksander Seryakov, Ivana Jovcevska, Jernej Mlakar, Elena Poddubskaya, Aleksey Moisseev, Grigory Vykhodtsev, Sergey Roumiantsev, Maksim Sorokin, Victor Tkachev, Aleksander Simonov and Anton Buzdin in Therapeutic Advances in Medical Oncology
Supplemental Material
sj-docx-3-tam-10.1177_17588359241292269 – Supplemental material for Bioinformatic and clinical experimental assay uncovers resistance and susceptibility mechanisms of human glioblastomas to temozolomide and identifies new combined and individual survival biomarkers outperforming MGMT promoter methylation
Supplemental material, sj-docx-3-tam-10.1177_17588359241292269 for Bioinformatic and clinical experimental assay uncovers resistance and susceptibility mechanisms of human glioblastomas to temozolomide and identifies new combined and individual survival biomarkers outperforming MGMT promoter methylation by Alexander Modestov, Marianna Zolotovskaia, Maria Suntsova, Galina Zakharova, Aleksander Seryakov, Ivana Jovcevska, Jernej Mlakar, Elena Poddubskaya, Aleksey Moisseev, Grigory Vykhodtsev, Sergey Roumiantsev, Maksim Sorokin, Victor Tkachev, Aleksander Simonov and Anton Buzdin in Therapeutic Advances in Medical Oncology
Supplemental Material
sj-docx-4-tam-10.1177_17588359241292269 – Supplemental material for Bioinformatic and clinical experimental assay uncovers resistance and susceptibility mechanisms of human glioblastomas to temozolomide and identifies new combined and individual survival biomarkers outperforming MGMT promoter methylation
Supplemental material, sj-docx-4-tam-10.1177_17588359241292269 for Bioinformatic and clinical experimental assay uncovers resistance and susceptibility mechanisms of human glioblastomas to temozolomide and identifies new combined and individual survival biomarkers outperforming MGMT promoter methylation by Alexander Modestov, Marianna Zolotovskaia, Maria Suntsova, Galina Zakharova, Aleksander Seryakov, Ivana Jovcevska, Jernej Mlakar, Elena Poddubskaya, Aleksey Moisseev, Grigory Vykhodtsev, Sergey Roumiantsev, Maksim Sorokin, Victor Tkachev, Aleksander Simonov and Anton Buzdin in Therapeutic Advances in Medical Oncology
Supplemental Material
sj-docx-5-tam-10.1177_17588359241292269 – Supplemental material for Bioinformatic and clinical experimental assay uncovers resistance and susceptibility mechanisms of human glioblastomas to temozolomide and identifies new combined and individual survival biomarkers outperforming MGMT promoter methylation
Supplemental material, sj-docx-5-tam-10.1177_17588359241292269 for Bioinformatic and clinical experimental assay uncovers resistance and susceptibility mechanisms of human glioblastomas to temozolomide and identifies new combined and individual survival biomarkers outperforming MGMT promoter methylation by Alexander Modestov, Marianna Zolotovskaia, Maria Suntsova, Galina Zakharova, Aleksander Seryakov, Ivana Jovcevska, Jernej Mlakar, Elena Poddubskaya, Aleksey Moisseev, Grigory Vykhodtsev, Sergey Roumiantsev, Maksim Sorokin, Victor Tkachev, Aleksander Simonov and Anton Buzdin in Therapeutic Advances in Medical Oncology
Footnotes
Acknowledgements
We thank Dr Ella Kim, Dr Sven Kantelhardt, and Dr Alf Giese (Mainz University, Neurosurgery Clinic) for help with planning the study and useful discussion.
Declarations
Supplemental material
Supplemental material for this article is available online.
References
Supplementary Material
Please find the following supplemental material available below.
For Open Access articles published under a Creative Commons License, all supplemental material carries the same license as the article it is associated with.
For non-Open Access articles published, all supplemental material carries a non-exclusive license, and permission requests for re-use of supplemental material or any part of supplemental material shall be sent directly to the copyright owner as specified in the copyright notice associated with the article.