
Abstract
Objective
There have been no recent improvements in the glioblastoma multiforme (GBM) outcome, with median survival remaining 15 months. Consequently, the need to identify novel biomarkers for GBM diagnosis and prognosis, and to develop targeted therapies is high. This study aimed to establish biomarkers for GBM pathogenesis and prognosis.
Methods
In total, 220 overlapping differentially expressed genes (DEGs) were obtained by integrating four microarray datasets from the Gene Expression Omnibus database (GSE4290, GSE12657, GSE15824, and GSE68848). Then a 140-node protein–protein interaction network with 343 interactions was constructed.
Results
The immune response and cell adhesion molecules were the most significantly enriched functions and pathways, respectively, among DEGs. The designated hub genes ITGB5 and RGS4, which have a high degree of connectivity, were closely correlated with patient prognosis, and GEPIA database mining further confirmed their differential expression in GBM versus normal tissue. We also determined the 20 most appropriate small molecules that could potentially reverse GBM gene expression, Prestwick-1080 was the most promising and had the highest negative scores.
Conclusions
This study identified ITGB5 and RGS4 as potential biomarkers for GBM diagnosis and prognosis. Insights into molecular mechanisms governing GBM occurrence and progression will help identify alternative biomarkers for clinical practice.
Keywords
Introduction
Glioblastoma multiforme (GBM) is the most common malignant central nervous system tumor and is highly fatal. Although multimodal treatments for GBM, including surgical resection, chemotherapy, radiation, and targeted therapy, have improved, the overall survival of patients remains far from ideal with a median time of approximately 15 months. Additionally, after recurrence, survival time drops to below 6 months.1–4
Recent studies have focused on targeting tumor growth factor receptors, epigenetic regulation, angiogenesis, and immune responses to improve overall survival and decrease the recurrence rate. 5 To date, individualized therapies against molecular targets and signaling pathways that drive GBM malignancy have been unsuccessful in randomized clinical trials. 6 Thus, identifying promising novel biomarkers and understanding their molecular mechanisms will enhance our understanding of GBM initiation and progression.
Approximately 20% of GBM patients have deletions of the epidermal growth factor receptor gene (EGFR) in exons 2 to 7 that induce a constitutively-active carcinogenic variant, which is also commonly related to EGFR amplification (EGFRvIII). Results from phase III randomized trials with newly diagnosed EGFRvIII-positive GBM patients showed that rindopepimut, an EGFRvIII peptide vaccine, did not significantly prolong overall survival compared with the controls. 7
Amplification of the platelet-derived growth factor receptor A gene (PDGFRA) is present in 15% of GBM patients. This receptor is highly active in all types of gliomas and could be the most promising target for treating GBM. However, multiple multi-kinase inhibitors that target PDGFR showed no clinical activity or response in GBM patients.8,9 Finding new biomarkers that correlate with GBM pathogenesis and prognosis is therefore a crucial necessity.
This study integrated gene expression profiles from four Gene Expression Omnibus (GEO) datasets (GSE4290, GSE12657, GSE15824, and GSE68848) to identify differentially expressed genes (DEGs) in GBM versus adjacent normal tissue. We also mined the Connectivity Map (CMap) database for specific candidate small molecules that could conceivably reverse the DEGs in GBM, which yielded two novel biomarkers that were significantly correlated with patient diagnoses and prognoses. These new biomarkers may also help reveal the molecular mechanisms involved in GBM initiation and progression. In summary, this study was designed to deliver new insights into GBM, which is a multi-gene hereditary disease, while also exploring promising novel biomarkers for diagnosis, prognosis, and targeted therapies. Figure 1 shows the study workflow.

Study workflow to identify key genes and pathways in GBM.
Materials and methods
Data resources
This study investigated DEGs in GBM versus normal samples by analyzing GSE4290, GSE12657, GSE15824 and GSE68848 GEO gene expression profiles downloaded from the GEO database (http://www.ncbi.nlm.nih.gov/geo/). GEO serves as a public repository for experimental high-throughput microarray data. These RNA profiles were generated with the GPL570 (Affymetrix Human Genome U113 Plus 2.0) and GPL8300 (Affymetrix Human Genome U95 Version 2) array platforms. We aggregated 345 GBM and 61 control samples for our study, with individual profile counts being: GSE4290, 77 tumor and 23 normal; GSE12657, seven tumor and five normal; GSE15824, 33 tumor and five normal; and GSE68848, 228 tumor and 28 normal.
Identification of DEGs
Original CEL files downloaded were classified into GBM and normal groups. The Bioconductor package ‘affy’ (http://www.bioconductor.org/) facilitated data standardization and converted raw data into expression values. DEGs between GBM samples and normal tissues were identified via a significance analysis of the empirical Bayes methods, which was applied within the Limma package. 10 The cut-off criteria set to designate significant DEGs were P value <0.05 and |logFC| >1.
Functional enrichment analysis
Gene ontology (GO) enrichment analysis using the Database for Annotation Visualization and Integrated Discovery (DAVID) was conducted to study potential biological processes, molecular functions, and cellular components related to the overlapping DEGs. DAVID is a universal online biological information database with comprehensive annotations on gene and protein functions (version 6.7; http://david.ncifcrf.gov).11–14 The Kyoto Encyclopedia of Genes and Genomes (KEGG) enrichment analysis further elucidated the potential signaling pathways associated with the overlapping DEGs. KEGG is a compilation of several databases with large amounts of information on genomes, diseases, biological pathways, chemical substances, and drugs that is extensively used to ascertain functional and metabolic pathways. 15 A P value <0.05 was deemed statistically significant.
Protein–protein interaction (PPI) network construction and module analysis
The Search Tool for the Retrieval of Interacting Genes (STRING; https://string-db.org/) database is designed to evaluate PPI information. 16 The previously identified DEGs were all submitted to this database to explore potential interactions; those with a combined score >0.4 were considered significant and extracted for PPI network construction in Cytoscape. 17 Molecular Complex Detection (MCODE) was subsequently used to screen significant modules from the PPI network, with the degree cutoff set as 2, node score cutoff as 0.2, k-core as 2, and maximum depth as 100. 18 Functional and pathway enrichment analyses of these modules were also conducted. The Biological Process analysis of the hub genes was visualized via the Cytoscape plugin Biological Networks Gene Oncology tool (BiNGO). 19
Analysis and validation of hub genes
The UCSC Cancer Genomics Browser (http://genome-cancer.ucsc.edu) was used to construct a hierarchical clustering of module genes, and the cBioPortal online platform (http://www.cbioportal.org) established a network of co-expressed genes. The reliability of hub gene expression levels in GBM relative to normal samples was further confirmed via Gene Expression Profiling Interactive Analysis (GEPIA), which is an interactive web application that comprises 8587 normal and 9736 tumor samples from the Genotype–Tissue Expression and The Cancer Genome Atlas databases.20–22 The prognostic significance of hub genes was additionally explored on the GEPIA platform. A hazard ratio for overall survival (OS) was calculated with a 95% confidence interval (CI), and Kaplan–Meier curves and boxplots used to show correlations with DEGs and patient prognosis. The protein expression of hub genes in GBM relative to normal tissues was investigated via the Human Protein Atlas (HPA; www.proteinatlas.org) database, which is an online tool allowing users to analyze protein levels in clinical samples.
Identification of small molecules
CMap (http://www.broadinstitute.org/cmap/) was used to predict potential small molecules that may dampen or even reverse the existing biological status of GBM regarding its particular gene expression signature. 23 We compared the DEGs in our study with those that contribute to small active molecular interference in the CMap database to discover potentially correlated small molecules. The overlapping DEGs were initially allocated as downregulated and upregulated groups, and probe sets from each with significant differential expression were then designated for Gene Set Enrichment Analysis. The scores signified a high to low similarity amongst the compared genes, ranging correspondingly from −1 to +1, such that a positive value approaching +1 denoted the small molecules that were predicted to induce a GBM-like cell state, while a negative score nearing −1 implied that the small molecule reversed the GBM-like state of gene expression.
Results
Identification of DEGs in GBM
A Limma package analysis mined 220 overlapping DEGs in GBM samples from the GSE4290, GSE12657, GSE15824, and GSE68848 GEO datasets. Figure 2a presents the volcano plot, and Figure 2b the Venn diagrams for these DEGs.
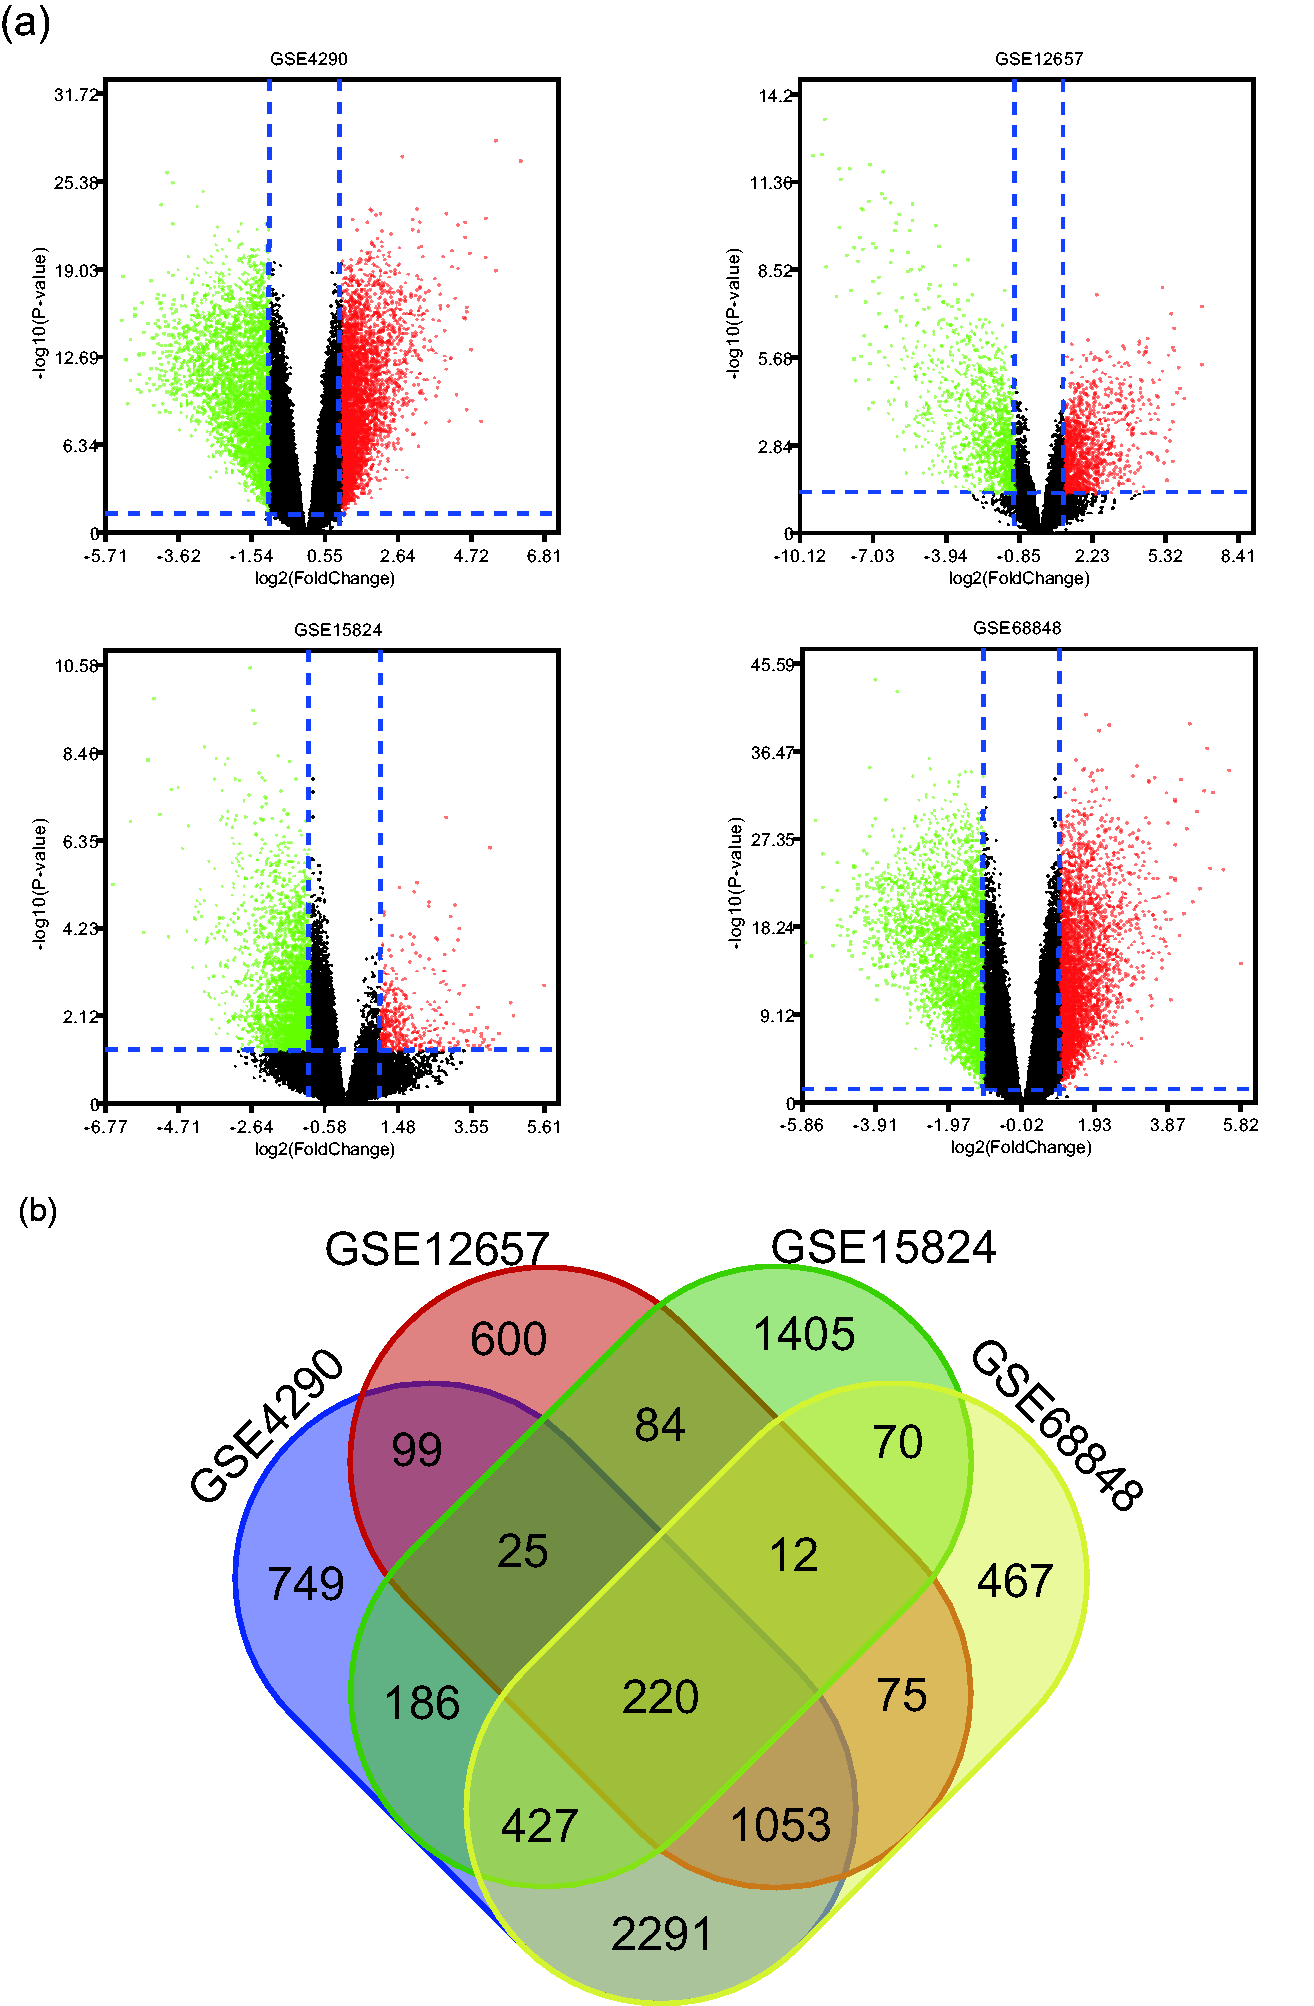
(a) Volcano plot of gene expression profile data between GBM and normal tissues in each dataset. Red dots: significantly upregulated genes in GBM; green dots: significantly downregulated genes in GBM; black dots: non-DEGs. P<0.05 and |log2 FC|>1 were considered significant. (b) Venn diagram of the 220 overlapping DEGs from the GSE4290, GSE12657, GSE15824, and GSE68848 datasets.
Enrichment analyses
The biological functions of the identified DEGs were explored via functional and pathway enrichment analyses, using DAVID. GO analysis showed significant enrichment of up- and down-regulated DEGs in immune, inflammatory, and wound responses, as well as in antigen processing and the expression of peptide antigen. Cell component analysis revealed that these DEGs were specifically active in the plasma membrane compartment, major histocompatibility complex (MHC) protein complex, neuron projections, and cell fraction. Likewise, the molecular functions of the DEGs were significantly enriched in purine nucleotide, ribonucleotide, purine ribonucleotide, lipopolysaccharide, and glycosaminoglycan binding. Furthermore, KEGG pathway analysis suggested that these DEGs were also significantly enriched for cell adhesion molecules, type I diabetes mellitus, focal adhesion, allograft rejection, and graft-versus-host disease (Figure 3, Table 1).

Functional and signaling pathway analysis of the overlapping DEGs in GBM. (a) Biological processes. (b) Cellular components. (c) Molecular function. (d) KEGG pathways. DEG, differentially expressed gene; GBM, glioblastoma multiforme; KEGG, Kyoto Encyclopedia of Genes and Genomes.
Functional and pathway enrichment analysis of overlapping DEGs.

DEG, differentially expressed gene; MHC, major histocompatibility complex.
PPI network construction and module analysis
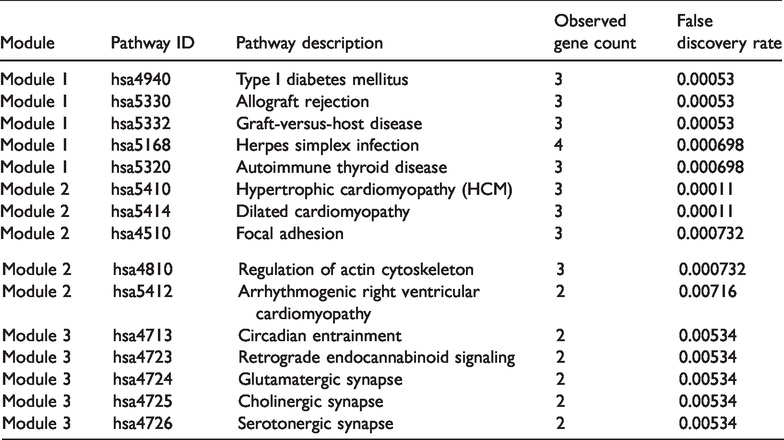
Using Cytoscape, a STRING database was used to establish a PPI network of these DEGs, with 140 nodes and 343 interactions (Figure 4). The three most significant modules were extracted by MCODE (Figure 5). The signaling pathway enrichment analysis suggested the existence of significantly enriched genes of module 1 in type I diabetes mellitus, allograft rejection, and graft-versus-host disease (Figure 5a), of module 2 in hypertrophic cardiomyopathy, dilated cardiomyopathy, and focal adhesion (Figure 5b), and of module 3 in circadian entrainment, retrograde endocannabinoid signaling, and glutamatergic synapse (Figure 5c, Table 2). Hierarchical clustering suggested these module genes could essentially discern GBM and noncancerous tissues (Figure 6a). Biological process analysis revealed that module genes were significantly correlated with cell division site, cell division site part, and actomyosin contractile ring (Figure 6b). Table 3 lists the full names and functions of all hub genes. ITGB5 and RGS4 were selected for further analysis because of their high degree of connectivity.

The constructed protein–protein interaction (PPI) network.

The top three most significant modules extracted from the PPI network and the KEGG pathway analysis of the module genes.
Functional and pathway enrichment analyses of genes in the most significant modules.

(a) Heatmap of module genes between GBM and normal samples. (b) The biological processes of module genes as analyzed by BiNGO. The color depth of nodes represents the corrected P-value; node size represents the number of genes involved.
The full name and functional roles of eight hub genes.

Analysis and validation of hub genes
The HPA and cBioPortal for Cancer Genomics databases facilitated further analysis, which validated the correlation of hub gene expression with the clinical aspects of GBM. Figure 7a shows the median expression of ITGB5 and RGS4 in normal and tumor samples from BodyMap. GEPIA database mining also established the significant differential expression of ITGB5 and RGS4 in GBM versus normal tissues. These findings corroborated that expression levels of these hub genes were closely related to GBM onset (Figure 7b).

(a) Median expression of ITGB5 and RGS4 in tumor and normal samples in BodyMap. (b&c) The expression levels of ITGB5 and RGS4 and their prognostic value according to the GEPIA database. (d) Representative immunohistochemistry results revealing the protein levels of ITGB5 in GBM and normal tissues. (e) The network of module genes and their co-expressed genes constructed by cBioPortal. Nodes with thick outline: hub genes; nodes with thin outline: co-expressed genes.
The GEPIA database had 162 GBM patients for OS analysis, and these were divided into high- and low-expression groups. This demonstrated that ITGB5 upregulation and RGS4 downregulation were significantly correlated with poorer OS in GBM patients (Figure 7c), and that the expression levels of ITGB5 and RGS4 could collectively serve as prognostic biomarkers to predict survival in GBM patients. However, because gene expression is not always consistent with protein levels, 24 we further analyzed the protein levels of hub genes in clinical GBM tissues. Immunohistochemical staining results from the HPA database suggested considerably higher ITGB5 positivity in cancer tissues relative to adjacent normal tissues (Figure 7d). The cBioPortal online platform facilitated construction of a network for this module and gene co-expression (Figure 7e).
We further explored molecular mechanisms of these hub genes in GBM by predicting transcription factors that could regulate their expression (Figure 8a), thereby also constructing a regulatory long non-coding (lnc)RNA, micro (mi)RNA, and mRNA network via Gene-Cloud Biotechnology Information analysis (Figure 8b).

(a) The transcription factors that could be involved in regulating the expression of ITGB5 and RGS4. (b) A regulatory network of lncRNAs, miRNAs, and mRNAs constructed by GCBI. Purple nodes: related lncRNAs; blue nodes: targeted miRNAs. (c) Pop plot of the top 20 identified small molecules that could reverse the gene expression of GBM.
Identification of potentially active small molecules
Gene Set Enrichment Analysis of up- and downregulated DEGs was uploaded to the CMap database to screen for candidate small molecules that could potentially serve as therapeutic drugs for GBM. This primarily aimed to discover small molecules that could reverse the altered gene expression in GBM. Table 4 and Figure 8c list the 20 most significant small molecules along with their enrichment scores and p values; amongst these, Prestwick-1080 (enrichment score: −0.906) and verteporfin (enrichment score: −0.903) had highly significant negative scores (P = 0.00014 and 0.00176, respectively), suggesting they could restore the normal cell state.
Top 20 significant small molecule drugs that can reverse the tumoral status of GBM.

GBM, glioblastoma multiforme.
Ethics
This research was based on GEO database and bioinformatics analysis. No human and animal studies were conducted.
Discussion
The recently developed high-throughput sequencing technologies instill hope, as they can uncover vital genetic and epigenetic changes that accompany tumor initiation and progression. Integrated bioinformatics analysis plays a vital role in screening DEGs, hub node discovery from PPI networks, and prognostic analysis. This technology has been widely used to identify potential novel biomarkers related to tumor diagnosis, prognosis, and treatment.25–27 The present study aimed to uncover novel diagnostic and prognostic biomarkers, as well as targeted therapies for GBM. We integrated four microarray datasets from the GEO database to detect DEGs between GBM and adjacent normal tissues. Additionally, we identified candidate small molecules that could reverse the tumoral status of GBM, providing new directions and molecular mechanisms for the development of new anti-GBM drugs.
A total of 202 overlapping DEGs were identified that could be significantly associated with the occurrence and progression of GBM, suggesting they could be used as potential biomarkers for GBM diagnosis, prognosis, and treatment. We performed a GO enrichment analysis of these overlapping DEGs with regard to biological process, molecular function, and cellular component to reveal the potential molecular mechanisms underlying GBM pathogenesis. Immune response, antigen processing and presentation, and inflammatory response were the top three major functions among the biological processes. Molecular function enrichment for the DEGs was primarily within purine nucleotide binding, ribonucleotide binding, and purine ribonucleotide binding. Changes in cell components were mainly associated with the plasma membrane and MHC protein complex. Additionally, the overlapping DEGs were enriched in five KEGG pathways, including cell adhesion molecules, type I diabetes mellitus, focal adhesion, and allograft rejection.
A wide variety of cell adhesion molecules are involved in the intercellular and cell–extracellular matrix interactions of tumors. Some adhesion molecules play a vital role in tumor recurrence, metastasis, and invasion. For example, the high expression of focal adhesion kinase (FAK) has been reported to be associated with increased fibrosis and poor infiltration of CD8+ T cells, while inhibiting FAK can significantly limit tumor progression and prolong the OS of patients.28,29 Our bioinformatics findings were consistent with this. The PPI network among the overlapping DEGs revealed the top three most significant network modules. ITGB5 and RGS4 had a high degree of connectivity, and thus were selected as hub genes. To validate these results, we used the GEPIA database to determine their expression levels and prognostic value in GBM patients. Mining the GEPIA database confirmed the same trend found in the GEO database, with ITGB5 and RGS4 expression having a significant impact on the prognosis of GBM patients. High ITGB5 expression was significantly correlated with a worse OS in GBM patients, while low RGS4 expression indicated a better OS in GBM patients.
Immunohistochemical staining results from the HPA database were consistent with sequencing data, further supporting our findings. No studies have yet reported a role for these two key genes in the initiation or progression of GBM, and ours is the first to reveal their diagnostic, prognostic, and therapeutic value. To further explore the potential mechanism of ITGB5 and RGS4 in the pathogenesis of GBM and enhance our understanding of this multi-gene hereditary disease, we predicted potential transcription factors that could be involved in the regulation of their expression and constructed a molecular regulatory network of lncRNAs, miRNAs, and mRNAs. ITGB5 overexpression was previously shown to abolish the inhibition of glycolysis, growth, and proliferation induced by cisplatin in breast and cervical cancer cells, 30 while the absence of RGS4 in pediatric nephroblastoma tissue correlates with poor prognosis. Moreover, pristimerin upregulated RGS4 expression, thereby suppressing lamellipodia formation and invasion in breast cancer cells. 31 The exact mechanisms of ITGB5 and RGS4 in GBM initiation and progression should be investigated in future studies.
Based on the overlapping DEGs and the CMap database, we identified a set of potential small molecules that could reverse the cellular status of GBM. Candidate small molecules with highly significant negative enrichment values may reverse the abnormal gene expression induced by GBM, thereby offering a fresh perspective to advance future targeted therapies. Prestwick-1080 (enrichment score: −0.906) was the most significant small molecule related to the status of GBM cells, but it has not been investigated for its efficacy or safety in any cancer type. However, a recent study reported that verteporfin (enrichment score: −0.903) selectively kills hypoxic glioma cells by iron binding. 32 Nevertheless, studies to validate their application in GBM pathogenesis are needed to further our understanding of therapeutic mechanisms from the perspective of DEGs induced by GBM.
By mining the gene expression profiles of GBM and performing a comprehensive bioinformatics analysis, we uncovered two key genes that could contribute to understanding the molecular mechanism of GBM initiation and progression. ITGB5 and RGS4 may serve as novel biomarkers for the diagnosis, prognosis, and treatment of GBM, and a series of detailed analyses further confirmed their vital roles in GBM pathogenesis. We additionally identified a group of candidate small molecules that could offer new insights into the molecular mechanisms of GBM and help develop new targeted therapies. In summary, we uncovered several promising novel biomarkers for GBM that provide new insights into the altered disease biology.
Footnotes
Author contributions
QFW, LQ, and CZH analyzed the data. LXJ and QFW wrote the article. All authors read and approved the final manuscript.
Acknowledgments
Declaration of conflicting interest
The authors declare that there is no conflict of interest.
Funding
This study was funded by the Training Program of Innovation and Entrepreneurship for College Students in Jiangsu (Nos. 201913993001Y and 201913993021H), the Focal Point Research Program of Taicang (TC2017SFYL07) and the Suzhou Health Talent Youth Training Program (GSWS2019079).